Administración de suplementos de vitamina D para las hepatopatías crónicas en adultos
Referencias
Referencias de los estudios incluidos en esta revisión
Referencias de los estudios excluidos de esta revisión
Referencias de los estudios en curso
Referencias adicionales
Referencias de otras versiones publicadas de esta revisión
Characteristics of studies
Characteristics of included studies [ordered by study ID]
| Methods | Randomised clinical trial with parallel group design (2 groups). | |
| Participants | 72 participants (44% women), aged 18 to 65 years, mean age 47 years, with chronic HCV genotype 1. Inclusion criteria: aged 18 to 65 years; chronic HCV genotype 1 infection; no previous treatment for HCV; seronegative for HBV, HDV, and HIV infections; absolute neutrophil count > 1500/mm3; platelet count > 90,000/mm3; and normal haemoglobin level. Exclusion criteria: decompensated liver disease (cirrhosis with a Child‐Pugh score > 9), another cause of clinically significant liver disease, or presence of hepatocellular carcinoma. | |
| Interventions | Intervention: PEG‐IFN‐α‐2b (1.5 μg/kg body weight) + oral ribavirin 1000 mg/day (for body weight < 75 kg) or 1200 mg/day (for body weight > 75 kg) and vitamin D3 2000 IU/day (n = 36). Control: PEG‐IFN‐α‐2b (1.5 μg/kg body weight) + oral ribavirin 1000 mg/day (for body weight < 75 kg) or 1200 mg/day (for body weight > 75 kg) (n = 36). For 48 weeks. All participants had ≥ 1 follow‐up visit at 24 weeks after completion of treatment. | |
| Outcomes | Outcomes reported in abstract of publication. Primary outcome: SVR defined as undetectable HCV‐RNA at 24 weeks' post‐treatment. Secondary outcomes: treatment efficacy at weeks 4 (RVR), and 12 (EVR) during therapy, and 24 weeks after cessation of therapy (SVR). | |
| Stated aim of study | To determine whether adding vitamin D improves HCV response to antiviral therapy. | |
| Notes | No participant discontinued treatment. Vitamin D3 (Vitamidyne D, Fischer Pharmaceuticals, Israel) given by oral drops for 4 weeks before initiation of antiviral treatment and after serum levels reached > 32 ng/mL in all participants in the treatment group. Registered at clinicaltrials.gov NCT00804752. Additional information received through personal communication with authors on 8 February 2017. | |
| Risk of bias | ||
| Bias | Authors' judgement | Support for judgement |
| Random sequence generation (selection bias) | Low risk | Sequence generation performed using computer random number generation. |
| Allocation concealment (selection bias) | Low risk | Participant allocations could not have been foreseen in advance of, or during, enrolment. Allocation sequence hidden in sequentially numbered, opaque, and sealed envelopes. |
| Blinding of participants and personnel (performance bias) | High risk | No blinding, and assessment of outcomes likely to be influenced by lack of blinding. |
| Blinding of outcome assessment (detection bias) | High risk | No blinding, and assessment of outcomes likely to be influenced by lack of blinding. |
| Incomplete outcome data (attrition bias) | Low risk | Missing data unlikely to make treatment effects depart from plausible values. |
| Selective reporting (reporting bias) | Low risk | All predefined outcomes reported fully. |
| For‐profit bias | Unclear risk | Trial may or may not have been free of for‐profit bias as no information on clinical trial support or sponsorship provided. |
| Other bias | Low risk | Trial appeared free of other factors that could put it at risk of bias. |
| Methods | Open‐label randomised clinical trial with parallel group design (two groups) | |
| Participants | Number of participants randomised: 115 patients (50% women), aged 31 to 82 years, mean age 64 years, with chronic hepatitis C. Inclusion criteria: HCV genotype 1b as determined by the conventional polymerase chain reaction (PCR)‐based method; IL28B SNP rs8099917 genotype TG or GG (designated as non‐TT); HCV RNA persistently detectable in serum by the real‐time PCR technique; white blood cell count of more than 2000/μ; platelet count of more than 50 000/μL; and haemoglobin levels of more than 9.0 g/dL at the time of enrolment. Patients could participate in the study regardless of whether they had received prior IFN‐based therapy. When patients had not received PEG IFN/ribavirin combination therapy, they were considered as naive patients. Exclusion criteria: Decompensated liver cirrhosis, evidence of other forms of liver disease, presence of malignancy and other serious medical illness, evidence of hypercalcaemia or hyperparathyroidism, positive hepatitis B surface antigen and antibody to HIV type 1, medication with Chinese herbal medicine or other type of vitamin D, past medical history of interstitial pneumonia, pregnancy or possibility of pregnancy, lactating, and past medical history of allergy to biological preparations or antiviral agents. | |
| Interventions | Intervention: lead‐in treatment with oral native vitamin D3 (Healthy Natural Products, Florence, KY, USA) at a dose of 2000 IU once daily for 4 weeks, followed by the addition of the vitamin D3 to the 12‐week triple therapy (PEG IFN‐α‐2a (Roche group‐Chugai, Tokyo, Japan), ribavirin (Chugai) and simeprevir (Janssen, Tokyo, Japan)), followed by 12 weeks of PEG IFN‐ α‐2a and ribavirin (n = 57); Control: 12‐week triple therapy (PEG IFN‐α‐2a (Roche group‐Chugai, Tokyo, Japan), ribavirin (Chugai) and simeprevir (Janssen, Tokyo, Japan)) for 12 weeks, followed by 12 weeks of PEG IFN‐ α‐2a and ribavirin (n = 58). PEG IFN‐α‐2a was administrated subcutaneously at a dose of 180 μg once weekly. Ribavirin was administrated orally twice daily, with doses adjusted according to bodyweight (600 mg daily for <60 kg, 800 mg daily for 60–80 kg and 1000 mg daily for >80 kg). Simeprevir was administrated orally once daily at a dose of 100 mg. Because of the low likelihood of achieving an SVR and high likelihood of developing antiviral resistance, treatment was stopped for patients with serum HCV RNA decline from baseline of less than 3 log IU/mL at 4 weeks of treatment, detectable HCV RNA at 12 weeks of treatment or more than 2 log IU/mL increase in HCV RNA levels from the lowest levels during treatment (defined as viral breakthrough). | |
| Outcomes | Primary outcome: sustainability undetectable viraemia 24 weeks after the end of treatment. | |
| Stated aim of study | To clarify whether native vitamin D3 supplementation could improve SVR rate in PEG‐IFN/ribavirin therapy with simeprevir for people with treatment‐refractory genotype 1b HCV with the IL28B SNP rs8099917 non‐TT. | |
| Notes | ||
| Risk of bias | ||
| Bias | Authors' judgement | Support for judgement |
| Random sequence generation (selection bias) | Low risk | Used computer‐generated random number table. |
| Allocation concealment (selection bias) | Unclear risk | Method used to conceal the allocation not described so intervention allocations may have been foreseen before, or during, enrolment. |
| Blinding of participants and personnel (performance bias) | High risk | No blinding, and outcome likely to be influenced by lack of blinding. |
| Blinding of outcome assessment (detection bias) | Unclear risk | No blinding, and outcome measurement likely to be influenced by lack of blinding. |
| Incomplete outcome data (attrition bias) | Unclear risk | Insufficient information to assess whether missing data in combination with method used to handle missing data were likely to induce bias. |
| Selective reporting (reporting bias) | Unclear risk | Unclear whether all predefined and clinically relevant and reasonably expected outcomes reported. |
| For‐profit bias | Unclear risk | Trial may or may not be free of for‐profit bias as no information provided on clinical trial support or sponsorship. |
| Other bias | Low risk | Trial appeared free of other factors that could put it at risk of bias. |
| Methods | Randomised clinical trial with parallel group design (2 groups). | |
| Participants | 65participants (35% women), mean age 59 years, with NAFLD. Inclusion criteria: men or women aged 25 to 70 years; diagnosis of type 2 diabetes according to American Diabetes Association 2009 criteria; presence of fatty liver detected by upper US and confirmed by MRI in people with clinical suspicion of NAFLD (increased serum transaminase levels in absence of known hepatic chronic disease, ALT > AST, presence of multiple components of metabolic syndrome); negative tests for hepatitis B surface antigen and antibody to HCV. Exclusion criteria: history of alcohol abuse (defined by mean daily consumption of alcohol > 30 g/day in men and > 20 g/day in women), cirrhosis, autoimmune hepatitis and other causes of liver disease (haemochromatosis, Wilson's disease), chronic enteropathies, advanced renal failure, cancer, hyper/hypoparathyroidism, known hypersensitivity to cholecalciferol or any other excipients, hypercalcaemia, hypercalciuria, nephrolithiasis, nephrocalcinosis; ongoing/recent (previous 6 months) supplementation with vitamin D, calcium, multivitamin products; treatment with agents affecting bone and calcium/vitamin D metabolism (anticonvulsants, glucocorticoids, antacids containing aluminium, cholestyramine); ultraviolet radiation exposure; pregnancy and lactation; or severe psychiatric illnesses. | |
| Interventions | Intervention: vitamin D3 2000 IU/day (n = 29). Control: placebo (n = 36). For 24 weeks. | |
| Outcomes | Primary outcomes: reduction of hepatic fat fraction measured by MRI, changes in serum transaminases, CK18‐M30, N‐terminal procollagen III propeptide levels, and Fatty Liver Index. Secondary outcomes: metabolic (fasting glycaemia, haemoglobin A1c, lipids, Homeostasis Model Assessment ‐ Insulin Resistance, Homeostasis Model Assessment ‐ beta cell function, adipose tissue insulin resistance, body fat distribution) and cardiovascular (ankle‐brachial index, intima‐media thickness, flow‐mediated dilatation) parameters. | |
| Stated aim of study | To assess the efficacy and safety of 24‐week oral high‐dose vitamin D supplementation in people with type 2 diabetes and NAFLD. | |
| Notes | Registered at www.clinicaltrialsregister.eu (number 2011‐003010‐17). Funded by research grants from the Sapienza University Ateneo Scientific Research (authors MGC and IB) and the Italian Minister of University and Research (authors MGC and MGB). | |
| Risk of bias | ||
| Bias | Authors' judgement | Support for judgement |
| Random sequence generation (selection bias) | Low risk | Randomisation performed by statistician using computer‐generated and centrally administered procedure. |
| Allocation concealment (selection bias) | Low risk | Participant allocations could not have been foreseen in advance of, or during, enrolment. Used central and independent randomisation unit controlled allocation. |
| Blinding of participants and personnel (performance bias) | Low risk | Participants, investigators, clinical site staff, laboratory staff, and radiologists all masked to treatment assignment throughout study. Treatment and placebo provided in identical vials by an experienced independent pharmacist. |
| Blinding of outcome assessment (detection bias) | Low risk | Blinding of outcome assessment ensured, and unlikely that blinding could have been broken. |
| Incomplete outcome data (attrition bias) | Unclear risk | Insufficient information to assess whether missing data in combination with method used to handle missing data were likely to introduce bias on the results. |
| Selective reporting (reporting bias) | Low risk | Study authors reported all predefined outcomes fully. |
| For‐profit bias | Low risk | Trial appeared free of industry sponsorship or other type of for‐profit support that could manipulate trial design, conductance, or trial results. |
| Other bias | Low risk | Trial appeared free of other factors that could put it at risk of bias. |
| Methods | Randomised clinical trial with parallel group design (2 groups). | |
| Participants | 101 participants (25% women) aged 18 to 60 years, mean age 40 years, with chronic HCV genotype 4. Inclusion criteria: aged 18 to 60 years, chronic HCV infection genotype 4 for > 6 months by detectable serum quantitative HCV‐RNA, naive to treatment, compensated liver disease with the following minimum haematological and biochemical criteria (haemoglobin ≥ 12 g/dL for men and ≥ 11 g/dL for women, WBC > 3500/mm3, granulocyte count > 1500/mm3, platelet count > 75,000/mm3, albumin and thyroid function tests within normal limit, and antinuclear antibody ≤ 1:80). US‐guided liver biopsy within 12 months prior to study entry, using a semiautomatic true‐cut needle (16G). Exclusion criteria: other liver diseases, decompensated liver cirrhosis, hepatocellular carcinoma, liver biopsy contraindication, unsuitable for combined IFN and ribavirin treatment due to persistent haematological abnormalities, receiving medications known to affect vitamin D3 level or metabolism (calcium, vitamin D supplementation, oestrogen, alendronate, isoniazid, thiazide diuretics, long‐term antacids, calcium channel blockers, cholestyramine, anticonvulsants, and orlistat), clinically evident osteomalacia (waddling gait, bone pain, and pathological fractures), renal diseases or parathyroid diseases, and BMI > 35. | |
| Interventions | Intervention: vitamin D3 15,000 IU/week + PEG‐IFN‐α‐2b + ribavirin (n = 50). Control: placebo + PEG‐IFN‐α‐2b + ribavirin (n = 51). PEG‐IFN‐α‐2b (Peg‐Intron‐MSD) at 1.5 mg/kg subcutaneous injection once/week. Ribavirin (Rebetol, MSD) dose determined by body weight (< 75 kg = 1000 mg/day; ≥ 75 kg = 1200 mg/day in 2 separate oral doses after meals morning and night) for 48 weeks. Vitamin D3 given as oral solution with juice once weekly for 48 weeks. | |
| Outcomes | Primary outcome: SVR. Secondary outcome: stage of hepatic fibrosis. | |
| Stated aim of study | To assess role of vitamin D supplementation on response to treatment in people with chronic HCV 4 and its possible relation to stage of hepatic fibrosis. | |
| Notes | Additional information received through personal communication with authors on 23 January 2017. | |
| Risk of bias | ||
| Bias | Authors' judgement | Support for judgement |
| Random sequence generation (selection bias) | Unclear risk | Method of sequence generation not specified. |
| Allocation concealment (selection bias) | Low risk | Allocation sequence hidden in sequentially numbered, opaque, and sealed envelopes. |
| Blinding of participants and personnel (performance bias) | Low risk | No blinding, but we judged that outcomes were not likely to be influenced by lack of blinding. |
| Blinding of outcome assessment (detection bias) | Low risk | No blinding of outcome assessment, but we judged that outcome measurements were not likely to be influenced by lack of blinding. |
| Incomplete outcome data (attrition bias) | Unclear risk | Insufficient information to assess whether missing data in combination with the method used to handle missing data were likely to induce bias. |
| Selective reporting (reporting bias) | Unclear risk | Unclear whether all predefined and clinically relevant and reasonably expected outcomes reported. |
| For‐profit bias | Unclear risk | Trial may or may not have been free of for‐profit bias as trial did not provide any information on clinical trial support or sponsorship. |
| Other bias | Low risk | Trial appeared free of other factors that could put it at risk of bias. |
| Methods | Randomised clinical trial with parallel group design (2 groups). | |
| Participants | 60 participants (52% women), aged 30 to 70 years, mean age 48.5 years with NAFLD. Inclusion criteria: NAFLD confirmed by US and normal range of ALT and AST (< 31 IU/L). Exclusion criteria: acute illnesses, chronic kidney disease, hyperparathyroidism, hypoparathyroidism, chronic heart failure, HCV or HBV, Wilson's syndrome, history of chronic liver diseases or disorders that affect gallbladder and bile ducts, pregnancy, history of taking any drugs affecting levels of ALT (e.g. valproic acid, tamoxifen, 3‐hydroxy‐3‐methylglutaryl‐coenzyme A reductase inhibitors, metformin, angiotensin converting enzyme 1 and angiotensin‐converting enzyme‐related 1). Furthermore, participants should not have followed any special diet, and not take oral vitamin D, calcium, or multivitamin supplements. | |
| Interventions | Intervention: vitamin D3 50,000 IU (n = 30). Control: placebo (n = 30). Weekly for 10 weeks. | |
| Outcomes | Primary outcomes: inflammatory markers, liver function, lipid profile, body composition, and liver steatosis. Secondary outcomes: none stated. | |
| Stated aim of study | To investigate effect of vitamin D supplementation on inflammation, liver function, and liver steatosis in people with NAFLD. | |
| Notes | Clinical trial registered at Iranian Registry of Clinical Trials (www.irct.ir) IRCT number: IRCT2013060411763N8. Funded by Food Security Research Center and Department of Community Nutrition, School of Nutrition and Food Sciences, Isfahan University of Medical Sciences, Isfahan, Iran. | |
| Risk of bias | ||
| Bias | Authors' judgement | Support for judgement |
| Random sequence generation (selection bias) | Low risk | Used computer‐generated random numbers. |
| Allocation concealment (selection bias) | Unclear risk | Method used to conceal the allocation not described so intervention allocations may have been foreseen before, or during, enrolment. |
| Blinding of participants and personnel (performance bias) | Unclear risk | Insufficient information to permit judgement of 'low risk' or 'high risk'. |
| Blinding of outcome assessment (detection bias) | Unclear risk | Insufficient information to permit judgement of 'low risk' or 'high risk'. |
| Incomplete outcome data (attrition bias) | Low risk | Missing data unlikely to make treatment effects depart from plausible values. |
| Selective reporting (reporting bias) | Low risk | All predefined outcomes reported fully. |
| For‐profit bias | Low risk | Trial appeared to be free of industry sponsorship or other type of for‐profit support that could manipulate the trial design, conductance, or trial results. |
| Other bias | Unclear risk | Trial may or may not have been free of other factors that could put it at risk of bias. |
| Methods | Randomised clinical trial with parallel group design (3 groups). | |
| Participants | 120 participants (38% women), aged 18 to 65 years, mean age 41 years, with NAFLD. Inclusion criteria: BMI 25 kg/m2 to 35 kg/m2, serum 25‐hydroxyvitamin D3 level < 15 ng/mL, reporting a daily calcium intake 700 mg/day to 800 mg/day, and willingness to introduce a dietary change to lose weight. Exclusion criteria: calcium intake < 700 mg/day or > 800 mg/day (in diet or as a supplement); drugs for blood glucose or lipid control; pregnancy or having given birth in the past year or planning a pregnancy in the next 6 months; lactation; weight loss ≥ 10% of body weight within the 6 months before enrolment; participation in competitive sport; abnormal thyroid hormone concentration; intake of medications that could affect body weight or energy expenditure (or both); allergy; smoking; diagnosis of chronic diseases including inflammatory diseases; heart, liver, and renal failure; cancer; acute myocardial infarction; diabetes; stroke; or serious injuries and any other conditions that were not suitable for the trial as evaluated by the physician. | |
| Interventions | Intervention 1: vitamin D 25 μg/day as calcitriol (Jalinus Arya Co., Iran) + calcium carbonate placebo (25 mg/day as lactose; Jalinus Arya Co, Iran) (n = 37). Intervention 2: vitamin D 25 μg/day as calcitriol (Jalinus Arya Co., Iran) + calcium (500 mg/day as calcium carbonate; Jalinus Arya Co., Iran) (n = 37). Control: placebo of calcitriol + placebo of calcium (25 mg/day as lactose; Jalinus Arya Co., Iran) (n = 36). After lunch with a glass of water for 12 weeks. | |
| Outcomes | Primary outcomes: weight loss, body fat, fasting plasma glucose, serum insulin concentrations, lipid profiles, and liver function tests. Secondary outcomes: carbohydrate and lipid metabolism. | |
| Stated aim of study | To compare effect of vitamin D supplementation with and without calcium on anthropometric measures and biochemical parameters in people with NAFLD during a weight‐loss programme. | |
| Notes | Clinical trial registered at Iranian Registry of Clinical Trials (www.irct.ir) IRCT registration number: IRCT201408312709N29. Trial did not receive any specific grant from funding agencies in the public, commercial, or not‐for‐profit sectors. Additional information received through personal communication with authors on 20 January 2017. | |
| Risk of bias | ||
| Bias | Authors' judgement | Support for judgement |
| Random sequence generation (selection bias) | Low risk | Participants randomly assigned using computer‐generated random‐numbers method by project co‐ordinator. |
| Allocation concealment (selection bias) | Low risk | Participant allocations could not have been foreseen in advance of, or during, enrolment. Allocation controlled by a central and independent randomisation unit. |
| Blinding of participants and personnel (performance bias) | Low risk | Products administered by blinded research assistant to blinded participants. Shape, colour, and packaging of placebo similar to supplements in the intervention group. |
| Blinding of outcome assessment (detection bias) | Unclear risk | Insufficient information to assess whether missing data in combination with method used to handle missing data were likely to induce bias. |
| Incomplete outcome data (attrition bias) | Low risk | Missing data were unlikely to make treatment effects depart from plausible values. |
| Selective reporting (reporting bias) | Low risk | All predefined outcomes reported fully. |
| For‐profit bias | Unclear risk | Trial may or may not have been free of for‐profit bias as no information provided on clinical trial support or sponsorship. |
| Other bias | Unclear risk | Trial may or may not have been free of other factors that could put it at risk of bias. |
| Methods | Randomised clinical trial with parallel group design (3 groups). | |
| Participants | 18 men, aged 32 to 61 years, mean age 52 years, with alcoholic cirrhosis. Inclusion criteria: men with advanced biopsy‐confirmed alcoholic cirrhosis with low levels of serum 25‐hydroxyvitamin D (< 20 ng/mL) and decreased bone density (i.e. > 1.5 standard deviations below mean of healthy Baltimore men of same ages). Exclusion criteria: history of corticosteroid, anticonvulsant, or vitamin D intake; renal disease. | |
| Interventions | Intervention 1: vitamin D2 50,000 IU 2 or 3 times weekly (n = 6). Intervention 2: 25‐hydroxyvitamin D3 800 IU/day to 2000 IU/day (prepared and supplied as identical soft elastic capsules (20 or 50 μg) by Upjohn Co.) (n = 6). Control: no intervention (n = 6). For 1 year. | |
| Outcomes | Outcomes reported in abstract of publication. Primary outcomes: bone mineral density. Secondary outcomes: none stated. | |
| Stated aim of study | To compare the efficacy of 25‐hydroxyvitamin D3 or vitamin D2 in correcting the bone disease of people with alcoholic cirrhosis. | |
| Notes | This study was supported by grants from Upjohn Co. and the Veterans Administration. | |
| Risk of bias | ||
| Bias | Authors' judgement | Support for judgement |
| Random sequence generation (selection bias) | Unclear risk | The method of sequence generation was not specified. |
| Allocation concealment (selection bias) | Unclear risk | The method used to conceal the allocation was not described so that intervention allocations may have been foreseen in advance of, or during, enrolment. |
| Blinding of participants and personnel (performance bias) | High risk | No blinding, and the outcome was likely to be influenced by lack of blinding. |
| Blinding of outcome assessment (detection bias) | High risk | No blinding of outcome assessment, and the outcome measurement is likely to be influenced by lack of blinding. |
| Incomplete outcome data (attrition bias) | Low risk | Missing data were unlikely to make treatment effects depart from plausible values. |
| Selective reporting (reporting bias) | Low risk | All clinically relevant and reasonably expected outcomes were reported. |
| For‐profit bias | High risk | The trial is sponsored by the industry. |
| Other bias | Low risk | The trial appeared to be free of other factors that could put it at risk of bias. |
| Methods | Randomised clinical trial with parallel group design (2 groups). | |
| Participants | 50 participants (58% women), mean age 47 years, with chronic HCV genotype 2 or 3. Inclusion criteria: aged 18 to 65 years; chronic genotype 2 or 3 HCV infection; no previous treatment for HCV; seronegative for HBV, hepatitis A virus, and HIV infection; absolute neutrophil count > 1500/mm3; platelet count > 90,000/mm3; and normal haemoglobin level. Liver biopsies not required prior to study entrance. Exclusion criteria: decompensated liver disease (cirrhosis with Child‐Pugh score > 9), another cause of clinically significant liver disease, or presence of hepatocellular carcinoma. | |
| Interventions | Intervention: PEG‐IFN‐α‐2a 180 μg weekly + oral ribavirin 800 mg/day + oral vitamin D3 2000 IU/day (Vitamidyne D, Fischer Pharmaceuticals, Israel), given by oral drops (n = 20). Control: PEG‐IFN‐α‐2a 180 μg weekly + oral ribavirin 800 mg/day (n = 30). For 24 weeks. | |
| Outcomes | Outcomes reported in abstract of publication. Primary outcome: SVR defined as undetectable HCV‐RNA at 24 weeks' post‐treatment. Secondary outcomes: treatment efficacy at weeks 4 (RVR), and 12 (EVR) during therapy, and 24 weeks after cessation of therapy (SVR). | |
| Stated aim of study | To assess prospectively influence of vitamin D supplementation on SVR in treatment of people with chronic HCV with HCV genotype 2‐3. | |
| Notes | Additional information received through personal communication with authors on 8 February 2017. | |
| Risk of bias | ||
| Bias | Authors' judgement | Support for judgement |
| Random sequence generation (selection bias) | Low risk | Sequence generation performed using computer random number generation. |
| Allocation concealment (selection bias) | Low risk | Participant allocations could not have been foreseen in advance of, or during, enrolment. Allocation sequence hidden in sequentially numbered, opaque, and sealed envelopes. |
| Blinding of participants and personnel (performance bias) | High risk | No blinding, and outcomes were likely to be influenced by lack of blinding. |
| Blinding of outcome assessment (detection bias) | High risk | No blinding, and outcome measurements were likely to be influenced by lack of blinding. |
| Incomplete outcome data (attrition bias) | Low risk | Missing data unlikely to make treatment effects depart from plausible values. |
| Selective reporting (reporting bias) | Unclear risk | Unclear whether all predefined and clinically relevant and reasonably expected outcomes were reported. |
| For‐profit bias | Unclear risk | Trial may or may not have been free of for‐profit bias as no information on clinical trial support or sponsorship was provided. |
| Other bias | Low risk | Trial appeared to be free of other factors that could put it at risk of bias. |
| Methods | Randomised clinical trial with parallel group design (2 groups). | |
| Participants | 36 participants (25% women), aged 18 to 75 years, mean age 61 years, with liver cirrhosis. Inclusion criteria: compensated cirrhosis, 25‐hydroxyvitamin D < 30 ng/mL, aged 18 to 75 years, and a negative pregnancy test in women of childbearing potential. Exclusion criteria: presence of hepatocellular carcinoma, hypercalcaemia (plasma calcium concentrations > 2.65 mmol/L), pregnant or lactating women, drug intake as part of another clinical study, estimated glomerular filtration rate according to Modification of Diet in Renal Disease formula < 15 mL/minute/1.73 m2, any clinically significant acute disease requiring drug treatment, regular intake (in addition to study medication) of vitamin D > 800 IU daily during the last 4 weeks before study entry. | |
| Interventions | Intervention: vitamin D3 2800 IU/day (Oleovit D3, Fresenius Kabi, Austria) (n = 18). Control: placebo daily (n = 18). For 8 weeks. | |
| Outcomes | Primary outcome: vitamin D status. Secondary outcomes: liver function tests (i.e. AST, ALT, gamma glutamyl transpeptidase, and alkaline phosphatase), albumin, International Normalized Ratio, bilirubin, and hyaluronic acid; and parameters of mineral metabolism (i.e. parathyroid hormone, total plasma calcium, free plasma calcium, urinary midstream calcium to creatinine ratio, and plasma phosphate). | |
| Stated aim of study | To evaluate effects of vitamin D supplementation on 25‐hydroxyvitamin D, parameters of liver function and synthesis, and hyaluronic acid as a marker of liver fibrosis. | |
| Notes | Study sponsored by the Medical University of Graz, Austria. | |
| Risk of bias | ||
| Bias | Authors' judgement | Support for judgement |
| Random sequence generation (selection bias) | Low risk | Sequence generation performed using computer random number generation. |
| Allocation concealment (selection bias) | Low risk | Participant allocations could not have been foreseen in advance of, or during, enrolment. Central and independent randomisation unit controlled allocation. Investigators were unaware of allocation sequence. |
| Blinding of participants and personnel (performance bias) | Low risk | Blinding of participants and key study personnel ensured, and it was unlikely that blinding could have been broken. |
| Blinding of outcome assessment (detection bias) | Low risk | Blinding of outcome assessment ensured, and unlikely that blinding could have been broken. |
| Incomplete outcome data (attrition bias) | Low risk | Missing data were unlikely to make treatment effects depart from plausible values. |
| Selective reporting (reporting bias) | Low risk | All predefined outcomes reported. |
| For‐profit bias | Low risk | Trial appeared to be free of industry sponsorship or other type of for‐profit support that could manipulate the trial design, conductance, or trial results. |
| Other bias | Unclear risk | Trial may or may not have been free of other factors that could put it at risk of bias. |
| Methods | Randomised clinical trial with parallel group design (2 groups). | |
| Participants | 60 (51% women), aged 18 to 70 years, mean age 42 years, with NAFLD. Inclusion criteria: diagnosis of NAFLD by US and increased serum levels of ALT (> 19 U/L for women and 30 U/L for men). Exclusion criteria: alcohol consumption > 20 g/day; pregnant and lactating women; hereditary haemochromatosis; Wilson's disease; α1‐antitrypsin deficiency; history of jejunoileal bypass surgery or gastroplasty; using total parenteral nutrition in the past 6 months; taking hepatotoxic drugs such as calcium channel blocker, high doses of synthetic oestrogens, methotrexate, amiodarone, and chloroquine; history of hypothyroidism, Cushing's syndrome, renal failure, and kidney stones; serum calcium levels > 10.6 mg/dL; and intake of vitamin D, vitamin E, and calcium supplements during the last 6 months. | |
| Interventions | Intervention: vitamin D3 50,000 IU (D‐Vitin Zahravi Pharm Co., Tabriz, Iran) (n = 30). Control: placebo (Zahravi Pharm Co.) (n = 30). Every 14 days for 4 months. | |
| Outcomes | Primary outcomes: changes in serum ALT and changes in insulin resistance index. Secondary outcomes: other liver enzymes, oxidative stress, and inflammatory biomarkers. | |
| Stated aim of study | To determine effect of vitamin D supplementation on serum liver enzymes, insulin resistance, oxidative stress, and inflammatory biomarkers in people with NAFLD. | |
| Notes | Study financially supported by grant (No. RDC‐9105) from Vice‐Chancellor for Research Affairs of Jundishapur University of Medical Sciences and approved by the Research Institute for Infectious Diseases of the Digestive System, Jundishapur University of Medical Sciences, Ahvaz, Iran. | |
| Risk of bias | ||
| Bias | Authors' judgement | Support for judgement |
| Random sequence generation (selection bias) | Low risk | The study authors performed sequence generation using computer random number generation |
| Allocation concealment (selection bias) | Low risk | An investigator with no clinical involvement in the trial packed the supplements and placebos in numbered bottles based on the random list. The other person, who was not involved in the trial and not aware of random sequences, assigned the patients to the numbered bottles of pearls. |
| Blinding of participants and personnel (performance bias) | Low risk | Blinding of participants and key study personnel ensured, and it was unlikely that the blinding could have been broken. |
| Blinding of outcome assessment (detection bias) | Low risk | Blinding of outcome assessment ensured, and unlikely that the blinding could have been broken. |
| Incomplete outcome data (attrition bias) | Low risk | Missing data were unlikely to make treatment effects depart from plausible values. |
| Selective reporting (reporting bias) | Unclear risk | It is unclear whether all predefined and clinically relevant and reasonably expected outcomes were reported. |
| For‐profit bias | Low risk | The trial appeared to be free of industry sponsorship or other type of for‐profit support that could manipulate the trial design, conductance, or trial results. |
| Other bias | Low risk | The trial appeared to be free of other factors that could put it at risk of bias. |
| Methods | Randomised clinical trial with parallel group design (2 groups). | |
| Participants | 76 participants (66% women), aged 38 to 84 years, mean age 61 years, with cirrhosis and an underlying infection of liver (HBV and HCV). Inclusion criteria: liver cirrhosis and an underlying infection of the liver (HBV and HCV). Exclusion criteria: none stated. | |
| Interventions | Intervention: calcitriol 0.5 μg twice daily (n = 38). Control: no intervention (n = 38). For 1 year. | |
| Outcomes | Outcomes reported in abstract of publication. Primary outcome: bone mineral density of the lumbar vertebrae. Secondary outcomes: none stated. | |
| Stated aim of study | To evaluate efficacy of calcitriol (1,25‐dihydroxyvitamin D) in treatment of bone disease associated with cirrhosis and an underlying hepatitis viral infection. | |
| Notes | Additional information received through personal communication with the authors on 12 February 2014. | |
| Risk of bias | ||
| Bias | Authors' judgement | Support for judgement |
| Random sequence generation (selection bias) | Unclear risk | Method of sequence generation not specified. |
| Allocation concealment (selection bias) | Low risk | Allocation sequence hidden in sequentially numbered, opaque, and sealed envelopes. |
| Blinding of participants and personnel (performance bias) | High risk | No blinding, and outcome was likely to be influenced by lack of blinding. |
| Blinding of outcome assessment (detection bias) | High risk | No blinding of outcome assessment, and outcome measurement was likely to be influenced by lack of blinding. |
| Incomplete outcome data (attrition bias) | Low risk | Missing data were unlikely to make treatment effects depart from plausible values. |
| Selective reporting (reporting bias) | High risk | Not all predefined outcomes reported fully. |
| For‐profit bias | Unclear risk | Trial may or may not have been free of for‐profit bias as no information on clinical trial support or sponsorship was provided. |
| Other bias | Unclear risk | Trial may or may not have been free of other components that could put it at risk of bias. |
| Methods | Randomised clinical trial with parallel group design (2 groups). | |
| Participants | 34 women, aged 36 to 72 years, mean age 56 years, with primary biliary cirrhosis. Inclusion criteria: primary biliary cirrhosis. Exclusion criteria: none stated. | |
| Interventions | Intervention: calcitriol 0.5 μg twice a day (n = 17). Control: no intervention (n = 17). For 1 year. | |
| Outcomes | Outcomes reported in abstract of publication. Primary outcome: bone mineral density. Secondary outcomes: none stated. | |
| Stated aim of study | To evaluate efficacy of calcitriol (1,25‐dihydroxyvitamin D) in treatment of bone disease associated with primary biliary cirrhosis. | |
| Notes | Additional information received through personal communication with authors on 12 February 2014. | |
| Risk of bias | ||
| Bias | Authors' judgement | Support for judgement |
| Random sequence generation (selection bias) | Unclear risk | Method of sequence generation not specified. |
| Allocation concealment (selection bias) | Unclear risk | Method used to conceal allocation not described so that intervention allocations may have been foreseen in advance of, or during, enrolment. |
| Blinding of participants and personnel (performance bias) | High risk | No blinding, and outcome was likely to be influenced by lack of blinding. |
| Blinding of outcome assessment (detection bias) | High risk | No blinding of outcome assessment, and outcome measurement was likely to be influenced by lack of blinding. |
| Incomplete outcome data (attrition bias) | Low risk | Missing data were unlikely to make treatment effects depart from plausible values. |
| Selective reporting (reporting bias) | High risk | Not all predefined outcomes reported fully. |
| For‐profit bias | Unclear risk | Trial may or may not have been free of for‐profit bias as no information on clinical trial support or sponsorship was provided. |
| Other bias | Unclear risk | Trial may or may not have been free of other components that could put it at risk of bias. |
| Methods | Randomised clinical trial with parallel group design (2 groups). | |
| Participants | 68 participants (13% women), mean age 42 years, with chronic HCV genotype 1,2,3,4. Inclusion criteria: adult patients with chronic HCV infection (> 6 months) and detectable serum levels of HCV RNA (genotype 1, 2, 3 or 4) with compensated liver disease fulfilling the following criteria of an absolute neutrophil count above 1500 permm3, a platelet count above 90,000 permm3, and a normal haemoglobin level. Exclusion criteria: co‐infection with hepatitis B virus or HIV, decompensated liver disease (Child‐Pugh classification B or C), autoimmune or metabolic liver disease, hepatocellular carcinoma, a history of anti‐HCV therapy or use of medications which alter vitamin D3 levels or metabolism (calcium, vitamin D supplementation, oestrogen, alendronate, isoniazid, anticonvulsants, and orlistat), or a history of diarrhoea or malabsorption syndromes like celiac and chronic pancreatitis or those with renal or parathyroid diseases. | |
| Interventions | Intervention: PEG‐IFN‐α‐2a (180 μg) + oral ribavirin (Rebetol, MSD) dosage determined based on patient’s weight and genotype, was administered for 48 weeks in patients with genotypes 1 and 4 and for 24 weeks in those with genotypes 2 and 3, and vitamin D3 1600 IU/day (n = 34). Control: PEG‐IFN‐α‐2a (180 μg) + oral ribavirin (Rebetol, MSD), dosage determined based on patient’s weight and genotype. PEG‐IFN‐α‐2a was administered for 48 weeks in patients with genotypes 1 and 4 and for 24 weeks in those with genotypes 2 and 3 (n = 34). Vitamin D3 was administered for 12 weeks. | |
| Outcomes | Primary outcome: EVR defined as undetectable HCV‐RNA at 12 weeks' post‐treatment. | |
| Stated aim of study | To assess the influence of vitamin D supplementation on viral response to PegINF/RBV therapy | |
| Notes | The research council of Mashhad University of Medical Sciences,Mashhad, Iran financially supported this study. | |
| Risk of bias | ||
| Bias | Authors' judgement | Support for judgement |
| Random sequence generation (selection bias) | Unclear risk | Method of sequence generation not specified. |
| Allocation concealment (selection bias) | Low risk | Participant allocations could not have been foreseen in advance of, or during, enrolment. Allocation sequence hidden in sequentially numbered, opaque, and sealed envelopes. |
| Blinding of participants and personnel (performance bias) | High risk | No blinding, and assessment of outcomes likely to be influenced by lack of blinding. |
| Blinding of outcome assessment (detection bias) | High risk | No blinding, and assessment of outcomes likely to be influenced by lack of blinding. |
| Incomplete outcome data (attrition bias) | Low risk | Missing data unlikely to make treatment effects depart from plausible values. |
| Selective reporting (reporting bias) | Low risk | All predefined outcomes reported fully. |
| For‐profit bias | Low risk | The trial appeared to be free of industry sponsorship or other type of for‐profit support that could manipulate the trial design, conductance, or trial results. |
| Other bias | Unclear risk | The trial may or may not have been free of other components that could put it at risk of bias. |
| Methods | Randomised clinical trial with parallel group design (3 groups). | |
| Participants | 75 participants (17% women), aged 28 to 65 years, mean age 48 years, undergoing liver transplantation. Inclusion criteria: primary liver transplant recipients. Exclusion criteria: history of corticosteroid, anticonvulsant, or vitamin D intake; renal disease. | |
| Interventions | Intervention 1: calcitriol 0.25 μg/day + calcium gluconate (n = 25). Intervention 2: calcium gluconate (n = 25). Control: placebo (n = 25). For 1 month. | |
| Outcomes | Outcomes reported in abstract of publication: Primary outcomes: acute cellular rejection rate at 1 month' post transplant. Secondary outcomes: none stated. | |
| Stated aim of study | To investigate effects of calcitriol on acute cellular rejection rate of liver transplant recipients. | |
| Notes | Study sponsored by a grant from Shanghai Nature Science Fund project and a grant from Science and Technology Department of Shanghai. Additional information received through personal communication with the authors on 13 February 2014. | |
| Risk of bias | ||
| Bias | Authors' judgement | Support for judgement |
| Random sequence generation (selection bias) | Unclear risk | Method of sequence generation not specified. |
| Allocation concealment (selection bias) | Unclear risk | Method used to conceal allocation not described so that intervention allocations may have been foreseen in advance of, or during, enrolment. |
| Blinding of participants and personnel (performance bias) | Unclear risk | Insufficient information to permit judgement of 'low risk' or 'high risk'. |
| Blinding of outcome assessment (detection bias) | Unclear risk | Insufficient information to permit judgement of 'low risk' or 'high risk'. |
| Incomplete outcome data (attrition bias) | Low risk | Missing data unlikely to make treatment effects depart from plausible values. |
| Selective reporting (reporting bias) | Unclear risk | Unclear whether all predefined and clinically relevant and reasonably expected outcomes were reported. |
| For‐profit bias | Low risk | Trial appeared to be free of industry sponsorship or other type of for‐profit support that could manipulate the trial design, conductance, or trial results. |
| Other bias | Low risk | Trial appeared to be free of other factors that could put it at risk of bias. |
| Methods | Randomised clinical trial with parallel group design (2 groups). | |
| Participants | 84 participants (49% women), aged 30 to 78 years, mean age 59 years, with HCV genotype 1b. Inclusion criteria: aged ≥ 20 years, chronically infected with HCV genotype 1 and plasma HCV RNA concentrations ≥ 100 log IU/mL. Exclusion criteria: decompensated cirrhosis, liver cancer, HBV or HIV infection, renal insufficiency, history of heart disease or cerebral infarction, pregnancy or breastfeeding. | |
| Interventions | Intervention: subcutaneous injections of PEG‐IFN‐α‐2b (1.5 μg/kg body weight) once weekly, along with weight‐based oral ribavirin (600 mg/day to 1200 mg/day) + vitamin D3 1000 IU (n = 42). Control: subcutaneous injections of PEG‐IFN‐α‐2b (1.5 μg/kg body weight) once weekly, along with weight‐based oral ribavirin (600 mg/day to 1200 mg/day) (n = 42). For 16 weeks. | |
| Outcomes | Primary outcome: undetectable HCV RNA at week 24. Secondary outcomes: none stated. | |
| Stated aim of study | To rigorously evaluate the antiviral effects of vitamin D supplementation in people with HCV genotype‐1 infection being treated with PEG‐IFN + ribavirin. | |
| Notes | ||
| Risk of bias | ||
| Bias | Authors' judgement | Support for judgement |
| Random sequence generation (selection bias) | Unclear risk | Method of sequence generation not specified. |
| Allocation concealment (selection bias) | Unclear risk | Method used to conceal the allocation not described so intervention allocations may have been foreseen before, or during, enrolment. |
| Blinding of participants and personnel (performance bias) | High risk | No blinding, and outcome was likely to be influenced by lack of blinding. |
| Blinding of outcome assessment (detection bias) | High risk | No blinding of outcome assessment, and outcome measurement was likely to be influenced by lack of blinding. |
| Incomplete outcome data (attrition bias) | Low risk | Missing data were unlikely to make treatment effects depart from plausible values. |
| Selective reporting (reporting bias) | Unclear risk | Unclear whether all predefined and clinically relevant and reasonably expected outcomes were reported. |
| For‐profit bias | Unclear risk | Trial may or may not have been free of for‐profit bias as trial did not provide any information on clinical trial support or sponsorship. |
| Other bias | Low risk | Trial appeared to be free of other factors that could put it at risk of bias. |
ALT: alanine aminotransferase; AST: aspartate aminotransferase; BMI: body mass index; EVR: early viral response; HBV: hepatitis B virus; HCV: hepatitis C virus; HDV: hepatitis D virus; IFN: interferon; IU: international unit; MRI: magnetic resonance imaging; n: number of participants; NAFLD: non‐alcoholic fatty liver disease; PCR: polymerase chain reaction; PEG: pegylated; RNA: ribonucleic acid; RVR: rapid viral response; SVR: sustained virological response; US: ultrasound; WBC: white blood cell count.
Characteristics of excluded studies [ordered by study ID]
| Study | Reason for exclusion |
| Not a randomised trial. | |
| Not a randomised trial. | |
| Not a randomised trial. | |
| Not a randomised trial. | |
| Not a randomised trial. | |
| Not a randomised trial. | |
| Not a randomised trial. | |
| Not a randomised trial. | |
| Not a randomised trial. | |
| Not a randomised trial. | |
| Not a randomised trial. | |
| Not a randomised trial. | |
| Not a randomised trial. | |
| Not a randomised trial. |
Characteristics of ongoing studies [ordered by study ID]
| Trial name or title | Effectiveness of Vitamin D Supplementation on Severity of Cirrhosis Based on CHILD and MELD Scores in Patients with Decompensate Cirrhosis. |
| Methods | Randomised clinical trial using parallel group design (2 groups). |
| Participants | Country: Iran. Estimated number of participants: 80. Inclusion criteria: people with HIV, renal failure due to reasons other than liver failure, malabsorption such as chronic diarrhoea, coeliac disease, chronic pancreatitis; people undergoing corticosteroid treatment; pregnancy; and people with cirrhosis secondary to cholestasis such as primary biliary cirrhosis. |
| Interventions | Intervention: vitamin D3 (50,000 IU) and popular drugs using for liver cirrhosis. Control: popular drugs using for liver cirrhosis. Daily for 3 months. |
| Outcomes | Primary outcome: liver function measured by Model for End‐Stage Liver Disease score. Secondary outcomes: liver function measured by Child‐Turcotte‐Pugh score. |
| Starting date | March 2016. |
| Contact information | Hossein Ali Abbasi, Emam Reza Hospital, Emam Reza Square, Ebne Sina Avenue, Mashhad, Iran, [email protected]. |
| Notes |
| Trial name or title | Study of Oral Vitamin D Treatment for the Prevention of Hepatocellular Carcinoma in Patients with Chronic Hepatitis B. |
| Methods | Randomised clinical trial using parallel group design (2 groups). |
| Participants | Country: China. Estimated number of participants: 1500. Inclusion criteria: age 18 to 70 years; with chronic hepatitis B and under the oral antivirus treatment; no evidence of hepatocellular carcinoma on entry imaging study; Model for End‐Stage Liver Disease score < 22; not currently participating in another intervention study; not pregnant or lactating; and willing to use effective contraception during study period; absence of any psychological, familial, sociological, or geographical condition potentially hampering compliance with the study protocol and follow‐up schedule; and ability to provide written informed consent according to national or local regulations. Exclusion criteria: evidence of hepatocellular carcinoma within 6 months after enrolment; serum alanine aminotransferase level > 10 times the upper limit of normal, elevated serum creatinine level, diagnosis of kidney stones, diagnosis of hyperparathyroidism or other serious disturbance of calcium metabolism in past 5 years, evidence of autoimmune hepatitis, coinfection with hepatitis C or D virus or HIV, other serious concurrent illness (e.g. alcoholism, uncontrolled diabetes, or cancer), treatment with immunomodulatory agent within 6 months before screening, treatment with any investigational drug within 30 days before the study began. |
| Interventions | Intervention: vitamin D3 800 IU/day besides the antivirus treatment with nucleos(t)ide medicine. Control: no intervention. For 1 year. |
| Outcomes | Primary outcomes: change in serum levels of 25‐hydroxyvitamin D at baseline, and at 6 and 12 months, and change in serum levels of 25‐hydroxyvitamin D at 6 and 12 months compared to baseline. Secondary outcomes: change in serum creatinine at baseline, and at 6 and 12 months; change in serum creatinine at 6 and 12 months compared to baseline; change in fibrosis score at baseline, and at 6 and 12 months; fibrosis score at 6 and 12 months compared to baseline; number of participants on vitamin D treatment with adverse events. |
| Starting date | June 2016. |
| Contact information | Yutian Chong, MD, Third Affiliated Hospital, Sun Yat‐Sen University, [email protected]. |
| Notes |
IU: international unit.
Data and analyses
| Outcome or subgroup title | No. of studies | No. of participants | Statistical method | Effect size |
| 1 All‐cause mortality Show forest plot | 15 | 1034 | Peto Odds Ratio (Peto, Fixed, 95% CI) | 0.70 [0.09, 5.38] |
| Analysis 1.1  Comparison 1 Vitamin D versus placebo or no intervention, Outcome 1 All‐cause mortality. | ||||
| 2 All‐cause mortality ('best‐worst' case and 'worst‐best' case scenarios) Show forest plot | 15 | Peto Odds Ratio (Peto, Fixed, 95% CI) | Subtotals only | |
| Analysis 1.2  Comparison 1 Vitamin D versus placebo or no intervention, Outcome 2 All‐cause mortality ('best‐worst' case and 'worst‐best' case scenarios). | ||||
| 2.1 'Best‐worst' case scenario | 15 | 1034 | Peto Odds Ratio (Peto, Fixed, 95% CI) | 0.11 [0.05, 0.24] |
| 2.2 'Worst‐best' case scenario | 15 | 1034 | Peto Odds Ratio (Peto, Fixed, 95% CI) | 7.80 [3.67, 16.57] |
| 3 Liver‐related mortality Show forest plot | 1 | 18 | Risk Ratio (M‐H, Random, 95% CI) | 1.62 [0.08, 34.66] |
| Analysis 1.3  Comparison 1 Vitamin D versus placebo or no intervention, Outcome 3 Liver‐related mortality. | ||||
| 4 Serious adverse events Show forest plot | 3 | Risk Ratio (M‐H, Random, 95% CI) | Subtotals only | |
| Analysis 1.4  Comparison 1 Vitamin D versus placebo or no intervention, Outcome 4 Serious adverse events. | ||||
| 4.1 Hypercalcaemia | 1 | 76 | Risk Ratio (M‐H, Random, 95% CI) | 5.0 [0.25, 100.80] |
| 4.2 Myocardial infarction | 2 | 86 | Risk Ratio (M‐H, Random, 95% CI) | 0.75 [0.08, 6.81] |
| 4.3 Thyroiditis | 1 | 68 | Risk Ratio (M‐H, Random, 95% CI) | 0.33 [0.01, 7.91] |
| 5 Non‐serious adverse events Show forest plot | 1 | Risk Ratio (M‐H, Random, 95% CI) | Subtotals only | |
| Analysis 1.5  Comparison 1 Vitamin D versus placebo or no intervention, Outcome 5 Non‐serious adverse events. | ||||
| 5.1 Glossitis | 1 | 65 | Risk Ratio (M‐H, Random, 95% CI) | 3.70 [0.16, 87.58] |
| 6 Failure of rapid virological response Show forest plot | 2 | 187 | Risk Ratio (M‐H, Random, 95% CI) | 0.70 [0.52, 0.94] |
| Analysis 1.6  Comparison 1 Vitamin D versus placebo or no intervention, Outcome 6 Failure of rapid virological response. | ||||
| 7 Failure of early virological response Show forest plot | 2 | 140 | Risk Ratio (M‐H, Random, 95% CI) | 0.10 [0.03, 0.33] |
| Analysis 1.7  Comparison 1 Vitamin D versus placebo or no intervention, Outcome 7 Failure of early virological response. | ||||
| 8 Failure of sustained virological response Show forest plot | 5 | 422 | Risk Ratio (M‐H, Random, 95% CI) | 0.59 [0.28, 1.21] |
| Analysis 1.8  Comparison 1 Vitamin D versus placebo or no intervention, Outcome 8 Failure of sustained virological response. | ||||
| 9 Acute cellular rejection in liver transplant recipients Show forest plot | 1 | 75 | Risk Ratio (M‐H, Random, 95% CI) | 0.33 [0.04, 2.62] |
| Analysis 1.9 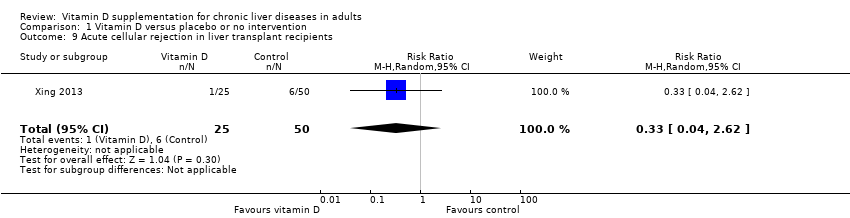 Comparison 1 Vitamin D versus placebo or no intervention, Outcome 9 Acute cellular rejection in liver transplant recipients. | ||||
| 10 Vitamin D status (ng/mL) Show forest plot | 6 | 424 | Mean Difference (IV, Random, 95% CI) | 17.24 [12.46, 22.02] |
| Analysis 1.10  Comparison 1 Vitamin D versus placebo or no intervention, Outcome 10 Vitamin D status (ng/mL). | ||||
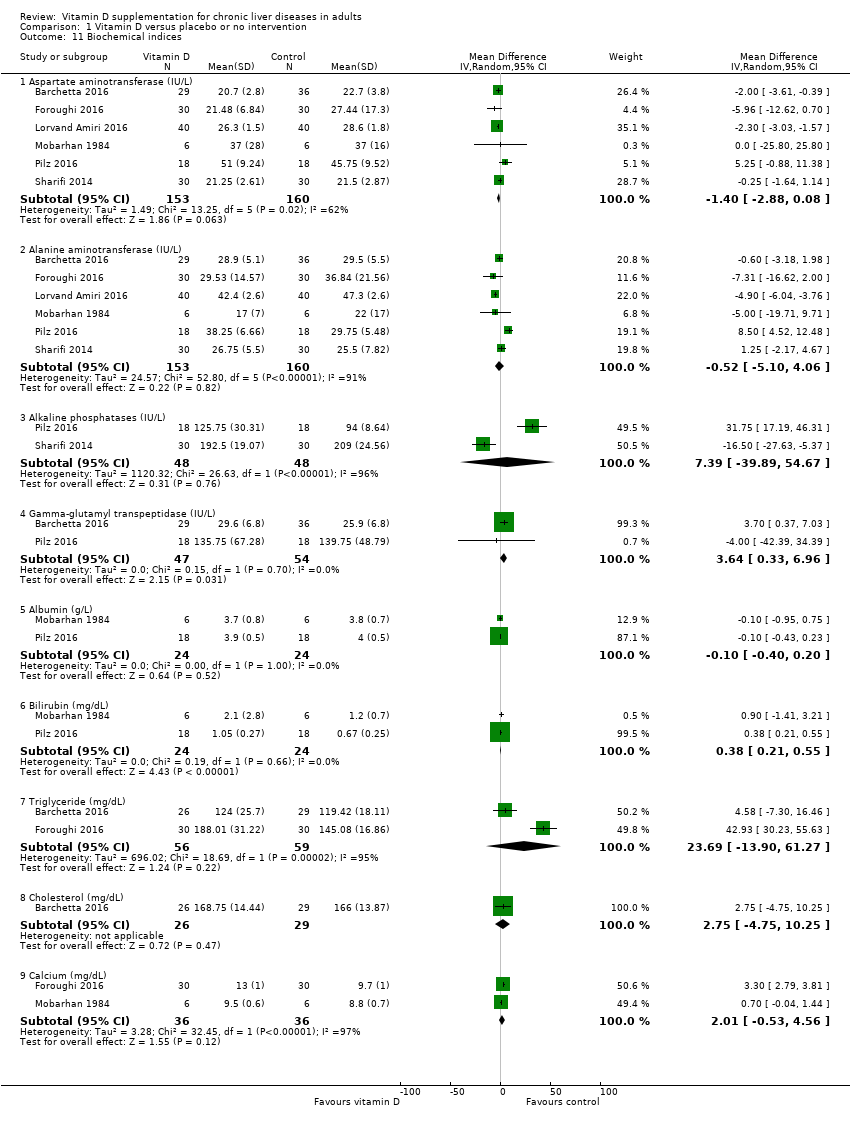
| 11 Biochemical indices Show forest plot | 6 | Mean Difference (IV, Random, 95% CI) | Subtotals only | |
| Analysis 1.11  Comparison 1 Vitamin D versus placebo or no intervention, Outcome 11 Biochemical indices. | ||||
| 11.1 Aspartate aminotransferase (IU/L) | 6 | 313 | Mean Difference (IV, Random, 95% CI) | ‐1.40 [‐2.88, 0.08] |
| 11.2 Alanine aminotransferase (IU/L) | 6 | 313 | Mean Difference (IV, Random, 95% CI) | ‐0.52 [‐5.10, 4.06] |
| 11.3 Alkaline phosphatases (IU/L) | 2 | 96 | Mean Difference (IV, Random, 95% CI) | 7.39 [‐39.89, 54.67] |
| 11.4 Gamma‐glutamyl transpeptidase (IU/L) | 2 | 101 | Mean Difference (IV, Random, 95% CI) | 3.64 [0.33, 6.96] |
| 11.5 Albumin (g/L) | 2 | 48 | Mean Difference (IV, Random, 95% CI) | ‐0.10 [‐0.40, 0.20] |
| 11.6 Bilirubin (mg/dL) | 2 | 48 | Mean Difference (IV, Random, 95% CI) | 0.38 [0.21, 0.55] |
| 11.7 Triglyceride (mg/dL) | 2 | 115 | Mean Difference (IV, Random, 95% CI) | 23.69 [‐13.90, 61.27] |
| 11.8 Cholesterol (mg/dL) | 1 | 55 | Mean Difference (IV, Random, 95% CI) | 2.75 [‐4.75, 10.25] |
| 11.9 Calcium (mg/dL) | 2 | 72 | Mean Difference (IV, Random, 95% CI) | 2.01 [‐0.53, 4.56] |
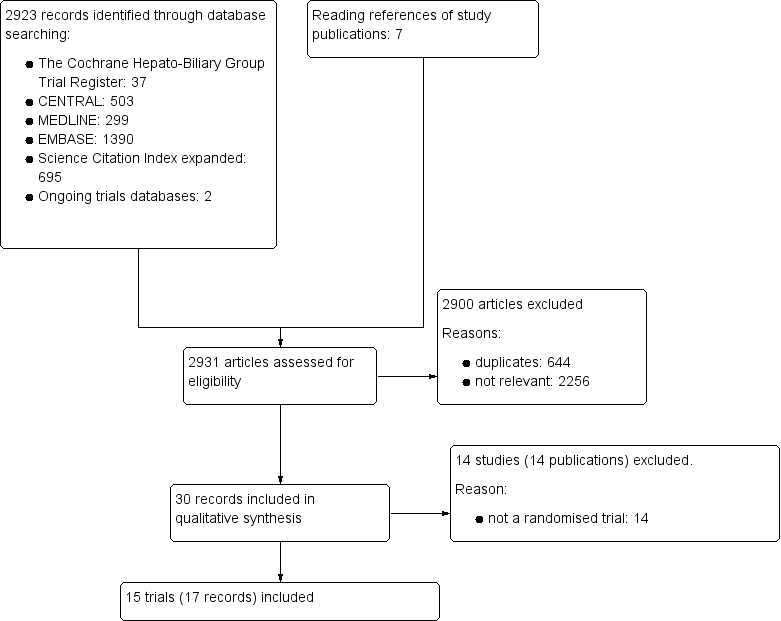
Study flow diagram
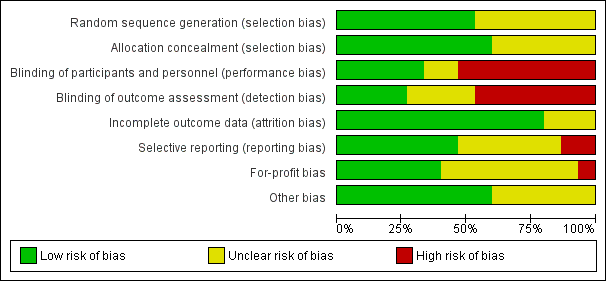
Risk of bias graph: review authors' judgements about each risk of bias item presented as percentages across all included studies.

Risk of bias summary: review authors' judgements about each risk of bias item for each included study.

Funnel plot of comparison: 1 Vitamin D versus placebo or no intervention, outcome: 1.1 All‐cause mortality.

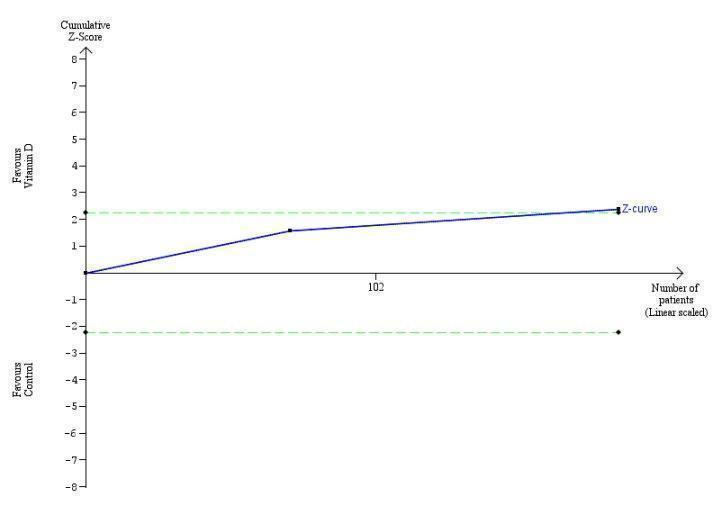
Trial Sequential Analysis on all‐cause mortality up to 1.4‐year follow‐up in 15 vitamin D trials, based on mortality rate in the control group of 10%, a relative risk reduction of 28% in the intervention group, a type I error of 2.5%, and type II error of 10% (90% power). There was no diversity. The required information size was 6396 participants. The cumulative Z‐curve (blue line) did not cross the trial sequential monitoring boundary for benefit or harm (red inward sloping lines) and did not enter the trial sequential monitoring area for futility (inner‐wedge with red outward sloping lines).
Trial Sequential Analysis on rapid virological response in the two vitamin D trials was performed based on a mortality rate in the control group of 5%, a relative risk reduction (RRR) of 30% in the intervention group, a type I error of 2.5%, and type II error of 10% (90% power). There was no diversity. The required information size was 11958 participants. The cumulative Z‐curve crossed the conventional monitoring boundary for benefit. The trial sequential monitoring boundary is ignored due to little information use (1.56%).

Trial Sequential Analysis on early virological response in the two vitamin D trials was performed based on a mortality rate in the control group of 5%, a relative risk reduction (RRR) of 30% in the intervention group, a type I error of 2.5%, and type II error of 10% (90% power). There was no diversity. The required information size was 11958 participants. The cumulative Z‐curve crossed the conventional monitoring boundary for benefit. The trial sequential monitoring boundary is ignored due to little information use (1.17%).

Trial Sequential Analysis on sustained virological response in the five vitamin D trials was performed based on a mortality rate in the control group of 5%, a relative risk reduction (RRR) of 30% in the intervention group, a type I error of 2.5%, and type II error of 10% (90% power). There was no diversity. The required information size was 69798 participants. The trial sequential monitoring boundary is ignored due to little information use (0.45%).

Trial Sequential Analysis on acute cellular rejection in the one vitamin D trial was performed based on a mortality rate in the control group of 5%, a relative risk reduction (RRR) of 30% in the intervention group, a type I error of 2.5%, and type II error of 10% (90% power). There was no diversity. The required information size was 11958 participants. The cumulative Z‐curve did not cross the conventional monitoring boundary. The trial sequential monitoring boundary is ignored due to little information use (0.84%).

Comparison 1 Vitamin D versus placebo or no intervention, Outcome 1 All‐cause mortality.

Comparison 1 Vitamin D versus placebo or no intervention, Outcome 2 All‐cause mortality ('best‐worst' case and 'worst‐best' case scenarios).

Comparison 1 Vitamin D versus placebo or no intervention, Outcome 3 Liver‐related mortality.

Comparison 1 Vitamin D versus placebo or no intervention, Outcome 4 Serious adverse events.

Comparison 1 Vitamin D versus placebo or no intervention, Outcome 5 Non‐serious adverse events.

Comparison 1 Vitamin D versus placebo or no intervention, Outcome 6 Failure of rapid virological response.
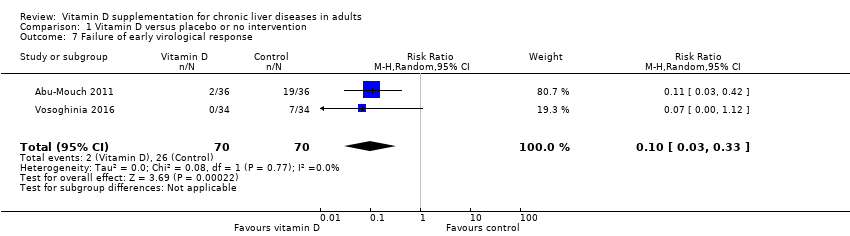
Comparison 1 Vitamin D versus placebo or no intervention, Outcome 7 Failure of early virological response.
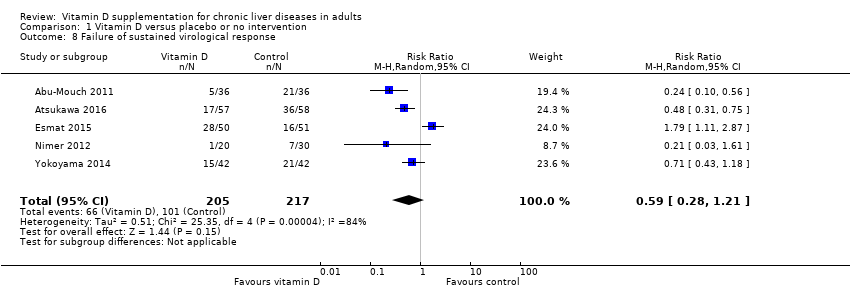
Comparison 1 Vitamin D versus placebo or no intervention, Outcome 8 Failure of sustained virological response.

Comparison 1 Vitamin D versus placebo or no intervention, Outcome 9 Acute cellular rejection in liver transplant recipients.

Comparison 1 Vitamin D versus placebo or no intervention, Outcome 10 Vitamin D status (ng/mL).
Comparison 1 Vitamin D versus placebo or no intervention, Outcome 11 Biochemical indices.
| Vitamin D compared to placebo or no intervention for chronic liver diseases in adults | ||||||
| Patient or population: adults with chronic liver diseases. | ||||||
| Outcomes | Anticipated absolute effects* (95% CI) | Relative effect | № of participants | Quality of the evidence | Comments | |
| Risk with placebo or no intervention | Risk with vitamin D | |||||
| All‐cause mortality at the end of follow‐up Follow‐up: 0.1 to 1.4, mean 0.6 years | Study population | OR 0.70 | 1034 | ⊕⊝⊝⊝ | Trial Sequential Analyses‐adjusted CI was 0.00 to 2534. | |
| 4 per 1.000 | 3 per 1.000 | |||||
| Liver‐related mortality Follow‐up: mean 1 year | Study population | RR 1.62 | 18 | ⊕⊝⊝⊝ | Due to few data, we did not conduct Trial Sequential Analysis which would only have revealed larger imprecision. | |
| 0 per 1.000 | 0 per 1.000 | |||||
| Serious adverse events ‐ hypercalcaemia Follow‐up: mean 1 year | Study population | RR 5.00 | 76 | ⊕⊝⊝⊝ | Due to few data, we did not conduct Trial Sequential Analysis which would only have revealed larger imprecision. | |
| 0 per 1.000 | 0 per 1.000 | |||||
| Serious adverse events ‐ myocardial infarction Follow‐up: 0.2 to 1, mean 0.6 years | Study population | RR 0.75 | 86 | ⊕⊝⊝⊝ | Due to few data, we did not conduct Trial Sequential Analysis which would only have revealed larger imprecision. | |
| 25 per 1.000 | 19 per 1.000 | |||||
| Serious adverse events ‐ thyroiditis Follow‐up: mean 0.2 years | Study population | RR 0.33 | 68 | ⊕⊝⊝⊝ | Due to few data, we did not conduct Trial Sequential Analysis which would only have revealed larger imprecision. | |
| 29 per 1.000 | 10 per 1.000 | |||||
| Failure of sustained virological response Follow‐up: 0.3 to 1.4, mean 0.9 years | Study population | RR 0.59 | 422 | ⊕⊝⊝⊝ Very low 1,2,3,6 | The trial sequential monitoring boundary is ignored due to little information use (0.6%). | |
| 465 per 1.000 | 275 per 1.000 | |||||
| Acute cellular rejection in liver transplant recipients Follow‐up: mean 0.08 years | Study population | RR 0.33 | 75 | ⊕⊝⊝⊝ Very low 1,3,7 | The trial sequential monitoring boundary is ignored due to little information use (0.84%). | |
| 120 per 1.000 | 40 per 1.000 | |||||
| *The risk in the intervention group (and its 95% confidence interval) is based on the assumed risk in the comparison group and the relative effect of the intervention (and its 95% CI). | ||||||
| GRADE Working Group grades of evidence
| ||||||
| 1 Downgraded one level due to risk of bias: all trials were at high risk of bias. | ||||||
| Study ID | Protocol | Design | Groups | Bias | Blinding | Participants | Women | Mean |
| Yes | Parallel | 2 | High | NI | 72 | 44 | 47 | |
| No | Parallel | 2 | High | NI | 115 | 50 | 64 | |
| Yes | Parallel | 2 | High | PL | 65 | 35 | 59 | |
| No | Parallel | 2 | High | NI | 101 | 25 | 40 | |
| Yes | Parallel | 2 | High | PL | 60 | 52 | 48 | |
| Yes | Parallel | 3 | High | PL | 120 | 38 | 41 | |
| No | Parallel | 3 | High | NI | 18 | 0 | 61 | |
| No | Parallel | 2 | High | NI | 50 | 58 | 47 | |
| Yes | Parallel | 2 | High | PL | 36 | 25 | 61 | |
| No | Parallel | 2 | High | PL | 60 | 51 | 60 | |
| No | Parallel | 2 | High | NI | 76 | 66 | 61 | |
| No | Parallel | 2 | High | NI | 34 | 100 | 56 | |
| Yes | Parallel | 2 | High | NI | 68 | 13 | 42 | |
| No | Parallel | 3 | High | PL | 75 | 17 | 48 | |
| No | Parallel | 2 | High | NI | 84 | 49 | 59 | |
| n: number of participants; NI: no intervention; PL: placebo. | ||||||||
| Study ID | Participants | Outcome measures | Sponsor | Country |
| Chronic hepatitis C genotype 1 | Sustained virological response | No information | Israel | |
| Chronic hepatitis C genotype 1 | Sustained virological response | No information | Japan | |
| NAFLD | Liver steatosis, liver function | No | Italy | |
| Chronic hepatitis C genotype 4 | Sustained virological response | No information | Egypt | |
| NAFLD | Liver steatosis, liver function | No | Iran | |
| NAFLD | Liver function, body fat | No | Iran | |
| Liver cirrhosis | Bone mineral density | Yes | USA | |
| Chronic hepatitis C genotype 2 or 3 | Sustained virological response | No information | Israel | |
| Liver cirrhosis | Vitamin D status, liver function | No | Austria | |
| NAFLD | Liver function, insulin resistance index | No | Iran | |
| Liver cirrhosis | Bone mineral density | No information | Japan | |
| Primary biliary cirrhosis | Bone mineral density | No information | Japan | |
| Chronic hepatitis C genotype 1,2,3,4 | Early virological response | No | Iran | |
| Liver transplant recipients | Acute cellular rejection rate | No | China | |
| Chronic hepatitis C genotype 1 | Sustained virological response | No information | Japan | |
| NAFLD: non‐alcoholic fatty liver disease. | ||||
| Study ID | Vitamin | Calcium | Regimen* | Treatment | Follow‐up | Cointervention | |||
| D3 | D2 | 25(OH)D | 1,25(OH)2D | ||||||
| 2000 | ‐ | ‐ | ‐ | ‐ | Daily | 48 | 72 | PEG‐INF, RBV | |
| 2000 | ‐ | ‐ | ‐ | ‐ | Daily | 16 | 16 | PEG‐INF, RBV, SP | |
| 2000 | ‐ | ‐ | ‐ | ‐ | Daily | 24 | 24 | ‐ | |
| 2143 | ‐ | ‐ | ‐ | ‐ | Weekly | 48 | 72 | PEG‐INF, RBV | |
| 7143 | ‐ | ‐ | ‐ | ‐ | Weekly | 10 | 10 | ‐ | |
| 1000 | ‐ | ‐ | ‐ | 500 | Daily | 10 | 12 | ‐ | |
| ‐ | 17,857 | 2400 | ‐ | ‐ | Daily | 52 | 52 | ‐ | |
| 2000 | ‐ | ‐ | ‐ | ‐ | Daily | 24 | 48 | PEG‐INF, RBV | |
| 2800 | ‐ | ‐ | ‐ | ‐ | Daily | 8 | 8 | ‐ | |
| 3571 | ‐ | ‐ | ‐ | ‐ | Twice a week | 16 | 16 | ‐ | |
| ‐ | ‐ | ‐ | 1 | ‐ | Daily | 52 | 52 | ‐ | |
| ‐ | ‐ | ‐ | 1 | ‐ | Daily | 52 | 52 | ‐ | |
| 1600 | ‐ | ‐ | ‐ | ‐ | Daily | 12 | 12 | PEG‐INF, RBV | |
| ‐ | ‐ | ‐ | 0.25 | 1000 | Daily | 4 | 4 | ‐ | |
| 1000 | ‐ | ‐ | ‐ | ‐ | Daily | 16 | 24 | PEG‐INF, RBV | |
| * Vitamin D was administered orally in all trials. | |||||||||
| Outcome or subgroup title | No. of studies | No. of participants | Statistical method | Effect size |
| 1 All‐cause mortality Show forest plot | 15 | 1034 | Peto Odds Ratio (Peto, Fixed, 95% CI) | 0.70 [0.09, 5.38] |
| 2 All‐cause mortality ('best‐worst' case and 'worst‐best' case scenarios) Show forest plot | 15 | Peto Odds Ratio (Peto, Fixed, 95% CI) | Subtotals only | |
| 2.1 'Best‐worst' case scenario | 15 | 1034 | Peto Odds Ratio (Peto, Fixed, 95% CI) | 0.11 [0.05, 0.24] |
| 2.2 'Worst‐best' case scenario | 15 | 1034 | Peto Odds Ratio (Peto, Fixed, 95% CI) | 7.80 [3.67, 16.57] |
| 3 Liver‐related mortality Show forest plot | 1 | 18 | Risk Ratio (M‐H, Random, 95% CI) | 1.62 [0.08, 34.66] |
| 4 Serious adverse events Show forest plot | 3 | Risk Ratio (M‐H, Random, 95% CI) | Subtotals only | |
| 4.1 Hypercalcaemia | 1 | 76 | Risk Ratio (M‐H, Random, 95% CI) | 5.0 [0.25, 100.80] |
| 4.2 Myocardial infarction | 2 | 86 | Risk Ratio (M‐H, Random, 95% CI) | 0.75 [0.08, 6.81] |
| 4.3 Thyroiditis | 1 | 68 | Risk Ratio (M‐H, Random, 95% CI) | 0.33 [0.01, 7.91] |
| 5 Non‐serious adverse events Show forest plot | 1 | Risk Ratio (M‐H, Random, 95% CI) | Subtotals only | |
| 5.1 Glossitis | 1 | 65 | Risk Ratio (M‐H, Random, 95% CI) | 3.70 [0.16, 87.58] |
| 6 Failure of rapid virological response Show forest plot | 2 | 187 | Risk Ratio (M‐H, Random, 95% CI) | 0.70 [0.52, 0.94] |
| 7 Failure of early virological response Show forest plot | 2 | 140 | Risk Ratio (M‐H, Random, 95% CI) | 0.10 [0.03, 0.33] |
| 8 Failure of sustained virological response Show forest plot | 5 | 422 | Risk Ratio (M‐H, Random, 95% CI) | 0.59 [0.28, 1.21] |
| 9 Acute cellular rejection in liver transplant recipients Show forest plot | 1 | 75 | Risk Ratio (M‐H, Random, 95% CI) | 0.33 [0.04, 2.62] |
| 10 Vitamin D status (ng/mL) Show forest plot | 6 | 424 | Mean Difference (IV, Random, 95% CI) | 17.24 [12.46, 22.02] |
| 11 Biochemical indices Show forest plot | 6 | Mean Difference (IV, Random, 95% CI) | Subtotals only | |
| 11.1 Aspartate aminotransferase (IU/L) | 6 | 313 | Mean Difference (IV, Random, 95% CI) | ‐1.40 [‐2.88, 0.08] |
| 11.2 Alanine aminotransferase (IU/L) | 6 | 313 | Mean Difference (IV, Random, 95% CI) | ‐0.52 [‐5.10, 4.06] |
| 11.3 Alkaline phosphatases (IU/L) | 2 | 96 | Mean Difference (IV, Random, 95% CI) | 7.39 [‐39.89, 54.67] |
| 11.4 Gamma‐glutamyl transpeptidase (IU/L) | 2 | 101 | Mean Difference (IV, Random, 95% CI) | 3.64 [0.33, 6.96] |
| 11.5 Albumin (g/L) | 2 | 48 | Mean Difference (IV, Random, 95% CI) | ‐0.10 [‐0.40, 0.20] |
| 11.6 Bilirubin (mg/dL) | 2 | 48 | Mean Difference (IV, Random, 95% CI) | 0.38 [0.21, 0.55] |
| 11.7 Triglyceride (mg/dL) | 2 | 115 | Mean Difference (IV, Random, 95% CI) | 23.69 [‐13.90, 61.27] |
| 11.8 Cholesterol (mg/dL) | 1 | 55 | Mean Difference (IV, Random, 95% CI) | 2.75 [‐4.75, 10.25] |
| 11.9 Calcium (mg/dL) | 2 | 72 | Mean Difference (IV, Random, 95% CI) | 2.01 [‐0.53, 4.56] |