| 1 All‐cause mortality Show forest plot | 15 | 1034 | Peto Odds Ratio (Peto, Fixed, 95% CI) | 0.70 [0.09, 5.38] |
|
| 2 All‐cause mortality ('best‐worst' case and 'worst‐best' case scenarios) Show forest plot | 15 | | Peto Odds Ratio (Peto, Fixed, 95% CI) | Subtotals only |
|
| 2.1 'Best‐worst' case scenario | 15 | 1034 | Peto Odds Ratio (Peto, Fixed, 95% CI) | 0.11 [0.05, 0.24] |
| 2.2 'Worst‐best' case scenario | 15 | 1034 | Peto Odds Ratio (Peto, Fixed, 95% CI) | 7.80 [3.67, 16.57] |
| 3 Liver‐related mortality Show forest plot | 1 | 18 | Risk Ratio (M‐H, Random, 95% CI) | 1.62 [0.08, 34.66] |
|
| 4 Serious adverse events Show forest plot | 3 | | Risk Ratio (M‐H, Random, 95% CI) | Subtotals only |
|
| 4.1 Hypercalcaemia | 1 | 76 | Risk Ratio (M‐H, Random, 95% CI) | 5.0 [0.25, 100.80] |
| 4.2 Myocardial infarction | 2 | 86 | Risk Ratio (M‐H, Random, 95% CI) | 0.75 [0.08, 6.81] |
| 4.3 Thyroiditis | 1 | 68 | Risk Ratio (M‐H, Random, 95% CI) | 0.33 [0.01, 7.91] |
| 5 Non‐serious adverse events Show forest plot | 1 | | Risk Ratio (M‐H, Random, 95% CI) | Subtotals only |
|
| 5.1 Glossitis | 1 | 65 | Risk Ratio (M‐H, Random, 95% CI) | 3.70 [0.16, 87.58] |
| 6 Failure of rapid virological response Show forest plot | 2 | 187 | Risk Ratio (M‐H, Random, 95% CI) | 0.70 [0.52, 0.94] |
|
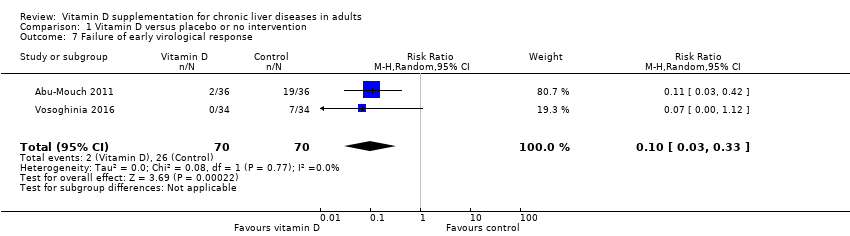
| 7 Failure of early virological response Show forest plot | 2 | 140 | Risk Ratio (M‐H, Random, 95% CI) | 0.10 [0.03, 0.33] |
|
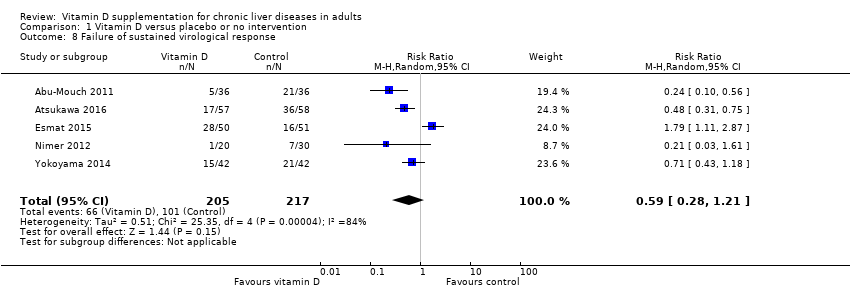
| 8 Failure of sustained virological response Show forest plot | 5 | 422 | Risk Ratio (M‐H, Random, 95% CI) | 0.59 [0.28, 1.21] |
|
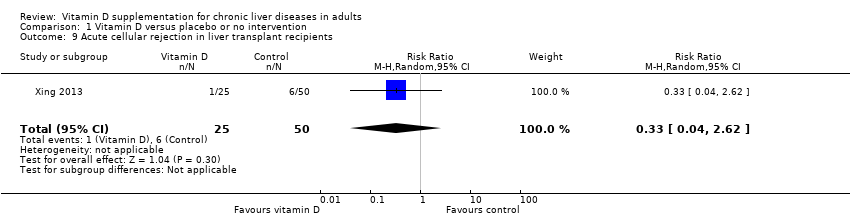
| 9 Acute cellular rejection in liver transplant recipients Show forest plot | 1 | 75 | Risk Ratio (M‐H, Random, 95% CI) | 0.33 [0.04, 2.62] |
|
| 10 Vitamin D status (ng/mL) Show forest plot | 6 | 424 | Mean Difference (IV, Random, 95% CI) | 17.24 [12.46, 22.02] |
|
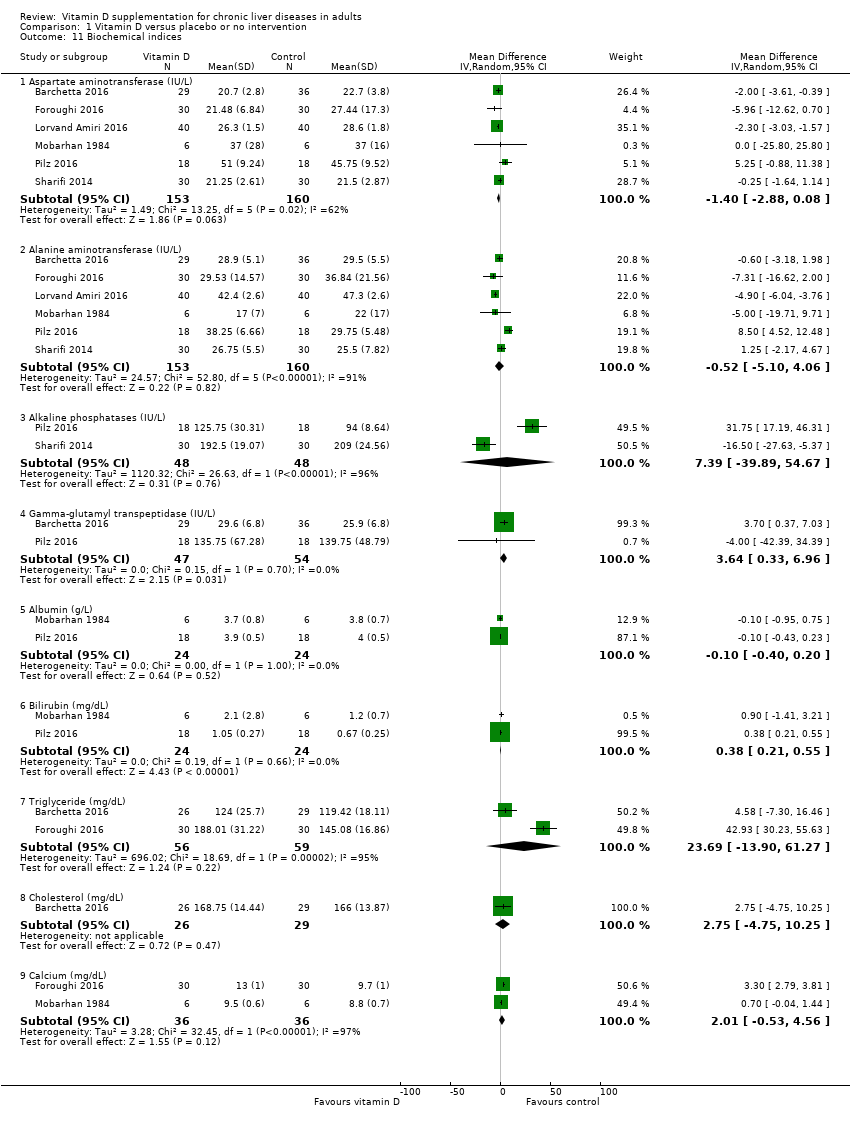
| 11 Biochemical indices Show forest plot | 6 | | Mean Difference (IV, Random, 95% CI) | Subtotals only |
|
| 11.1 Aspartate aminotransferase (IU/L) | 6 | 313 | Mean Difference (IV, Random, 95% CI) | ‐1.40 [‐2.88, 0.08] |
| 11.2 Alanine aminotransferase (IU/L) | 6 | 313 | Mean Difference (IV, Random, 95% CI) | ‐0.52 [‐5.10, 4.06] |
| 11.3 Alkaline phosphatases (IU/L) | 2 | 96 | Mean Difference (IV, Random, 95% CI) | 7.39 [‐39.89, 54.67] |
| 11.4 Gamma‐glutamyl transpeptidase (IU/L) | 2 | 101 | Mean Difference (IV, Random, 95% CI) | 3.64 [0.33, 6.96] |
| 11.5 Albumin (g/L) | 2 | 48 | Mean Difference (IV, Random, 95% CI) | ‐0.10 [‐0.40, 0.20] |
| 11.6 Bilirubin (mg/dL) | 2 | 48 | Mean Difference (IV, Random, 95% CI) | 0.38 [0.21, 0.55] |
| 11.7 Triglyceride (mg/dL) | 2 | 115 | Mean Difference (IV, Random, 95% CI) | 23.69 [‐13.90, 61.27] |
| 11.8 Cholesterol (mg/dL) | 1 | 55 | Mean Difference (IV, Random, 95% CI) | 2.75 [‐4.75, 10.25] |
| 11.9 Calcium (mg/dL) | 2 | 72 | Mean Difference (IV, Random, 95% CI) | 2.01 [‐0.53, 4.56] |