Administración de suplementos de vitamina D para las hepatopatías crónicas en adultos
Información
- DOI:
- https://doi.org/10.1002/14651858.CD011564.pub2Copiar DOI

- Base de datos:
-
- Cochrane Database of Systematic Reviews
- Versión publicada:
-
- 03 noviembre 2017see what's new
- Tipo:
-
- Intervention
- Etapa:
-
- Review
- Grupo Editorial Cochrane:
-
Grupo Cochrane de Hepatobiliar
- Copyright:
-
- Copyright © 2017 The Cochrane Collaboration. Published by John Wiley & Sons, Ltd.
Cifras del artículo
Altmetric:
Citado por:
Autores
Contributions of authors
GB: initiated the review; drafted the protocol; performed the literature search, data extraction, and statistical analyses; and drafted the review.
DN: revised the protocol, performed data extraction, and revised the review.
MB: joined the team of authors at the review stage, performed data extraction, and revised the review.
CG: revised the protocol, acted as arbiter for disagreements, and revised the review.
Sources of support
Internal sources
-
Copenhagen Trial Unit, Centre for Clinical Intervention Research, Rigshospitalet, Copenhagen, Denmark.
External sources
-
Ministry of Education, Science and Technological Development of the Republic of Serbia, Project 41018, Serbia.
-
Medical Faculty, University of Nis, Project 24, Serbia.
Declarations of interest
None known.
Acknowledgements
We thank Marija Bjelakovic for her work on the review.
Cochrane Review Group funding acknowledgement: the Danish State is the largest single funder of The Cochrane Hepato‐Biliary Group through its investment in The Copenhagen Trial Unit, Centre for Clinical Intervention Research, Rigshospitalet, Copenhagen University Hospital, Denmark. Disclaimer: the views and opinions expressed in this review are those of the authors and do not necessarily reflect those of the Danish State or The Copenhagen Trial Unit.
Peer reviewers: Tony Bruns, Germany; Sohail Mushtaq, UK.
Contact and sign‐off editor: Vanja Giljaca, UK.
Version history
| Published | Title | Stage | Authors | Version |
| 2021 Aug 25 | Vitamin D supplementation for chronic liver diseases in adults | Review | Milica Bjelakovic, Dimitrinka Nikolova, Goran Bjelakovic, Christian Gluud | |
| 2017 Nov 03 | Vitamin D supplementation for chronic liver diseases in adults | Review | Goran Bjelakovic, Dimitrinka Nikolova, Marko Bjelakovic, Christian Gluud | |
| 2015 Mar 04 | Vitamin D supplementation for chronic liver diseases in adults | Protocol | Goran Bjelakovic, Dimitrinka Nikolova, Marija Bjelakovic, Christian Gluud | |
Differences between protocol and review
-
Types of outcome measures. Primary outcomes. We followed new recommendations from Cochrane, and changed primary outcomes to: all‐cause mortality, liver‐related mortality, and serious adverse events.
-
Types of outcome measures. Secondary outcomes. We followed new recommendations from Cochrane, and changed secondary outcomes to: liver‐related morbidity, health‐related quality of life, and non‐serious adverse events. We moved the other planned secondary outcomes: vitamin D status, bone mineral density, biochemical indices, failure of virological response, and acute cellular rejection in liver transplant recipients under 'Exploratory outcomes'. We added alkaline phosphatase, triglyceride, cholesterol, and calcium to exploratory outcome 'biochemical indices' to be able to analyse the effect of vitamin D supplementation on the broader spectrum of biochemical indices.
-
Data synthesis. We considered a P value of 0.025 or less, two‐tailed, as statistically significant if the required information size was reached due to our three primary outcomes (Jakobsen 2014).
-
Data synthesis. In our Trial Sequential Analysis, the diversity‐adjusted required information size was based on the event proportion in the control group; assumption of a plausible relative risk reduction; a risk of type I error of 2.5%; a risk of type II error of 10%; and the observed diversity of the included trials in the meta‐analysis (Jakobsen 2014; Wetterslev 2017).
-
Marko Bjelakovic joined the team of authors during the preparation of the review and Marija Bjelakovic left the team of authors during the preparation of the review.
Notes
Cochrane Reviews can be expected to have a high percentage of overlap in the methods section because of standardised methods. In addition, overlap may be observed across some of our protocols and reviews as they share at least three common authors.
Keywords
MeSH
Medical Subject Headings (MeSH) Keywords
Medical Subject Headings Check Words
Adult; Female; Humans; Male; Middle Aged;
PICO
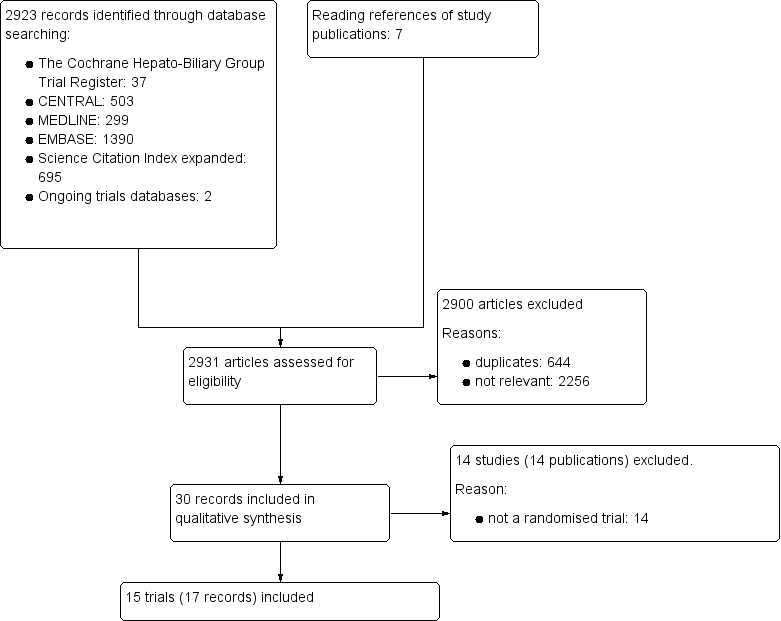
Study flow diagram
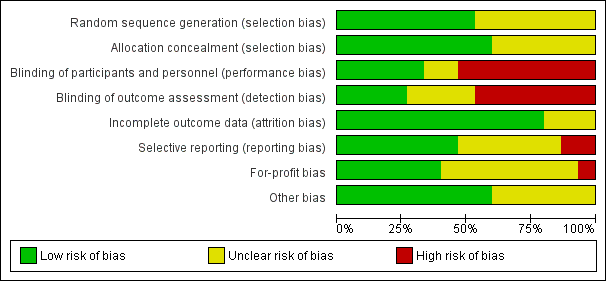
Risk of bias graph: review authors' judgements about each risk of bias item presented as percentages across all included studies.

Risk of bias summary: review authors' judgements about each risk of bias item for each included study.

Funnel plot of comparison: 1 Vitamin D versus placebo or no intervention, outcome: 1.1 All‐cause mortality.

Trial Sequential Analysis on all‐cause mortality up to 1.4‐year follow‐up in 15 vitamin D trials, based on mortality rate in the control group of 10%, a relative risk reduction of 28% in the intervention group, a type I error of 2.5%, and type II error of 10% (90% power). There was no diversity. The required information size was 6396 participants. The cumulative Z‐curve (blue line) did not cross the trial sequential monitoring boundary for benefit or harm (red inward sloping lines) and did not enter the trial sequential monitoring area for futility (inner‐wedge with red outward sloping lines).
Trial Sequential Analysis on rapid virological response in the two vitamin D trials was performed based on a mortality rate in the control group of 5%, a relative risk reduction (RRR) of 30% in the intervention group, a type I error of 2.5%, and type II error of 10% (90% power). There was no diversity. The required information size was 11958 participants. The cumulative Z‐curve crossed the conventional monitoring boundary for benefit. The trial sequential monitoring boundary is ignored due to little information use (1.56%).

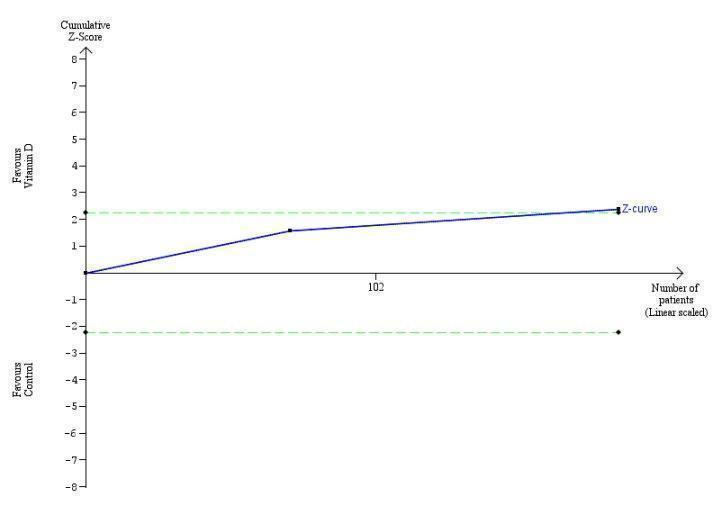
Trial Sequential Analysis on early virological response in the two vitamin D trials was performed based on a mortality rate in the control group of 5%, a relative risk reduction (RRR) of 30% in the intervention group, a type I error of 2.5%, and type II error of 10% (90% power). There was no diversity. The required information size was 11958 participants. The cumulative Z‐curve crossed the conventional monitoring boundary for benefit. The trial sequential monitoring boundary is ignored due to little information use (1.17%).

Trial Sequential Analysis on sustained virological response in the five vitamin D trials was performed based on a mortality rate in the control group of 5%, a relative risk reduction (RRR) of 30% in the intervention group, a type I error of 2.5%, and type II error of 10% (90% power). There was no diversity. The required information size was 69798 participants. The trial sequential monitoring boundary is ignored due to little information use (0.45%).

Trial Sequential Analysis on acute cellular rejection in the one vitamin D trial was performed based on a mortality rate in the control group of 5%, a relative risk reduction (RRR) of 30% in the intervention group, a type I error of 2.5%, and type II error of 10% (90% power). There was no diversity. The required information size was 11958 participants. The cumulative Z‐curve did not cross the conventional monitoring boundary. The trial sequential monitoring boundary is ignored due to little information use (0.84%).

Comparison 1 Vitamin D versus placebo or no intervention, Outcome 1 All‐cause mortality.

Comparison 1 Vitamin D versus placebo or no intervention, Outcome 2 All‐cause mortality ('best‐worst' case and 'worst‐best' case scenarios).

Comparison 1 Vitamin D versus placebo or no intervention, Outcome 3 Liver‐related mortality.

Comparison 1 Vitamin D versus placebo or no intervention, Outcome 4 Serious adverse events.

Comparison 1 Vitamin D versus placebo or no intervention, Outcome 5 Non‐serious adverse events.

Comparison 1 Vitamin D versus placebo or no intervention, Outcome 6 Failure of rapid virological response.
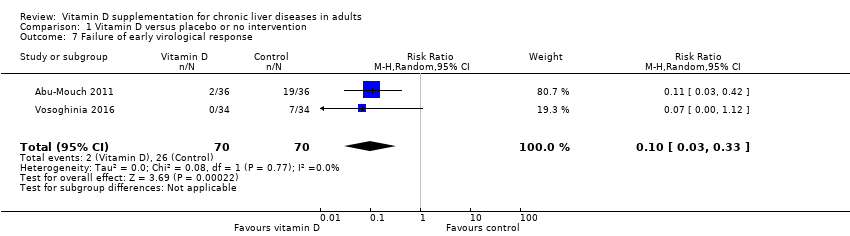
Comparison 1 Vitamin D versus placebo or no intervention, Outcome 7 Failure of early virological response.
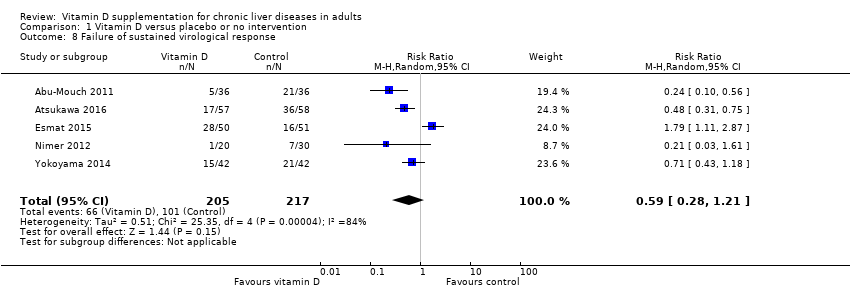
Comparison 1 Vitamin D versus placebo or no intervention, Outcome 8 Failure of sustained virological response.
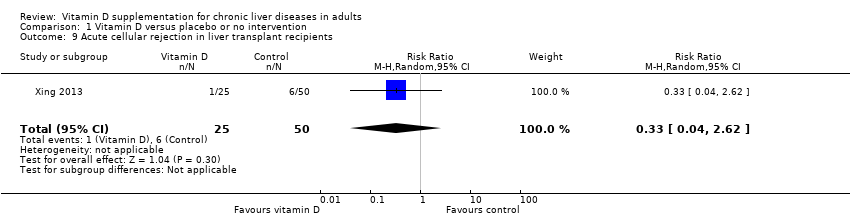
Comparison 1 Vitamin D versus placebo or no intervention, Outcome 9 Acute cellular rejection in liver transplant recipients.

Comparison 1 Vitamin D versus placebo or no intervention, Outcome 10 Vitamin D status (ng/mL).
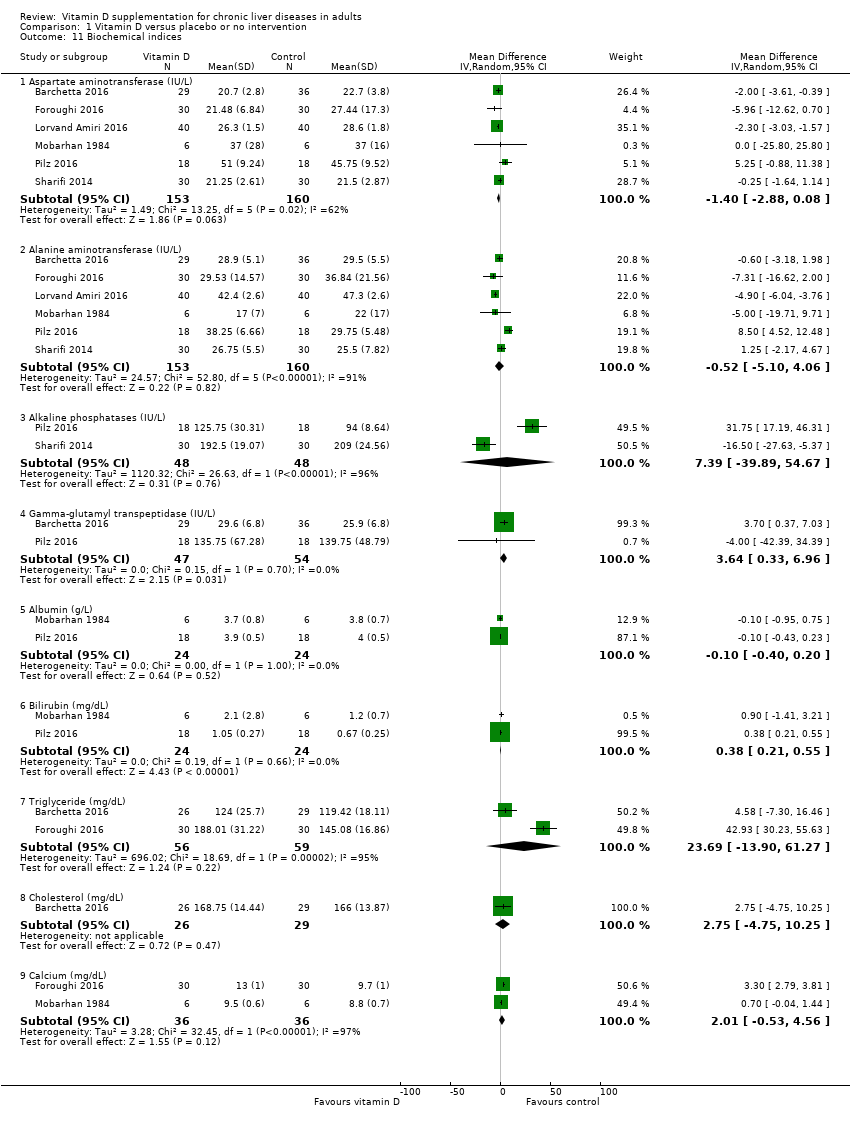
Comparison 1 Vitamin D versus placebo or no intervention, Outcome 11 Biochemical indices.
| Vitamin D compared to placebo or no intervention for chronic liver diseases in adults | ||||||
| Patient or population: adults with chronic liver diseases. | ||||||
| Outcomes | Anticipated absolute effects* (95% CI) | Relative effect | № of participants | Quality of the evidence | Comments | |
| Risk with placebo or no intervention | Risk with vitamin D | |||||
| All‐cause mortality at the end of follow‐up Follow‐up: 0.1 to 1.4, mean 0.6 years | Study population | OR 0.70 | 1034 | ⊕⊝⊝⊝ | Trial Sequential Analyses‐adjusted CI was 0.00 to 2534. | |
| 4 per 1.000 | 3 per 1.000 | |||||
| Liver‐related mortality Follow‐up: mean 1 year | Study population | RR 1.62 | 18 | ⊕⊝⊝⊝ | Due to few data, we did not conduct Trial Sequential Analysis which would only have revealed larger imprecision. | |
| 0 per 1.000 | 0 per 1.000 | |||||
| Serious adverse events ‐ hypercalcaemia Follow‐up: mean 1 year | Study population | RR 5.00 | 76 | ⊕⊝⊝⊝ | Due to few data, we did not conduct Trial Sequential Analysis which would only have revealed larger imprecision. | |
| 0 per 1.000 | 0 per 1.000 | |||||
| Serious adverse events ‐ myocardial infarction Follow‐up: 0.2 to 1, mean 0.6 years | Study population | RR 0.75 | 86 | ⊕⊝⊝⊝ | Due to few data, we did not conduct Trial Sequential Analysis which would only have revealed larger imprecision. | |
| 25 per 1.000 | 19 per 1.000 | |||||
| Serious adverse events ‐ thyroiditis Follow‐up: mean 0.2 years | Study population | RR 0.33 | 68 | ⊕⊝⊝⊝ | Due to few data, we did not conduct Trial Sequential Analysis which would only have revealed larger imprecision. | |
| 29 per 1.000 | 10 per 1.000 | |||||
| Failure of sustained virological response Follow‐up: 0.3 to 1.4, mean 0.9 years | Study population | RR 0.59 | 422 | ⊕⊝⊝⊝ Very low 1,2,3,6 | The trial sequential monitoring boundary is ignored due to little information use (0.6%). | |
| 465 per 1.000 | 275 per 1.000 | |||||
| Acute cellular rejection in liver transplant recipients Follow‐up: mean 0.08 years | Study population | RR 0.33 | 75 | ⊕⊝⊝⊝ Very low 1,3,7 | The trial sequential monitoring boundary is ignored due to little information use (0.84%). | |
| 120 per 1.000 | 40 per 1.000 | |||||
| *The risk in the intervention group (and its 95% confidence interval) is based on the assumed risk in the comparison group and the relative effect of the intervention (and its 95% CI). | ||||||
| GRADE Working Group grades of evidence
| ||||||
| 1 Downgraded one level due to risk of bias: all trials were at high risk of bias. | ||||||
| Study ID | Protocol | Design | Groups | Bias | Blinding | Participants | Women | Mean |
| Yes | Parallel | 2 | High | NI | 72 | 44 | 47 | |
| No | Parallel | 2 | High | NI | 115 | 50 | 64 | |
| Yes | Parallel | 2 | High | PL | 65 | 35 | 59 | |
| No | Parallel | 2 | High | NI | 101 | 25 | 40 | |
| Yes | Parallel | 2 | High | PL | 60 | 52 | 48 | |
| Yes | Parallel | 3 | High | PL | 120 | 38 | 41 | |
| No | Parallel | 3 | High | NI | 18 | 0 | 61 | |
| No | Parallel | 2 | High | NI | 50 | 58 | 47 | |
| Yes | Parallel | 2 | High | PL | 36 | 25 | 61 | |
| No | Parallel | 2 | High | PL | 60 | 51 | 60 | |
| No | Parallel | 2 | High | NI | 76 | 66 | 61 | |
| No | Parallel | 2 | High | NI | 34 | 100 | 56 | |
| Yes | Parallel | 2 | High | NI | 68 | 13 | 42 | |
| No | Parallel | 3 | High | PL | 75 | 17 | 48 | |
| No | Parallel | 2 | High | NI | 84 | 49 | 59 | |
| n: number of participants; NI: no intervention; PL: placebo. | ||||||||
| Study ID | Participants | Outcome measures | Sponsor | Country |
| Chronic hepatitis C genotype 1 | Sustained virological response | No information | Israel | |
| Chronic hepatitis C genotype 1 | Sustained virological response | No information | Japan | |
| NAFLD | Liver steatosis, liver function | No | Italy | |
| Chronic hepatitis C genotype 4 | Sustained virological response | No information | Egypt | |
| NAFLD | Liver steatosis, liver function | No | Iran | |
| NAFLD | Liver function, body fat | No | Iran | |
| Liver cirrhosis | Bone mineral density | Yes | USA | |
| Chronic hepatitis C genotype 2 or 3 | Sustained virological response | No information | Israel | |
| Liver cirrhosis | Vitamin D status, liver function | No | Austria | |
| NAFLD | Liver function, insulin resistance index | No | Iran | |
| Liver cirrhosis | Bone mineral density | No information | Japan | |
| Primary biliary cirrhosis | Bone mineral density | No information | Japan | |
| Chronic hepatitis C genotype 1,2,3,4 | Early virological response | No | Iran | |
| Liver transplant recipients | Acute cellular rejection rate | No | China | |
| Chronic hepatitis C genotype 1 | Sustained virological response | No information | Japan | |
| NAFLD: non‐alcoholic fatty liver disease. | ||||
| Study ID | Vitamin | Calcium | Regimen* | Treatment | Follow‐up | Cointervention | |||
| D3 | D2 | 25(OH)D | 1,25(OH)2D | ||||||
| 2000 | ‐ | ‐ | ‐ | ‐ | Daily | 48 | 72 | PEG‐INF, RBV | |
| 2000 | ‐ | ‐ | ‐ | ‐ | Daily | 16 | 16 | PEG‐INF, RBV, SP | |
| 2000 | ‐ | ‐ | ‐ | ‐ | Daily | 24 | 24 | ‐ | |
| 2143 | ‐ | ‐ | ‐ | ‐ | Weekly | 48 | 72 | PEG‐INF, RBV | |
| 7143 | ‐ | ‐ | ‐ | ‐ | Weekly | 10 | 10 | ‐ | |
| 1000 | ‐ | ‐ | ‐ | 500 | Daily | 10 | 12 | ‐ | |
| ‐ | 17,857 | 2400 | ‐ | ‐ | Daily | 52 | 52 | ‐ | |
| 2000 | ‐ | ‐ | ‐ | ‐ | Daily | 24 | 48 | PEG‐INF, RBV | |
| 2800 | ‐ | ‐ | ‐ | ‐ | Daily | 8 | 8 | ‐ | |
| 3571 | ‐ | ‐ | ‐ | ‐ | Twice a week | 16 | 16 | ‐ | |
| ‐ | ‐ | ‐ | 1 | ‐ | Daily | 52 | 52 | ‐ | |
| ‐ | ‐ | ‐ | 1 | ‐ | Daily | 52 | 52 | ‐ | |
| 1600 | ‐ | ‐ | ‐ | ‐ | Daily | 12 | 12 | PEG‐INF, RBV | |
| ‐ | ‐ | ‐ | 0.25 | 1000 | Daily | 4 | 4 | ‐ | |
| 1000 | ‐ | ‐ | ‐ | ‐ | Daily | 16 | 24 | PEG‐INF, RBV | |
| * Vitamin D was administered orally in all trials. | |||||||||
| Outcome or subgroup title | No. of studies | No. of participants | Statistical method | Effect size |
| 1 All‐cause mortality Show forest plot | 15 | 1034 | Peto Odds Ratio (Peto, Fixed, 95% CI) | 0.70 [0.09, 5.38] |
| 2 All‐cause mortality ('best‐worst' case and 'worst‐best' case scenarios) Show forest plot | 15 | Peto Odds Ratio (Peto, Fixed, 95% CI) | Subtotals only | |
| 2.1 'Best‐worst' case scenario | 15 | 1034 | Peto Odds Ratio (Peto, Fixed, 95% CI) | 0.11 [0.05, 0.24] |
| 2.2 'Worst‐best' case scenario | 15 | 1034 | Peto Odds Ratio (Peto, Fixed, 95% CI) | 7.80 [3.67, 16.57] |
| 3 Liver‐related mortality Show forest plot | 1 | 18 | Risk Ratio (M‐H, Random, 95% CI) | 1.62 [0.08, 34.66] |
| 4 Serious adverse events Show forest plot | 3 | Risk Ratio (M‐H, Random, 95% CI) | Subtotals only | |
| 4.1 Hypercalcaemia | 1 | 76 | Risk Ratio (M‐H, Random, 95% CI) | 5.0 [0.25, 100.80] |
| 4.2 Myocardial infarction | 2 | 86 | Risk Ratio (M‐H, Random, 95% CI) | 0.75 [0.08, 6.81] |
| 4.3 Thyroiditis | 1 | 68 | Risk Ratio (M‐H, Random, 95% CI) | 0.33 [0.01, 7.91] |
| 5 Non‐serious adverse events Show forest plot | 1 | Risk Ratio (M‐H, Random, 95% CI) | Subtotals only | |
| 5.1 Glossitis | 1 | 65 | Risk Ratio (M‐H, Random, 95% CI) | 3.70 [0.16, 87.58] |
| 6 Failure of rapid virological response Show forest plot | 2 | 187 | Risk Ratio (M‐H, Random, 95% CI) | 0.70 [0.52, 0.94] |
| 7 Failure of early virological response Show forest plot | 2 | 140 | Risk Ratio (M‐H, Random, 95% CI) | 0.10 [0.03, 0.33] |
| 8 Failure of sustained virological response Show forest plot | 5 | 422 | Risk Ratio (M‐H, Random, 95% CI) | 0.59 [0.28, 1.21] |
| 9 Acute cellular rejection in liver transplant recipients Show forest plot | 1 | 75 | Risk Ratio (M‐H, Random, 95% CI) | 0.33 [0.04, 2.62] |
| 10 Vitamin D status (ng/mL) Show forest plot | 6 | 424 | Mean Difference (IV, Random, 95% CI) | 17.24 [12.46, 22.02] |
| 11 Biochemical indices Show forest plot | 6 | Mean Difference (IV, Random, 95% CI) | Subtotals only | |
| 11.1 Aspartate aminotransferase (IU/L) | 6 | 313 | Mean Difference (IV, Random, 95% CI) | ‐1.40 [‐2.88, 0.08] |
| 11.2 Alanine aminotransferase (IU/L) | 6 | 313 | Mean Difference (IV, Random, 95% CI) | ‐0.52 [‐5.10, 4.06] |
| 11.3 Alkaline phosphatases (IU/L) | 2 | 96 | Mean Difference (IV, Random, 95% CI) | 7.39 [‐39.89, 54.67] |
| 11.4 Gamma‐glutamyl transpeptidase (IU/L) | 2 | 101 | Mean Difference (IV, Random, 95% CI) | 3.64 [0.33, 6.96] |
| 11.5 Albumin (g/L) | 2 | 48 | Mean Difference (IV, Random, 95% CI) | ‐0.10 [‐0.40, 0.20] |
| 11.6 Bilirubin (mg/dL) | 2 | 48 | Mean Difference (IV, Random, 95% CI) | 0.38 [0.21, 0.55] |
| 11.7 Triglyceride (mg/dL) | 2 | 115 | Mean Difference (IV, Random, 95% CI) | 23.69 [‐13.90, 61.27] |
| 11.8 Cholesterol (mg/dL) | 1 | 55 | Mean Difference (IV, Random, 95% CI) | 2.75 [‐4.75, 10.25] |
| 11.9 Calcium (mg/dL) | 2 | 72 | Mean Difference (IV, Random, 95% CI) | 2.01 [‐0.53, 4.56] |