Xpert® MTB/RIF assay for pulmonary tuberculosis and rifampicin resistance in adults
Información
- DOI:
- https://doi.org/10.1002/14651858.CD009593.pub2Copiar DOI

- Base de datos:
-
- Cochrane Database of Systematic Reviews
- Versión publicada:
-
- 31 enero 2013see what's new
- Tipo:
-
- Diagnostic
- Etapa:
-
- Review
- Grupo Editorial Cochrane:
-
Grupo Cochrane de Enfermedades infecciosas
- Copyright:
-
- Copyright © 2013 The Authors. Cochrane Database of Systematic Reviews published by John Wiley & Sons, Ltd. on behalf of The Cochrane Collaboration.
- This is an open access article under the terms of the Creative Commons Attribution‐Non‐Commercial Licence, which permits use, distribution and reproduction in any medium, provided the original work is properly cited and is not used for commercial purposes.
Cifras del artículo
Altmetric:
Citado por:
Autores
Contributions of authors
MP had the original idea for the review. KRS and MP wrote the protocol with input from HS and ND. LAK drafted the search strategy. KRS and HS reviewed articles for inclusion and extracted data. KRS, IS, and ND analysed the data. KRS, MP, and ND interpreted the analyses. KRS drafted the manuscript. ND drafted the statistical analysis section and Appendix 4. KRS, LAK, CCB, MP, and ND provided critical revisions to the manuscript.
Sources of support
Internal sources
-
Liverpool School of Tropical Medicine, UK.
External sources
-
McGill University, Canada.
Declarations of interest
The editorial base for the Cochrane Infectious Diseases Group (CIDG) is funded by the UK Department for International Development (DFID) for the benefit of developing countries. CIDG provided funding in part for this review. KRS serves as Co‐ordinator of the Evidence Synthesis and Policy Subgroup of Stop TB Partnership's New Diagnostics Working Group. KRS received funding to carry out the review from CIDG and McGill University. MP is a recipient of a New Investigator Award from the Canadian Institutes of Health Research (CIHR) and a salary award from Fonds de recherche du Québec ‐ Santé. MP serves as an external consultant for the Bill & Melinda Gates Foundation. CCB is employed by the Foundation for Innovative New Diagnostics (FIND) and has conducted studies and published on Xpert MTB/RIF as part of a collaborative project between FIND, a Swiss non‐profit, Cepheid, a US company, and academic partners. The product developed through this partnership was developed under a contract that obligated FIND to pay for development costs and trial costs and that obligated Cepheid to make the test available at specified preferential pricing to the public sector in developing countries. The authors have no financial involvement with any organization or entity with a financial interest in or financial conflict with the subject matter or materials discussed in the review apart from those disclosed.
Acknowledgements
We wish to thank all authors of the included studies for answering our questions and providing additional data. We are grateful to Vittoria Lutje, Liverpool School of Tropical Medicine, for help with the search strategy. We also wish to thank Edward Desmond, California State Department of Health, for his comments on alternative TB tests, and Ellen Jo Baron, Cepheid, for her comments on the index test. In addition, we wish to thank Matteo Zignol, WHO Stop TB Department, for providing the prevalence rates for MDR‐TB. We also wish to thank Selcan Alptekin, Rothamsted Research, for her help with translation.
The editorial base of the Cochrane Infectious Diseases Group is funded by UKaid from the UK Government for the benefit of developing countries.
Version history
| Published | Title | Stage | Authors | Version |
| 2021 Feb 22 | Xpert Ultra versus Xpert MTB/RIF for pulmonary tuberculosis and rifampicin resistance in adults with presumptive pulmonary tuberculosis | Review | Jerry S Zifodya, Jonah S Kreniske, Ian Schiller, Mikashmi Kohli, Nandini Dendukuri, Samuel G Schumacher, Eleanor A Ochodo, Frederick Haraka, Alice A Zwerling, Madhukar Pai, Karen R Steingart, David J Horne | |
| 2019 Jun 07 | Xpert MTB/RIF and Xpert MTB/RIF Ultra for pulmonary tuberculosis and rifampicin resistance in adults | Review | David J Horne, Mikashmi Kohli, Jerry S Zifodya, Ian Schiller, Nandini Dendukuri, Deanna Tollefson, Samuel G Schumacher, Eleanor A Ochodo, Madhukar Pai, Karen R Steingart | |
| 2014 Jan 21 | Xpert® MTB/RIF assay for pulmonary tuberculosis and rifampicin resistance in adults | Review | Karen R Steingart, Ian Schiller, David J Horne, Madhukar Pai, Catharina C Boehme, Nandini Dendukuri | |
| 2013 Jan 31 | Xpert® MTB/RIF assay for pulmonary tuberculosis and rifampicin resistance in adults | Review | Karen R Steingart, Hojoon Sohn, Ian Schiller, Lorie A Kloda, Catharina C Boehme, Madhukar Pai, Nandini Dendukuri | |
| 2012 Jan 18 | Xpert MTB/RIF test for detection of pulmonary tuberculosis and rifampicin resistance | Protocol | Hojoon Sohn, Madhukar Pai, Nandini Dendukuri, Lorie A Kloda, Catharina C Boehme, Karen R Steingart | |
Differences between protocol and review
In the protocol we stated that we would extract data on industry sponsorship. However, we became aware that the Foundation for Innovative New Diagnostics (FIND) had negotiated a special price for the assay for TB endemic countries. As the majority of the included study centres were located in TB endemic countries, we assumed Xpert had been purchased at the negotiated price. Therefore, we did not consider the included studies to be sponsored by industry.
We compared the accuracy of Xpert for TB detection in high‐income versus low‐ and middle‐income countries. This comparison was not mentioned in the protocol. NTMs were not mentioned in the protocol. We summarized separately data for NTM by determining the percent of false‐positive Xpert results in samples that grew NTMs.
We stated we would discuss the consequences when an indeterminate test result was considered to be a (false) true negative result (may lead to missed/delayed diagnosis, with potential for increased morbidity, mortality, and TB transmission), or considered to be a (false) true positive result (may lead to unnecessary treatment with adverse events and increased anxiety). Since the rate of indeterminate results was very low, we did not discuss these consequences.
Exploration of different reference standards, culture‐confirmed, clinical, etc, while an interesting and important question was beyond what we could carryout in an already complex review, with two review questions and multiple factors that could affect the results (condition of specimen, income status, clinical subgroups, etc).
We performed additional sensitivity analyses for studies that did not clearly report the reason for testing and clinical information about patients and for studies that did not explicitly report patient age.
We initially used QUADAS, as mentioned in the protocol, but while we were preparing the review, we received a communication advising use of QUADAS‐2 for all future reviews. As we had received training in QUADAS‐2, we decided to use QUADAS‐2 for the current review.
Keywords
MeSH
Medical Subject Headings (MeSH) Keywords
- *Drug Resistance, Bacterial;
- Antibiotics, Antitubercular [*therapeutic use];
- Mycobacterium tuberculosis [*drug effects, genetics, *isolation & purification];
- Polymerase Chain Reaction [*methods];
- Rifampin [*therapeutic use];
- Sensitivity and Specificity;
- Sequence Analysis, DNA [methods];
- Tuberculosis, Pulmonary [diagnosis, *drug therapy];
Medical Subject Headings Check Words
Adult; Humans;

Readout of Xpert MTB/RIF assay for a TB positive, rifampicin‐susceptible specimen. Courtesy: Karin Weyer, The WHO STOP TB Department.

Flow diagram of studies in the review.
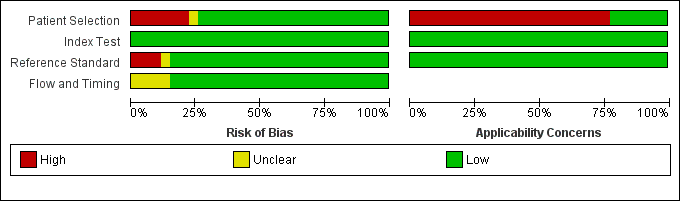
Risk of bias and applicability concerns graph: review authors' judgements about each domain presented as percentages across the 27 included study centres (18 studies). The reference standard domain pertains to TB as the target condition. See text for the reference standard pertaining to rifampicin resistance.

Risk of bias and applicability concerns summary: review authors' judgements about each domain for each included study centre.
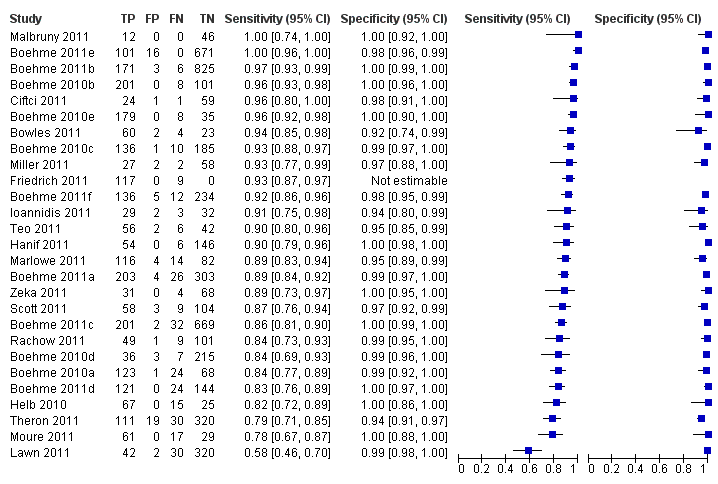
Forest plots of Xpert sensitivity and specificity for TB detection, Xpert used as an initial test replacing smear microscopy. The individual studies are ordered by decreasing sensitivity. TP = True Positive; FP = False Positive; FN = False Negative; TN = True Negative. Between brackets are the 95% CI of sensitivity and specificity. The figure shows the estimated sensitivity and specificity of the study (blue square) and its 95% CI (black horizontal line). Xpert specificity could not be estimated in one study.

Summary plots of Xpert sensitivity and specificity for TB detection, Xpert used as an initial test replacing smear microscopy. Each individual study is represented by an empty square. The size of the square is proportional to the sample size of the study such that larger studies are represented by larger squares. The filled circle is the pooled median estimate for sensitivity and specificity. The solid curves represent the 95% credible region around the summary estimate; the dashed curves represent the 95% prediction region.
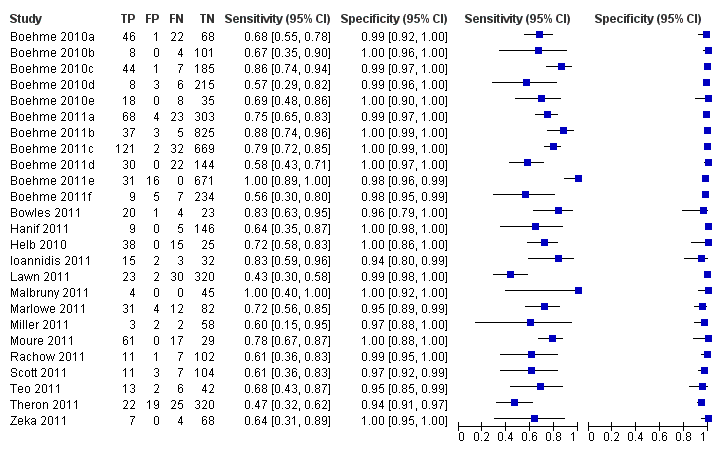
Forest plots of Xpert for TB detection, Xpert used as an add‐on test following a negative smear microscopy result. TP = True Positive; FP = False Positive; FN = False Negative; TN = True Negative. Between brackets the 95% CI of sensitivity and specificity. The figure shows the estimated sensitivity and specificity of the study (blue square) and its 95% CI (black horizontal line).

Summary plots of Xpert sensitivity and specificity for TB detection, Xpert used as an add‐on test following a negative smear microscopy result. Each individual study is represented by an empty square. The size of the square is proportional to the sample size of the study such that larger studies are represented by larger squares. The filled circle is the pooled median estimate for sensitivity and specificity. The solid curve represents the 95% credible region around the summary estimate; the dashed curves represent the 95% prediction region.

Forest plot of Xpert sensitivity for TB detection in smear‐positive subgroup. The squares represent the sensitivity and specificity of one study, the black line its CI. TP = true positive; FP = false positive; FN = false negative; TN = true negative. Xpert specificity could not be estimated in these studies.
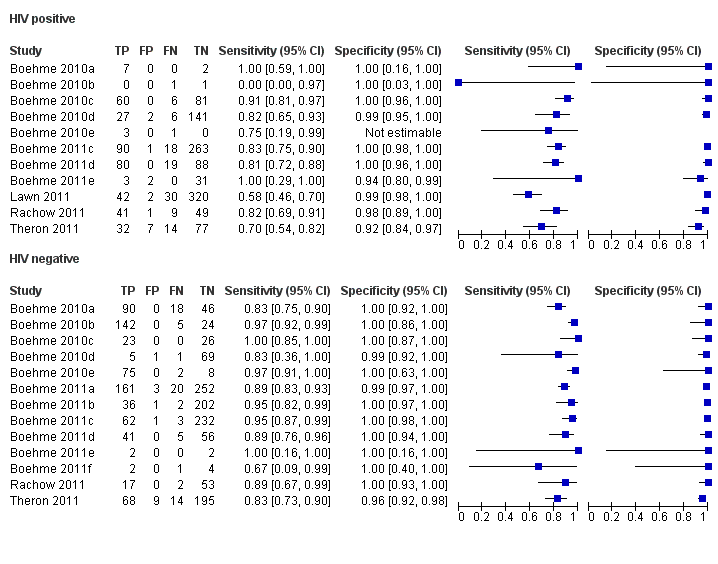
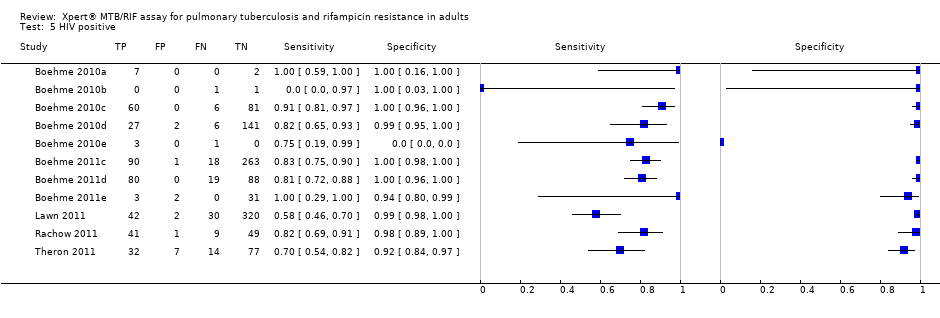
Forest plots of Xpert sensitivity and specificity for TB detection in HIV‐positive and HIV‐negative subgroups. The squares represent the sensitivity and specificity of one study and the black line represent its CI. TP = true positive; FP = false positive; FN = false negative; TN = true negative.

Summary plots of Xpert sensitivity and specificity for TB detection in HIV‐positive (red colour) and HIV‐negative subgroups (black colour). Each individual study is represented by an empty square. The size of the square is proportional to the sample size of the study such that larger studies are represented by larger squares. The filled circles are the median estimates for sensitivity and specificity. The solid curves represent the 95% credible region around the summary estimates; the dashed curves represent the 95% prediction region.

Forest plots of Xpert sensitivity and specificity for detection of rifampicin resistance, Xpert used as an initial test replacing conventional drug susceptibility testing as the initial test. The individual studies are ordered by decreasing sensitivity and decreasing number of true positives. The squares represent the sensitivity and specificity of one study, the black line its CI. TP = true positive; FP = false positive; FN = false negative; TN = true negative.

Summary plots of Xpert sensitivity and specificity for detection of rifampicin resistance, Xpert used as an initial test replacing conventional drug susceptibility testing as the initial test. Each individual study is represented by an empty square. The size of the square is proportional to the sample size of the study such that larger studies are represented by larger squares. The filled circle is the pooled median estimate for sensitivity and specificity. The solid curves represent the 95% credible region around the summary estimate; the dashed curves represent the 95% prediction region.

Bayesian bivariate hierarchical model, likelihood
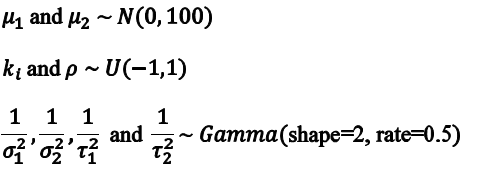
Bayesian bivariate hierarchical model, prior distributions

TB detection, all studies.


TB detection, condition of specimen.
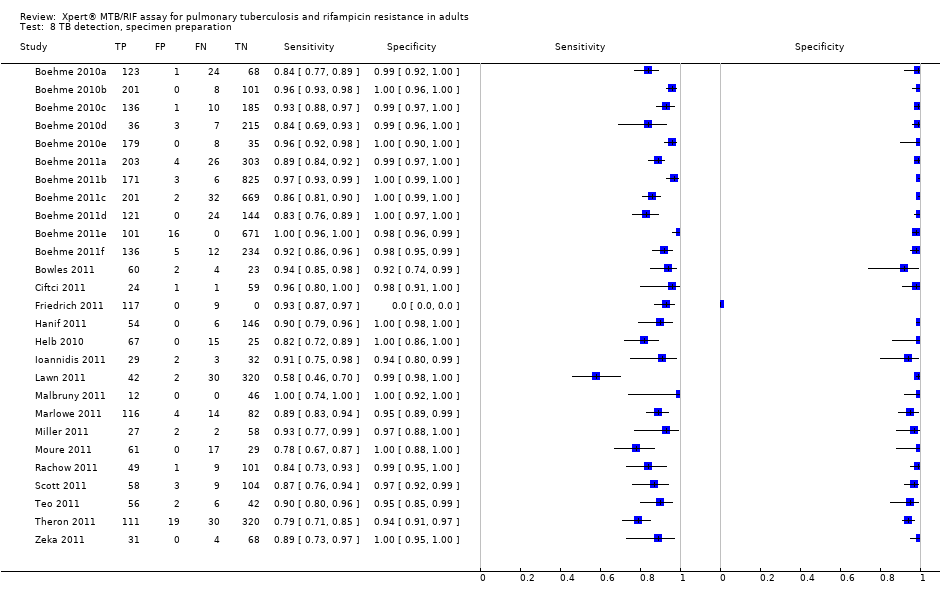
TB detection, specimen preparation.


Rifampicin resistance.
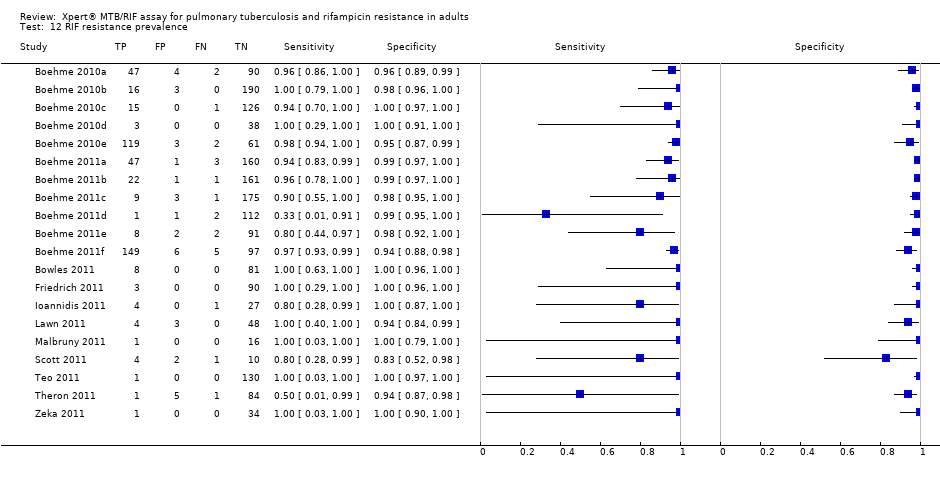
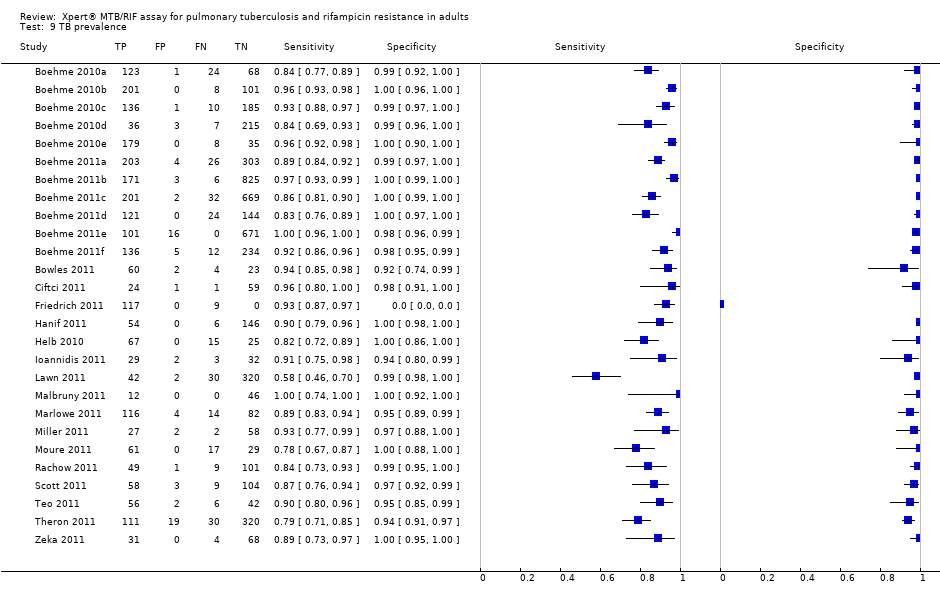
RIF resistance prevalence.
| Review question: What is the diagnostic accuracy of Xpert MTB/RIF assay for detection of pulmonary TB and detection of rifampicin resistance? Patients/population: Adults suspected of having pulmonary TB or MDR‐TB (for TB detection); confirmed TB cases (for rifampicin resistance detection) Purpose: TB detection: Xpert MTB/RIF assay used as an initial test replacing microscopy and used as an add‐on test following a negative smear microscopy result. Rifampicin resistance detection: Xpert MTB/RIF assay as an initial test replacing conventional phenotypic drug susceptibility testing Setting: Basic laboratories and primary health facilities (peripheral health services level) Index test: Xpert MTB/RIF assay Importance: Compared with culture and conventional drug susceptibility testing, Xpert MTB/RIF assay could have considerable advantages for scaling up programmatic management of TB by offering rapid diagnosis nearer to the point of care, standardized testing, potential for high throughput, and fewer requirements for laboratory biosafety Reference standards: TB: solid or liquid culture; rifampicin resistance: phenotypic drug susceptibility testing Studies: Cross‐sectional | |||||
| Diagnostic accuracy for TB detection | |||||
| Type of analysis | Effect (95% credible interval) | No. of participants (studies) | What do these results mean given 5% prevalence of TB among individuals suspected of having pulmonary TB?
| What do these results mean given 15% prevalence of TB among individuals suspected of having pulmonary TB? | What do these results mean given 30% prevalence of TB among individuals suspected of having pulmonary TB?
|
| TB detection, Xpert used as an initial test replacing microscopy | Pooled median sensitivity 88% (83, 92) and pooled median specificity 98% (97, 98)
| 7517 (15) | With a prevalence of 5%, 50/1000 individuals will have pulmonary TB. Of these, 44 (TP) will be identified; 6 (FN) will be missed. Of the 950 individuals without TB, 931 (TN) will not be treated; 19 (FP) may be unnecessarily treated | With a prevalence of 15%, 150/1000 individuals will have pulmonary TB. Of these, 132 (TP) will be identified; 18 (FN) will be missed. Of the 850 individuals without TB, 833 (TN) will not be treated; 17 (FP) may be unnecessarily treated | With a prevalence of 30%, 300/1000 individuals will have pulmonary TB. Of these, 264 (TP) will be identified; 36 (FN) will be missed. Of the 700 individuals without TB, 686 (TN) will not be treated; 14 (FP) may be unnecessarily treated |
| TB detection, Xpert used as an add‐on test following a negative smear microscopy result | Pooled median sensitivity 67% (58, 74) and pooled median specificity 98% (97, 98)
| 5719 (14) | With a prevalence of 5%, 50/1000 individuals will have pulmonary TB. Of these, 34 (TP) will be identified; 16 (FN) will be missed. Of the 950 individuals without TB, 931 (TN) will not be treated; 19 (FP) may be unnecessarily treated | With a prevalence of 15%, 150/1000 individuals will have pulmonary TB. Of these, 101 (TP) will be identified; 49 (FN) will be missed. Of the 850 individuals without TB, 833 (TN) will not be treated; 17 (FP) may be unnecessarily treated | With a prevalence of 30%, 300/1000 individuals will have pulmonary TB. Of these, 201 (TP) will be identified; 99 (FN) will be missed. Of the 700 individuals without TB, 686 (TN) will not be treated; 14 (FP) may be unnecessarily treated |
| Smear‐positive, culture‐positive subgroup, within‐ study comparison | Pooled median sensitivity 98% (97, 99); specificity of Xpert could not be estimated in these studies | 1735 (15) | With a prevalence of 5%, 50/1000 individuals will have pulmonary TB. Of these, 49 (TP) will be identified; 1 (FN) will be missed | With a prevalence of 15%, 150/1000 individuals will have pulmonary TB. Of these, 147 (TP) will be identified; 3 (FN) will be missed | With a prevalence of 30%, 300/1000 individuals will have pulmonary TB. Of these, 294 (TP) will be identified; 6 (FN) will be missed |
| Smear‐negative, culture‐positive subgroup | Pooled median sensitivity 68% (59, 75) and pooled median specificity 98% (97, 99) | 5771 (15) | With a prevalence of 5%, 50/1000 individuals will have pulmonary TB. Of these, 34 (TP) will be identified; 16 (FN) will be missed. Of the 950 individuals without TB, 931 (TN) will not be treated; 19 (FP) may be unnecessarily treated | With a prevalence of 15%, 150/1000 individuals will have pulmonary TB. Of these, 102 (TP) will be identified; 48 (FN) will be missed. Of the 850 individuals without TB, 833 (TN) will not be treated; 17 (FP) may be unnecessarily treated | With a prevalence of 30%, 300/1000 individuals will have pulmonary TB. Of these, 204 (TP) will be identified; 96 (FN) will be missed. Of the 700 individuals without TB, 686 (TN) will not be treated; 14 (FP) may be unnecessarily treated |
| HIV‐positive subgroup | Pooled median sensitivity 80% (67, 88) and pooled median specificity 97% (93, 99) | 1163 (4) | With a prevalence of 5%, 50/1000 individuals will have pulmonary TB. Of these, 40 (TP) will be identified; 10 (FN) will be missed. Of the 950 individuals without TB, 922 (TN) will not be treated; 28 (FP) may be unnecessarily treated | With a prevalence of 15%, 150/1000 individuals will have pulmonary TB. Of these, 120 (TP) will be identified; 30 (FN) will be missed. Of the 850 individuals without TB, 825 (TN) will not be treated; 25 (FP) may be unnecessarily treated | With a prevalence of 30%, 300/1000 individuals will have pulmonary TB. Of these, 240 (TP) will be identified; 60 (FN) will be missed. Of the 700 individuals without TB, 679 (TN) will not be treated; 21 (FP) may be unnecessarily treated |
| HIV‐negative subgroup | Pooled median sensitivity 89% (81, 94) and pooled median specificity 99% (96, 99) | 1981 (4) | With a prevalence of 5%, 50/1000 individuals will have pulmonary TB. Of these, 45 (TP) will be identified; 5 (FN) will be missed. Of the 950 individuals without TB, 941 (TN) will not be treated; 9 (FP) may be unnecessarily treated | With a prevalence of 15%, 150/1000 individuals will have pulmonary TB. Of these, 134 (TP) will be identified; 16 (FN) will be missed. Of the 850 individuals without TB, 842 (TN) will not be treated; 8 (FP) may be unnecessarily treated | With a prevalence of 30%, 300/1000 individuals will have pulmonary TB. Of these, 267 (TP) will be identified; 33 (FN) will be missed. Of the 700 patients individuals without TB, 693 (TN) will not be treated; 7 (FP) may be unnecessarily treated |
| Diagnostic accuracy for detection of rifampicin resistance | |||||
| Type of analysis | Effect (95% credible interval) | No. of participants (studies) | What do these results mean given 2% prevalence of rifampicin resistance among individuals with TB? | What do these results mean given 15% prevalence of rifampicin resistance among individuals with TB? | What do these results mean given 30% prevalence of rifampicin resistance among individuals with TB? |
| Rifampicin resistance detection, Xpert used as an initial test replacing conventional drug susceptibility testing | Pooled median sensitivity 94% (87, 97) and pooled median specificity 98% (97, 99) | 2340 (11) | With a prevalence of 2%, 20/1000 will have rifampicin resistance. Of these, 19 (TP) will be identified; 1 (FN) will be missed. Of the 980 patients with TB sensitive to rifampicin, 960 (TN) will not be treated; 20 (FP) may be unnecessarily treated | With a prevalence of 15%, 150/1000 will have rifampicin resistance. Of these, 141 (TP) will be identified; 9 (FN) will be missed. Of the 850 patients with TB sensitive to rifampicin, 833 (TN) will not be treated; 17 (FP) may be unnecessarily treated | With a prevalence of 30%, 300/1000 will have rifampicin resistance Of these, 282 (TP) will be identified; 18 (FN) will be missed. Of the 700 patients with TB sensitive to rifampicin, 686 (TN) will not be treated; 14 (FP) may be unnecessarily treated |
| TP, true positive; FN, false negative; TN, true negative; FP, false positive | |||||
| Type of analysis (Number of studies) | Pooled sensitivity Median (95% credible interval) | Pooled specificity Median (95% credible interval) | Predicted sensitivity Median (95% credible interval) | Predicted specificity Median (95% credible interval) |
| Xpert used as an initial test for TB detection replacing microscopy (15)*
| 88% (83, 92) | 98% (97, 99) | 88% (66, 97) | 98% (92, 100) |
| Xpert used as an add‐on test for TB detection following a negative smear microscopy result (14) | 67% (58, 74) | 98% (97, 99) | 66% (40, 86) | 98% (93, 100) |
| Xpert used as an initial test for rifampicin resistance detection replacing conventional drug susceptibility testing as the initial test (11) | 94% (87, 97) | 98% (97, 99) | 94% (75, 99) | 98% (91, 100) |
| *Three studies that preferentially enrolled smear‐positive or smear‐negative patients were excluded | ||||
| Covariate | Sensitivity Median (95% credible interval) | Specificity Median (95% credible interval) |
| Smear status |
|
|
| Smear + | 98% (97, 99) | *** |
| Smear ‐ | 68% (59, 75) | 98% (97, 99) |
| Difference (Smear+ minus Smear‐) | 31% (23, 39) | ** |
| P (Smear+ > Smear‐) | 1.00 | ** |
| HIV status |
|
|
| HIV+ | 80% (67, 88) | 97% (93, 99) |
| HIV‐ | 89% (81, 94) | 99% (96, 99) |
| Difference (HIV+ minus HIV‐) | ‐9% (‐22, 3) | ‐1% (‐5, 2) |
| P (HIV+ > HIV‐) | 0.06 | 0.21 |
| Condition of specimen |
|
|
| Fresh | 88% (80, 93) | 99% (98, 100) |
| Frozen | 85% (77, 91) | 97% (95, 99) |
| Difference (Fresh minus Frozen) | 3% (‐7, 13) | 2% (0.1, 4) |
| P (Fresh > Frozen) | 0.73 | 0.98 |
| Specimen preparation |
|
|
| Unprocessed | 92% (87, 96) | 99% (97, 99) |
| Processed | 85% (79, 90) | 98% (96, 99) |
| Difference (Unprocessed minus Processed) | 7% (0.2, 14) | 0.8% (‐1, 3) |
| P (Unprocessed > Processed) | 0.98 | 0.84 |
| TB prevalence |
|
|
| High (> 30%) | 89% (84, 93) | 98% (96, 99) |
| Low (≤ 30%) | 86% (77, 92) | 99% (97, 99) |
| Difference (High minus Low) | 3% (‐5, 12) | ‐0.4% (‐2, 1) |
| P (High > Low) | 0.80 | 0.29 |
| Country income level |
|
|
| High‐income | 92% (86, 96) | 98% (95, 99) |
| Low‐ and middle‐income | 85% (79, 90) | 99% (97, 99) |
| Difference (High‐income minus Low‐ and middle‐income) | 6% (‐1, 14) | ‐1% (‐3, 1) |
| P (High‐income > Low‐ and middle‐income) | 0.96 | 0.23 |
| P = probability | ||
| Covariate | Sensitivity Median (95% credible interval) | Specificity Median (95% credible interval) |
| Parameter value (delta cycle threshold cutoff) |
|
|
| Parameter value 5 | 94% (86, 97) | 98% (96, 99) |
| Parameter value 3.5 | 96% (81, 100) | 100% (98, 100) |
| Difference (Parameter value 5 minus Parameter value 3) | ‐3% (‐10, 11) | ‐2% (‐4, ‐0.3) |
| P (Parameter value 5 > Parameter value 3) | 0.26 | 0.01 |
| Rifampicin resistance prevalence |
|
|
| High (> 15%) | 94% (85, 98) | 98% (95, 99) |
| Low (≤ 15%) | 93% (80, 99) | 98% (96, 99) |
| Difference (High minus Low) | 0.4% (‐8, 13) | ‐0.4% (‐4, 2) |
| P (High > Low) | 0.54 | 0.34 |
| P = probability | ||
| Study and year of publication | Time to TB detection | Time to detection of rifampicin resistance | Time to treatment initiation
|
| Boehme 2011a; Boehme 2011b; Boehme 2011c; Boehme 2011d; Boehme 2011e; Boehme 2011f | Median (IQR) Xpert: 0 days (0, 1) Smear: 1 day (0, 1) Solid culture: 30 days (23, 43) Liquid culture: 16 days (13‐21) | Median (IQR) Xpert: 1 day (0, 1) Line probe assay (direct testing): 20 days (10, 16) Phenotypic DST: 106 days (30, 124) | Median (IQR) Smear‐, culture+ TB Before Xpert introduced: 56 days (39, 81) After Xpert introduced: 5 days (2, 8) |
| Xpert (1 sample): 1 hour 55 minutes Xpert (8 samples processed together): 2 hours |
|
| |
| Median* (IQR) Xpert: 4 days (3, 6) Smear: 3 days (2, 5) Liquid culture (smear+): 12 days (10,14) Liquid culture (smear‐): 20 days (17, 27) | Xpert: mean 2 days MTBDRplus assay (with positive culture isolate): mean 21 days Phenotypic DST (liquid culture): mean 40 days
|
| |
| Xpert: hands‐on time was 5 minutes; run time was less than 2 hours |
|
| |
| Xpert: hands‐on time was 15 minutes: run time was 113 minutes |
|
| |
| Xpert: total time of 2 hours |
|
| |
| Xpert: within two hours |
|
| |
| Xpert (routine practice): 3‐24 hours Liquid culture: 19 days mean (range 3‐42 days) |
|
| |
| *Delays between sputum collection and results being available to the clinic **Times provided for both pulmonary and extrapulmonary specimens jointly; DST, drug susceptibility testing; IQR, interquartile range | |||
| Test | No. of studies | No. of participants |
| 1 TB detection, all studies Show forest plot | 27 | 7816 |
| 2 Add on Show forest plot | 23 | 5719 |
| 3 Smear positive Show forest plot | 24 | 1735 |
| 4 Smear negative Show forest plot | 25 | 5878 |
| 5 HIV positive Show forest plot | 11 | 1557 |
| 6 HIV negative Show forest plot | 13 | 1981 |
| 7 TB detection, condition of specimen Show forest plot | 24 | 7453 |
| 8 TB detection, specimen preparation Show forest plot | 27 | 7816 |
| 9 TB prevalence Show forest plot | 27 | 7816 |
| 10 Income status Show forest plot | 27 | 7816 |
| 11 Rifampicin resistance Show forest plot | 20 | 2340 |
| 12 RIF resistance prevalence Show forest plot | 20 | 2340 |