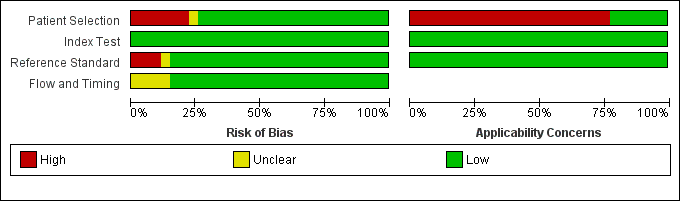
| Review question: What is the diagnostic accuracy of Xpert MTB/RIF assay for detection of pulmonary TB and detection of rifampicin resistance? Patients/population: Adults suspected of having pulmonary TB or MDR‐TB (for TB detection); confirmed TB cases (for rifampicin resistance detection) Purpose: TB detection: Xpert MTB/RIF assay used as an initial test replacing microscopy and used as an add‐on test following a negative smear microscopy result. Rifampicin resistance detection: Xpert MTB/RIF assay as an initial test replacing conventional phenotypic drug susceptibility testing Setting: Basic laboratories and primary health facilities (peripheral health services level) Index test: Xpert MTB/RIF assay Importance: Compared with culture and conventional drug susceptibility testing, Xpert MTB/RIF assay could have considerable advantages for scaling up programmatic management of TB by offering rapid diagnosis nearer to the point of care, standardized testing, potential for high throughput, and fewer requirements for laboratory biosafety Reference standards: TB: solid or liquid culture; rifampicin resistance: phenotypic drug susceptibility testing Studies: Cross‐sectional |
| Type of analysis | Effect (95% credible interval) | No. of participants (studies) | What do these results mean given 5% prevalence of TB among individuals suspected of having pulmonary TB? | What do these results mean given 15% prevalence of TB among individuals suspected of having pulmonary TB? | What do these results mean given 30% prevalence of TB among individuals suspected of having pulmonary TB? |
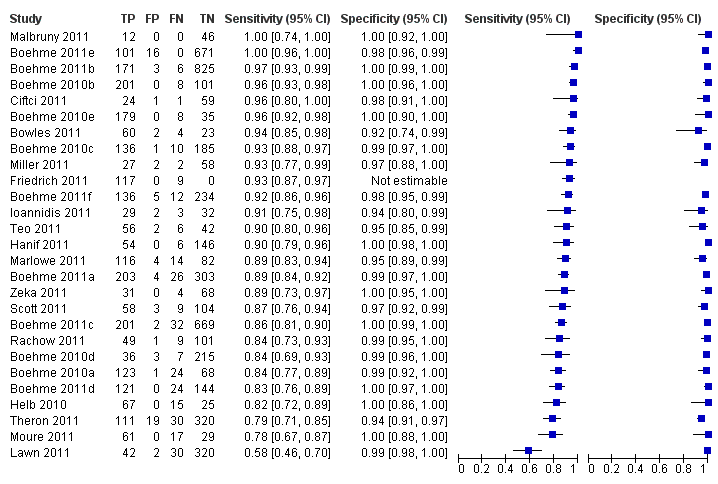
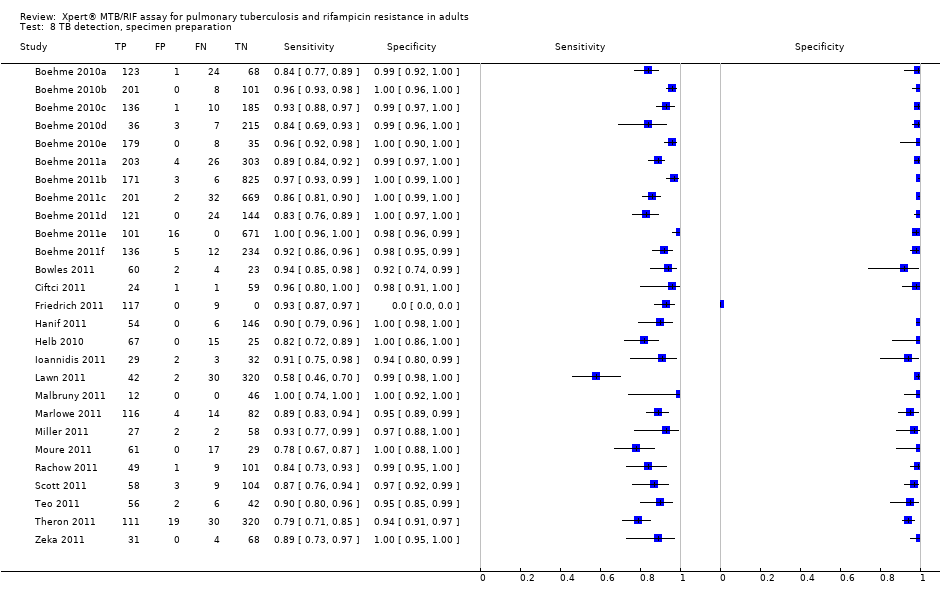
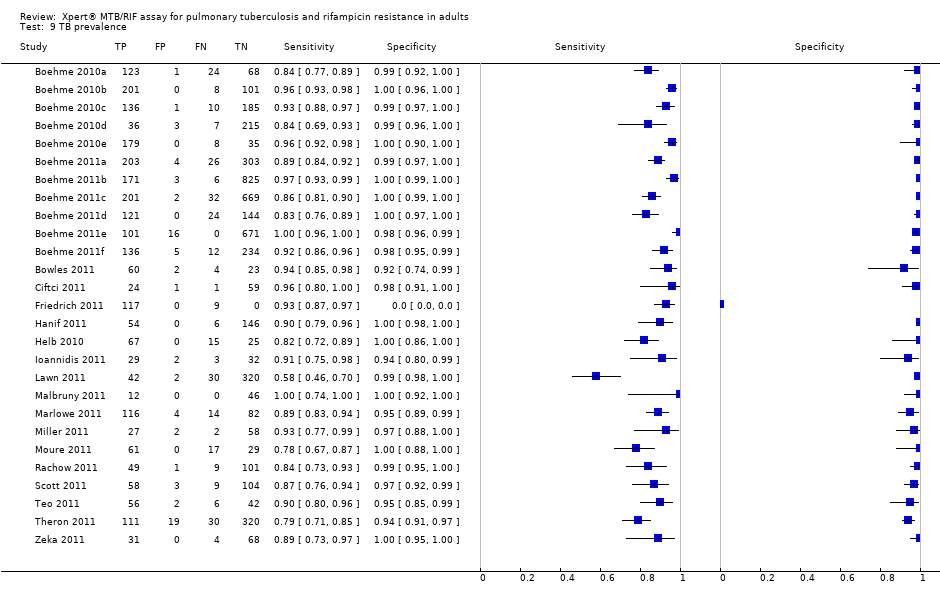
| TB detection, Xpert used as an initial test replacing microscopy | Pooled median sensitivity 88% (83, 92) and pooled median specificity 98% (97, 98) | 7517 (15) | With a prevalence of 5%, 50/1000 individuals will have pulmonary TB. Of these, 44 (TP) will be identified; 6 (FN) will be missed. Of the 950 individuals without TB, 931 (TN) will not be treated; 19 (FP) may be unnecessarily treated | With a prevalence of 15%, 150/1000 individuals will have pulmonary TB. Of these, 132 (TP) will be identified; 18 (FN) will be missed. Of the 850 individuals without TB, 833 (TN) will not be treated; 17 (FP) may be unnecessarily treated | With a prevalence of 30%, 300/1000 individuals will have pulmonary TB. Of these, 264 (TP) will be identified; 36 (FN) will be missed. Of the 700 individuals without TB, 686 (TN) will not be treated; 14 (FP) may be unnecessarily treated |
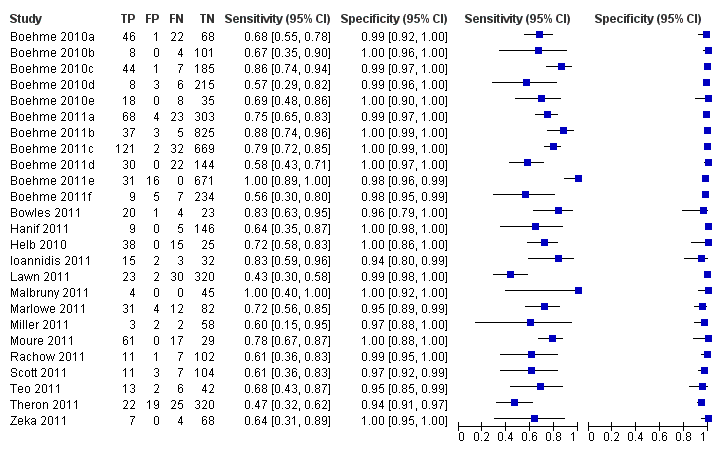
| TB detection, Xpert used as an add‐on test following a negative smear microscopy result | Pooled median sensitivity 67% (58, 74) and pooled median specificity 98% (97, 98) | 5719 (14) | With a prevalence of 5%, 50/1000 individuals will have pulmonary TB. Of these, 34 (TP) will be identified; 16 (FN) will be missed. Of the 950 individuals without TB, 931 (TN) will not be treated; 19 (FP) may be unnecessarily treated | With a prevalence of 15%, 150/1000 individuals will have pulmonary TB. Of these, 101 (TP) will be identified; 49 (FN) will be missed. Of the 850 individuals without TB, 833 (TN) will not be treated; 17 (FP) may be unnecessarily treated | With a prevalence of 30%, 300/1000 individuals will have pulmonary TB. Of these, 201 (TP) will be identified; 99 (FN) will be missed. Of the 700 individuals without TB, 686 (TN) will not be treated; 14 (FP) may be unnecessarily treated |
| Smear‐positive, culture‐positive subgroup, within‐ study comparison | Pooled median sensitivity 98% (97, 99); specificity of Xpert could not be estimated in these studies | 1735 (15) | With a prevalence of 5%, 50/1000 individuals will have pulmonary TB. Of these, 49 (TP) will be identified; 1 (FN) will be missed | With a prevalence of 15%, 150/1000 individuals will have pulmonary TB. Of these, 147 (TP) will be identified; 3 (FN) will be missed | With a prevalence of 30%, 300/1000 individuals will have pulmonary TB. Of these, 294 (TP) will be identified; 6 (FN) will be missed |
| Smear‐negative, culture‐positive subgroup | Pooled median sensitivity 68% (59, 75) and pooled median specificity 98% (97, 99) | 5771 (15) | With a prevalence of 5%, 50/1000 individuals will have pulmonary TB. Of these, 34 (TP) will be identified; 16 (FN) will be missed. Of the 950 individuals without TB, 931 (TN) will not be treated; 19 (FP) may be unnecessarily treated | With a prevalence of 15%, 150/1000 individuals will have pulmonary TB. Of these, 102 (TP) will be identified; 48 (FN) will be missed. Of the 850 individuals without TB, 833 (TN) will not be treated; 17 (FP) may be unnecessarily treated | With a prevalence of 30%, 300/1000 individuals will have pulmonary TB. Of these, 204 (TP) will be identified; 96 (FN) will be missed. Of the 700 individuals without TB, 686 (TN) will not be treated; 14 (FP) may be unnecessarily treated |
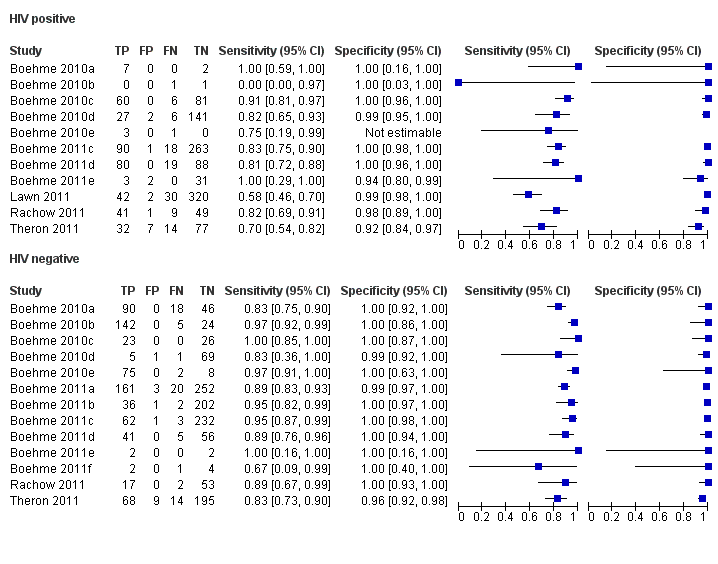
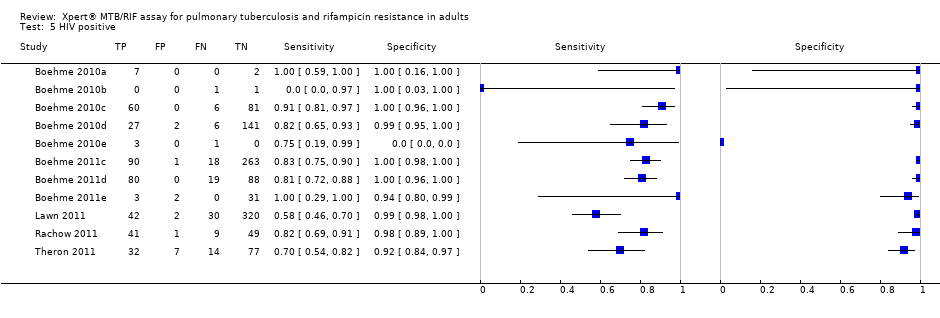
| HIV‐positive subgroup | Pooled median sensitivity 80% (67, 88) and pooled median specificity 97% (93, 99) | 1163 (4) | With a prevalence of 5%, 50/1000 individuals will have pulmonary TB. Of these, 40 (TP) will be identified; 10 (FN) will be missed. Of the 950 individuals without TB, 922 (TN) will not be treated; 28 (FP) may be unnecessarily treated | With a prevalence of 15%, 150/1000 individuals will have pulmonary TB. Of these, 120 (TP) will be identified; 30 (FN) will be missed. Of the 850 individuals without TB, 825 (TN) will not be treated; 25 (FP) may be unnecessarily treated | With a prevalence of 30%, 300/1000 individuals will have pulmonary TB. Of these, 240 (TP) will be identified; 60 (FN) will be missed. Of the 700 individuals without TB, 679 (TN) will not be treated; 21 (FP) may be unnecessarily treated |
| HIV‐negative subgroup | Pooled median sensitivity 89% (81, 94) and pooled median specificity 99% (96, 99) | 1981 (4) | With a prevalence of 5%, 50/1000 individuals will have pulmonary TB. Of these, 45 (TP) will be identified; 5 (FN) will be missed. Of the 950 individuals without TB, 941 (TN) will not be treated; 9 (FP) may be unnecessarily treated | With a prevalence of 15%, 150/1000 individuals will have pulmonary TB. Of these, 134 (TP) will be identified; 16 (FN) will be missed. Of the 850 individuals without TB, 842 (TN) will not be treated; 8 (FP) may be unnecessarily treated | With a prevalence of 30%, 300/1000 individuals will have pulmonary TB. Of these, 267 (TP) will be identified; 33 (FN) will be missed. Of the 700 patients individuals without TB, 693 (TN) will not be treated; 7 (FP) may be unnecessarily treated |
| Type of analysis | Effect (95% credible interval) | No. of participants (studies) | What do these results mean given 2% prevalence of rifampicin resistance among individuals with TB? | What do these results mean given 15% prevalence of rifampicin resistance among individuals with TB? | What do these results mean given 30% prevalence of rifampicin resistance among individuals with TB? |
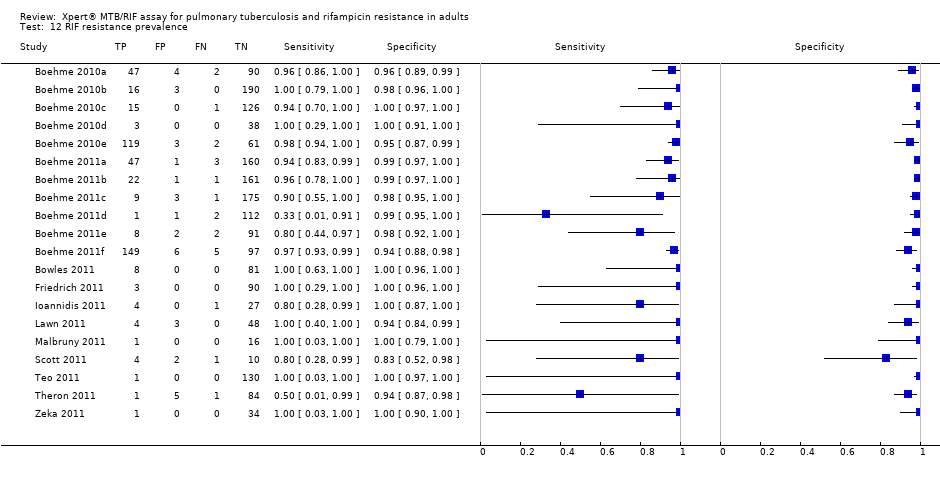
| Rifampicin resistance detection, Xpert used as an initial test replacing conventional drug susceptibility testing | Pooled median sensitivity 94% (87, 97) and pooled median specificity 98% (97, 99) | 2340 (11) | With a prevalence of 2%, 20/1000 will have rifampicin resistance. Of these, 19 (TP) will be identified; 1 (FN) will be missed. Of the 980 patients with TB sensitive to rifampicin, 960 (TN) will not be treated; 20 (FP) may be unnecessarily treated | With a prevalence of 15%, 150/1000 will have rifampicin resistance. Of these, 141 (TP) will be identified; 9 (FN) will be missed. Of the 850 patients with TB sensitive to rifampicin, 833 (TN) will not be treated; 17 (FP) may be unnecessarily treated | With a prevalence of 30%, 300/1000 will have rifampicin resistance Of these, 282 (TP) will be identified; 18 (FN) will be missed. Of the 700 patients with TB sensitive to rifampicin, 686 (TN) will not be treated; 14 (FP) may be unnecessarily treated |