Xpert® MTB/RIF assay for pulmonary tuberculosis and rifampicin resistance in adults
Appendices
Appendix 1. Detailed search strategies
Search strategy Medline (OVID) and Embase (OVID)
1. (tuberculosis or TB).tw
limit 1 to yr="2007 ‐Current"
2. Mycobacterium tuberculosis/
limit 2 to yr="2007 ‐Current"
3. Tuberculosis, Multidrug‐Resistant/ or Tuberculosis/ or Tuberculosis, Pulmonary/
limit 3 to yr="2007 ‐Current"
4. 1 or 2 or 3
5. (Xpert or GeneXpert or cepheid or( near* patient)). tw.
limit 4 to yr="2007 ‐Current"
4 and 5
Search strategy Web of Knowledge (SCI‐expanded, SSCI, Conference Proceedings science, BIOSIS previews)
(tuberculosis OR TB OR mycobacterium) (topic) AND (Xpert OR Genexpert OR cepheid) (topic)
Search strategy LILACS
(tuberculosis OR TB OR mycobacterium) (Words) AND (xpert OR Genexpert OR Cepheid) (Words)
Search strategy SCOPUS
(tuberculosis OR TB OR mycobacterium) (title, abstract, keywords) AND (xpert OR Genexpert OR Cepheid) (title, abstract, keywords)
Appendix 2. Data extraction form
| ID |
|
| ID substudy (for study centres: a, b, c, etc) |
|
| First Author |
|
| Corresponding author & email |
|
| Was author contacted? | 1 – Yes 2 – No If yes, dates(s) |
| Title |
|
| Year (of publication) |
|
| Year (study start date) |
|
| Language | 1 – English 2 – Other If other, specify: |
| Was the study conducted without industry sponsorship? | 1 – Yes 2 – No 9 – Unk/NR |
| If industry sponsorship was present, select one item from the list | Select one: answers ordered from least to most industry involvement: Donation of Xpert® for use in study Xpert® at a special preferred price Receipt of educational support, grants, or speaking fees Financial relationship ‐ author is employee/consultant/stockholder Involvement in design, analysis, or manuscript production |
| For TB detection, what reference standard(s) was used? | 1 – Solid Culture (specify 1a) 2 – Liquid Culture (specify 2a) 3 – Both Solid & Liquid Culture (specify 1a & 2a) 9 – Unk/NR
1a ‐ Solid Culture LJ 7H10 7H11 Other 2a – Liquid Culture MGIT 960 Bactec 460 Other |
| For rifampicin resistance detection, what reference standard(s) was used? | 1 – Solid Culture (specify 1a) 2 – Liquid Culture (specify 2a) 3 – Both Solid & Liquid Culture (specify 1a & 2 a) 9 – Unk/NR
1a ‐ Solid Culture LJ 7H10 7H11 Other Specify method, eg, proportion 2a – Liquid Culture MGIT 960 Bactec 460 Other |
| Clinical setting; describe as written in the paper | 1 – Outpatient 2‐ Inpatient 3 – Both out‐ and in‐patient 4 – Other, specify 5 – Laboratory 9 – Unk/NR
Describe as in paper: |
| Laboratory services level Specify type of laboratory | 1‐ Central (Reference) 2 ‐ Intermediate (Regional) 3 ‐ Peripheral (Microscopy centre, health clinic, provincial hospital) 4‐ Other, specify |
| Was Xpert run outside of a laboratory, eg, clinic? | 1 ‐ Yes 2 ‐ No |
| Country where study was conducted |
|
| Country World Bank Classification | 1 – Middle/Low 2 – High 3 – Both middle/low and high |
| Study design | 1 – Randomized Trial 2 – Cross‐sectional 3 – Cohort 4 – Other, specify 9 – Unk/NR
If other, specify: |
| Participant selection | 1 – Consecutive 2 – Random 3 – Convenience 7 – Other 9 – NR/Unclear |
| Direction of study data collection | 1 – Prospective 2 – Retrospective 9 – Unk/NR |
| Comments about study design |
|
| Number after screening by exclusion & inclusion criteria | _____ 9 – Unk/NR |
| Number included in analysis (# screened ‐ # withdrawals) | _____ 9 – Unk/NR |
| Unit of analysis | 1 – One specimen per patient 2 – Multiple specimens per patient 3 ‐ Unknown number of specimens per patient 9 – NR/Unclear
Describe as in paper, if unclear: |
| Prior testing by microscopy for triage | 1 – Yes 2 – No 9 – Unk/NR |
| Did the study include patients with previous TB history? | 1 – Yes 2 – No 9 – Unk/NR |
| If so, what is the percentage? | % Specify numerator/denominator |
| HIV status of participants | 0 – HIV ‐ 1 – HIV + 2 – Both HIV+/‐ 9 – Unk/NR |
| If HIV‐positive participants included, what is the percentage? | % Specify numerator/denominator |
| Specimen collection (may include expectorated sputum, induced sputum, bronchial alveolar lavage (BAL), tracheal aspiration) | 1 – All expectorated 2 – All induced 3 – All BAL 4 – Multiple types 5 – Other 9 – Unk/NR If 4 or 5, describe and record numbers: |
| Were Xpert sample and culture obtained from same specimen? | 1 – Yes 2 – No 9 – Unk/NR |
| Number of cultures used to exclude TB | 1 – One 2 – Two 3 – Three 4 – Four 5 – Other, specify 9 ‐ Unk/NR Specify, if > 4: NOTES: |
| Pre‐treatment processing procedure for Xpert | 1 – None 2 – NALC‐NaOH 3 – NaOH (Petroff) 4 – Other 9 – Unk/NR |
| Was microscopy used | 1 – Yes 2 – No 9 – Unk/NR |
| Type of microscopy used | 1 – Ziehl‐Neelsen 2 – FM 9 – Unk/NR |
| Smear type | 1 – Direct 2 – Concentrated (processed) 9 – Unk/NR |
| Minimum number of sputum specimens used to determine smear positivity | 1 – One 2 – Two 3 – Three 4 – >3 9 – Unk/NR |
| How was a positive smear defined? (if guideline referenced, look up guideline) | ≥____bacilli per____ high power fields 9 – Unk/NR * complete both fields |
| For Xpert specimen, what was the condition of the specimen when tested? | 1 – Fresh 2 – Frozen 9 – Unk/NR |
| If fresh, specify: | 1 – Tested after storage at room temperature or refrigerated w/in 48 hours of collection 2 – Tested after storage at room temperature or refrigerated > 48 hours of collection 9 – Unk/NR |
| If frozen, specify: | 1 – Tested after frozen < 1 year of storage 2 – Tested frozen ≥ 1 year of storage 9 – Unk/NR |
| Version of software for test interpretation | 1 – Version 1 2 – Version 2 3 – Version 3 4 ‐ Version 4 9 – Unk/NR |
| Enter percentage contaminated cultures, if provided:
# of contaminated culture Total # cultures performed | _____________ 9 – Unk/NR |
| Were indeterminate results reported for Xpert for TB detection? | 1 – Yes 2 – No 9 – Unk/NR |
| Were indeterminate results reported for Xpert for rifampicin resistance detection? | 1 – Yes 2 – No 9 – Unk/NR |
| Were patient important outcomes evaluated? | 1 – Yes 2 – No 9 – Unk/NR |
| Time to diagnosis | Xpert: Culture: 9 – Unk/NR |
| Time to treatment initiation | Xpert: Culture: 9 – Unk/NR |
| Other patient outcomes | Specify: |
TABLES
| TB detection, all studies | Definite TB |
| ||
| Yes | No | Total | ||
| Xpert result | Positive |
|
|
|
| Negative |
|
|
| |
| Total |
|
|
| |
| Indeterminate |
|
|
| |
| TB Detection, smear positive | Definite TB |
| ||
| Yes | No | Total | ||
| Xpert result | Positive |
|
|
|
| Negative |
|
|
| |
| Total |
|
|
| |
| Indeterminate |
|
|
| |
| TB detection, smear negative | Confirmed TB |
| ||
| Yes | No | Total | ||
| Xpert result | Positive |
|
|
|
| Negative |
|
|
| |
| Total |
|
|
| |
| Indeterminate |
|
|
| |
| TB detection, HIV‐positive | Definite TB |
| ||
| Yes | No | Total | ||
| Xpert result | Positive |
|
|
|
| Negative |
|
|
| |
| Total |
|
|
| |
| Indeterminate |
|
|
| |
| TB detection, HIV‐negative | Definite TB |
| ||
| Yes | No | Total | ||
| Xpert result | Positive |
|
|
|
| Negative |
|
|
| |
| Total |
|
|
| |
| Indeterminate |
|
|
| |
| RIF resistance detection | Confirmed rifampicin resistance |
| ||
| Yes | No | Total | ||
| Xpert result | Yes (resistant) |
|
|
|
| No (susceptible) |
|
|
| |
| Total |
|
|
| |
| Indeterminate |
|
|
| |
| Microscopy
| Definite TB
| |||
| Yes | No | Total | ||
| Microscopy result | Positive |
|
|
|
| Negative |
|
|
| |
| Total |
|
|
| |
Appendix 3. Rules for QUADAS‐2
Domain 1 Patient Selection:
Risk of Bias: Could the selection of patients have introduced bias?
Signalling question 1: Was a consecutive or random sample of patients enrolled? We scored ‘yes’ if the study enrolled a consecutive or random sample of eligible patients; ‘no’ if the study selected patients by convenience; and ‘unclear’ if the study did not report the manner of patient selection or we could not tell.
Signalling question 2: Was a case‐control design avoided? Studies using a case‐control design were not included in the review because this study design, especially when used to compare results in severely ill patients with those in relatively healthy participants, may lead to overestimation of accuracy in diagnostic studies. We scored ‘yes’ for all studies.
Signalling question 3: Did the study avoid inappropriate exclusions? We scored 'yes' if the study included both smear‐positive and smear‐negative patients; 'no' if the study included only smear‐positive patients; and 'unclear' if we could not tell.
Risk of Bias was scored as ‘low concern’ if selection was done in a random or consecutive manner and the study was not limited to smear‐positive patients; ‘high concern’ if selection was by convenience or the study included only smear‐positive patients; and ‘unclear concern’ if the manner of participant selection was unclear and no clinical information was provided.
Applicability: Are there concerns that the included patients and setting do not match the review question?
We were interested in how Xpert performed in patients suspected of having pulmonary TB or MDR‐TB who were evaluated as they would be in settings of intended use, ie in basic laboratories or primary health facilities. We scored 'low concern' if Xpert was evaluated in provincial hospitals or primary health clinics and 'high' concern if Xpert was evaluated in reference laboratories. We judged applicability to be of ‘unclear concern’ if Xpert was evaluated in a basic laboratory and the study did not provide any clinical information about the participants.
Domain 2: Index Test
Risk of Bias: Could the conduct or interpretation of the index test have introduced bias?
Signalling question 1: Were the index test results interpreted without knowledge of the results of the reference standard? We answered this question ‘yes’ for all studies because Xpert test results were automatically generated and the user was provided with printable test results. Thus, there is no room for subjective interpretation of test results.
Signalling question 2: If a threshold was used, was it prespecified? The threshold was prespecified in all versions of Xpert. We answered this question ‘yes’ for all studies.
For risk of bias, we scored ‘low concern’ for all studies.
Applicability: Are there concerns that the index test, its conduct, or its interpretation differ from the review question? Variations in test technology, execution, or interpretation may affect estimates of the diagnostic accuracy of a test. However, we judged these issues to be of ‘low concern’ for all studies in this review.
Domain 3: Reference Standard
Risk of Bias: Could the reference standard, its conduct, or its interpretation have introduced bias?
We considered this domain separately for the reference standard for TB detection and the reference standard for rifampicin resistance.
Signalling question 1: Is the reference standard likely to correctly classify the target condition? For pulmonary TB: although culture is not 100% accurate, it is considered to be the gold standard for TB diagnosis. For rifampicin resistance: similarly, although drug susceptibility testing by conventional phenotypic methods is not 100% accurate, it is considered to be the gold standard. We answered this question ‘yes’ for all studies.
Signalling question 2: (TB) Were the reference standard results interpreted without knowledge of the results of the index test? We scored 'yes' if the reference test provided an automated result (eg MGIT 960), blinding was explicitly stated, or it was clear that the reference standard was performed at a separate laboratory and/or performed by different people. We scored ‘no’ if the study stated that the reference standard result was interpreted with knowledge of the Xpert test result. We scored 'unclear' if we could not tell.
Signalling question 3: (Rifampicin resistance) We added a signalling question for rifampicin resistance because judgments might differ for TB and for rifampicin resistance , the two target conditions. Were the reference standard results interpreted without knowledge of the results of the index test? We scored 'yes' if the reference test provided an automated result (eg MGIT 960), blinding was explicitly stated, or it was clear that the reference standard was performed at a separate laboratory and/or performed by different people. We scored ‘no’ if the study stated that the reference standard result was interpreted with knowledge of the Xpert test result. We scored 'unclear' if we could not tell.
For risk of bias, we scored ‘low concern’ if the reference standard result was automated, blinding explicitly stated, or the reference standard performed at a separate laboratory. We scored ‘high concern’ if the study explicitly stated the result of the reference standard was interpreted with knowledge of the Xpert test result. We scored ‘unclear concern’ if we could not tell. We reported results for both TB and rifampicin resistance.
Applicability: Are there concerns that the target condition as defined by the reference standard does not match the question? We judged applicability to be of ‘low concern’ for all studies for both pulmonary TB and rifampicin resistance.
Domain 4: Flow and Timing
Risk of Bias: Could the patient flow have introduced bias?
Signalling question 1: Was there an appropriate interval between the index test and reference standard? In the majority of included studies, we expected specimens for Xpert and culture to be obtained at the same time when patients were suspected of having TB. However, even if there were a delay of several days or weeks between index test and reference standard, TB is a chronic disease and we considered misclassification of disease status to be unlikely. We answered this question ‘yes’ for all studies.
Signalling question 2: Did all patients receive the same reference standard? We answered this question ‘yes’ for all studies as an acceptable reference standard (either solid or liquid culture) was specified as a criterion for inclusion in the review. However, we acknowledge that it is possible that some specimens could undergo solid culture and others liquid culture. This could potentially result in variations in accuracy, but we thought the variation would be minimal.
Signalling question 3: Were all patients included in the analysis? We determined the answer to this question by comparing the number of patients enrolled with the number of patients included in the two‐by‐two tables.
For risk of bias, we scored ‘low concern’ if the number of participants enrolled was clearly stated and corresponded to the number presented in the analysis or if exclusions were adequately described. We scored 'high concern' if there were participants missing or excluded from the analysis and there was no explanation given; and 'unclear concern' if not enough information was given to assess whether participants were excluded from the analysis; usually this meant that the number of participants originally enrolled in the study was not explicitly stated.
Appendix 4. Statistical appendix
Bayesian bivariate hierarchical model
The Bayesian bivariate hierarchical model used for the meta‐analyses is summarized below. The hierarchical framework took into account heterogeneity between studies and also between centres within two of the largest studies. The model was derived as an extension of previously described models (Chu 2009; Reitsma 2005). A WinBUGS program to fit this model is provided below. Three independent, dispersed sets of starting values were used to run separate chains. The Gelman‐Rubin statistic within the WinBUGS program was used to assess convergence. No convergence problems were observed. The first 3,000 iterations were treated as burn‐in iterations and dropped. Summary statistics were obtained based on a total of 15,000 iterations resulting from the three separate chains.
Notation: From the jth centre in the ith study we extracted the cross‐tabulation between the index and reference tests TPij, FPij, TNij, FNij. The sensitivity in ijth study is denoted by Sij and the specificity by SPij. We denote the Binomial probability distribution with sample size N and probability p as Binomial(p,N), the Bivariate Normal probability distribution with mean vector μ and variance‐covariance matrix Σ as BVN(μ, Σ), the univariate Normal distribution with mean m and variance s by N(m, s) and the Uniform probability distribution between a and b by Uniform(a,b).
Likelihood Figure 14:

Bayesian bivariate hierarchical model, likelihood
The pooled sensitivity is given by 1/1+exp (‐μ1) and pooled specificity as 1/1+exp (μ2).
Prior distributions Figure 15:

Bayesian bivariate hierarchical model, prior distributions
Addition of covariates:
To examine the impact of a dichotomous covariate (Z) on the pooled sensitivity and specificity parameters, we expressed the logit(sensitivity) and logit(specificity) as linear functions of Z as follows:
μ1 = a1+ b1Z and μ2 = a2+ b2Z
Prior distributions were placed over the coefficients in the linear function: a1 and a2˜ N(0,4) and b1 and b2˜ N(0,1.39) (Buzoianu 2008).
‐‐‐‐‐‐‐‐‐‐‐‐‐‐‐‐‐‐‐‐‐‐‐‐‐‐‐‐‐‐‐‐‐‐‐‐‐‐‐‐‐‐‐‐‐‐‐‐‐‐‐‐‐‐‐‐‐‐‐‐‐‐‐‐‐‐‐‐‐‐‐‐‐‐‐‐‐‐‐‐‐‐‐‐‐‐‐‐‐‐‐‐‐‐‐‐‐‐‐‐‐‐‐‐‐‐‐‐‐‐‐‐‐‐‐‐‐‐‐‐‐‐‐‐‐‐‐‐‐‐‐‐‐‐‐‐‐‐‐‐‐‐‐‐‐‐‐‐‐‐‐‐‐‐‐‐‐‐‐‐‐‐‐‐‐‐‐‐‐‐‐‐‐‐‐‐‐‐‐‐‐‐‐‐‐‐‐‐‐‐‐‐‐‐‐‐‐‐
# WinBUGS PROGRAM FOR ESTIMATING A BIVARIATE HIERARCHICAL META‐ANALYSIS MODEL
# FOR SENSITIVITY AND SPECIFICITY ALLOWING FOR HETEROGENEITY BETWEEN STUDIES
# AND HETEROGENEITY BETWEEN CENTRES WITHIN TWO OF THE STUDIES (BOEHME 2010 and 2011)
model {
############################# BOEHME 2010 #############################
for(j in 1:5) {
logit(se.q[j])<‐q1[j,1]
logit(sp.q[j])<‐q1[j,2]
q1[j,1:2]˜ dmnorm(l[1,1:2], T1[1:2,1:2])
pos1[j]<‐TP1[j]+FN1[j]
neg1[j]<‐TN1[j]+FP1[j]
TP1[j] ˜ dbin(se.q[j],pos1[j])
FP1[j] ˜ dbin(sp.q[j],neg1[j])
}
T1[1:2,1:2]<‐inverse(SIGMA1[1:2,1:2])
# Between‐centre variance‐covariance matrix for Boehme 2010
SIGMA1[1,1] <‐ sigma1[1]*sigma1[1]
SIGMA1[2,2] <‐ sigma1[2]*sigma1[2]
SIGMA1[1,2] <‐ k1*sigma1[1]*sigma1[2]
SIGMA1[2,1] <‐ k1*sigma1[1]*sigma1[2]
prec1[1] ˜ dgamma(2,0.5)
prec1[2] ˜ dgamma(2,0.5)
k1 ˜ dunif(‐1,1)
sigma1[1]<‐pow(prec1[1],‐0.5)
sigma1[2]<‐pow(prec1[2],‐0.5)
# Overall sens/spec across centres in Boehme 2010
se[1]<‐1/(1+exp(‐l[1,1]))
sp[1]<‐1/(1+exp(l[1,2]))
l[1,1:2] ˜ dmnorm(mu[1:2], T[1:2,1:2])
############################# BOEHME 2011 #############################
for(j in 1:6) {
logit(se.r[j])<‐ r1[j,1]
logit(sp.r[j])<‐ r1[j,2]
r1[j,1:2]˜ dmnorm(l[2,1:2], T2[1:2,1:2])
pos2[j]<‐TP2[j]+FN2[j]
neg2[j]<‐TN2[j]+FP2[j]
TP2[j] ˜ dbin(se.r[j],pos2[j])
FP2[j] ˜ dbin(sp.r[j],neg2[j])
}
T2[1:2,1:2]<‐inverse(SIGMA2[1:2,1:2])
# Between‐centre variance‐covariance matrix for Boehme 2011
SIGMA2[1,1] <‐ sigma2[1]*sigma2[1]
SIGMA2[2,2] <‐ sigma2[2]*sigma2[2]
SIGMA2[1,2] <‐ k2*sigma2[1]*sigma2[2]
SIGMA2[2,1] <‐ k2*sigma2[1]*sigma2[2]
prec2[1] ˜ dgamma(2,0.5)
prec2[2] ˜ dgamma(2,0.5)
k2 ˜ dunif(‐1,1)
sigma2[1]<‐pow(prec2[1],‐0.5)
sigma2[2]<‐pow(prec2[2],‐0.5)
# Overall sens/spec across centres in Boheme 2011
se[2]<‐1/(1+exp(‐l[2,1]))
sp[2]<‐1/(1+exp(l[2,2]))
l[2,1:2] ˜ dmnorm(mu[1:2], T[1:2,1:2])
############################# SINGLE CENTRE STUDIES #############################
for(i in 3:15) {
logit(se[i]) <‐ l[i,1]
logit(sp[i]) <‐ l[i,2]
pos[i]<‐TP[i]+FN[i]
neg[i]<‐TN[i]+FP[i]
TP[i] ˜ dbin(se[i],pos[i])
FP[i] ˜ dbin(sp[i],neg[i])
l[i,1:2] ˜ dmnorm(mu[1:2], T[1:2,1:2])
}
############################# HYPER PRIOR DISTRIBUTIONS #############################
mu[1] ˜ dnorm(0,0.25)
mu[2] ˜ dnorm(0,0.25)
T[1:2,1:2]<‐inverse(TAU[1:2,1:2])
# Between‐study variance‐covariance matrix
TAU[1,1] <‐ tau[1]*tau[1]
TAU[2,2] <‐ tau[2]*tau[2]
TAU[1,2] <‐ rho*tau[1]*tau[2]
TAU[2,1] <‐ rho*tau[1]*tau[2]
tau[1]<‐pow(prec[1],‐0.5)
tau[2]<‐pow(prec[2],‐0.5)
# prec is the between‐study precision in the logit(sensitivity) and logit(specificity)
prec[1] ˜ dgamma(2,0.5)
prec[2] ˜ dgamma(2,0.5)
rho ˜ dunif(‐1,1)
# Pooled sensitivity and specificity
Pooled_S<‐1/(1+exp(‐mu[1]))
Pooled_C<‐1/(1+exp(mu[2]))
# Predicted sensitivity and specificity in a new study
l.new[1:2] ˜ dmnorm(mu[],T[,])
sens.new <‐ 1/(1+exp(‐l.new[1]))
spec.new <‐ 1/(1+exp(l.new[2]))
}
############################## DATA #####################################
# DATA WAS READ FROM THREE SEPARATE FILES
# DATA 1 ‐ BOEHME 2010
TP1[] FP1[] FN1[] TN1[]
123 1 24 68
201 0 8 101
136 1 10 185
36 3 7 215
179 0 8 35
END
#row 1 : Azerbaijan
#row 2 : Peru
#row 3 : South Africa, Cape Town
#row 4 : South Africa, Durban
#row 5 : India
############################################################################
# DATA 2 ‐ FROM BOEHME 2011
TP2[] FP2[] FN2[] TN2[]
203 4 26 303
171 3 6 825
201 2 32 669
121 0 24 144
101 16 0 671
136 5 12 234
END
#Boheme 2011
#row 1 : Azerbaijan
#row 2 : Peru
#row 3 : South Africa
#row 4 : Uganda
#row 5 : India
#row 6 : The Philippines
############################################################################
# DATA 3 ‐ FROM BOEHME 2011
TP[] FP[] FN[] TN[]
NA NA NA NA
NA NA NA NA
60 2 4 23
24 1 1 59
54 0 6 146
67 0 15 25
42 2 30 320
12 0 0 46
116 4 14 82
27 2 2 58
49 1 9 101
58 3 9 104
56 2 6 42
111 19 30 320
31 0 4 68
END
#row 1 : Boheme 2010
#row 2 : Boheme 2011
#row 3 : Bowles 2011
#row 4 : Cifci 2011
#row 5 : Hanif 2011
#row 6 : Helb 2010 a
#row 7 : Lawn 2011
#row 8 : Malbruny 2011
#row 9 : Marlowe 2011
#row 10 : Miller 2011
#row 11 : Rachow 2011
#row 12 : Scott 2011
#row 13 : Teo 2011
#row 14 : Theron 2011
#row 15 : Zeka 2011
############################################################################

Readout of Xpert MTB/RIF assay for a TB positive, rifampicin‐susceptible specimen. Courtesy: Karin Weyer, The WHO STOP TB Department.

Flow diagram of studies in the review.
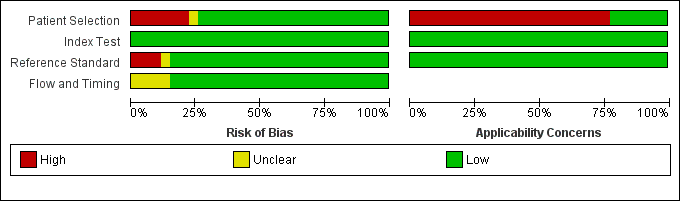
Risk of bias and applicability concerns graph: review authors' judgements about each domain presented as percentages across the 27 included study centres (18 studies). The reference standard domain pertains to TB as the target condition. See text for the reference standard pertaining to rifampicin resistance.

Risk of bias and applicability concerns summary: review authors' judgements about each domain for each included study centre.
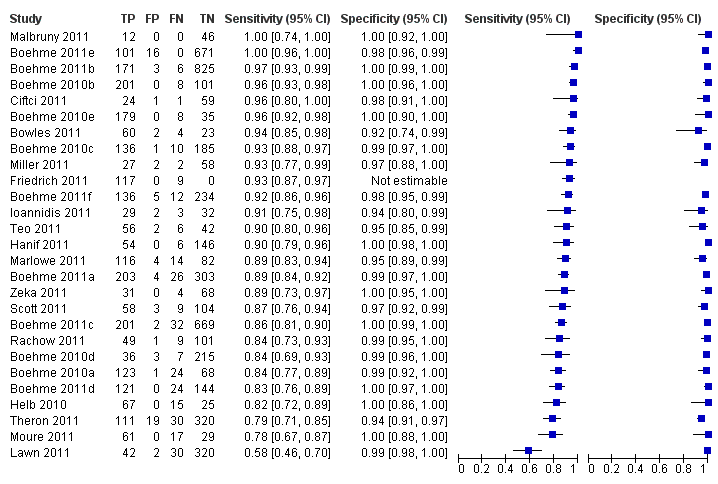
Forest plots of Xpert sensitivity and specificity for TB detection, Xpert used as an initial test replacing smear microscopy. The individual studies are ordered by decreasing sensitivity. TP = True Positive; FP = False Positive; FN = False Negative; TN = True Negative. Between brackets are the 95% CI of sensitivity and specificity. The figure shows the estimated sensitivity and specificity of the study (blue square) and its 95% CI (black horizontal line). Xpert specificity could not be estimated in one study.

Summary plots of Xpert sensitivity and specificity for TB detection, Xpert used as an initial test replacing smear microscopy. Each individual study is represented by an empty square. The size of the square is proportional to the sample size of the study such that larger studies are represented by larger squares. The filled circle is the pooled median estimate for sensitivity and specificity. The solid curves represent the 95% credible region around the summary estimate; the dashed curves represent the 95% prediction region.
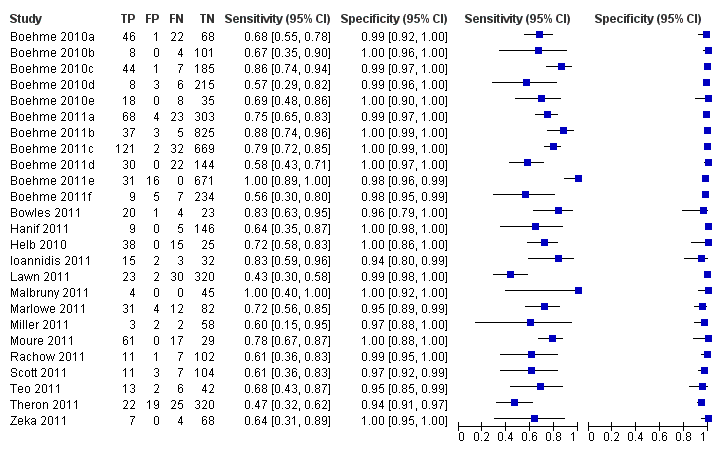
Forest plots of Xpert for TB detection, Xpert used as an add‐on test following a negative smear microscopy result. TP = True Positive; FP = False Positive; FN = False Negative; TN = True Negative. Between brackets the 95% CI of sensitivity and specificity. The figure shows the estimated sensitivity and specificity of the study (blue square) and its 95% CI (black horizontal line).

Summary plots of Xpert sensitivity and specificity for TB detection, Xpert used as an add‐on test following a negative smear microscopy result. Each individual study is represented by an empty square. The size of the square is proportional to the sample size of the study such that larger studies are represented by larger squares. The filled circle is the pooled median estimate for sensitivity and specificity. The solid curve represents the 95% credible region around the summary estimate; the dashed curves represent the 95% prediction region.

Forest plot of Xpert sensitivity for TB detection in smear‐positive subgroup. The squares represent the sensitivity and specificity of one study, the black line its CI. TP = true positive; FP = false positive; FN = false negative; TN = true negative. Xpert specificity could not be estimated in these studies.
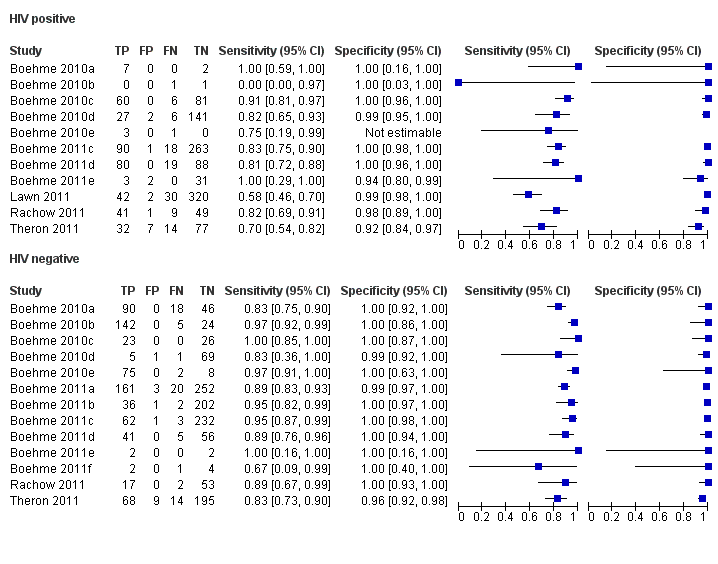
Forest plots of Xpert sensitivity and specificity for TB detection in HIV‐positive and HIV‐negative subgroups. The squares represent the sensitivity and specificity of one study and the black line represent its CI. TP = true positive; FP = false positive; FN = false negative; TN = true negative.

Summary plots of Xpert sensitivity and specificity for TB detection in HIV‐positive (red colour) and HIV‐negative subgroups (black colour). Each individual study is represented by an empty square. The size of the square is proportional to the sample size of the study such that larger studies are represented by larger squares. The filled circles are the median estimates for sensitivity and specificity. The solid curves represent the 95% credible region around the summary estimates; the dashed curves represent the 95% prediction region.

Forest plots of Xpert sensitivity and specificity for detection of rifampicin resistance, Xpert used as an initial test replacing conventional drug susceptibility testing as the initial test. The individual studies are ordered by decreasing sensitivity and decreasing number of true positives. The squares represent the sensitivity and specificity of one study, the black line its CI. TP = true positive; FP = false positive; FN = false negative; TN = true negative.

Summary plots of Xpert sensitivity and specificity for detection of rifampicin resistance, Xpert used as an initial test replacing conventional drug susceptibility testing as the initial test. Each individual study is represented by an empty square. The size of the square is proportional to the sample size of the study such that larger studies are represented by larger squares. The filled circle is the pooled median estimate for sensitivity and specificity. The solid curves represent the 95% credible region around the summary estimate; the dashed curves represent the 95% prediction region.

Bayesian bivariate hierarchical model, likelihood
Bayesian bivariate hierarchical model, prior distributions

TB detection, all studies.


TB detection, condition of specimen.
TB detection, specimen preparation.


Rifampicin resistance.
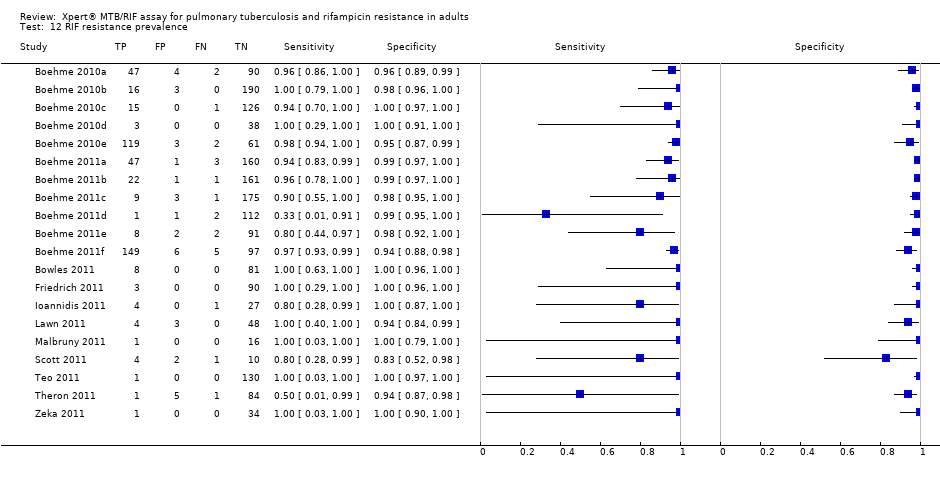
RIF resistance prevalence.
| Review question: What is the diagnostic accuracy of Xpert MTB/RIF assay for detection of pulmonary TB and detection of rifampicin resistance? Patients/population: Adults suspected of having pulmonary TB or MDR‐TB (for TB detection); confirmed TB cases (for rifampicin resistance detection) Purpose: TB detection: Xpert MTB/RIF assay used as an initial test replacing microscopy and used as an add‐on test following a negative smear microscopy result. Rifampicin resistance detection: Xpert MTB/RIF assay as an initial test replacing conventional phenotypic drug susceptibility testing Setting: Basic laboratories and primary health facilities (peripheral health services level) Index test: Xpert MTB/RIF assay Importance: Compared with culture and conventional drug susceptibility testing, Xpert MTB/RIF assay could have considerable advantages for scaling up programmatic management of TB by offering rapid diagnosis nearer to the point of care, standardized testing, potential for high throughput, and fewer requirements for laboratory biosafety Reference standards: TB: solid or liquid culture; rifampicin resistance: phenotypic drug susceptibility testing Studies: Cross‐sectional | |||||
| Diagnostic accuracy for TB detection | |||||
| Type of analysis | Effect (95% credible interval) | No. of participants (studies) | What do these results mean given 5% prevalence of TB among individuals suspected of having pulmonary TB?
| What do these results mean given 15% prevalence of TB among individuals suspected of having pulmonary TB? | What do these results mean given 30% prevalence of TB among individuals suspected of having pulmonary TB?
|
| TB detection, Xpert used as an initial test replacing microscopy | Pooled median sensitivity 88% (83, 92) and pooled median specificity 98% (97, 98)
| 7517 (15) | With a prevalence of 5%, 50/1000 individuals will have pulmonary TB. Of these, 44 (TP) will be identified; 6 (FN) will be missed. Of the 950 individuals without TB, 931 (TN) will not be treated; 19 (FP) may be unnecessarily treated | With a prevalence of 15%, 150/1000 individuals will have pulmonary TB. Of these, 132 (TP) will be identified; 18 (FN) will be missed. Of the 850 individuals without TB, 833 (TN) will not be treated; 17 (FP) may be unnecessarily treated | With a prevalence of 30%, 300/1000 individuals will have pulmonary TB. Of these, 264 (TP) will be identified; 36 (FN) will be missed. Of the 700 individuals without TB, 686 (TN) will not be treated; 14 (FP) may be unnecessarily treated |
| TB detection, Xpert used as an add‐on test following a negative smear microscopy result | Pooled median sensitivity 67% (58, 74) and pooled median specificity 98% (97, 98)
| 5719 (14) | With a prevalence of 5%, 50/1000 individuals will have pulmonary TB. Of these, 34 (TP) will be identified; 16 (FN) will be missed. Of the 950 individuals without TB, 931 (TN) will not be treated; 19 (FP) may be unnecessarily treated | With a prevalence of 15%, 150/1000 individuals will have pulmonary TB. Of these, 101 (TP) will be identified; 49 (FN) will be missed. Of the 850 individuals without TB, 833 (TN) will not be treated; 17 (FP) may be unnecessarily treated | With a prevalence of 30%, 300/1000 individuals will have pulmonary TB. Of these, 201 (TP) will be identified; 99 (FN) will be missed. Of the 700 individuals without TB, 686 (TN) will not be treated; 14 (FP) may be unnecessarily treated |
| Smear‐positive, culture‐positive subgroup, within‐ study comparison | Pooled median sensitivity 98% (97, 99); specificity of Xpert could not be estimated in these studies | 1735 (15) | With a prevalence of 5%, 50/1000 individuals will have pulmonary TB. Of these, 49 (TP) will be identified; 1 (FN) will be missed | With a prevalence of 15%, 150/1000 individuals will have pulmonary TB. Of these, 147 (TP) will be identified; 3 (FN) will be missed | With a prevalence of 30%, 300/1000 individuals will have pulmonary TB. Of these, 294 (TP) will be identified; 6 (FN) will be missed |
| Smear‐negative, culture‐positive subgroup | Pooled median sensitivity 68% (59, 75) and pooled median specificity 98% (97, 99) | 5771 (15) | With a prevalence of 5%, 50/1000 individuals will have pulmonary TB. Of these, 34 (TP) will be identified; 16 (FN) will be missed. Of the 950 individuals without TB, 931 (TN) will not be treated; 19 (FP) may be unnecessarily treated | With a prevalence of 15%, 150/1000 individuals will have pulmonary TB. Of these, 102 (TP) will be identified; 48 (FN) will be missed. Of the 850 individuals without TB, 833 (TN) will not be treated; 17 (FP) may be unnecessarily treated | With a prevalence of 30%, 300/1000 individuals will have pulmonary TB. Of these, 204 (TP) will be identified; 96 (FN) will be missed. Of the 700 individuals without TB, 686 (TN) will not be treated; 14 (FP) may be unnecessarily treated |
| HIV‐positive subgroup | Pooled median sensitivity 80% (67, 88) and pooled median specificity 97% (93, 99) | 1163 (4) | With a prevalence of 5%, 50/1000 individuals will have pulmonary TB. Of these, 40 (TP) will be identified; 10 (FN) will be missed. Of the 950 individuals without TB, 922 (TN) will not be treated; 28 (FP) may be unnecessarily treated | With a prevalence of 15%, 150/1000 individuals will have pulmonary TB. Of these, 120 (TP) will be identified; 30 (FN) will be missed. Of the 850 individuals without TB, 825 (TN) will not be treated; 25 (FP) may be unnecessarily treated | With a prevalence of 30%, 300/1000 individuals will have pulmonary TB. Of these, 240 (TP) will be identified; 60 (FN) will be missed. Of the 700 individuals without TB, 679 (TN) will not be treated; 21 (FP) may be unnecessarily treated |
| HIV‐negative subgroup | Pooled median sensitivity 89% (81, 94) and pooled median specificity 99% (96, 99) | 1981 (4) | With a prevalence of 5%, 50/1000 individuals will have pulmonary TB. Of these, 45 (TP) will be identified; 5 (FN) will be missed. Of the 950 individuals without TB, 941 (TN) will not be treated; 9 (FP) may be unnecessarily treated | With a prevalence of 15%, 150/1000 individuals will have pulmonary TB. Of these, 134 (TP) will be identified; 16 (FN) will be missed. Of the 850 individuals without TB, 842 (TN) will not be treated; 8 (FP) may be unnecessarily treated | With a prevalence of 30%, 300/1000 individuals will have pulmonary TB. Of these, 267 (TP) will be identified; 33 (FN) will be missed. Of the 700 patients individuals without TB, 693 (TN) will not be treated; 7 (FP) may be unnecessarily treated |
| Diagnostic accuracy for detection of rifampicin resistance | |||||
| Type of analysis | Effect (95% credible interval) | No. of participants (studies) | What do these results mean given 2% prevalence of rifampicin resistance among individuals with TB? | What do these results mean given 15% prevalence of rifampicin resistance among individuals with TB? | What do these results mean given 30% prevalence of rifampicin resistance among individuals with TB? |
| Rifampicin resistance detection, Xpert used as an initial test replacing conventional drug susceptibility testing | Pooled median sensitivity 94% (87, 97) and pooled median specificity 98% (97, 99) | 2340 (11) | With a prevalence of 2%, 20/1000 will have rifampicin resistance. Of these, 19 (TP) will be identified; 1 (FN) will be missed. Of the 980 patients with TB sensitive to rifampicin, 960 (TN) will not be treated; 20 (FP) may be unnecessarily treated | With a prevalence of 15%, 150/1000 will have rifampicin resistance. Of these, 141 (TP) will be identified; 9 (FN) will be missed. Of the 850 patients with TB sensitive to rifampicin, 833 (TN) will not be treated; 17 (FP) may be unnecessarily treated | With a prevalence of 30%, 300/1000 will have rifampicin resistance Of these, 282 (TP) will be identified; 18 (FN) will be missed. Of the 700 patients with TB sensitive to rifampicin, 686 (TN) will not be treated; 14 (FP) may be unnecessarily treated |
| TP, true positive; FN, false negative; TN, true negative; FP, false positive | |||||
| Type of analysis (Number of studies) | Pooled sensitivity Median (95% credible interval) | Pooled specificity Median (95% credible interval) | Predicted sensitivity Median (95% credible interval) | Predicted specificity Median (95% credible interval) |
| Xpert used as an initial test for TB detection replacing microscopy (15)*
| 88% (83, 92) | 98% (97, 99) | 88% (66, 97) | 98% (92, 100) |
| Xpert used as an add‐on test for TB detection following a negative smear microscopy result (14) | 67% (58, 74) | 98% (97, 99) | 66% (40, 86) | 98% (93, 100) |
| Xpert used as an initial test for rifampicin resistance detection replacing conventional drug susceptibility testing as the initial test (11) | 94% (87, 97) | 98% (97, 99) | 94% (75, 99) | 98% (91, 100) |
| *Three studies that preferentially enrolled smear‐positive or smear‐negative patients were excluded | ||||
| Covariate | Sensitivity Median (95% credible interval) | Specificity Median (95% credible interval) |
| Smear status |
|
|
| Smear + | 98% (97, 99) | *** |
| Smear ‐ | 68% (59, 75) | 98% (97, 99) |
| Difference (Smear+ minus Smear‐) | 31% (23, 39) | ** |
| P (Smear+ > Smear‐) | 1.00 | ** |
| HIV status |
|
|
| HIV+ | 80% (67, 88) | 97% (93, 99) |
| HIV‐ | 89% (81, 94) | 99% (96, 99) |
| Difference (HIV+ minus HIV‐) | ‐9% (‐22, 3) | ‐1% (‐5, 2) |
| P (HIV+ > HIV‐) | 0.06 | 0.21 |
| Condition of specimen |
|
|
| Fresh | 88% (80, 93) | 99% (98, 100) |
| Frozen | 85% (77, 91) | 97% (95, 99) |
| Difference (Fresh minus Frozen) | 3% (‐7, 13) | 2% (0.1, 4) |
| P (Fresh > Frozen) | 0.73 | 0.98 |
| Specimen preparation |
|
|
| Unprocessed | 92% (87, 96) | 99% (97, 99) |
| Processed | 85% (79, 90) | 98% (96, 99) |
| Difference (Unprocessed minus Processed) | 7% (0.2, 14) | 0.8% (‐1, 3) |
| P (Unprocessed > Processed) | 0.98 | 0.84 |
| TB prevalence |
|
|
| High (> 30%) | 89% (84, 93) | 98% (96, 99) |
| Low (≤ 30%) | 86% (77, 92) | 99% (97, 99) |
| Difference (High minus Low) | 3% (‐5, 12) | ‐0.4% (‐2, 1) |
| P (High > Low) | 0.80 | 0.29 |
| Country income level |
|
|
| High‐income | 92% (86, 96) | 98% (95, 99) |
| Low‐ and middle‐income | 85% (79, 90) | 99% (97, 99) |
| Difference (High‐income minus Low‐ and middle‐income) | 6% (‐1, 14) | ‐1% (‐3, 1) |
| P (High‐income > Low‐ and middle‐income) | 0.96 | 0.23 |
| P = probability | ||
| Covariate | Sensitivity Median (95% credible interval) | Specificity Median (95% credible interval) |
| Parameter value (delta cycle threshold cutoff) |
|
|
| Parameter value 5 | 94% (86, 97) | 98% (96, 99) |
| Parameter value 3.5 | 96% (81, 100) | 100% (98, 100) |
| Difference (Parameter value 5 minus Parameter value 3) | ‐3% (‐10, 11) | ‐2% (‐4, ‐0.3) |
| P (Parameter value 5 > Parameter value 3) | 0.26 | 0.01 |
| Rifampicin resistance prevalence |
|
|
| High (> 15%) | 94% (85, 98) | 98% (95, 99) |
| Low (≤ 15%) | 93% (80, 99) | 98% (96, 99) |
| Difference (High minus Low) | 0.4% (‐8, 13) | ‐0.4% (‐4, 2) |
| P (High > Low) | 0.54 | 0.34 |
| P = probability | ||
| Study and year of publication | Time to TB detection | Time to detection of rifampicin resistance | Time to treatment initiation
|
| Boehme 2011a; Boehme 2011b; Boehme 2011c; Boehme 2011d; Boehme 2011e; Boehme 2011f | Median (IQR) Xpert: 0 days (0, 1) Smear: 1 day (0, 1) Solid culture: 30 days (23, 43) Liquid culture: 16 days (13‐21) | Median (IQR) Xpert: 1 day (0, 1) Line probe assay (direct testing): 20 days (10, 16) Phenotypic DST: 106 days (30, 124) | Median (IQR) Smear‐, culture+ TB Before Xpert introduced: 56 days (39, 81) After Xpert introduced: 5 days (2, 8) |
| Xpert (1 sample): 1 hour 55 minutes Xpert (8 samples processed together): 2 hours |
|
| |
| Median* (IQR) Xpert: 4 days (3, 6) Smear: 3 days (2, 5) Liquid culture (smear+): 12 days (10,14) Liquid culture (smear‐): 20 days (17, 27) | Xpert: mean 2 days MTBDRplus assay (with positive culture isolate): mean 21 days Phenotypic DST (liquid culture): mean 40 days
|
| |
| Xpert: hands‐on time was 5 minutes; run time was less than 2 hours |
|
| |
| Xpert: hands‐on time was 15 minutes: run time was 113 minutes |
|
| |
| Xpert: total time of 2 hours |
|
| |
| Xpert: within two hours |
|
| |
| Xpert (routine practice): 3‐24 hours Liquid culture: 19 days mean (range 3‐42 days) |
|
| |
| *Delays between sputum collection and results being available to the clinic **Times provided for both pulmonary and extrapulmonary specimens jointly; DST, drug susceptibility testing; IQR, interquartile range | |||
| Test | No. of studies | No. of participants |
| 1 TB detection, all studies Show forest plot | 27 | 7816 |
| 2 Add on Show forest plot | 23 | 5719 |
| 3 Smear positive Show forest plot | 24 | 1735 |
| 4 Smear negative Show forest plot | 25 | 5878 |
| 5 HIV positive Show forest plot | 11 | 1557 |
| 6 HIV negative Show forest plot | 13 | 1981 |
| 7 TB detection, condition of specimen Show forest plot | 24 | 7453 |
| 8 TB detection, specimen preparation Show forest plot | 27 | 7816 |
| 9 TB prevalence Show forest plot | 27 | 7816 |
| 10 Income status Show forest plot | 27 | 7816 |
| 11 Rifampicin resistance Show forest plot | 20 | 2340 |
| 12 RIF resistance prevalence Show forest plot | 20 | 2340 |