Xpert® MTB/RIF assay for pulmonary tuberculosis and rifampicin resistance in adults
Abstract
Background
Accurate and rapid detection of tuberculosis (TB) and drug resistance are critical for improving patient care and decreasing the spread of TB. Xpert® MTB/RIF assay (Xpert) is a rapid, automated test that can detect both TB and rifampicin resistance, within two hours after starting the test, with minimal hands‐on technical time, but is more expensive than conventional smear microscopy.
Objectives
To assess the diagnostic accuracy of Xpert for pulmonary TB (TB detection), both where Xpert was used as an initial test replacing microscopy, and where Xpert was used as an add‐on test following a negative smear microscopy result.
To assess the diagnostic accuracy of Xpert for rifampicin resistance detection where Xpert was used as the initial test, replacing conventional culture‐based drug susceptibility testing.
The population of interest was adults suspected of having pulmonary TB or multidrug‐resistant TB (MDR‐TB), with or without HIV infection.
Search methods
We performed a comprehensive search of the following databases: Cochrane Infectious Diseases Group Specialized Register; MEDLINE; EMBASE; ISI Web of Knowledge; MEDION; LILACS; BIOSIS; and SCOPUS. We also searched the metaRegister of Controlled Trials (mRCT) and the search portal of the WHO International Clinical Trials Registry Platform to identify ongoing trials. We performed searches on 25 September 2011 and we repeated them on 15 December 2011, without language restriction.
Selection criteria
We included randomized controlled trials, cross‐sectional, and cohort studies that used respiratory specimens to compare Xpert with culture for detecting TB and Xpert with conventional phenotypic drug susceptibility testing for detecting rifampicin resistance.
Data collection and analysis
For each study, two review authors independently extracted a set of data using a standardized data extraction form. When possible, we extracted data for subgroups by smear and HIV status. We assessed the quality of studies using the QUADAS‐2 tool. We carried out meta‐analyses to estimate the pooled sensitivity and specificity of Xpert separately for TB detection and rifampicin resistance detection using a bivariate random‐effects model. We estimated the median pooled sensitivity and specificity and their 95% credible intervals (CrI).
Main results
We identified 18 unique studies as eligible for this review, including two multicentre international studies, one with five and the other with six distinct study centres. The majority of studies (55.6%) were performed in low‐income and middle‐income countries. In 17 of the 18 studies, Xpert was performed by trained technicians in reference laboratories.
When used as an initial test replacing smear microscopy (15 studies, 7517 participants), Xpert achieved a pooled sensitivity of 88% (95% CrI 83% to 92%) and pooled specificity of 98% (95% CrI 97% to 99%). As an add‐on test following a negative smear microscopy result (14 studies, 5719 participants), Xpert yielded a pooled sensitivity of 67% (95% CrI 58% to 74%) and pooled specificity of 98% (95% CrI 97% to 99%). In clinical subgroups, we found the following accuracy estimates: the pooled sensitivity was 98% (95% CrI 97% to 99%) for smear‐positive, culture‐positive TB and 68% (95% CrI 59% to 75%) for smear‐negative, culture‐positive TB (15 studies); the pooled sensitivity was 80% (95% CrI 67% to 88%) in people living with HIV and 89% (95% CrI 81% to 94%) in people without HIV infection (four studies). For rifampicin resistance detection (11 studies, 2340 participants), Xpert achieved a pooled sensitivity of 94% (95% CrI 87% to 97%) and pooled specificity of 98% (95% CrI 97% to 99%). In a separate analysis, Xpert could distinguish between TB and nontuberculous mycobacteria (NTM) in clinical samples with high accuracy: among 139 specimens with NTM, Xpert was positive in only one specimen that grew NTM.
In a hypothetical cohort of 1000 individuals suspected of having rifampicin resistance (a proxy for MDR‐TB), where the prevalence of rifampicin resistance is 30%, we estimated that on average Xpert would wrongly identify 14 patients as being rifampicin resistant. In comparison, where the prevalence of rifampicin resistance is only 2%, we estimated that the number of individuals wrongly identified as rifampicin resistant would increase to 20, an increase of 43%.
Authors' conclusions
This review shows that Xpert used as an initial diagnostic test for TB detection and rifampicin resistance detection in patients suspected of having TB, MDR‐TB, or HIV‐associated TB is sensitive and specific. Xpert may also be valuable as an add‐on test following microscopy for patients who have previously been found to be smear‐negative. An Xpert result that is positive for rifampicin resistance should be carefully interpreted and take into consideration the risk of MDR‐TB in a given patient and the expected prevalence of MDR‐TB in a given setting.
Studies in this review mainly assessed sensitivity and specificity of the test when used in reference laboratories in research investigations. Most studies were performed in high TB burden countries. Ongoing use of Xpert in high TB burden countries will contribute to the evidence base on the diagnostic accuracy and clinical impact of Xpert in routine programmatic and peripheral health care settings, including settings where the test is performed at the point of care.
Plain language summary
[Plain language title]
[Summary text]
Authors' conclusions
Summary of findings
| Review question: What is the diagnostic accuracy of Xpert MTB/RIF assay for detection of pulmonary TB and detection of rifampicin resistance? Patients/population: Adults suspected of having pulmonary TB or MDR‐TB (for TB detection); confirmed TB cases (for rifampicin resistance detection) Purpose: TB detection: Xpert MTB/RIF assay used as an initial test replacing microscopy and used as an add‐on test following a negative smear microscopy result. Rifampicin resistance detection: Xpert MTB/RIF assay as an initial test replacing conventional phenotypic drug susceptibility testing Setting: Basic laboratories and primary health facilities (peripheral health services level) Index test: Xpert MTB/RIF assay Importance: Compared with culture and conventional drug susceptibility testing, Xpert MTB/RIF assay could have considerable advantages for scaling up programmatic management of TB by offering rapid diagnosis nearer to the point of care, standardized testing, potential for high throughput, and fewer requirements for laboratory biosafety Reference standards: TB: solid or liquid culture; rifampicin resistance: phenotypic drug susceptibility testing Studies: Cross‐sectional | |||||
| Diagnostic accuracy for TB detection | |||||
| Type of analysis | Effect (95% credible interval) | No. of participants (studies) | What do these results mean given 5% prevalence of TB among individuals suspected of having pulmonary TB?
| What do these results mean given 15% prevalence of TB among individuals suspected of having pulmonary TB? | What do these results mean given 30% prevalence of TB among individuals suspected of having pulmonary TB?
|
| TB detection, Xpert used as an initial test replacing microscopy | Pooled median sensitivity 88% (83, 92) and pooled median specificity 98% (97, 98)
| 7517 (15) | With a prevalence of 5%, 50/1000 individuals will have pulmonary TB. Of these, 44 (TP) will be identified; 6 (FN) will be missed. Of the 950 individuals without TB, 931 (TN) will not be treated; 19 (FP) may be unnecessarily treated | With a prevalence of 15%, 150/1000 individuals will have pulmonary TB. Of these, 132 (TP) will be identified; 18 (FN) will be missed. Of the 850 individuals without TB, 833 (TN) will not be treated; 17 (FP) may be unnecessarily treated | With a prevalence of 30%, 300/1000 individuals will have pulmonary TB. Of these, 264 (TP) will be identified; 36 (FN) will be missed. Of the 700 individuals without TB, 686 (TN) will not be treated; 14 (FP) may be unnecessarily treated |
| TB detection, Xpert used as an add‐on test following a negative smear microscopy result | Pooled median sensitivity 67% (58, 74) and pooled median specificity 98% (97, 98)
| 5719 (14) | With a prevalence of 5%, 50/1000 individuals will have pulmonary TB. Of these, 34 (TP) will be identified; 16 (FN) will be missed. Of the 950 individuals without TB, 931 (TN) will not be treated; 19 (FP) may be unnecessarily treated | With a prevalence of 15%, 150/1000 individuals will have pulmonary TB. Of these, 101 (TP) will be identified; 49 (FN) will be missed. Of the 850 individuals without TB, 833 (TN) will not be treated; 17 (FP) may be unnecessarily treated | With a prevalence of 30%, 300/1000 individuals will have pulmonary TB. Of these, 201 (TP) will be identified; 99 (FN) will be missed. Of the 700 individuals without TB, 686 (TN) will not be treated; 14 (FP) may be unnecessarily treated |
| Smear‐positive, culture‐positive subgroup, within‐ study comparison | Pooled median sensitivity 98% (97, 99); specificity of Xpert could not be estimated in these studies | 1735 (15) | With a prevalence of 5%, 50/1000 individuals will have pulmonary TB. Of these, 49 (TP) will be identified; 1 (FN) will be missed | With a prevalence of 15%, 150/1000 individuals will have pulmonary TB. Of these, 147 (TP) will be identified; 3 (FN) will be missed | With a prevalence of 30%, 300/1000 individuals will have pulmonary TB. Of these, 294 (TP) will be identified; 6 (FN) will be missed |
| Smear‐negative, culture‐positive subgroup | Pooled median sensitivity 68% (59, 75) and pooled median specificity 98% (97, 99) | 5771 (15) | With a prevalence of 5%, 50/1000 individuals will have pulmonary TB. Of these, 34 (TP) will be identified; 16 (FN) will be missed. Of the 950 individuals without TB, 931 (TN) will not be treated; 19 (FP) may be unnecessarily treated | With a prevalence of 15%, 150/1000 individuals will have pulmonary TB. Of these, 102 (TP) will be identified; 48 (FN) will be missed. Of the 850 individuals without TB, 833 (TN) will not be treated; 17 (FP) may be unnecessarily treated | With a prevalence of 30%, 300/1000 individuals will have pulmonary TB. Of these, 204 (TP) will be identified; 96 (FN) will be missed. Of the 700 individuals without TB, 686 (TN) will not be treated; 14 (FP) may be unnecessarily treated |
| HIV‐positive subgroup | Pooled median sensitivity 80% (67, 88) and pooled median specificity 97% (93, 99) | 1163 (4) | With a prevalence of 5%, 50/1000 individuals will have pulmonary TB. Of these, 40 (TP) will be identified; 10 (FN) will be missed. Of the 950 individuals without TB, 922 (TN) will not be treated; 28 (FP) may be unnecessarily treated | With a prevalence of 15%, 150/1000 individuals will have pulmonary TB. Of these, 120 (TP) will be identified; 30 (FN) will be missed. Of the 850 individuals without TB, 825 (TN) will not be treated; 25 (FP) may be unnecessarily treated | With a prevalence of 30%, 300/1000 individuals will have pulmonary TB. Of these, 240 (TP) will be identified; 60 (FN) will be missed. Of the 700 individuals without TB, 679 (TN) will not be treated; 21 (FP) may be unnecessarily treated |
| HIV‐negative subgroup | Pooled median sensitivity 89% (81, 94) and pooled median specificity 99% (96, 99) | 1981 (4) | With a prevalence of 5%, 50/1000 individuals will have pulmonary TB. Of these, 45 (TP) will be identified; 5 (FN) will be missed. Of the 950 individuals without TB, 941 (TN) will not be treated; 9 (FP) may be unnecessarily treated | With a prevalence of 15%, 150/1000 individuals will have pulmonary TB. Of these, 134 (TP) will be identified; 16 (FN) will be missed. Of the 850 individuals without TB, 842 (TN) will not be treated; 8 (FP) may be unnecessarily treated | With a prevalence of 30%, 300/1000 individuals will have pulmonary TB. Of these, 267 (TP) will be identified; 33 (FN) will be missed. Of the 700 patients individuals without TB, 693 (TN) will not be treated; 7 (FP) may be unnecessarily treated |
| Diagnostic accuracy for detection of rifampicin resistance | |||||
| Type of analysis | Effect (95% credible interval) | No. of participants (studies) | What do these results mean given 2% prevalence of rifampicin resistance among individuals with TB? | What do these results mean given 15% prevalence of rifampicin resistance among individuals with TB? | What do these results mean given 30% prevalence of rifampicin resistance among individuals with TB? |
| Rifampicin resistance detection, Xpert used as an initial test replacing conventional drug susceptibility testing | Pooled median sensitivity 94% (87, 97) and pooled median specificity 98% (97, 99) | 2340 (11) | With a prevalence of 2%, 20/1000 will have rifampicin resistance. Of these, 19 (TP) will be identified; 1 (FN) will be missed. Of the 980 patients with TB sensitive to rifampicin, 960 (TN) will not be treated; 20 (FP) may be unnecessarily treated | With a prevalence of 15%, 150/1000 will have rifampicin resistance. Of these, 141 (TP) will be identified; 9 (FN) will be missed. Of the 850 patients with TB sensitive to rifampicin, 833 (TN) will not be treated; 17 (FP) may be unnecessarily treated | With a prevalence of 30%, 300/1000 will have rifampicin resistance Of these, 282 (TP) will be identified; 18 (FN) will be missed. Of the 700 patients with TB sensitive to rifampicin, 686 (TN) will not be treated; 14 (FP) may be unnecessarily treated |
| TP, true positive; FN, false negative; TN, true negative; FP, false positive | |||||
Background
Tuberculosis (TB) is one of the world’s most important infectious causes of morbidity and mortality among adults. When TB is detected and effectively treated, the disease is largely curable. However, in 2010, 8.8 million people developed TB disease (active TB) for the first time (WHO Global Report 2011). Of the total new TB cases, approximately 13% occurred among people living with HIV. Among people without HIV infection, 1.1 million people (14%) died of TB and among people with HIV infection, 350,000 people (31%) died of TB (WHO Global Report 2011).
Drug‐resistant TB, including multidrug‐resistant TB (MDR‐TB, defined as resistance to at least isoniazid and rifampicin, the two most important first‐line anti‐TB drugs) and extensively drug‐resistant TB (XDR‐TB, defined as MDR‐TB plus resistance to any fluoroquinolone (such as ofloxacin or moxifloxacin) and to at least one of three injectable second‐line drugs (amikacin, capreomycin, or kanamycin) has emerged as a serious threat to global health (Zumla 2012). In 2010, there were an estimated 650,000 cases of MDR‐TB (WHO Global Report 2011). Recently, the World Health Organization (WHO) reported the highest rates (greater than 65% in people who had previously received TB treatment) of MDR‐TB ever recorded in several areas of the former Soviet Union (Zignol 2012). Worldwide, a substantial percentage (˜35%) of patients with drug‐susceptible TB remain undiagnosed and a staggering percentage (˜85%) of patients with MDR‐TB remain undiagnosed (WHO Global Report 2011). Of the people diagnosed with TB, less than 3% are tested to determine the pattern of drug resistance (Chaisson 2012). In addition to drug resistance, another major challenge is the accurate detection of smear‐negative disease which disproportionately occurs in HIV‐positive people with TB (Harries 2004).
Accurate and rapid detection of TB, including smear‐negative TB and drug resistant‐TB, are critical for improving patient outcomes (increased cure and decreased mortality, additional drug resistance, treatment failure, and relapse) and decreasing TB transmission. Mycobacterial culture is generally considered the best available reference standard for TB diagnosis and is the first step in detecting drug resistance. However, this is a relatively complex and slow procedure. Solid culture typically takes four to eight weeks for results and liquid culture, though more rapid than solid culture, takes days for results. Liquid culture is, however, more prone to contamination (WHO Policy Framework 2010). In addition, culture requires specialized laboratories and highly skilled staff. In 2010, WHO endorsed a novel, rapid, automated, cartridge‐based nucleic acid amplification test (NAAT), the Xpert® MTB/RIF assay (Cepheid, Sunnyvale, USA) (hereafter referred to as Xpert), that can simultaneously detect TB and rifampicin resistance (WHO Policy Xpert 2011), WHO recommends that Xpert be used as the initial diagnostic test in individuals suspected of MDR‐TB or HIV‐associated TB. If Xpert detects rifampicin resistance in patients considered at risk of MDR‐TB, an appropriate MDR‐TB regimen should be started while additional sputum specimens are obtained for culture and drug susceptibility testing. Subsequent testing will confirm the presence of rifampicin resistance and enable testing for drug resistance to isoniazid and other first‐line drugs and second‐line drugs. Ideally, Xpert should be used at the district or subdistrict health facility level (WHO Policy Xpert 2011).
Target condition being diagnosed
Tuberculosis
TB is caused by the bacterium Mycobacterium tuberculosis and is spread from person to person through the air. TB most commonly affects the lungs (pulmonary TB), but may affect any organ or tissue, such as the brain or bones, outside of the lungs (extrapulmonary TB). Signs and symptoms of pulmonary TB include cough for at least two weeks, fever, chills, night sweats, weight loss, haemoptysis (coughing up blood), and fatigue. Signs and symptoms of extrapulmonary TB depend on the site of disease. TB treatment regimens must contain multiple drugs to which the organisms are sensitive to be effective. The treatment of MDR‐TB is complex, usually requiring two years or more of therapy and drugs that are less potent and more toxic than the drugs used to treat drug‐susceptible TB. International guidelines for TB treatment are issued by WHO and regularly updated. Current WHO guidelines on TB treatment are based on evidence assessed according to the GRADE (Grading of Recommendations Assessment, Development and Evaluation) approach for developing health care recommendations (Guyatt 2011; WHO Guidelines Drug‐resistant TB 2011; WHO Guidelines TB Treatment 2010).
Rifampicin resistance
Rifampicin acts by inhibiting bacterial DNA‐dependent RNA polymerase, encoded by the RNA polymerase gene (rpoB) (Hartmann 1967). Rifampicin resistance has mainly been associated with mutations in a limited region of the rpoB gene (Telenti 1993). Rifampicin resistance may occur alone or in association with resistance to isoniazid and other drugs. In high MDR‐TB settings, the presence of rifampicin resistance alone may serve as a proxy for MDR‐TB (WHO Rapid Implementation 2011). Patients with drug‐resistant TB can transmit the infection to others.
Index test(s)
Xpert is an automated polymerase chain reaction (PCR) test (molecular test) utilizing the GeneXpert® platform (Blakemore 2010; Cepheid 2009; Helb 2010). Xpert is a single test that can both detect M. tuberculosis complex and rifampicin resistance within two hours after starting the test, with minimal hands‐on technical time. Unlike conventional nucleic acid amplification tests (NAATs), Xpert is unique because sample processing and PCR amplification and detection are integrated into a single self‐enclosed test unit, the GeneXpert cartridge. Following sample loading, all steps in the assay are completely automated and self‐contained. In addition, the assay’s sample reagent, used to liquefy sputum, has potent tuberculocidal (the ability to kill TB bacteria) properties and so largely eliminates biosafety concerns during the test procedure (Banada 2010). These features allow the technology to be taken out of a reference laboratory and used nearer to the patient (Small 2011). Xpert requires an uninterrupted and stable electrical power supply, temperature control, and yearly calibration of the cartridge modules (WHO Rapid Implementation 2011).
The test procedure may be used directly on clinical specimens, either raw sputum samples or sputum pellets (also called sputum sediment), samples created after decontaminating and concentrating the sputum (Blakemore 2010). In both cases, the test material is combined with the assay sample reagent, mixed by hand or vortex, and incubated at room temperature for 15 minutes. After the incubation step, 2 mL of the treated sample are transferred to the cartridge and the run initiated (Helb 2010).
Xpert's limit of detection, "the lowest number of colony forming units per sample that can be reproducibly distinguished from negative samples with 95% confidence" (Cepheid 2009), is 5 genome copies of purified DNA per reaction or 131 colony forming units per mL in M. tuberculosis spiked sputum (Helb 2010). In comparison, to see TB bacilli by microscopic examination requires at least 10,000 bacilli per mL of sputum (Toman 2004). Xpert detects both live and dead bacteria (Miotto 2012).
Xpert uses molecular beacon technology to detect rifampicin resistance. Molecular beacons are nucleic acid probes that recognize and report the presence or absence of the normal, rifampicin‐susceptible, 'wild type' sequence of the rpoB gene of TB. Five different coloured beacons are used, each covering a separate nucleic acid sequence within the amplified rpoB gene. When a beacon binds to the matching sequence, it fluoresces or 'lights up', which indicates the presence of one of the gene sequences that is characteristic of rifampicin‐susceptible TB. Failure of the beacon to bind or delayed binding to the matching sequence indicates potential rifampicin resistance. The number and timing of detection (when the fluorescent signal rises above a pre‐determined baseline cycle threshold) of positive beacons as well as results of sample processing controls allows the test to distinguish among the following results: 'No TB; 'TB detected, rifampicin resistance detected'; 'TB detected, no rifampicin resistance detected'; and an 'invalid result' (Figure 1). As mentioned, a single Xpert run will provide both detection of TB and detection of rifampicin resistance. One cannot deselect testing for rifampicin resistance and only run the assay for TB detection, although it is possible for the laboratory to omit results for rifampicin resistance when reporting to the healthcare provider.

Readout of Xpert MTB/RIF assay for a TB positive, rifampicin‐susceptible specimen. Courtesy: Karin Weyer, The WHO STOP TB Department.
Since Xpert was released, there have been four generations of the test involving different software and cartridge combinations. Studies using the first three generations (G1, G2, and G3 cartridges) are included in this systematic review. A newer cartridge, G4, to be used with software version 4.0 or higher, has been released and is now included in all Xpert kits (personal communication; Ellen Jo Baron, Cepheid, 26 June 2012). Studies using G4 and newer versions of the assay will be included in updates of this review.
Clinical pathway
Patients suspected of having pulmonary TB or MDR‐TB.
Prior test(s)
For TB detection, Xpert could be used as an initial test or as an add‐on test following a negative smear microscopy result.
Role of index test(s)
Consistent with WHO recommendations (WHO Policy Xpert 2011), we were interested in the following purposes for testing:
I. Xpert for TB detection
A. Xpert used as an initial test replacing smear microscopy in a population unselected by smear status
B. Xpert used as an add‐on test following a negative smear microscopy result
II. Xpert for rifampicin resistance detection
A. Xpert used as an initial test for rifampicin resistance replacing conventional phenotypic drug susceptibility testing as the initial test.
Xpert does not eliminate the need for subsequent culture and phenotypic drug susceptibility testing, which are required to monitor treatment progress and to detect resistance to drugs other than rifampicin.
Alternative test(s)
In this section, we describe selected alternative tests for detection of TB and rifampicin resistance. For a comprehensive review of these tests, we refer the reader to several excellent resources (Drobniewski 2012; Nahid 2012; UNITAID 2012).
Smear microscopy, the direct examination of sputum smears with Ziehl‐Neelsen staining for acid‐fast bacilli (TB bacteria), is the most commonly used test for TB detection in resource‐limited settings (International Standards 2009). Advantages of smear microscopy include its simplicity, low cost, speed, and high specificity in high TB burden areas. In addition, smear microscopy identifies the most infectious TB patients. Smear microscopy can be performed in basic laboratories. Drawbacks of smear microscopy include the need for specialized training and its relatively low sensitivity, 50% to 60% on average. Although, the sensitivity of microscopy can be improved by approximately 10% with fluorescence (Steingart 2006), a large number of TB cases still go undiagnosed. Smear microscopy contributes little to the diagnosis of paediatric TB and does not, by definition, identify smear‐negative TB which may account for 24% to 61% of all pulmonary cases in people living with HIV (Getahun 2007; Perkins 2007; Steingart 2006a). Microscopy cannot distinguish between drug‐susceptible TB and drug‐resistant TB.
Nucleic acid amplification tests (NAATs) are molecular systems that can detect small quantities of genetic material (DNA or RNA) from microorganisms, such as TB. A variety of molecular amplification methods are available, of which PCR is the most common. NAATs are available as commercial kits and in‐house tests (based on a protocol developed in a non‐commercial laboratory) and are used routinely in high‐income countries for TB detection. In‐house PCR is widely used in developing countries because these tests are less expensive than commercial kits. However, in‐house PCR is known to produce highly inconsistent results (Flores 2005). The use of NAATs has recently been recommended as standard practice in the United States (CDC 2009). The main advantage of NAATs is that they can provide results several weeks earlier than culture (CDC 2009). Drawbacks are that these tests are often too expensive and complex for routine use by TB programmes in resource‐limited settings. In addition, although the specificity of NAATs is high, some NAATs have shown variable and low sensitivity, especially in sputum smear‐negative patients (Flores 2005; Greco 2006; Ling 2008a).
Loop‐mediated isothermal amplification (LAMP), a molecular method for TB detection, amplifies DNA under isothermal conditions. The large quantity of DNA generated makes it possible to detect amplification and interpret the assay result by visual inspection for fluorescence or turbidity (Boehme 2007). Advantages of LAMP are that the method is rapid (results can be obtained within several hours) and highly specific for M. tuberculosis complex. In addition, LAMP can be used in areas with limited resources such as district level laboratories because it is relatively inexpensive, does not require the use of a thermal cycler, and is simple to perform (UNITAID 2012). Drawbacks include the difficulty in interpreting test results via the colorimetric change. A decision and potential policy guidance from the WHO Expert Group that reviewed the available evidence on LAMP is forthcoming (personal communication; Wayne Van Gemert, 20 June 2012).
Alternative molecular methods for drug susceptibility testing include the commercial line probe assays, INNO‐LiPA Rif.TB (Innogenetics, Ghent, Belgium) and GenoType® MTBDRplus assay (Hain LifeScience GmbH, Nehren, Germany). The INNO‐LiPA Rif.TB assay targets common mutations in the rpoB gene associated with rifampicin resistance while the GenoType® MTBDRplus assay also targets the common mutations in katG and inhA genes associated with isoniazid resistance in addition to the mutations in the rpoB gene (UNITAID 2012). Advantages of lIne probe assays are that they can provide a result for detection of TB and drug resistance in 1 to 2 days. Line probe assays have both high sensitivity (greater than 97%) and high specificity (greater than 99%) for the detection of rifampicin resistance alone, or in combination with isoniazid (sensitivity greater than 90%; specificity greater than 99%), on TB isolates and smear‐positive sputum specimens (Ling 2008). Drawbacks are that line probe assays are expensive and must be used in reference laboratories (Nahid 2012). These tests have been endorsed by WHO (WHO Policy Line Probe Assays 2008).
Several alternative culture‐based methods for TB detection and drug susceptibility testing are available, including the microscopic observation drug susceptibility (MODS) assay which is available in both a non‐commercial and commercial version (Hardy Diagnostics, USA), non‐commercial colorimetric redox indicator methods and the non‐commercial nitrate reductase assay. MODS is used for both detection of TB and detection of resistance to rifampicin and isoniazid. The basic principle underlying MODS is that M. tuberculosis complex bacteria grow as a corded mass while most nontuberculous mycobacteria (NTM) do not. The morphology of the bacteria can be observed with an inverted microscope (Moore 2006). Colorimetric redox indicator methods use the principle of a change in the colour of a dye to indicate the growth of viable mycobacteria in the medium (Martin 2007). The nitrate reductase assay is based on the ability of M. tuberculosis to reduce nitrate to nitrite. A dye is used to indicate bacterial growth (Martin 2008). All three methods have high accuracy for detection of rifampicin resistance, are inexpensive, and are relatively rapid (results are generally available in less than 10 days). Drawbacks of these tests include biosafety requirements, the need for specialized training, and the absence of standard methods for colorimetric methods and the nitrate reductase assay. Culture‐based methods also involve challenges with preparing, diluting and storing drug solutions, and a need for a consistent power supply to maintain incubator temperatures (UNITAID 2012). WHO has endorsed MODS and the nitrate reductase assay for direct drug susceptibility testing of sputum specimens and all three methods for indirect drug susceptibility testing of TB isolates grown in conventional culture (WHO Policy Noncommercial Culture 2011). WHO considers the use of these tests as an interim solution while TB programmes build capacity for molecular tests or automated liquid culture and drug susceptibility testing (WHO Policy Noncommercial Culture 2011).
Rationale
Xpert, if accurate, would provide obvious benefits for patients (earlier diagnosis and the opportunity to begin earlier, appropriate treatment) and for public health (opportunities to interrupt TB transmission), especially in developing countries. To our knowledge, at the time of writing this review, one systematic review and meta‐analysis on the diagnostic accuracy of Xpert has been published (Chang 2012). However, the authors used statistical methods for meta‐analysis other than the currently recommended bivariate random‐effects models (Macaskill 2010).
In September 2010, the WHO Stop TB Department convened an Expert Group meeting to review the available evidence on Xpert for the purpose of formulating recommendations to guide the use of the test (WHO Policy Xpert 2011). Since that time, the evidence has rapidly accumulated and additional studies on Xpert have been published. We conducted a systematic review to synthesize this body of evidence using currently recommended methods.
Objectives
Primary objectives
Since Xpert can detect both TB and rifampicin resistance, we had two review questions with the following primary objectives:
I. Xpert for TB detection
To determine summary estimates of the diagnostic accuracy of Xpert for the diagnosis of pulmonary TB in adults
II. Xpert for rifampicin resistance detection
To determine summary estimates of the diagnostic accuracy of Xpert for detection of rifampicin resistance in adults
Setting of testing
We were interested in how Xpert performed in patients who were evaluated in peripheral laboratories or health facilities. Laboratory services for TB may be described at three levels: peripheral level (typically district or subdistrict laboratories or more decentralized peripheral microscopy centres); intermediate level (typically regional laboratories); and central level (typically national or reference laboratories) (WHO Policy Framework 2010). Diagnostic tests often perform well when initially evaluated in reference laboratories; however tests may not perform as well when they are run in settings of intended use. As mentioned above, Xpert is intended for use in laboratories or health facilities at the district or subdistrict level. Xpert is currently not intended for use at peripheral microscopy centres.
Methods
Criteria for considering studies for this review
Types of studies
We included primary studies that assessed the diagnostic accuracy of Xpert for pulmonary TB and/or rifampicin resistance. Diagnostic accuracy studies are typically cross‐sectional in design. However, we also searched for randomized controlled trials (RCTs) and cohort studies. We only included studies that reported data comparing Xpert to an acceptable reference standard from which we could extract true positive (TP), true negative (TN), false positive (FP), and false negative (FN) values. Xpert could be assessed alone or together with other tests.
We excluded studies with a case‐control design because these types of studies are prone to bias, in particular, studies enrolling patients with severe disease and healthy participants without disease. We also excluded studies reported only in abstracts.
Participants
Studies had to include adult or predominantly adult patients suspected of having pulmonary TB or MDR‐TB, with or without HIV infection. We considered adults to be 15 years of age or older. We included studies that assessed the diagnostic accuracy of Xpert using sputum and other respiratory specimens, such as fluid obtained from bronchial alveolar lavage and tracheal aspiration. We included studies from all settings and all countries. Data on age of study participants were available for the majority of included studies. We considered it highly likely that studies that did not report age data involved all or predominantly adults for the following reasons: the vast majority of specimens evaluated with Xpert were sputum specimens and children have difficulty producing sputum; we excluded data on specimens obtained by gastric aspiration, as this specimen collection method is used mostly for investigating TB in children; we excluded studies that specifically evaluated the use of Xpert in children; and we performed a sensitivity analysis by dropping studies that did not report age data to check whether the accuracy results changed (Sensitivity analyses).
Index tests
Xpert was the index test under evaluation.
Target conditions
The target conditions were active pulmonary TB and rifampicin resistance.
Reference standards
For TB, acceptable reference standards utilized solid media: Löwenstein‐Jensen, Middlebrook 7H10 or 7H11, or Ogawa media; or a commercial liquid culture system: such as BACTEC™ 460TB System or BACTEC™ MGIT™ (mycobacterial growth indicator tube) 960 Mycobacterial Detection System, BD, USA; BacT/ALERT® System, bioMérieux, France; or both solid media and a commercial liquid culture system; or VersaTREK® Mycobacteria Detection & Susceptibility, Thermo Fisher Scientific, USA.
For rifampicin resistance, the reference standards were conventional phenotypic drug susceptibility testing methods as recommended by WHO (WHO Policy DST 2008). Acceptable methods used solid media, such as Löwenstein‐Jensen, Middlebrook 7H10 or 7H11, or Ogawa media and/or a commercial liquid culture system, such as BACTEC™ 460TB System or BACTEC™ MGIT™ (mycobacterial growth indicator tube) 960 Mycobacterial Detection System, BD, USA; BacT/ALERT® System, bioMérieux, France; or VersaTREK® Mycobacteria Detection & Susceptibility, Thermo Fisher Scientific, USA.
Search methods for identification of studies
We attempted to identify all relevant studies regardless of language or publication status (published, unpublished, in press, and ongoing).
Electronic searches
Vittoria Lutje, (VL) the Information Specialist from the Cochrane Infectious Diseases Group, searched the following databases on 25 September 2011 using the strategy described in Appendix 1: Cochrane Infectious Diseases Group Specialized Register; MEDLINE; EMBASE; ISI Web of Knowledge; MEDION; LILACS; BIOSIS; and SCOPUS. She also searched the metaRegister of Controlled Trials (mRCT) and the search portal of the WHO International Clinical Trials Registry Platform, to identify ongoing trials. She repeated searches on 15 December 2011. We limited all searches to 2007 onward because the development of Xpert was completed in 2009 and the first paper describing its clinical use was published electronically in 2009 (Helb 2010). VL performed the searches without language restriction.
Searching other resources
To identify additional published, unpublished, and ongoing studies, we performed the following tasks:
-
reviewed reference lists of included articles and review articles identified through the above methods;
-
contacted Cepheid, the test manufacturer;
-
handsearched WHO reports on Xpert;
-
contacted researchers at the Foundation for Innovative New Diagnostics (FIND), members of the Stop TB Partnership's New Diagnostics Working Group, and other experts in the field of TB diagnostics.
While preparing this review, the Xpert MTB/RIF Mapping Tool became available (http://xrmt.treattb.org/projects‐listing2). This tool has been developed by the International Union Against Tuberculosis and Lung Disease, through the USAID‐funded TREAT TB initiative, and supported by WHO. The tool allows researchers and policy makers to globally map ongoing research activities related to Xpert. We may use this tool to identify studies for updates of this review.
Data collection and analysis
Selection of studies
Two review authors (KRS and HS) independently scrutinized titles and abstracts identified by electronic literature searching to identify potentially eligible studies (screen 1). We selected any citation identified by either review author during screen 1 for full‐text review. Next, we retrieved the full paper of each potentially eligible article identified in the search. Two review authors (KRS and HS) independently assessed articles for inclusion using predefined inclusion and exclusion criteria (screen 2). In screen 2, we resolved any discrepancies by discussion between the review authors, or if necessary, by decision of a third review author (MP). We maintained a list of excluded studies and their reasons for exclusion.
We named studies according to the surname of the first author and year of publication. For multicentre studies, the study‐naming scheme uniquely identifies multiple study centres from within each study (Boehme 2010a; Boehme 2010b), each of which reported data separately for a distinct population at a given study site. Hence, the number of study centres exceeds the number of studies. (Please note that when cited in the text, "Boehme [year]a" refers to an overall paper, consisting of all centres).
Data extraction and management
We extracted data on the following characteristics:
-
author; publication year; study design; case country of residence; country income status classified by the World Bank List of Economies (World Bank 2011); clinical setting; laboratory setting;
-
population, age, gender, HIV status, smear status, and follow‐up;
-
reference standard;
-
parameter value in the Xpert system associated with determining rifampicin resistance;
-
specimen collection (expectorated sputum, induced sputum)
-
condition of the specimen (fresh or frozen);
-
preparation of the specimen (processed or unprocessed);
-
QUADAS‐2 items (Whiting 2011);
-
data for two‐by‐two tables for Xpert, including results reported as indeterminate (results reported as invalid, error, or no result);
-
time to diagnosis (time from specimen collection until there is an available TB result in laboratory or clinic);
-
time to treatment initiation (time from specimen collection until time patient starts treatment).
Whenever possible, we extracted TP, FP, FN, and TN values based on one Xpert result for one specimen provided by one patient. However, in some of the studies, the number of specimens (and Xpert results) exceeded the number of patients, suggesting that a single patient may have provided multiple specimens. We therefore compared pooled sensitivity and specificity for TB detection in all studies with pooled sensitivity and specificity in the subset of studies that provided one Xpert result based on one specimen provided by one patient (see Sensitivity analyses).
When data were available, we extracted FP and TN values for participants without TB disease by their smear and HIV status. Concerning the definition of smear positivity, as the vast majority of included studies performed Xpert in reference laboratories, we assumed these studies adhered to the revised definition of a new sputum smear‐positive pulmonary TB case based on the presence of at least one acid‐fast bacillus in at least one sputum sample in countries with a well functioning external quality assurance system (WHO Policy Smear‐positive TB Case 2007).
We developed a standardized data extraction form and piloted the form with four studies (22%). Based upon the pilot, we finalized the form. Two review authors (KRS and HS) independently extracted data from each study using the final form. We contacted authors of studies for missing data and clarifications. We entered all data into Excel and SPSS 2006. The final data extraction form is included in Appendix 2.
Assessment of methodological quality
We appraised the quality of included studies with the Quality Assessment of Diagnostic Accuracy Studies (QUADAS‐2) tool (Whiting 2011). QUADAS‐2 consists of four domains: patient selection, index test, reference standard, and flow and timing. We assessed all domains for the potential for risk of bias, and, in addition, we assessed the first three domains for concerns regarding applicability. We used questions, called signalling questions, for each domain to form judgments about the risk of bias. As recommended, we first developed guidance on how to appraise each signalling question and interpret this information. Then, one review author (KRS) piloted the tool with four (22%) of the included studies. Based on experience gained from the pilot, we finalized the tool. Two review authors independently assessed the methodological quality of the included studies with the finalized tool. We presented results in the text, in graphs, and in a table. We did not generate a summary "quality score" because of problems associated with such numeric scores (Juni 1999; Whiting 2005). The domains of the QUADAS‐2 tool and their interpretation are provided in Appendix 3.
Statistical analysis and data synthesis
We performed descriptive analyses for the results of the included studies using SPSS 2006 and present key study characteristics in Characteristics of included studies. We used data reported in the two‐by‐two tables to calculate sensitivity and specificity estimates and 95% confidence intervals (CI) for individual studies and to generate forest plots using Review Manager 5. We chose to use data that were not subject to discrepant analyses (ie unresolved data), since resolved data after discrepant analyses are a potential for risk of bias (Hadgu 2005).
We carried out meta‐analyses to estimate the pooled sensitivity and specificity of Xpert separately for TB detection (I. A. and I. B) and rifampicin resistance detection (II. A.). We determined pooled estimates using an adaptation of the bivariate random‐effects model (Reitsma 2005) to allow for a hierarchical structure for the two multicentre studies (Boehme 2010a; Boehme 2011a). The bivariate random‐effects approach allowed us to calculate the pooled estimates of sensitivity and specificity while dealing with potential sources of variation caused by (1) imprecision of sensitivity and specificity estimates within individual studies; (2) correlation between sensitivity and specificity across studies; and (3) variation in sensitivity and specificity between studies.
We estimated all models using a Bayesian approach with non‐subjective prior distributions and implemented using WinBUGS (Version 1.4.3) (Lunn 2000). Under the Bayesian approach, all unknown parameters must be provided a prior distribution that defines the range of possible values of the parameter and the likelihood of each of those values based on information external to the data. In order to let the observed data determine the final results, we chose to use low‐information prior distributions over the pooled sensitivity and specificity parameters and their between‐study standard deviation parameters. The model we used is summarized in the Statistical Appendix together with the WinBUGS program used to implement it (Appendix 4). Information from the prior distribution is combined with the likelihood of the observed data in accordance with Bayes Theorem to obtain a posterior distribution for each unknown parameter.
Using a sample from the posterior distribution we can obtain various descriptive statistics of interest. We estimated the median pooled sensitivity and specificity and their 95% credible intervals (CrI).The median or the 50% quantile is the value below which 50% of the posterior sample lies. We chose to report the median because the posterior distributions of some parameters may be skewed and the median would be considered a better point estimate of the unknown parameter than the mean in such cases. The 95% CrI is the Bayesian equivalent of the classical (frequentist) 95% CI. (We have indicated 95% CI for individual study estimates and 95% CrI for pooled study estimates as appropriate).The 95% CrI may be interpreted as an interval that has a 95% probability of capturing the true value of the unknown parameter given the observed data and the prior information. We also extracted estimates of the 'predicted' sensitivity and specificity in a future study together with their 95% CrIs. The predicted value gives an idea of heterogeneity at the study level. We can compare the predicted intervals to the pooled intervals to get an idea of the heterogeneity. With a large number of studies, the pooled interval may be narrow. However, if there is considerable variability in sensitivity and specificity estimates between studies, this variability will be reflected in a wide predicted interval despite the large number of studies. We generated the plots using R (version 2.15.1) (R 2008).
I. B. Xpert used as an add‐on test following a negative smear microscopy result
To determine the value of Xpert as an add‐on test, we estimated its sensitivity and specificity among smear‐negative patients. We did this by evaluating two types of studies: 1) studies that enrolled participants selected to be predominantly smear negative by prior microscopic examination and 2) studies that enrolled unselected participants who were evaluated by both Xpert and microscopy concurrently. In the second group, we used only the data for those individuals who had a negative microscopy result. As described above, we determined pooled estimates using an adaptation of the bivariate random‐effects model (Reitsma 2005).
Approach to indeterminate index test results
We excluded indeterminate test results from the analyses for determination of sensitivity and specificity for both TB detection and rifampicin resistance detection. We used a hierarchical model for a single proportion to estimate the proportion of indeterminate index test results.
Investigations of heterogeneity
I. A. TB detection
We first investigated heterogeneity through visual examination of forest plots of sensitivity and specificity. We then explored the possible influence of clinical factors by analyses of the subgroups described in the protocol. We expected the majority of studies to report TP, FP, FN, and TN values by smear status and several studies to report values by HIV status. Therefore, we fit the meta‐analysis model separately within subgroups defined by smear and HIV status to examine the effects of these covariates on the pooled sensitivity and specificity. To study the impact of the remaining covariates of interest, we extended the meta‐analysis model to a meta‐regression model for the sake of statistical efficiency. We did this by expressing the pooled logit(sensitivity) and logit(specificity) as linear functions of a dichotomous covariate to examine the effects of individual covariates on the pooled sensitivity and specificity. The covariates considered were all dichotomous variables and related to the condition of the specimens (fresh versus frozen), preparation of the specimens (unprocessed versus processed), TB prevalence (low ≤ 30% versus high > 30%), and country income status (low‐/middle‐income versus high‐income).
II. A. Detection of rifampicin resistance
As mentioned, there have been four versions of Xpert, G1, G2, G3, and G4 (the current version). At the time we performed this review, there were no published studies of G4. Studies included in this review used Xpert versions G1, G2, and G3. The different Xpert versions involve software and cartridge processing adjustments with consequent changes in the way the presence or absence of rifampicin resistance is determined in the Xpert system. One of several factors influencing the determination of rifampicin resistance in the earlier Xpert versions (those included in this review) was a parameter value, also called delta cycle threshold cutoff adjusted to provide the optimum tradeoff between sensitivity for detecting 'rifampicin resistant' samples and specificity for detecting 'rifampicin susceptible' samples. A parameter value of 3.5 was incorporated in the algorithm for Xpert version G1, and a parameter value of 5, in the algorithm for Xpert versions G2 and G3. We investigated the influence of these two parameter values (3.5 and 5) on sensitivity and specificity by including a dichotomous covariate in the regression model.
We also explored the influence of rifampicin resistance prevalence on the pooled sensitivity and specificity estimates by including a dichotomous covariate, high prevalence > 15% and low prevalence ≤ 15%, in the regression model.
Sensitivity analyses
We performed sensitivity analyses by limiting inclusion in the meta‐analysis to: 1) studies that provided data by age that explicitly met the age criterion for participants; 2) studies where consecutive patients were selected; 3) studies where a single specimen yielded a single Xpert result for a given patient; and 4) studies that explicitly represented the use of Xpert for the diagnosis of patients suspected of having TB.
Assessment of reporting bias
We chose not to carry out formal assessment of publication bias using methods such as funnel plots or regression tests because such techniques have not been found to be helpful for diagnostic test accuracy studies (Macaskill 2010). However, Xpert is produced by only one manufacturer and, being a new test for which there has been considerable attention and scrutiny, we believe reporting bias was minimal.
Other analyses
NTM
NTM, such as M. avium complex and M. intracellulare, comprise a multi‐species group of human pathogens that are ubiquitous in water and soil. NTM can cause severe pulmonary and other diseases that share clinical signs with TB but are treated differently from TB, including drug‐resistant TB. People living with HIV with severe immunosuppression are particularly vulnerable to infections caused by NTM (Gopinath 2010). NTMs were not mentioned in the majority of studies, and, when reported, were usually excluded from specificity determinations. We, therefore, summarized separately data for NTM by determining the percent of false‐positive Xpert results in samples that grew NTMs (see Other analyses: NTM).
Results
Results of the search
We performed the initial electronic search on 25 September 2011 and we identified 139 titles. We added five titles through reference checking and correspondence with experts in the field. After we removed duplicates, 137 titles remained of which we excluded 78 titles based on a review of title and abstract. We retrieved full‐text articles for 59 citations, of which we excluded 41 for the following reasons: abstract (nine studies); case control design (one study); cost‐effectiveness analysis (one study); duplicate title (one study); editorials or comments (15 studies); evaluation of Xpert for extrapulmonary TB (five studies) or paediatric TB (one study); narrative reviews (six studies); and technical aspects (two studies) (Characteristics of excluded studies describes selected papers). We performed an updated search on 15 December 2011 that yielded 81 titles, all of which had been identified during the previous search or were ineligible based on title or abstract. Thus, we included 18 relevant studies in this review, (Figure 2). Of the total 18 studies, two were international multicentre studies (Boehme 2010a; Boehme 2011a) carried out at five and six study centres, respectively. The two studies by Boehme involved different patients. For Boehme 2010a and Boehme 2011a descriptive results and methodological quality were presented at the study centre level. Meta‐analysis results were presented at the study level. One other study, conducted at three sites, presented accuracy data for the three sites combined and was considered as a single study and a single study centre (Marlowe 2011). Hence there were 27 study centres in the review.

Flow diagram of studies in the review.
Methodological quality of included studies
Figure 3 shows the overall quality of the 27 study centres included in the review. In the patient selection domain, we considered 20 study centres (74%) to be at low risk of bias because participants were enrolled consecutively. We considered the majority of the remaining study centres to be at high risk of bias, mainly because the sampling method was by convenience. With regard to applicability (patient characteristics and setting), we judged six study centres (one study) to be of low concern because the study centres in this study evaluated Xpert in decentralized laboratories associated with health clinics and provincial hospitals (Boehme 2011a). The remaining study centres in the review ran Xpert in reference laboratories, thus their results may not be generalizable to other settings that lack specialized laboratory infrastructure and highly trained personnel. We also noted that no study centre used Xpert at the point of care in a health facility outside a laboratory. In the index test domain, we considered all study centres to be at low concern for both risk of bias and applicability. In the reference standard domain, we judged 23 study centres (85%) to be at low risk of bias for TB and 24 study centres (89%) to be at low risk of bias for rifampicin resistance. In the reference standard domain, we judged Hanif 2011 to be at high risk of bias for TB as the target condition (objective I) because blinding was not reported, but low risk of bias for rifampicin resistance as the target condition (objective II) since this study used BACTEC 460, a system that provides an automated test result. We judged applicability to be of low concern for all studies in the reference standard domain. In the flow and timing domain, we considered 23 study centres (85%) to be of low concern for risk of bias because all patients were accounted for in the analysis and information about indeterminate results was provided. The quality assessment results for the individual study centres can be found in Figure 4. Note that we had nearly complete information for all study centres.

Risk of bias and applicability concerns graph: review authors' judgements about each domain presented as percentages across the 27 included study centres (18 studies). The reference standard domain pertains to TB as the target condition. See text for the reference standard pertaining to rifampicin resistance.

Risk of bias and applicability concerns summary: review authors' judgements about each domain for each included study centre.
Findings
Eighteen studies including 7816 participants (median number in the studies 117, Interquartile range (IQR) 93, 214), evaluated Xpert for TB detection. The prevalence of TB in the 18 studies ranged from 18.3% (Lawn 2011) to 100% (Friedrich 2011), median 37.4% (IQR 29.4, 59.8). Of the total 18 studies, 11 studies including 2340 participants provided data for 2 x 2 tables for rifampicin resistance detection. Of the remaining studies, four studies reported that all specimens were found to be drug sensitive (no rifampicin resistant specimens) (Ciftci 2011; Hanif 2011; Marlowe 2011; Rachow 2011); two studies provided data jointly for pulmonary and extrapulmonary specimens (Miller 2011; Moure 2011); and one study did not report information on rifampicin resistance (Helb 2010). The prevalence of rifampicin resistance in the 11 studies ranged from 0.8% (Teo 2011) to 29.4% (Scott 2011), median 7.3% (IQR 3.0, 19.6). All studies used a cross‐sectional study design relevant to determining the diagnostic accuracy of Xpert. The majority of studies used expectorated (coughed‐up) sputum not induced sputum.
Characteristics of included studies presents key characteristics for the 27 study centres. Nineteen study centres (70.4%) (10 studies (55.6%)) were located in low‐income or middle‐income countries. In the countries represented by the 27 study centres, TB incidence rates per 100,000 population ranged from 4.1 (USA) to 981 (South Africa). The percent MDR‐TB among new TB cases ranged from 0.9% (Greece and South Africa, Cape Town) to 22.3% (Azerbaijan) and among retreatment cases, ranged from 0% (Tanzania) to 55.8% (Azerbaijan) (Wright 2009; WHO Drug Resistance 2008; WHO M/XDR‐TB 2010; Zignol 2012).
I. A. TB detection, Xpert used as an initial test replacing smear microscopy
Forest plots of Xpert sensitivity and specificity for TB detection are presented for the total 18 studies (27 study centres) in Figure 5. Sensitivity estimates varied from 58% to 100% and specificity estimates, from 94% to 100%. We included fifteen of the total 18 studies, including 7517 participants, in this meta‐analysis. We excluded one study because it preferentially enrolled smear‐positive patients (Friedrich 2011) and two studies because they preferentially enrolled smear‐negative patients (Ioannidis 2011; Moure 2011). The pooled median sensitivity and specificity were 88% (95% CrI 83% to 92%) and 98% (95% CrI 97% to 99%), respectively, (Table 1). The predicted sensitivity and specificity for Xpert for TB detection were 88% (95% CrI 66% to 97%) and 98% (95% CrI 92% to 100%), respectively, the wider 95% CrIs around the predicted values suggesting some variability between studies particularly in sensitivity. Figure 6 presents the pooled and predicted sensitivity and specificity estimates together with the credible and prediction regions for Xpert for TB detection. The summary point appears close to the upper left‐hand corner of the plot, suggesting high accuracy of Xpert for TB detection. The 95% credible region around the summary (pooled) value of sensitivity and specificity, the region that contains likely combinations of the pooled sensitivity and specificity, is relatively narrow. The 95% prediction region is wider, displaying more uncertainty as to where the likely values of sensitivity and specificity might occur for individual studies.

Forest plots of Xpert sensitivity and specificity for TB detection, Xpert used as an initial test replacing smear microscopy. The individual studies are ordered by decreasing sensitivity. TP = True Positive; FP = False Positive; FN = False Negative; TN = True Negative. Between brackets are the 95% CI of sensitivity and specificity. The figure shows the estimated sensitivity and specificity of the study (blue square) and its 95% CI (black horizontal line). Xpert specificity could not be estimated in one study.

Summary plots of Xpert sensitivity and specificity for TB detection, Xpert used as an initial test replacing smear microscopy. Each individual study is represented by an empty square. The size of the square is proportional to the sample size of the study such that larger studies are represented by larger squares. The filled circle is the pooled median estimate for sensitivity and specificity. The solid curves represent the 95% credible region around the summary estimate; the dashed curves represent the 95% prediction region.
| Type of analysis (Number of studies) | Pooled sensitivity Median (95% credible interval) | Pooled specificity Median (95% credible interval) | Predicted sensitivity Median (95% credible interval) | Predicted specificity Median (95% credible interval) |
| Xpert used as an initial test for TB detection replacing microscopy (15)*
| 88% (83, 92) | 98% (97, 99) | 88% (66, 97) | 98% (92, 100) |
| Xpert used as an add‐on test for TB detection following a negative smear microscopy result (14) | 67% (58, 74) | 98% (97, 99) | 66% (40, 86) | 98% (93, 100) |
| Xpert used as an initial test for rifampicin resistance detection replacing conventional drug susceptibility testing as the initial test (11) | 94% (87, 97) | 98% (97, 99) | 94% (75, 99) | 98% (91, 100) |
*Three studies that preferentially enrolled smear‐positive or smear‐negative patients were excluded
I. B. TB detection, Xpert used as an add‐on test following a negative smear microscopy result
We presented forest plots of Xpert sensitivity and specificity for TB detection for studies reporting data for smear‐negative patients for 16 studies (25 study centres) in Figure 7. Two studies initially performed microscopy and, for those patients found to be smear‐negative, subsequently ran the Xpert test (Ioannidis 2011; Moure 2011). Both studies were laboratory‐based assessments performed in high‐income countries. Ioannidis 2011 (n = 52) reported a higher sensitivity (83%, 95% CI 59% to 86%) and lower specificity (94%, 95% CI 80% to 99%) than Moure 2011 (n = 107) (sensitivity of 78%, 95% CI 67% to 87%; specificity of 100%, 95% CI 88% to 100%). As noted above, we considered a diagnostic strategy that enrolled unselected participants who were evaluated by both Xpert and microscopy concurrently to be a proxy for a strategy in which Xpert was used as an add‐on test following a negative smear microscopy result. We included fourteen studies, including 5719 participants, in this meta‐analysis. We excluded Ioannidis 2011,Moure 2011, and two additional studies from this analysis: Ciftci 2011 because data by smear status were not provided and Friedrich 2011 because this study preferentially selected smear‐positive patients. In the meta‐analysis, the pooled sensitivity was 67% (95% CrI 58% to 74%) and the pooled specificity was 98% (95% CrI 97% to 99%) (Table 1). Figure 8 presents the pooled and predicted sensitivity and specificity estimates together with the credible and prediction regions for this analysis. The summary point is relatively far from the upper left‐hand corner of the plot, suggesting low accuracy of Xpert when used as an add‐on test following microscopy. The 95% credible region around the summary value of sensitivity and specificity is relatively wide.

Forest plots of Xpert for TB detection, Xpert used as an add‐on test following a negative smear microscopy result. TP = True Positive; FP = False Positive; FN = False Negative; TN = True Negative. Between brackets the 95% CI of sensitivity and specificity. The figure shows the estimated sensitivity and specificity of the study (blue square) and its 95% CI (black horizontal line).

Summary plots of Xpert sensitivity and specificity for TB detection, Xpert used as an add‐on test following a negative smear microscopy result. Each individual study is represented by an empty square. The size of the square is proportional to the sample size of the study such that larger studies are represented by larger squares. The filled circle is the pooled median estimate for sensitivity and specificity. The solid curve represents the 95% credible region around the summary estimate; the dashed curves represent the 95% prediction region.
Indeterminate results
Of the total 18 studies, four studies reported zero indeterminate results; 10 studies reported the number of indeterminate test results; and four studies did not provide information about indeterminate results. Data were available only at the study level for multicentre studies. Of 13,277 tests performed, the pooled proportion of indeterminate test results was very low (1.1%, 95% CrI 0.04% to 2.0%).
Investigations of heterogeneity, TB detection
Clinical subgroups
It is possible that the accuracy of Xpert in distinct subgroups of patients could differ causing heterogeneity in Xpert performance. We, therefore, determined sensitivity and specificity estimates for patients grouped by smear or HIV status.
TB detection in smear‐positive and smear‐negative patients
Figure 9 displays the forest plots for studies reporting data for smear‐positive patients. There was little heterogeneity in sensitivity estimates, range 95% to 100%. For determination of Xpert specificity, only five of the 15 studies reported the cross‐tabulation between smear and culture and, as expected, very few (≤ 1) smear‐positive, culture negative participants were recorded (Bowles 2011; Hanif 2011; Ioannidis 2011; Malbruny 2011; Teo 2011). We included 1735 participants in the meta‐analysis of Xpert for smear‐positive, culture‐positive TB. The pooled sensitivity estimate was very high at 98% (95% CrI 97% to 99%) (Table 2). We could not estimate Xpert pooled specificity in the studies in this subgroup as the participants were all considered true TB positive.

Forest plot of Xpert sensitivity for TB detection in smear‐positive subgroup. The squares represent the sensitivity and specificity of one study, the black line its CI. TP = true positive; FP = false positive; FN = false negative; TN = true negative. Xpert specificity could not be estimated in these studies.
| Covariate | Sensitivity Median (95% credible interval) | Specificity Median (95% credible interval) |
| Smear status |
|
|
| Smear + | 98% (97, 99) | *** |
| Smear ‐ | 68% (59, 75) | 98% (97, 99) |
| Difference (Smear+ minus Smear‐) | 31% (23, 39) | ** |
| P (Smear+ > Smear‐) | 1.00 | ** |
| HIV status |
|
|
| HIV+ | 80% (67, 88) | 97% (93, 99) |
| HIV‐ | 89% (81, 94) | 99% (96, 99) |
| Difference (HIV+ minus HIV‐) | ‐9% (‐22, 3) | ‐1% (‐5, 2) |
| P (HIV+ > HIV‐) | 0.06 | 0.21 |
| Condition of specimen |
|
|
| Fresh | 88% (80, 93) | 99% (98, 100) |
| Frozen | 85% (77, 91) | 97% (95, 99) |
| Difference (Fresh minus Frozen) | 3% (‐7, 13) | 2% (0.1, 4) |
| P (Fresh > Frozen) | 0.73 | 0.98 |
| Specimen preparation |
|
|
| Unprocessed | 92% (87, 96) | 99% (97, 99) |
| Processed | 85% (79, 90) | 98% (96, 99) |
| Difference (Unprocessed minus Processed) | 7% (0.2, 14) | 0.8% (‐1, 3) |
| P (Unprocessed > Processed) | 0.98 | 0.84 |
| TB prevalence |
|
|
| High (> 30%) | 89% (84, 93) | 98% (96, 99) |
| Low (≤ 30%) | 86% (77, 92) | 99% (97, 99) |
| Difference (High minus Low) | 3% (‐5, 12) | ‐0.4% (‐2, 1) |
| P (High > Low) | 0.80 | 0.29 |
| Country income level |
|
|
| High‐income | 92% (86, 96) | 98% (95, 99) |
| Low‐ and middle‐income | 85% (79, 90) | 99% (97, 99) |
| Difference (High‐income minus Low‐ and middle‐income) | 6% (‐1, 14) | ‐1% (‐3, 1) |
| P (High‐income > Low‐ and middle‐income) | 0.96 | 0.23 |
P = probability
Figure 7 displays the forest plots for studies reporting data for smear‐negative patients. There was considerable variability in sensitivity estimates, 43% to 100%. Specificity estimates showed far less variation, ranging from 94% to 100%. The study by Lawn 2011, which showed the lowest sensitivity, evaluated the use of Xpert to screen HIV‐infected patients with advanced immunodeficiency enrolling in antiretroviral therapy services regardless of symptoms. Although the majority of patients in the study had TB symptoms, the inclusion of asymptomatic patients may explain the lower sensitivity in this study. For the meta‐analysis, 15 studies (24 study centres) provided a within‐study comparison of smear‐positive and smear‐negative participants. We excluded three studies from this analysis: one study that pre‐selected smear‐positive patents (Friedrich 2011), one study that enrolled only smear‐negative patients (Moure 2011), and one study that did not provide data by smear status (Ciftci 2011). We included 5771 participants in the meta‐analysis of Xpert for smear‐negative, culture‐positive TB. The pooled sensitivity estimate for smear‐negative TB was 68% (95% CrI 59% to 75%), considerably lower than the pooled sensitivity estimate for smear‐positive TB of 98% (95% CrI 97% to 99%) (Table 2). The 95% CrI for the difference in Xpert sensitivity in smear‐positive and smear‐negative subgroups lies entirely above 0 (Table 2).
TB detection among people living with HIV
We identified five studies (11 study centres) including 1557 HIV‐positive participants and four studies (13 study centres) including 1981 HIV‐negative participants (Figure 10). In the HIV‐positive subgroup, there was variability in sensitivity estimates, ranging from 70% to 100%. A possible explanation for this heterogeneity is the presence of smear‐negative specimens in this subgroup (see TB detection among HIV infected, smear‐negative patients below). In the HIV‐negative subgroup, there was less heterogeneity in sensitivity estimates, ranging from 83% to 100%. Specificity varied less than sensitivity in both subgroups, ranging from 92% to 100% in studies including people living with HIV and from 96% to 100% in studies including people without HIV infection. In the HIV‐positive subgroup, the pooled sensitivity was 76% (95% CrI 63% to 85%), lower than the estimate in the HIV‐negative subgroup (89%, 95% CrI 81% to 94%). We estimated the probability that the sensitivity in the HIV‐positive subgroup was greater than that in the HIV‐negative subgroup was 0.94 (Table 2). When we excluded the study by Lawn 2011 and limited the meta‐analysis to the four studies that provided data for both HIV‐infected and uninfected participants (within‐study comparisons), the pooled sensitivity in the HIV‐positive subgroup (1163 participants) increased to 80% (95% CrI 67% to 88%) (Table 2). Using within‐study comparisons, the pooled specificity was slightly lower in the HIV‐positive subgroup (97%, 95% CrI 93% to 99%) than the HIV‐negative subgroup (99%, 95% CrI 96% to 99%) (Table 2).

Forest plots of Xpert sensitivity and specificity for TB detection in HIV‐positive and HIV‐negative subgroups. The squares represent the sensitivity and specificity of one study and the black line represent its CI. TP = true positive; FP = false positive; FN = false negative; TN = true negative.
Figure 11 presents the pooled and predicted estimates of sensitivity and specificity together with the credible and prediction region for the HIV‐positive and HIV‐negative subgroups (four within‐study comparisons). The 95% credible region around the pooled estimate of sensitivity and specificity is relatively wide. The 95% prediction region is even wider, displaying more uncertainty as to where the likely values of sensitivity and specificity may occur for individual studies. Based on the pooled value and the credible region, it appeared that Xpert sensitivity had a greater probability of being lower in the HIV‐positive than the HIV‐negative subgroup. However, there was considerable heterogeneity between studies and the prediction region for the HIV‐positive subgroup completely encompassed that for the HIV‐negative subgroup. Therefore, there is too much uncertainty in the pooled estimates in the two subgroups to clearly distinguish between them.

Summary plots of Xpert sensitivity and specificity for TB detection in HIV‐positive (red colour) and HIV‐negative subgroups (black colour). Each individual study is represented by an empty square. The size of the square is proportional to the sample size of the study such that larger studies are represented by larger squares. The filled circles are the median estimates for sensitivity and specificity. The solid curves represent the 95% credible region around the summary estimates; the dashed curves represent the 95% prediction region.
TB detection among HIV‐positive smear‐negative patients
Two studies reported data from which to assess the accuracy of Xpert in HIV‐positive patients with culture‐positive, smear‐negative TB. In Lawn 2011, among people living with HIV, Xpert sensitivity for smear‐negative, culture‐positive TB was 43% (95% CI 30% to 58%; 23/53) compared with 100% (95% CI 82% to 100%; 19/19) for smear‐positive, culture‐positive TB. In Theron 2011, among people living with HIV, Xpert sensitivity for smear‐negative, culture‐positive TB was 47% (95% CI 29% to 67%; 11/23) compared with 91% (95% CI 72% to 99%; 21/23) for smear‐positive, culture‐positive TB. We did not perform a meta‐analysis because of the small number of studies.
Effect of condition of the specimen
We included twelve studies in this meta‐analysis. Again, we excluded three studies that made an effort to select smear‐positive patients (Friedrich 2011) or smear‐negative patients (Ioannidis 2011; Moure 2011). In addition, we excluded three studies that reported results for fresh and frozen specimens jointly (Bowles 2011; Malbruny 2011; Marlowe 2011). The pooled sensitivity was 88% (95% CrI 80% to 93%) in studies using fresh specimens (six studies), slightly higher than the pooled sensitivity of 85% (95% CrI 77% to 91%) in studies using frozen specimens (six studies) (Table 2). The probability that the pooled sensitivity in fresh specimens exceeds that in frozen specimens was estimated at 0.73 (Table 2). The pooled specificity was 99% (95% CrI 98% to 100%) for fresh specimens, higher than the pooled specificity of 97% (95% CrI 95% to 99%) for frozen specimens. The probability that the pooled specificity in fresh specimens exceeds that in frozen specimens was estimated at 0.98 (Table 2). Thus, in comparison with frozen specimens, fresh specimens had a significantly higher specificity but not sensitivity.
Effect of specimen preparation
We included fifteen studies in this meta‐analysis (again excluding the three studies that made an effort to select smear‐positive patients (Friedrich 2011) or smear‐negative patients (Ioannidis 2011; Moure 2011). Five studies used samples prepared from unprocessed (untreated) specimens and ten studies used samples prepared from processed specimens, usually pellets processed by N‐acetyl‐cysteine and sodium hydroxide (NALC–NaOH) centrifugation. The pooled sensitivity estimate was 92% (95% CrI 87% to 96%) in studies using unprocessed specimens, higher than the pooled sensitivity estimate of 85% (95% CrI 79% to 90%) in studies using processed specimens (Table 2). The probability that the pooled sensitivity in unprocessed specimens exceeds that in processed specimens was estimated at 0.98. The 95% CrI for the difference in Xpert sensitivity in the unprocessed and processed subgroups lies entirely above 0. Thus, unprocessed specimens had a significantly higher sensitivity than processed specimens. The pooled specificity was 99% (95% CrI 97% to 99%) for unprocessed specimens, similar to the pooled specificity of 98% (95% CrI 96% to 99%) for processed specimens (Table 2).
Effect of TB prevalence
We included fifteen studies in this meta‐analysis (again excluding the three studies that made an effort to select smear‐positive patients (Friedrich 2011) or smear‐negative patients (Ioannidis 2011; Moure 2011). We considered nine studies to have high TB prevalence (> 30%) and six studies to have low TB prevalence (≤ 30%). The pooled sensitivity was 89% (95% CrI 84% to 93%) for high TB settings, higher than the pooled sensitivity of 86% (95% CrI 77% to 92%) for low TB settings (Table 2). The probability that the pooled median sensitivity in high TB settings exceeds that in low TB settings was estimated at 0.80 (Table 2). The pooled specificity estimates were similar, 98% (95% CrI 96% to 99%) for high TB settings and 99% (95% CrI 97% to 99%) for low TB settings.
Effect of country income status
We included fifteen studies in this meta‐analysis (again excluding the three studies that made an effort to select smear‐positive patients (Friedrich 2011) or smear‐negative patients (Ioannidis 2011; Moure 2011). The pooled sensitivity was 85% (95% CrI 79% to 90%) for low/middle‐income countries (nine studies), lower than the pooled sensitivity of 92% (95% CrI 86% to 96%) for high‐income countries (six studies) (Table 2). The probability that the pooled sensitivity in high income countries exceeds that for low‐/middle‐income countries was estimated at 0.96; the specificities were similar for the two income levels (Table 2).
II. A. Rifampicin resistance detection, Xpert used as an initial test replacing conventional drug susceptibility testing
As noted above, of the total 18 studies, 11 studies (20 study centres) including 2340 participants provided data for Xpert for rifampicin resistance detection. Of the remaining studies, four studies reported that all specimens were found to be drug sensitive (no rifampicin resistant specimens) (Ciftci 2011; Hanif 2011; Marlowe 2011; Rachow 2011) and one study did not report information on rifampicin resistance (Helb 2010). Two studies provided data jointly for pulmonary and extrapulmonary specimens: Miller 2011 reported that Xpert detected four rifampicin‐resistant specimens of which three were positive by the reference standard and Moure 2011 reported that Xpert detected 86% (6/7) of the rifampicin‐resistant specimens. The 11 studies in this analysis included 485 rifampicin‐resistant specimens, median four specimens, (IQR 2, 7). Two studies, Boehme 2010a and Boehme 2011a accounted for the vast majority (94%) of the rifampicin‐resistant specimens. Figure 12 shows the forest plots of sensitivity (presence of rifampicin‐resistant TB) and specificity (presence of rifampicin‐susceptible TB) for this analysis. The individual study centres in the plots are ordered by decreasing sensitivity and decreasing number of true positive results. Although, there was considerable heterogeneity in sensitivity estimates (ranging from 33% to 100%), in general there was less variability among study centres with a larger number of rifampicin‐resistant specimens. Specificity showed less variability than sensitivity, ranging from 83% to 100%. The pooled sensitivity and specificity were 94% (95% CrI 87% to 97%) and 98% (95% CrI 97% to 99%), respectively (Table 1). Figure 13 presents the pooled and predicted estimates of sensitivity and specificity together with the credible and prediction region for Xpert for rifampicin resistance detection. The summary point appears close to the upper left‐hand corner of the plot, suggesting high accuracy of Xpert for rifampicin resistance detection. The 95% credible region around the summary (pooled) value of sensitivity and specificity is relatively narrow.

Forest plots of Xpert sensitivity and specificity for detection of rifampicin resistance, Xpert used as an initial test replacing conventional drug susceptibility testing as the initial test. The individual studies are ordered by decreasing sensitivity and decreasing number of true positives. The squares represent the sensitivity and specificity of one study, the black line its CI. TP = true positive; FP = false positive; FN = false negative; TN = true negative.

Summary plots of Xpert sensitivity and specificity for detection of rifampicin resistance, Xpert used as an initial test replacing conventional drug susceptibility testing as the initial test. Each individual study is represented by an empty square. The size of the square is proportional to the sample size of the study such that larger studies are represented by larger squares. The filled circle is the pooled median estimate for sensitivity and specificity. The solid curves represent the 95% credible region around the summary estimate; the dashed curves represent the 95% prediction region.
Investigations of heterogeneity, rifampicin resistance detection
Effect of delta cycle threshold cutoff
A major source of heterogeneity in systematic reviews of diagnostic test accuracy is the difference in values (thresholds) used to define a positive test between studies. We explored the effect of the parameter value (delta cycle threshold cutoff) in the Xpert system on the determination of rifampicin resistance. We included eleven studies in this analysis: four studies used a parameter value of 3.5 and seven studies a value of 5. The pooled sensitivity was 96% (95% CrI 81% to 100%) for studies using 3.5 and 94% (95% CrI 86% to 97%) for studies using 5 (Table 3). The pooled specificities were high for both parameter values, 100% (95% CrI 98% to 100%) for studies using 3.5 and 98% (95% CrI 96% to 99%) for studies using 5. Thus, there was considerable overlap between the estimates of Xpert performance for the two parameter values and no apparent difference between them.
| Covariate | Sensitivity Median (95% credible interval) | Specificity Median (95% credible interval) |
| Parameter value (delta cycle threshold cutoff) |
|
|
| Parameter value 5 | 94% (86, 97) | 98% (96, 99) |
| Parameter value 3.5 | 96% (81, 100) | 100% (98, 100) |
| Difference (Parameter value 5 minus Parameter value 3) | ‐3% (‐10, 11) | ‐2% (‐4, ‐0.3) |
| P (Parameter value 5 > Parameter value 3) | 0.26 | 0.01 |
| Rifampicin resistance prevalence |
|
|
| High (> 15%) | 94% (85, 98) | 98% (95, 99) |
| Low (≤ 15%) | 93% (80, 99) | 98% (96, 99) |
| Difference (High minus Low) | 0.4% (‐8, 13) | ‐0.4% (‐4, 2) |
| P (High > Low) | 0.54 | 0.34 |
P = probability
Effect of rifampicin resistance prevalence
The pooled sensitivities for both levels of rifampicin resistance prevalence were similar: 94% (95% CrI 85% to 98%) for high rifampicin resistance prevalence settings (> 15%, four studies) and 93% (95% CrI 80% to 99%) for low rifampicin resistance prevalence settings (≤ 15%, seven studies) (Table 3). The pooled specificities were also similar: 98% (95% CrI 95% to 99%) for high rifampicin resistance settings and 98% (95% CrI 96% to 99%) for low rifampicin resistance settings.
Sensitivity analyses
We performed sensitivity analyses by limiting inclusion in the meta‐analysis to: 1) studies that provided data by age that met the criterion for adults; 2) studies where consecutive patients were selected; 3) studies where a single specimen yielded a single Xpert result for a given patient; and 4) studies that clearly represented the use of the test for diagnosis of patients with suspected TB. We found no differences in the findings in these subgroups compared with the overall results. Concerning the diagnostic setting, 17 of the included studies evaluated Xpert in reference laboratories. One multicentre study, evaluated Xpert in district or subdistrict health facilities (Boehme 2011a).The results from this study may not be generalizable to other basic laboratories because this study was performed under research conditions. Nonetheless, in the meta‐analysis, the exclusion of results from this single study did not make a difference in the findings.
Other analyses
NTM
Eight studies provided data on a variety of NTM that grew from the specimens tested to look for evidence of cross‐reactivity: six NTM (Bowles 2011); one NTM (Ioannidis 2011); 41 NTM (Marlowe 2011); 20 NTM (Moure 2011); 45 NTM (Rachow 2011); five NTM (Scott 2011); 13 NTM (Teo 2011); and eight NTM (Theron 2011). Among these studies comprising 139 NTM, Xpert was positive in only one (0.7%) specimen that grew NTMs (Rachow 2011).
Discussion
Early diagnosis of TB is critical for reducing TB transmission and incidence, and rapid molecular diagnostics offer great promise in this area. In 2010, the WHO endorsed the Xpert assay, a novel, rapid diagnostic system using an automated PCR test that is simple enough to be run in basic laboratories and clinics, outside of a reference laboratory setting. Until the development of Xpert, smear microscopy had been the sole method used for TB diagnosis in most laboratories in developing countries, where over 95% of TB‐related deaths occur. Xpert can, generally within two hours, simultaneously detect TB and resistance to rifampicin, considered to be a good proxy for MDR‐TB (WHO Policy Xpert 2011). Following endorsement, the WHO unveiled a strategic plan for Xpert implementation (WHO Rapid Implementation 2011). The plan recommended that: "1. Xpert MTB/RIF should be used as the initial diagnostic test in individuals suspected of having MDR‐TB or HIV‐associated TB (Strong recommendation) and 2. Xpert MTB/RIF may be considered as a follow‐on test to microscopy in settings where MDR‐TB or HIV is of lesser concern, especially in further testing of smear‐negative specimens. (Conditional recommendation acknowledging major resource implications)" (WHO Rapid Implementation 2011).
The findings in this systematic review lend support to the WHO recommendations on the use of Xpert as an initial diagnostic test for TB detection and rifampicin resistance detection in patients suspected of having MDR‐TB or HIV‐associated TB. When used as an add‐on test following a negative smear microscopy result, Xpert yielded a sensitivity of 67%. Although a sensitivity of 67% may be considered low, it is precisely in smear‐negative patients that improvements in diagnostic tests are needed and where any improved diagnostic test will have the biggest impact. Therefore, Xpert may also be valuable as an add‐on test following smear microscopy. When used as an initial test replacing conventional drug susceptibility testing, we found high sensitivity and specificity of Xpert for rifampicin resistance detection. Xpert, however, does not eliminate the need for subsequent culture and phenotypic drug susceptibility testing, which are required to monitor treatment progress and to detect resistance to drugs other than rifampicin. We found that, in comparison with processed specimens, unprocessed specimens had a significantly higher sensitivity. This may be an effect of the difference in buffer:sample ratio (3:1 for processed and 2:1 for unprocessed sputum as per package insert) and the resulting lower input volume for processed compared to unprocessed sputum.
We wish to underscore that the findings in this review should be interpreted with caution as they are based on previous versions of Xpert. There were no studies of the current version of Xpert, G4, included in this review. It is possible that the performance of Xpert G4 will be different. Also, for Xpert diagnosis to be effective, ideally, the reporting of Xpert results should occur rapidly so treatment can be started.
Xpert has now begun to be rolled out in 21 countries via UNITAID, with a price drop from $16.86 to $9.98 (US) per cartridge, a price that will remain in effect until 2022 (The Gates Foundation 2012; UNITAID 2012a) (UNITAID is a global health initiative working to increase access for tests and medicines for HIV/AIDS, TB, and malaria). Since Xpert was endorsed by WHO, a large number of studies have been performed and country‐level policy makers are making decisions about adoption and scale‐up.
This systematic review represents the most comprehensive review on the diagnostic accuracy of Xpert and provides evidence that may help countries make decisions about scaling up Xpert for programmatic management of TB and drug‐resistant TB. Although, the information in this review will help to inform, other factors such as level of deployment in the health system, cost, and operational considerations, including the ability to maintain an uninterrupted and stable electrical power supply, temperature control, and maintenance of the cartridge modules, will also influence those decisions, as discussed in a recent commentary (Trébucq 2011).
This review focused on diagnostic accuracy. Sensitivity and specificity, however, depend on the performance of a test in a particular situation, defined by the population, the setting, and prior testing. In a different population or setting or with a different testing strategy, the sensitivity and specificity are likely to change (Bossuyt 2008). Our review question concerned the performance of Xpert in peripheral laboratories and health facilities. We identified only one study that used Xpert in this diagnostic setting and no studies that performed Xpert in primary health care clinics at the point of care. The remaining studies ran Xpert in reference laboratories. Hence, the findings from this review may not be applicable in resource‐constrained areas that lack high‐quality laboratory infrastructure and highly trained personnel. Also, since the majority of studies included in the analysis were from low‐ and middle‐income countries where advanced, smear‐positive TB is common, the findings may not directly apply to high‐income countries where most TB cases are smear‐negative, have minimal disease, and induced sputum samples are often necessary for diagnosis. With regard to income status, we found that the pooled sensitivity in high‐income countries was higher than that for low‐/middle‐income countries. The presence of specialized laboratory services and highly trained staff may be one reason contributing to the higher sensitivity of Xpert in high‐income versus low‐ and middle‐income countries.
We acknowledge that patient outcomes are clearly important to patients, decision makers, and the wider TB community. Outcomes in addition to diagnostic accuracy, however, could not be systematically addressed in this review as they would have required a different methodology. Nonetheless, we looked for and summarized two ‘time to event’ outcomes (time to result and time to treatment) when data were provided by the included studies (eight studies, Table 4). Xpert results for TB detection were usually reported within two hours or on the same day, compared with liquid culture results which were reported in around 16 to 20 days. Two studies reported on time to detection of rifampicin resistance and both studies found that, compared with conventional methods, Xpert greatly decreased the time to diagnosis (Boehme 2011a;, Lawn 2011). However, early detection of rifampicin resistance may not lead to improved patient outcomes if the result is not linked to appropriate treatment, services, and supervision (WHO Xpert Checklists 2011). One study did provide information about time to treatment initiation; for smear‐negative, culture‐positive TB, the median delay in beginning treatment was 56 days (IQR, 39, 81) before Xpert was introduced, compared with five days (IQR, 2, 8) after Xpert was introduced (Boehme 2011a). Although we did not systematically review patient outcomes for the current review, data regarding delays in switching from the standard regimen for drug‐susceptible TB to an appropriate regimen for MDR‐TB would be also be useful because of the potential harms to patients being treated with the wrong drug regimen.
| Study and year of publication | Time to TB detection | Time to detection of rifampicin resistance | Time to treatment initiation
|
| Boehme 2011a; Boehme 2011b; Boehme 2011c; Boehme 2011d; Boehme 2011e; Boehme 2011f | Median (IQR) Xpert: 0 days (0, 1) Smear: 1 day (0, 1) Solid culture: 30 days (23, 43) Liquid culture: 16 days (13‐21) | Median (IQR) Xpert: 1 day (0, 1) Line probe assay (direct testing): 20 days (10, 16) Phenotypic DST: 106 days (30, 124) | Median (IQR) Smear‐, culture+ TB Before Xpert introduced: 56 days (39, 81) After Xpert introduced: 5 days (2, 8) |
| Xpert (1 sample): 1 hour 55 minutes Xpert (8 samples processed together): 2 hours |
|
| |
| Median* (IQR) Xpert: 4 days (3, 6) Smear: 3 days (2, 5) Liquid culture (smear+): 12 days (10,14) Liquid culture (smear‐): 20 days (17, 27) | Xpert: mean 2 days MTBDRplus assay (with positive culture isolate): mean 21 days Phenotypic DST (liquid culture): mean 40 days
|
| |
| Xpert: hands‐on time was 5 minutes; run time was less than 2 hours |
|
| |
| Xpert: hands‐on time was 15 minutes: run time was 113 minutes |
|
| |
| Xpert: total time of 2 hours |
|
| |
| Xpert: within two hours |
|
| |
| Xpert (routine practice): 3‐24 hours Liquid culture: 19 days mean (range 3‐42 days) |
|
|
*Delays between sputum collection and results being available to the clinic
**Times provided for both pulmonary and extrapulmonary specimens jointly; DST, drug susceptibility testing; IQR, interquartile range
In addition to diagnostic accuracy, cost and cost‐effectiveness of Xpert are major concerns for national TB programmes and policy makers. However, our systematic review was not intended to address this outcome. Several cost‐effectiveness studies have been published recently (Abimbola 2012; Andrews 2012; Dowdy 2011; Meyer‐Rath 2012; Schnippel 2012; Vassall 2011) and these will need to be systematically reviewed.
Summary of main results
The main results are summarized in the Summary of Results table (summary of findings Table).
-
When used as an initial test replacing smear microscopy, Xpert detected 88% of TB cases with high specificity (98%).
-
When used as an add‐on test following smear microscopy, Xpert yielded a sensitivity of 67%.
-
Xpert sensitivity for smear‐positive, culture‐positive TB was very high and consistent (98%); Xpert sensitivity for smear‐negative, culture‐positive TB was lower and more variable (68%).
-
Xpert detected 80% of pulmonary TB cases in people living with HIV and 89% of pulmonary TB cases in people without HIV infection.
-
When used as an initial test replacing conventional drug susceptibility testing, Xpert detected 94% of rifampicin‐resistant TB with high specificity (98%).
-
The proportion of indeterminate Xpert results was very low (1.1%).
Application of the meta‐analysis to a hypothetical cohort
The summary of findings Table summarizes the findings of the review by applying the results to a hypothetical cohort of 1000 individuals suspected of having pulmonary TB or MDR‐TB. We present three different scenarios: for Xpert used as an initial test for TB detection or as an add‐on test following microscopy, the prevalence of TB in the setting or patient subgroup varies from 5% to 15% to 30%; for Xpert for rifampicin resistance detection, the prevalence of rifampicin resistance in the setting varies from 2% to 15% to 30%. The consequence of a false positive result is that a patient may be unnecessarily treated for MDR‐TB, with the possibility of developing severe adverse reactions. The consequence of a false negative test is that the patient may not receive treatment, resulting in more severe disease, death, and spread of TB.
I. A. TB detection, Xpert used as an initial test replacing smear microscopy
TB prevalence of 5%: if the point estimates for Xpert are applied to a hypothetical cohort of 1000 patients suspected of having TB, where 5% actually do have TB, then Xpert would be expected to miss six cases and falsely diagnose 19 cases.
TB prevalence of 15%; if the point estimates for Xpert are applied to a hypothetical cohort of 1000 patients suspected of having TB, where 15% actually do have TB, then Xpert would be expected to miss 18 cases and falsely diagnose 17 cases.
TB prevalence of 30%: if the point estimates for Xpert are applied to a hypothetical cohort of 1000 patients suspected of having TB, where 30% actually do have TB, then Xpert would be expected to miss 36 cases and falsely diagnose 14 cases.
I. B. TB detection, Xpert used as an add‐on test following a negative smear microscopy result
TB prevalence of 5%: if the point estimates for Xpert are applied to a hypothetical cohort of 1000 patients suspected of having TB, where 50 patients actually do have TB, then Xpert would be expected to miss 16 cases and falsely diagnose 19 cases.
TB prevalence of 15%; if the point estimates for Xpert are applied to a hypothetical cohort of 1000 patients suspected of having TB, where 150 patients actually do have TB, then Xpert would be expected to miss 49 cases and falsely diagnose 17 cases.
TB prevalence of 30%: if the point estimates for Xpert are applied to a hypothetical cohort of 1000 patients suspected of having TB, where 300 patients actually do have TB, then Xpert would be expected to miss 99 cases and falsely diagnose 14 cases.
II. A. Rifampicin resistance detection, Xpert used as an initial test replacing conventional drug susceptibility testing
Rifampicin resistance prevalence of 2%: if the point estimates for Xpert are applied to a hypothetical cohort of 1000 patients suspected of having rifampicin resistant‐TB, where 20 patients actually have rifampicin resistance, then Xpert would be expected to miss one case and falsely diagnose 20 cases.
Rifampicin resistance prevalence of 15%: if the point estimates for Xpert are applied to a hypothetical cohort of 1000 patients suspected of having rifampicin resistant‐TB, where 150 patients actually have rifampicin resistance, then Xpert would be expected to miss nine cases and falsely diagnose 17 cases.
Rifampicin resistance prevalence of 30%: if the point estimates for Xpert are applied to a hypothetical cohort of 1000 patients suspected of having rifampicin resistant‐TB, where 300 patients actually have rifampicin resistance, then Xpert would be expected to miss 18 cases and falsely diagnose 14 cases.
Strengths and weaknesses of the review
The findings of this review are based on comprehensive searching, strict inclusion criteria, and standardized data extraction. The strength of this review is that it allows an assessment to be made of the diagnostic accuracy of Xpert for detection of TB when Xpert is used as a replacement test for smear microscopy or as an add‐on test following smear microscopy. In addition, the review allows for a determination of the accuracy of Xpert for detection of rifampicin resistance when Xpert is used as an initial test replacing conventional drug susceptibility testing.
Completeness of evidence
This is a reasonably complete data set that involved comprehensive searching and correspondence with experts in the field and the test manufacturer to identify additional studies, as well as repeated correspondence with study authors to obtain additional data and information that was missing in the papers. The search strategy included studies published in all languages. However, we acknowledge that we may have missed some studies despite the comprehensive search. We are aware of several ongoing studies and papers published after our search period and will include these data in an update of the review. For the clinical subgroups, one study that was conducted in a high HIV prevalence setting only reported summary values and derivation of data for the 2 x 2 tables by HIV status was not possible. Several studies that investigated Xpert for both pulmonary and extrapulmonary TB could not be included in all analyses because we were unable to extract data pertaining to pulmonary TB alone. Lastly, the evidence in this review is mostly derived from high TB incidence countries and should be carefully extrapolated to low incidence settings.
Accuracy of the reference standards used
Culture is regarded as the best available reference standard for TB and was the reference standard used for TB in this review. Culture‐based phenotypic drug susceptibility testing methods using WHO recommended critical concentrations were the reference standards for rifampicin resistance (WHO Policy DST 2008). Concerning the latter, two recent studies have raised concerns about phenotypic susceptibility testing methods for rifampicin using the recommended critical concentrations. Van Deun 2009 reported that certain conventional drug susceptibility methods missed low‐level rifampicin resistance. Furthermore, using Xpert and gene sequencing, Williamson 2012 identified four patients (three with clinical information available) whose TB isolates contained mutations to the rpoB gene but appeared to be rifampicin susceptible using phenotypic methods. In this study, 2/49 (4.1%) patients whose isolates did not have apparent rpoB gene mutations, experienced treatment failure compared with 3/3 (100%) patients whose isolates did have rpoB gene mutations and were deemed rifampicin susceptible with phenotypic methods. In light of these findings, it is unclear whether and to what extent Xpert might out‐perform the conventional reference standards for drug susceptibility testing.
Quality and quality of reporting of the included studies
The majority (56%) of studies used consecutive selection of participants and > 75% of the studies interpreted Xpert results without knowledge of the results of the reference standard. Xpert results are generated automatically, without requiring subjective interpretation. Only one study performed Xpert in health facilities and provincial hospitals, settings that matched the review question. In general, studies were fairly well reported, though we corresponded with almost all authors for additional data and missing information. We encourage authors of future studies to follow the recommendations in the STARD statement to improve the quality of reporting (Bossuyt 2003).
Completeness and relevance of the review
We noted that the vast majority of studies were conducted in central reference laboratories whereas, for our review question, we were interested in how Xpert performed in peripheral laboratories and health facilities. Therefore, the findings in this review may not be applicable to peripheral settings. Studies using the first three generations of Xpert (G1, G2, and G3 cartridges) are included in this systematic review. A newer cartridge, G4, to be used with software version 4.0 or higher, has been released and is now included in all Xpert kits. Therefore, the findings in this review should be viewed with caution as they may not pertain to the newest Xpert version. An updated Cochrane review will cover studies using Xpert G4 and any subsequent versions. This systematic review did not address the use of Xpert in children. A systematic review on the diagnostic accuracy of Xpert for extrapulmonary TB is underway.
Applicability of findings to the review question
We found high specificity (98%) of Xpert for both detection of TB and rifampicin resistance. When used as an initial test for TB detection replacing smear microscopy, Xpert achieved a sensitivity of 88%. When used as an add‐on test following a negative smear microscopy result, Xpert yielded a lower sensitivity of 67%. In clinical subgroups, we found very high sensitivity (98%) of Xpert for smear‐positive, culture‐positive TB and lower sensitivity of 68% for smear‐negative, culture‐positive TB. We found modest sensitivity of Xpert (80%) in people living with HIV and higher sensitivity (89%) in people without HIV infection. An Xpert result that is positive for rifampicin resistance should be carefully interpreted and take into consideration the risk of MDR‐TB in a given patient and the expected prevalence of MDR‐TB. For example, in a hypothetical cohort of 1000 individuals suspected of having rifampicin resistance (a proxy for MDR‐TB), where the prevalence of rifampicin resistance is 30%, we found that, on average, Xpert would wrongly identify 14 patients as being rifampicin resistant. In most of the countries represented in this review, among patients who had previously never been treated for TB, the prevalence of MDR‐TB was only around 1% to 2%. In a hypothetical cohort, where the prevalence of rifampicin resistance is 2%, the number of individuals wrongly identified as rifampicin resistant would increase from 14 (when rifampicin resistance prevalence is 30%) to 20, an increase of 43%. These individuals may be unnecessarily treated with second‐line anti‐TB drugs and experience serious adverse events. Thus, in a setting with very low prevalence of MDR‐TB, an Xpert result indicating rifampicin resistance should prompt confirmation by a more definitive test. Studies in this review assessed sensitivity and specificity of the test when used in laboratories in research studies; the accuracy of Xpert may be lower in routine practice settings.

Readout of Xpert MTB/RIF assay for a TB positive, rifampicin‐susceptible specimen. Courtesy: Karin Weyer, The WHO STOP TB Department.

Flow diagram of studies in the review.
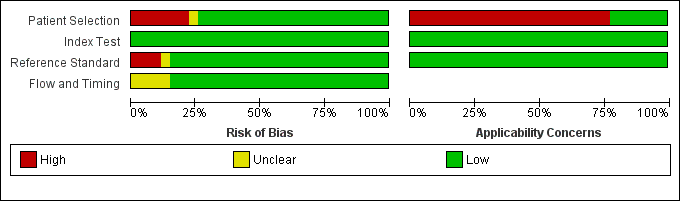
Risk of bias and applicability concerns graph: review authors' judgements about each domain presented as percentages across the 27 included study centres (18 studies). The reference standard domain pertains to TB as the target condition. See text for the reference standard pertaining to rifampicin resistance.

Risk of bias and applicability concerns summary: review authors' judgements about each domain for each included study centre.
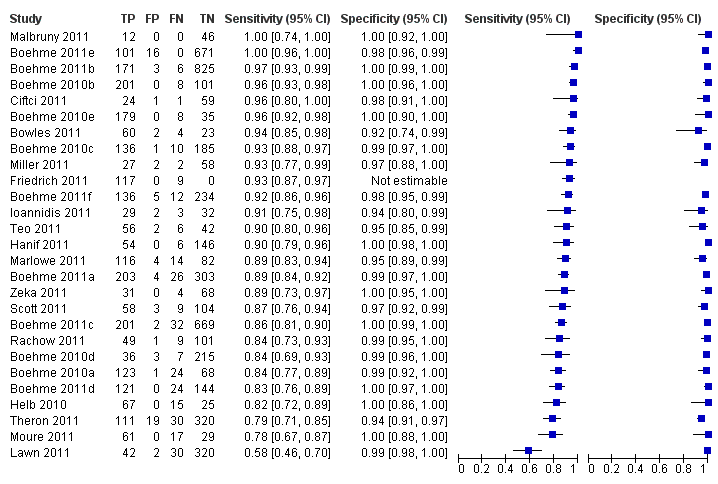
Forest plots of Xpert sensitivity and specificity for TB detection, Xpert used as an initial test replacing smear microscopy. The individual studies are ordered by decreasing sensitivity. TP = True Positive; FP = False Positive; FN = False Negative; TN = True Negative. Between brackets are the 95% CI of sensitivity and specificity. The figure shows the estimated sensitivity and specificity of the study (blue square) and its 95% CI (black horizontal line). Xpert specificity could not be estimated in one study.

Summary plots of Xpert sensitivity and specificity for TB detection, Xpert used as an initial test replacing smear microscopy. Each individual study is represented by an empty square. The size of the square is proportional to the sample size of the study such that larger studies are represented by larger squares. The filled circle is the pooled median estimate for sensitivity and specificity. The solid curves represent the 95% credible region around the summary estimate; the dashed curves represent the 95% prediction region.
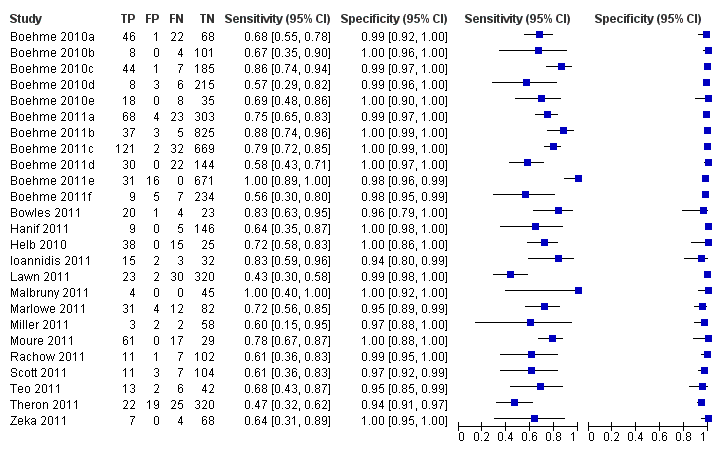
Forest plots of Xpert for TB detection, Xpert used as an add‐on test following a negative smear microscopy result. TP = True Positive; FP = False Positive; FN = False Negative; TN = True Negative. Between brackets the 95% CI of sensitivity and specificity. The figure shows the estimated sensitivity and specificity of the study (blue square) and its 95% CI (black horizontal line).

Summary plots of Xpert sensitivity and specificity for TB detection, Xpert used as an add‐on test following a negative smear microscopy result. Each individual study is represented by an empty square. The size of the square is proportional to the sample size of the study such that larger studies are represented by larger squares. The filled circle is the pooled median estimate for sensitivity and specificity. The solid curve represents the 95% credible region around the summary estimate; the dashed curves represent the 95% prediction region.

Forest plot of Xpert sensitivity for TB detection in smear‐positive subgroup. The squares represent the sensitivity and specificity of one study, the black line its CI. TP = true positive; FP = false positive; FN = false negative; TN = true negative. Xpert specificity could not be estimated in these studies.
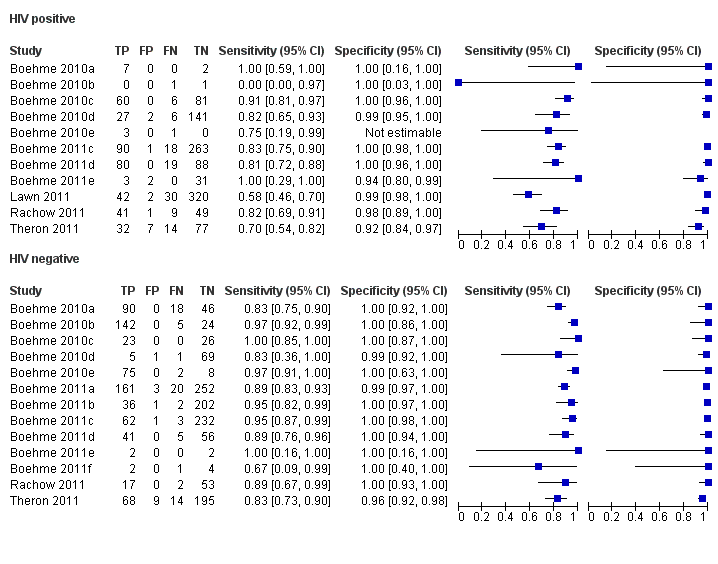
Forest plots of Xpert sensitivity and specificity for TB detection in HIV‐positive and HIV‐negative subgroups. The squares represent the sensitivity and specificity of one study and the black line represent its CI. TP = true positive; FP = false positive; FN = false negative; TN = true negative.

Summary plots of Xpert sensitivity and specificity for TB detection in HIV‐positive (red colour) and HIV‐negative subgroups (black colour). Each individual study is represented by an empty square. The size of the square is proportional to the sample size of the study such that larger studies are represented by larger squares. The filled circles are the median estimates for sensitivity and specificity. The solid curves represent the 95% credible region around the summary estimates; the dashed curves represent the 95% prediction region.

Forest plots of Xpert sensitivity and specificity for detection of rifampicin resistance, Xpert used as an initial test replacing conventional drug susceptibility testing as the initial test. The individual studies are ordered by decreasing sensitivity and decreasing number of true positives. The squares represent the sensitivity and specificity of one study, the black line its CI. TP = true positive; FP = false positive; FN = false negative; TN = true negative.

Summary plots of Xpert sensitivity and specificity for detection of rifampicin resistance, Xpert used as an initial test replacing conventional drug susceptibility testing as the initial test. Each individual study is represented by an empty square. The size of the square is proportional to the sample size of the study such that larger studies are represented by larger squares. The filled circle is the pooled median estimate for sensitivity and specificity. The solid curves represent the 95% credible region around the summary estimate; the dashed curves represent the 95% prediction region.

Bayesian bivariate hierarchical model, likelihood
Bayesian bivariate hierarchical model, prior distributions

TB detection, all studies.


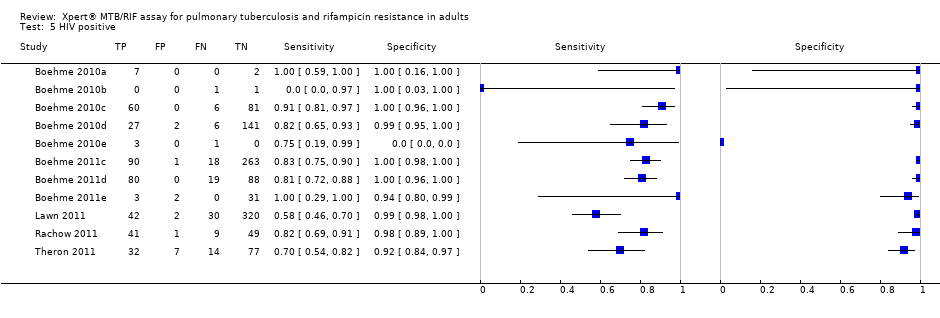


TB detection, condition of specimen.
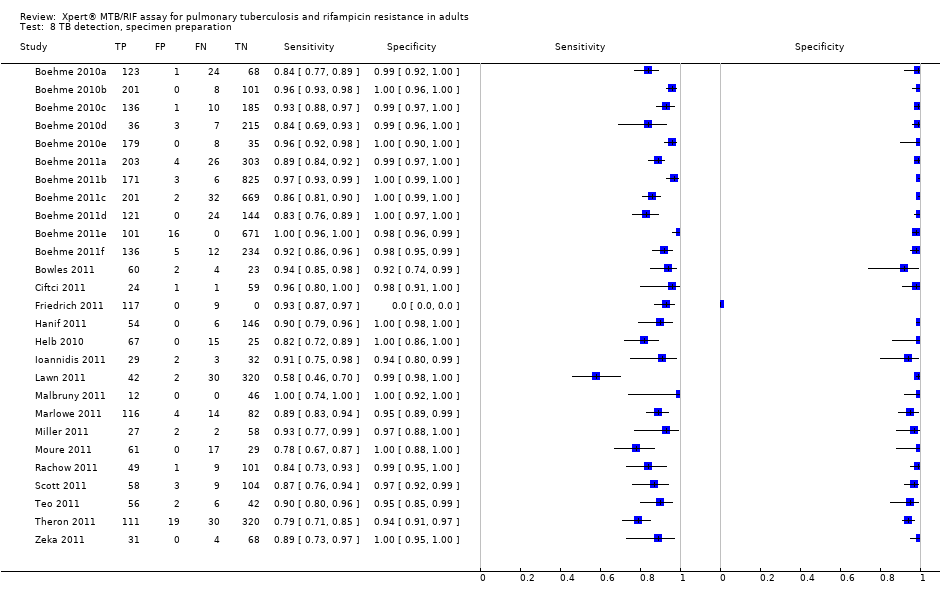
TB detection, specimen preparation.
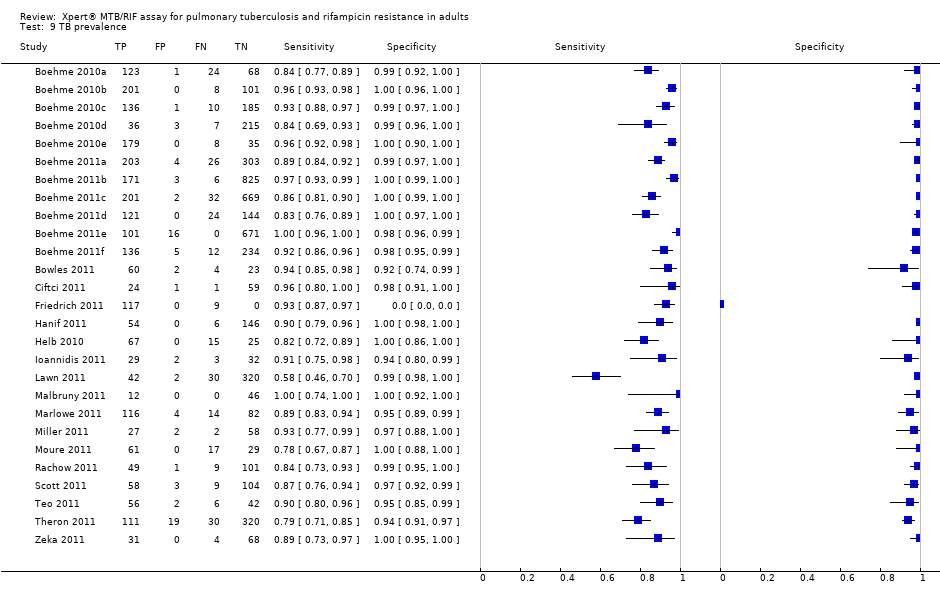


Rifampicin resistance.
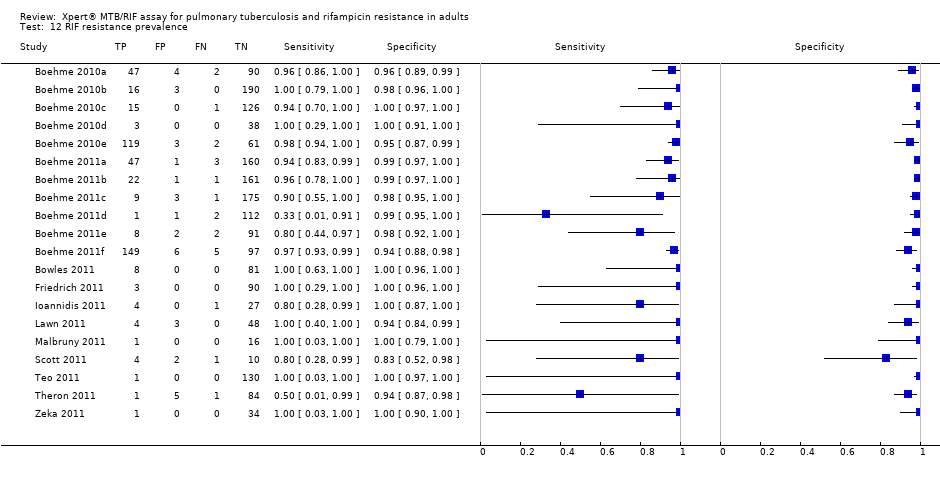
RIF resistance prevalence.
| Review question: What is the diagnostic accuracy of Xpert MTB/RIF assay for detection of pulmonary TB and detection of rifampicin resistance? Patients/population: Adults suspected of having pulmonary TB or MDR‐TB (for TB detection); confirmed TB cases (for rifampicin resistance detection) Purpose: TB detection: Xpert MTB/RIF assay used as an initial test replacing microscopy and used as an add‐on test following a negative smear microscopy result. Rifampicin resistance detection: Xpert MTB/RIF assay as an initial test replacing conventional phenotypic drug susceptibility testing Setting: Basic laboratories and primary health facilities (peripheral health services level) Index test: Xpert MTB/RIF assay Importance: Compared with culture and conventional drug susceptibility testing, Xpert MTB/RIF assay could have considerable advantages for scaling up programmatic management of TB by offering rapid diagnosis nearer to the point of care, standardized testing, potential for high throughput, and fewer requirements for laboratory biosafety Reference standards: TB: solid or liquid culture; rifampicin resistance: phenotypic drug susceptibility testing Studies: Cross‐sectional | |||||
| Diagnostic accuracy for TB detection | |||||
| Type of analysis | Effect (95% credible interval) | No. of participants (studies) | What do these results mean given 5% prevalence of TB among individuals suspected of having pulmonary TB?
| What do these results mean given 15% prevalence of TB among individuals suspected of having pulmonary TB? | What do these results mean given 30% prevalence of TB among individuals suspected of having pulmonary TB?
|
| TB detection, Xpert used as an initial test replacing microscopy | Pooled median sensitivity 88% (83, 92) and pooled median specificity 98% (97, 98)
| 7517 (15) | With a prevalence of 5%, 50/1000 individuals will have pulmonary TB. Of these, 44 (TP) will be identified; 6 (FN) will be missed. Of the 950 individuals without TB, 931 (TN) will not be treated; 19 (FP) may be unnecessarily treated | With a prevalence of 15%, 150/1000 individuals will have pulmonary TB. Of these, 132 (TP) will be identified; 18 (FN) will be missed. Of the 850 individuals without TB, 833 (TN) will not be treated; 17 (FP) may be unnecessarily treated | With a prevalence of 30%, 300/1000 individuals will have pulmonary TB. Of these, 264 (TP) will be identified; 36 (FN) will be missed. Of the 700 individuals without TB, 686 (TN) will not be treated; 14 (FP) may be unnecessarily treated |
| TB detection, Xpert used as an add‐on test following a negative smear microscopy result | Pooled median sensitivity 67% (58, 74) and pooled median specificity 98% (97, 98)
| 5719 (14) | With a prevalence of 5%, 50/1000 individuals will have pulmonary TB. Of these, 34 (TP) will be identified; 16 (FN) will be missed. Of the 950 individuals without TB, 931 (TN) will not be treated; 19 (FP) may be unnecessarily treated | With a prevalence of 15%, 150/1000 individuals will have pulmonary TB. Of these, 101 (TP) will be identified; 49 (FN) will be missed. Of the 850 individuals without TB, 833 (TN) will not be treated; 17 (FP) may be unnecessarily treated | With a prevalence of 30%, 300/1000 individuals will have pulmonary TB. Of these, 201 (TP) will be identified; 99 (FN) will be missed. Of the 700 individuals without TB, 686 (TN) will not be treated; 14 (FP) may be unnecessarily treated |
| Smear‐positive, culture‐positive subgroup, within‐ study comparison | Pooled median sensitivity 98% (97, 99); specificity of Xpert could not be estimated in these studies | 1735 (15) | With a prevalence of 5%, 50/1000 individuals will have pulmonary TB. Of these, 49 (TP) will be identified; 1 (FN) will be missed | With a prevalence of 15%, 150/1000 individuals will have pulmonary TB. Of these, 147 (TP) will be identified; 3 (FN) will be missed | With a prevalence of 30%, 300/1000 individuals will have pulmonary TB. Of these, 294 (TP) will be identified; 6 (FN) will be missed |
| Smear‐negative, culture‐positive subgroup | Pooled median sensitivity 68% (59, 75) and pooled median specificity 98% (97, 99) | 5771 (15) | With a prevalence of 5%, 50/1000 individuals will have pulmonary TB. Of these, 34 (TP) will be identified; 16 (FN) will be missed. Of the 950 individuals without TB, 931 (TN) will not be treated; 19 (FP) may be unnecessarily treated | With a prevalence of 15%, 150/1000 individuals will have pulmonary TB. Of these, 102 (TP) will be identified; 48 (FN) will be missed. Of the 850 individuals without TB, 833 (TN) will not be treated; 17 (FP) may be unnecessarily treated | With a prevalence of 30%, 300/1000 individuals will have pulmonary TB. Of these, 204 (TP) will be identified; 96 (FN) will be missed. Of the 700 individuals without TB, 686 (TN) will not be treated; 14 (FP) may be unnecessarily treated |
| HIV‐positive subgroup | Pooled median sensitivity 80% (67, 88) and pooled median specificity 97% (93, 99) | 1163 (4) | With a prevalence of 5%, 50/1000 individuals will have pulmonary TB. Of these, 40 (TP) will be identified; 10 (FN) will be missed. Of the 950 individuals without TB, 922 (TN) will not be treated; 28 (FP) may be unnecessarily treated | With a prevalence of 15%, 150/1000 individuals will have pulmonary TB. Of these, 120 (TP) will be identified; 30 (FN) will be missed. Of the 850 individuals without TB, 825 (TN) will not be treated; 25 (FP) may be unnecessarily treated | With a prevalence of 30%, 300/1000 individuals will have pulmonary TB. Of these, 240 (TP) will be identified; 60 (FN) will be missed. Of the 700 individuals without TB, 679 (TN) will not be treated; 21 (FP) may be unnecessarily treated |
| HIV‐negative subgroup | Pooled median sensitivity 89% (81, 94) and pooled median specificity 99% (96, 99) | 1981 (4) | With a prevalence of 5%, 50/1000 individuals will have pulmonary TB. Of these, 45 (TP) will be identified; 5 (FN) will be missed. Of the 950 individuals without TB, 941 (TN) will not be treated; 9 (FP) may be unnecessarily treated | With a prevalence of 15%, 150/1000 individuals will have pulmonary TB. Of these, 134 (TP) will be identified; 16 (FN) will be missed. Of the 850 individuals without TB, 842 (TN) will not be treated; 8 (FP) may be unnecessarily treated | With a prevalence of 30%, 300/1000 individuals will have pulmonary TB. Of these, 267 (TP) will be identified; 33 (FN) will be missed. Of the 700 patients individuals without TB, 693 (TN) will not be treated; 7 (FP) may be unnecessarily treated |
| Diagnostic accuracy for detection of rifampicin resistance | |||||
| Type of analysis | Effect (95% credible interval) | No. of participants (studies) | What do these results mean given 2% prevalence of rifampicin resistance among individuals with TB? | What do these results mean given 15% prevalence of rifampicin resistance among individuals with TB? | What do these results mean given 30% prevalence of rifampicin resistance among individuals with TB? |
| Rifampicin resistance detection, Xpert used as an initial test replacing conventional drug susceptibility testing | Pooled median sensitivity 94% (87, 97) and pooled median specificity 98% (97, 99) | 2340 (11) | With a prevalence of 2%, 20/1000 will have rifampicin resistance. Of these, 19 (TP) will be identified; 1 (FN) will be missed. Of the 980 patients with TB sensitive to rifampicin, 960 (TN) will not be treated; 20 (FP) may be unnecessarily treated | With a prevalence of 15%, 150/1000 will have rifampicin resistance. Of these, 141 (TP) will be identified; 9 (FN) will be missed. Of the 850 patients with TB sensitive to rifampicin, 833 (TN) will not be treated; 17 (FP) may be unnecessarily treated | With a prevalence of 30%, 300/1000 will have rifampicin resistance Of these, 282 (TP) will be identified; 18 (FN) will be missed. Of the 700 patients with TB sensitive to rifampicin, 686 (TN) will not be treated; 14 (FP) may be unnecessarily treated |
| TP, true positive; FN, false negative; TN, true negative; FP, false positive | |||||
| Type of analysis (Number of studies) | Pooled sensitivity Median (95% credible interval) | Pooled specificity Median (95% credible interval) | Predicted sensitivity Median (95% credible interval) | Predicted specificity Median (95% credible interval) |
| Xpert used as an initial test for TB detection replacing microscopy (15)*
| 88% (83, 92) | 98% (97, 99) | 88% (66, 97) | 98% (92, 100) |
| Xpert used as an add‐on test for TB detection following a negative smear microscopy result (14) | 67% (58, 74) | 98% (97, 99) | 66% (40, 86) | 98% (93, 100) |
| Xpert used as an initial test for rifampicin resistance detection replacing conventional drug susceptibility testing as the initial test (11) | 94% (87, 97) | 98% (97, 99) | 94% (75, 99) | 98% (91, 100) |
| *Three studies that preferentially enrolled smear‐positive or smear‐negative patients were excluded | ||||
| Covariate | Sensitivity Median (95% credible interval) | Specificity Median (95% credible interval) |
| Smear status |
|
|
| Smear + | 98% (97, 99) | *** |
| Smear ‐ | 68% (59, 75) | 98% (97, 99) |
| Difference (Smear+ minus Smear‐) | 31% (23, 39) | ** |
| P (Smear+ > Smear‐) | 1.00 | ** |
| HIV status |
|
|
| HIV+ | 80% (67, 88) | 97% (93, 99) |
| HIV‐ | 89% (81, 94) | 99% (96, 99) |
| Difference (HIV+ minus HIV‐) | ‐9% (‐22, 3) | ‐1% (‐5, 2) |
| P (HIV+ > HIV‐) | 0.06 | 0.21 |
| Condition of specimen |
|
|
| Fresh | 88% (80, 93) | 99% (98, 100) |
| Frozen | 85% (77, 91) | 97% (95, 99) |
| Difference (Fresh minus Frozen) | 3% (‐7, 13) | 2% (0.1, 4) |
| P (Fresh > Frozen) | 0.73 | 0.98 |
| Specimen preparation |
|
|
| Unprocessed | 92% (87, 96) | 99% (97, 99) |
| Processed | 85% (79, 90) | 98% (96, 99) |
| Difference (Unprocessed minus Processed) | 7% (0.2, 14) | 0.8% (‐1, 3) |
| P (Unprocessed > Processed) | 0.98 | 0.84 |
| TB prevalence |
|
|
| High (> 30%) | 89% (84, 93) | 98% (96, 99) |
| Low (≤ 30%) | 86% (77, 92) | 99% (97, 99) |
| Difference (High minus Low) | 3% (‐5, 12) | ‐0.4% (‐2, 1) |
| P (High > Low) | 0.80 | 0.29 |
| Country income level |
|
|
| High‐income | 92% (86, 96) | 98% (95, 99) |
| Low‐ and middle‐income | 85% (79, 90) | 99% (97, 99) |
| Difference (High‐income minus Low‐ and middle‐income) | 6% (‐1, 14) | ‐1% (‐3, 1) |
| P (High‐income > Low‐ and middle‐income) | 0.96 | 0.23 |
| P = probability | ||
| Covariate | Sensitivity Median (95% credible interval) | Specificity Median (95% credible interval) |
| Parameter value (delta cycle threshold cutoff) |
|
|
| Parameter value 5 | 94% (86, 97) | 98% (96, 99) |
| Parameter value 3.5 | 96% (81, 100) | 100% (98, 100) |
| Difference (Parameter value 5 minus Parameter value 3) | ‐3% (‐10, 11) | ‐2% (‐4, ‐0.3) |
| P (Parameter value 5 > Parameter value 3) | 0.26 | 0.01 |
| Rifampicin resistance prevalence |
|
|
| High (> 15%) | 94% (85, 98) | 98% (95, 99) |
| Low (≤ 15%) | 93% (80, 99) | 98% (96, 99) |
| Difference (High minus Low) | 0.4% (‐8, 13) | ‐0.4% (‐4, 2) |
| P (High > Low) | 0.54 | 0.34 |
| P = probability | ||
| Study and year of publication | Time to TB detection | Time to detection of rifampicin resistance | Time to treatment initiation
|
| Boehme 2011a; Boehme 2011b; Boehme 2011c; Boehme 2011d; Boehme 2011e; Boehme 2011f | Median (IQR) Xpert: 0 days (0, 1) Smear: 1 day (0, 1) Solid culture: 30 days (23, 43) Liquid culture: 16 days (13‐21) | Median (IQR) Xpert: 1 day (0, 1) Line probe assay (direct testing): 20 days (10, 16) Phenotypic DST: 106 days (30, 124) | Median (IQR) Smear‐, culture+ TB Before Xpert introduced: 56 days (39, 81) After Xpert introduced: 5 days (2, 8) |
| Xpert (1 sample): 1 hour 55 minutes Xpert (8 samples processed together): 2 hours |
|
| |
| Median* (IQR) Xpert: 4 days (3, 6) Smear: 3 days (2, 5) Liquid culture (smear+): 12 days (10,14) Liquid culture (smear‐): 20 days (17, 27) | Xpert: mean 2 days MTBDRplus assay (with positive culture isolate): mean 21 days Phenotypic DST (liquid culture): mean 40 days
|
| |
| Xpert: hands‐on time was 5 minutes; run time was less than 2 hours |
|
| |
| Xpert: hands‐on time was 15 minutes: run time was 113 minutes |
|
| |
| Xpert: total time of 2 hours |
|
| |
| Xpert: within two hours |
|
| |
| Xpert (routine practice): 3‐24 hours Liquid culture: 19 days mean (range 3‐42 days) |
|
| |
| *Delays between sputum collection and results being available to the clinic **Times provided for both pulmonary and extrapulmonary specimens jointly; DST, drug susceptibility testing; IQR, interquartile range | |||
| Test | No. of studies | No. of participants |
| 1 TB detection, all studies Show forest plot | 27 | 7816 |
| 2 Add on Show forest plot | 23 | 5719 |
| 3 Smear positive Show forest plot | 24 | 1735 |
| 4 Smear negative Show forest plot | 25 | 5878 |
| 5 HIV positive Show forest plot | 11 | 1557 |
| 6 HIV negative Show forest plot | 13 | 1981 |
| 7 TB detection, condition of specimen Show forest plot | 24 | 7453 |
| 8 TB detection, specimen preparation Show forest plot | 27 | 7816 |
| 9 TB prevalence Show forest plot | 27 | 7816 |
| 10 Income status Show forest plot | 27 | 7816 |
| 11 Rifampicin resistance Show forest plot | 20 | 2340 |
| 12 RIF resistance prevalence Show forest plot | 20 | 2340 |