Momento adecuado para la inhalación de solución salina hipertónica en la fibrosis quística
Información
- DOI:
- https://doi.org/10.1002/14651858.CD008816.pub3Copiar DOI

- Base de datos:
-
- Cochrane Database of Systematic Reviews
- Versión publicada:
-
- 22 diciembre 2016see what's new
- Tipo:
-
- Intervention
- Etapa:
-
- Review
- Grupo Editorial Cochrane:
-
Grupo Cochrane de Fibrosis quística y enfermedades genéticas
- Copyright:
-
- Copyright © 2016 The Cochrane Collaboration. Published by John Wiley & Sons, Ltd.
Cifras del artículo
Altmetric:
Citado por:
Autores
Contributions of authors
RD and ME contributed to: the writing of the protocol; the conduct of the searches, the review of the search results; and the writing of the final review.
Sources of support
Internal sources
-
No sources of support supplied
External sources
-
National Institute for Health Research, UK.
This systematic review was supported by the National Institute for Health Research, via Cochrane infrastructure funding to the Cochrane Cystic Fibrosis and Genetic Disorders Group.
Declarations of interest
Both review authors are authors on the Dentice trial, therefore data extraction for this trial was also carried out at the editorial base (Dentice 2012).
Acknowledgements
We wish to thank Tracey Remmington and Nikki Jahnke for their assistance in the preparation of this review.
Version history
| Published | Title | Stage | Authors | Version |
| 2020 Feb 28 | Timing of hypertonic saline inhalation for cystic fibrosis | Review | Mark Elkins, Ruth Dentice | |
| 2016 Dec 22 | Timing of hypertonic saline inhalation for cystic fibrosis | Review | Mark Elkins, Ruth Dentice | |
| 2012 Feb 15 | Timing of hypertonic saline inhalation for cystic fibrosis | Review | Mark Elkins, Ruth Dentice | |
| 2010 Nov 10 | Timing of hypertonic saline inhalation for cystic fibrosis | Protocol | Mark Elkins, Ruth Dentice | |
Keywords
MeSH
Medical Subject Headings (MeSH) Keywords
Medical Subject Headings Check Words
Female; Humans; Male;
PICO

Risk of bias graph: review authors' judgements about each risk of bias item presented as percentages across all included studies.

Risk of bias summary: review authors' judgements about each risk of bias item for each included study.
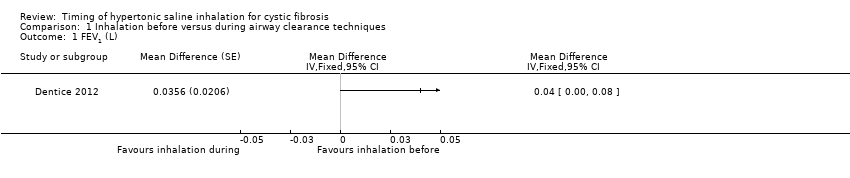
Comparison 1 Inhalation before versus during airway clearance techniques, Outcome 1 FEV1 (L).

Comparison 1 Inhalation before versus during airway clearance techniques, Outcome 2 FEV1 (% pred).

Comparison 1 Inhalation before versus during airway clearance techniques, Outcome 3 FVC (L).

Comparison 1 Inhalation before versus during airway clearance techniques, Outcome 4 FVC (% pred).

Comparison 1 Inhalation before versus during airway clearance techniques, Outcome 5 Perceived efficacy (mm).

Comparison 1 Inhalation before versus during airway clearance techniques, Outcome 6 Tolerability (mm).

Comparison 1 Inhalation before versus during airway clearance techniques, Outcome 7 Satisfaction (mm).
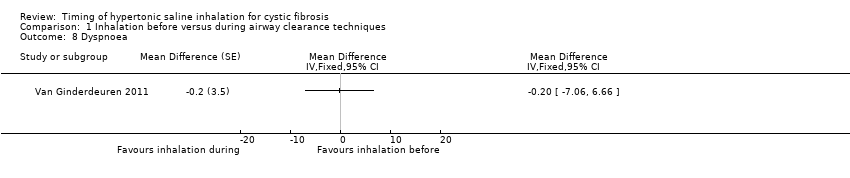
Comparison 1 Inhalation before versus during airway clearance techniques, Outcome 8 Dyspnoea.

Comparison 1 Inhalation before versus during airway clearance techniques, Outcome 9 Sputum wet weight.

Comparison 2 Inhalation before versus after airway clearance techniques, Outcome 1 FEV1 (L).

Comparison 2 Inhalation before versus after airway clearance techniques, Outcome 2 FEV1 (% pred).

Comparison 2 Inhalation before versus after airway clearance techniques, Outcome 3 FVC (L).

Comparison 2 Inhalation before versus after airway clearance techniques, Outcome 4 FVC (% pred).

Comparison 2 Inhalation before versus after airway clearance techniques, Outcome 5 Perceived efficacy (mm).
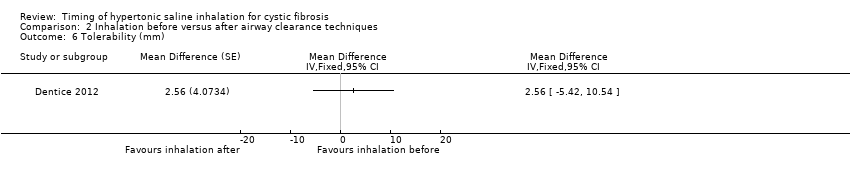
Comparison 2 Inhalation before versus after airway clearance techniques, Outcome 6 Tolerability (mm).

Comparison 2 Inhalation before versus after airway clearance techniques, Outcome 7 Satisfaction (mm).

Comparison 3 Inhalation during versus after airway clearance techniques, Outcome 1 FEV1 (L).

Comparison 3 Inhalation during versus after airway clearance techniques, Outcome 2 FEV1 (% pred).
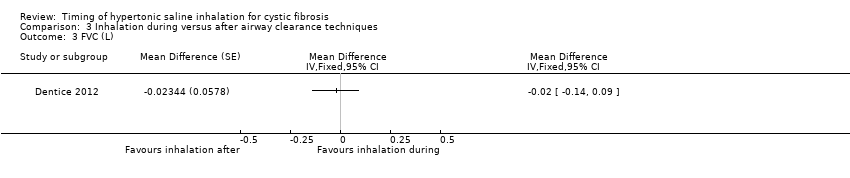
Comparison 3 Inhalation during versus after airway clearance techniques, Outcome 3 FVC (L).

Comparison 3 Inhalation during versus after airway clearance techniques, Outcome 4 FVC (% pred).
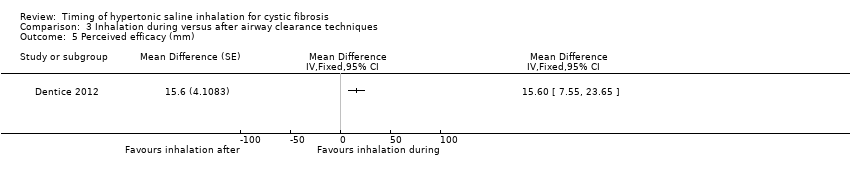
Comparison 3 Inhalation during versus after airway clearance techniques, Outcome 5 Perceived efficacy (mm).

Comparison 3 Inhalation during versus after airway clearance techniques, Outcome 6 Tolerability (mm).

Comparison 3 Inhalation during versus after airway clearance techniques, Outcome 7 Satisfaction (mm).
| Outcome or subgroup title | No. of studies | No. of participants | Statistical method | Effect size |
| 1 FEV1 (L) Show forest plot | 1 | Mean Difference (Fixed, 95% CI) | Totals not selected | |
| 2 FEV1 (% pred) Show forest plot | 1 | Mean Difference (Fixed, 95% CI) | Totals not selected | |
| 3 FVC (L) Show forest plot | 1 | Mean Difference (Fixed, 95% CI) | Totals not selected | |
| 4 FVC (% pred) Show forest plot | 1 | Mean Difference (Fixed, 95% CI) | Totals not selected | |
| 5 Perceived efficacy (mm) Show forest plot | 1 | Mean Difference (Fixed, 95% CI) | Totals not selected | |
| 6 Tolerability (mm) Show forest plot | 1 | Mean Difference (Fixed, 95% CI) | Totals not selected | |
| 7 Satisfaction (mm) Show forest plot | 1 | Mean Difference (Fixed, 95% CI) | Totals not selected | |
| 8 Dyspnoea Show forest plot | 1 | Mean Difference (Fixed, 95% CI) | Totals not selected | |
| 9 Sputum wet weight Show forest plot | 1 | Mean Difference (Fixed, 95% CI) | Totals not selected | |
| Outcome or subgroup title | No. of studies | No. of participants | Statistical method | Effect size |
| 1 FEV1 (L) Show forest plot | 1 | Mean Difference (Fixed, 95% CI) | Totals not selected | |
| 2 FEV1 (% pred) Show forest plot | 1 | Mean Difference (Fixed, 95% CI) | Totals not selected | |
| 3 FVC (L) Show forest plot | 1 | Mean Difference (Fixed, 95% CI) | Totals not selected | |
| 4 FVC (% pred) Show forest plot | 1 | Mean Difference (Fixed, 95% CI) | Totals not selected | |
| 5 Perceived efficacy (mm) Show forest plot | 1 | Mean Difference (Fixed, 95% CI) | Totals not selected | |
| 6 Tolerability (mm) Show forest plot | 1 | Mean Difference (Fixed, 95% CI) | Totals not selected | |
| 7 Satisfaction (mm) Show forest plot | 1 | Mean Difference (Fixed, 95% CI) | Totals not selected | |