Momento adecuado de inhalación de solución salina hipertónica para la fibrosis quística
Resumen
Antecedentes
La inhalación de solución salina hipertónica mejora la reología del esputo, acelera la limpieza mucociliar y mejora los resultados clínicos de los pacientes con fibrosis quística. Ésta es una actualización de una revisión Cochrane publicada anteriormente.
Objetivos
Determinar si el momento adecuado de inhalación de solución salina hipertónica (con relación a las técnicas de limpieza de las vías respiratorias o al momento del día) tiene impacto sobre su eficacia clínica en los pacientes con fibrosis quística.
Métodos de búsqueda
Se identificaron los ensayos controlados aleatorizados y cuasialeatorizados relevantes de los Registros de Ensayos Cochrane de Fibrosis Quística (Cochrane Cystic Fibrosis Trials Register), la Physiotherapy Evidence Database (PEDro) y las actas de congresos internacionales de fibrosis quística.
Fecha de la búsqueda más reciente en el Registro de Ensayos de Fibrosis Quística del Grupo Cochrane de Fibrosis Quística y Trastornos Genéticos: 28 febrero de 2019.
Criterios de selección
Cualquier ensayo de solución salina hipertónica en pacientes con fibrosis quística en el que el momento de la inhalación fuera el elemento aleatorio en el protocolo del estudio con: inhalación hasta seis horas antes de las técnicas de limpieza de las vías respiratorias en comparación con la inhalación durante las técnicas de limpieza de las vías respiratorias en comparación con la inhalación hasta seis horas después de las técnicas de limpieza de las vías respiratorias; o la inhalación matutina en comparación con la nocturna con cualquier definición proporcionada por el autor.
Obtención y análisis de los datos
Ambos autores de la revisión evaluaron de forma independiente los ensayos identificados mediante la búsqueda para su posible inclusión en la revisión. La certeza de la evidencia se evaluó mediante los criterios GRADE.
Resultados principales
Las búsquedas identificaron 104 informes de ensayos que representaban 51 ensayos, de los cuales tres ensayos cruzados (cross‐over) (que proporcionaban datos sobre 77 participantes) cumplían los criterios de inclusión. Se presentaron tres comparaciones: inhalación antes versus durante las técnicas de limpieza de las vías respiratorias; inhalación antes versus después de las técnicas de limpieza de las vías respiratorias; e inhalación durante versus después de las técnicas de limpieza de las vías respiratorias. Un ensayo (50 participantes), dado su diseño de tres brazos, fue elegible para las tres comparaciones. Ningún ensayo comparó la inhalación de solución salina hipertónica matutina versus vespertina.
Se consideró que la evidencia de los tres ensayos era de baja calidad y se redujo la clasificación por limitaciones (alto riesgo de sesgo debido al cegamiento) y falta de direccionalidad (todos los participantes son adultos y, por lo tanto, no es aplicable a los niños). Los períodos de intervención variaron de un tratamiento a tres tratamientos en un día. No hubo diferencias clínicamente importantes entre los regímenes de tiempo de inhalación de solución salina hipertónica antes, durante o después de las técnicas de limpieza de las vías respiratorias en cuanto a la media de la mejora de la función pulmonar o las puntuaciones de los síntomas (77 participantes), y las comparaciones entre grupos no fueron significativas (evidencia de baja certeza). Aunque puede haber poca o ninguna diferencia en la calificación de la satisfacción cuando la solución salina hipertónica se inhaló antes versus durante las técnicas de limpieza de las vías respiratorias (64 participantes) (con un intervalo de confianza del 95% que incluye la posibilidad de una calificación de satisfacción tanto mayor como menor), la satisfacción puede ser menor en una escala de 100 mm cuando se inhala después de las técnicas de limpieza de las vías respiratorias en comparación con antes: diferencia de medias (DM) 20,38 mm (intervalo de confianza del 95% [IC]: 12,10 a 28,66) y cuando se compara con durante las técnicas, DM 14,80 mm (IC del 95%: 5,70 a 23,90). La efectividad percibida mostró resultados similares: poca o ninguna diferencia para la inhalación antes de las técnicas de limpieza de las vías respiratorias versus durante las mismas (64 participantes); puede ser menor cuando se inhala después de las técnicas de limpieza de las vías respiratorias en comparación con antes, DM 10,62 (IC del 95%: 2,54 a 18,70); y también cuando se compara con durante las técnicas, DM 15,60 (IC del 95%: 7,55 a 23,65). En ninguno de los ensayos se informó sobre la calidad de vida o los eventos adversos.
Conclusiones de los autores
El momento de la inhalación de la solución salina hipertónica no influye en la función pulmonar (evidencia de baja certeza). Sin embargo, la inhalación de solución salina hipertónica antes o durante las técnicas de limpieza de las vías respiratorias puede maximizar la eficacia y la satisfacción percibidas. La eficacia a largo plazo de la solución salina hipertónica sólo se ha establecido para inhalaciones dos veces al día; sin embargo, si sólo se tolera una dosis diaria, la hora del día en que se inhala podría basarse en la conveniencia o la tolerabilidad hasta que se disponga de evidencia que permita comparar estos regímenes.
Los ensayos identificados tuvieron períodos de intervención muy cortos, por lo cual, podría realizarse investigación a más largo plazo para establecer los efectos que surgen del uso regular; la misma incorporaría la influencia de los cambios en la adherencia al uso a largo plazo, así como la generación de datos sobre cualquier efecto adverso que ocurriera con el uso a largo plazo.
PICO
Resumen en términos sencillos
Momento adecuado de inhalación de solución salina hipertónica en pacientes con fibrosis quística
Pregunta de la revisión
Se examinó la evidencia acerca de si el momento adecuado (con relación a las técnicas de limpieza de las vías respiratorias o al momento del día) de la inhalación de solución salina hipertónica (una solución de alta concentración de soluto, salada y estéril) a través de un nebulizador mejora las propiedades físicas del esputo, estimula la tos, mejora los resultados clínicos (como la función pulmonar) y mejora el efecto percibido de las técnicas de limpieza de las vías respiratorias en los pacientes con fibrosis quística. Ésta es una actualización de una revisión Cochrane publicada anteriormente.
Antecedentes
La inhalación regular de solución salina hipertónica mejora los resultados clínicos en los pacientes con fibrosis quística. Existen dudas sobre si es mejor inhalar la solución salina hipertónica antes, durante o después de la limpieza de las vías respiratorias con técnicas físicas, o sobre si es mejor inhalarla a la mañana o la tarde noche. Se realizaron búsquedas de ensayos que comparaban estos diferentes regímenes del momento adecuado.
Fecha de la búsqueda
La evidencia está actualizada hasta: 28 febrero de 2019.
Características de los estudios
La revisión incluyó tres estudios con 77 pacientes con fibrosis quística de entre 18 y 64 años de edad. Los estudios consideraron el impacto del momento adecuado de la inhalación de solución salina hipertónica con relación a las técnicas de limpieza de las vías respiratorias. Los estudios informaron los resultados inmediatos después de la inhalación de solución salina hipertónica antes, durante o después de las técnicas físicas de limpieza de las vías respiratorias. Todos los estudios fueron cortos, e incluían sólo uno a tres tratamientos de cada régimen del momento adecuado.
Resultados clave
Aunque los resultados como la función pulmonar no mostraron diferencias entre los regímenes, los pacientes con fibrosis quística percibieron que la inhalación de solución salina hipertónica antes o durante las técnicas de limpieza de las vías respiratorias puede ser más efectiva y satisfactoria que la inhalación de solución salina hipertónica después de la limpieza de las vías respiratorias. No se encontraron estudios que compararan la inhalación matutina y vespertina. La eficacia a largo plazo de la solución salina hipertónica sólo se ha establecido para inhalaciones dos veces al día; sin embargo, si sólo se tolera una dosis por día, el momento del día en el que se realice la inhalación se podría basar en la comodidad o la tolerabilidad hasta que se disponga de más evidencia.
Calidad de la evidencia
En general, la calidad general de la evidencia fue baja. Los únicos temas que quizás hayan afectado la calidad se relacionaron con el hecho de que no fue posible realizar el cegamiento de los participantes al tratamiento recibido. Sin embargo, como los estudios fueron a corto plazo y la mayoría de los resultados significativos se basaron en la eficacia percibida, se necesitan estudios adicionales sobre el momento adecuado de la administración de la solución salina hipertónica.
Authors' conclusions
Summary of findings
| Inhalation before compared with during airway clearance techniques for cystic fibrosis | ||||||
| Patient or population: adults and children with cystic fibrosis Settings: outpatients Intervention: inhalation before airway clearance techniques Comparison: inhalation during airway clearance techniques | ||||||
| Outcomes | Illustrative comparative risks* (95% CI) | Relative effect | No of Participants | Certainty of the evidence | Comments | |
| Assumed risk | Corresponding risk | |||||
| Inhalation during airway clearance techniques | Inhalation before airway clearance techniques | |||||
| FEV1 % predicted Follow‐up: before treatment to ˜2 hours later | Not reported1 | The mean FEV1 (% predicted) was 0.56% higher (0.48% lower to 1.60% higher) in the inhalation before airway clearance techniques. | NA | 63 (2 studies) | ⊕⊕⊖⊖ low2,3 | FEV1 (L) also showed no statistically significant difference between groups. Participants received both inhalation approaches as cross‐over design. |
| FVC % predicted Follow‐up: before treatment to 2 hours later | Not reported1 | The mean FVC (% predicted) was 2.09% higher (0.08% higher to 4.11% higher) in the inhalation before airway clearance techniques. | NA | 50 (1 study) | ⊕⊕⊖⊖ low2,3 | FEV1 (L) showed no statistically significant difference between groups. Participants received both inhalation approaches as cross‐over design. |
| QoL | Outcome not reported. | NA | NA | NA | ||
| Symptom scores | See comments. | NA | 76 (3 studies) | ⊕⊕⊖⊖ low2,3 | All of the symptom scores suggest no statistically significant difference between the groups. This outcome includes a range of symptom scores from many different studies but number of participants contributing to each symptom score varies. | |
| Measures of sputum clearance: sputum wet weight immediately (g) | Not reported1 | The mean wet weight of sputum during the application of the intervention was 0.26 g lower (4.79 g lower to 4.27 g higher) in the inhalation before airway clearance techniques. | NA | 26 (2 studies) | ⊕⊕⊖⊖ low2,3 | The mean wet weight of sputum for the 24 hours following treatment suggests no statistically significant difference between the groups. Participants received both inhalation approaches as cross‐over design. |
| LCI Follow‐up: 90 minutes later | Not reported1 | The mean LCI was 0.02 lower (0.63 lower to 0.59 higher) in the inhalation before airway clearance techniques. | NA | 13 (1 study) | ⊕⊕⊖⊖ low2,3 | The mean LCI immediately after treatment suggests no statistically significant difference between the groups. Participants received both inhalation approaches as cross‐over design. |
| Adverse events | Outcome not reported. | NA | NA | NA | ||
| *The basis for the assumed risk (e.g. the median control group risk across studies) is provided in footnotes. The corresponding risk (and its 95% confidence interval) is based on the assumed risk in the comparison group and the relative effect of the intervention (and its 95% CI). | ||||||
| GRADE Working Group grades of evidence | ||||||
| 1. Only differences between inhalation before and during airway clearance techniques were presented, results within the inhalation during airway clearance techniques were not presented therefore an assumed risk cannot be calculated. 2. Downgraded once due to high risk due to lack of blinding of participants and personnel. 3. Downgraded once for lack of applicability as studies included only adults so results are not applicable to children. | ||||||
| Inhalation before compared with after airway clearance techniques for cystic fibrosis | ||||||
| Patient or population: adults and children with cystic fibrosis Settings: outpatients Intervention: inhalation before airway clearance techniques Comparison: inhalation after airway clearance techniques | ||||||
| Outcomes | Illustrative comparative risks* (95% CI) | Relative effect | No of Participants | Certainty of the evidence | Comments | |
| Assumed risk | Corresponding risk | |||||
| Inhalation after airway clearance techniques | Inhalation before airway clearance techniques | |||||
| FEV1 % predicted Follow‐up: before treatment to 2 hours later | Not reported1 | The mean FEV1 (% predicted) was 0.75% higher (0.45% lower to 1.95% higher) in the inhalation before airway clearance techniques. | NA | 50 (1 study) | ⊕⊕⊖⊖ low2,3 | FEV1 (L) also showed no statistically significant difference between groups. Participants received both inhalation approaches as cross‐over design. |
| FVC % predicted Follow‐up: before treatment to 2 hours later | Not reported1 | The mean FVC (% predicted) was 1.66% higher (1.42% lower to 4.74% higher) in the inhalation before airway clearance techniques. | NA | 50 (1 study) | ⊕⊕⊖⊖ low2,3 | FVC (L) showed no statistically significant difference between groups. Participants received both inhalation approaches as cross‐over design. |
| QoL | Outcome not reported. | NA | NA | NA | ||
| Symptom scores | See comments. | NA | 50 (1 study) | ⊕⊕⊖⊖ low2,3 | Three symptom scores have been presented: Perceived efficacy shows a statistically significant difference in favour of inhalation before airway clearance techniques (MD 10.62; 95% CI 2.54 to 18.70) Tolerability showed no statistically significant difference between groups. Satisfaction shows a statistically significant difference in favour of inhalation before airway clearance techniques, MD 20.38 (95% CI 12.10 to 28.66) | |
| Measures of sputum clearance | Outcome not reported. | NA | NA | NA | ||
| LCI | Outcome not reported | NA | NA | NA | ||
| Adverse events | Outcome not reported | NA | NA | NA | ||
| *The basis for the assumed risk (e.g. the median control group risk across studies) is provided in footnotes. The corresponding risk (and its 95% CI) is based on the assumed risk in the comparison group and the relative effect of the intervention (and its 95% CI). | ||||||
| GRADE Working Group grades of evidence | ||||||
| 1. Only differences between inhalation before and during airway clearance techniques were presented, results within the inhalation during airway clearance techniques were not presented therefore an assumed risk cannot be calculated. 2. Downgraded once due to high risk due to lack of blinding of participants and personnel. 3. Downgraded once for lack of applicability as studies included only adults so results are not applicable to children. | ||||||
| Inhalation during compared with after airway clearance techniques for cystic fibrosis | ||||||
| Patient or population: adults and children with cystic fibrosis Settings: outpatients Intervention: inhalation during airway clearance techniques Comparison: Inhalation after airway clearance techniques | ||||||
| Outcomes | Illustrative comparative risks* (95% CI) | Relative effect | No of Participants | Certainty of the evidence | Comments | |
| Assumed risk | Corresponding risk | |||||
| Inhalation after airway clearance techniques | Inhalation during airway clearance techniques | |||||
| FEV1 % predicted Follow‐up: before treatment to 2 hours later | Not reported1 | The mean FEV1 (% predicted) was 0.03% lower (1.19% lower to 1.12% higher) in the inhalation during airway clearance techniques. | NA | 50 (1 study) | ⊕⊕⊖⊖ low2,3 | FEV1 (L) also showed no statistically significant difference between groups. Participants received both inhalation approaches as cross‐over design. |
| FVC % predicted Follow‐up: before treatment to 2 hours later | Not reported1 | The mean FVC (% predicted) was 0.44% lower (3.34% lower to 2.46% higher) in the inhalation during airway clearance techniques. | NA | 50 (1 study) | ⊕⊕⊖⊖ low2,3 | FVC (L) also showed no statistically significant difference between groups. Participants received both inhalation approaches as cross‐over design. |
| QoL | Outcome not reported. | NA | NA | NA | ||
| Symptom scores | See comments. | NA | 50 (1 study) | ⊕⊕⊖⊖ low2,3 | Three symptom scores have been presented: Perceived efficacy shows a statistically significant difference in favour of inhalation during airway clearance techniques, MD 15.60 (95% CI 7.55 to 23.65) Tolerability showed no statistically significant difference between groups. Satisfaction shows a statistically significant difference in favour of inhalation during airway clearance techniques, MD 14.80 (95% CI 5.70 to 23.90) | |
| Measures of sputum clearance | Outcome not reported. | NA | NA | NA | ||
| LCI | Outcome not reported. | NA | NA | NA | ||
| Adverse events | Outcome not reported. | NA | NA | NA | ||
| *The basis for the assumed risk (e.g. the median control group risk across studies) is provided in footnotes. The corresponding risk (and its 95% CI) is based on the assumed risk in the comparison group and the relative effect of the intervention (and its 95% CI). | ||||||
| GRADE Working Group grades of evidence | ||||||
| 1. Only differences between inhalation before and during airway clearance techniques were presented, results within the inhalation during airway clearance techniques were not presented therefore an assumed risk cannot be calculated. 2. Downgraded once due to high risk due to lack of blinding of participants and personnel. 3. Downgraded once for lack of applicability as studies included only adults so results are not applicable to children. | ||||||
Background
Description of the condition
Cystic fibrosis (CF) is the most common life‐limiting autosomal recessive disorder amongst Caucasians (Cutting 2002). Mucociliary clearance is impaired in CF (Robinson 1996; Robinson 1997). Cystic fibrosis‐related pulmonary disease is the major cause of morbidity and mortality (Buzzetti 2009).
Description of the intervention
Hypertonic saline is a sterile salt‐water solution delivered as a nebulised therapy, usually at a concentration of between 3% and 10% (composition by mass). Traditionally, volumes of 3 mL to 10 mL are nebulised (Elkins 2006c; Wark 2018). Long‐term use is recommended (Button 2016).
Each dose of hypertonic saline is usually nebulised immediately prior to airway clearance, but other timing regimens are sometimes used in clinical practice. The clinical effect of hypertonic saline could be affected by the timing of its delivery in relation to physical airway clearance techniques (before, during or after) or in relation to time of day (morning or evening).
How the intervention might work
Hypertonic saline has been shown to accelerate mucociliary clearance in the CF airway (Robinson 1996; Robinson 1997). Three mechanisms are believed to contribute to this improvement in mucociliary clearance. The first is restoration of the depleted airway surface liquid volume, which peaks almost immediately after a dose, but which may be sustained for several hours (Donaldson 2006). The other mechanisms are improvement in the rheology of the mucus (King 1997; Wills 1997), and stimulation of cough (Robinson 1996; Robinson 1997). The overall effect on mucus clearance is presumably responsible for the significant clinical improvements including lung function, quality of life (QoL), and ease of expectoration with regular use of the therapy (Elkins 2006b; Eng 1996). A Cochrane Review of nebulised hypertonic saline for CF concluded that improvements in forced expiratory volume at one second (FEV1) were demonstrated over two to four weeks of therapy and QoL and pulmonary exacerbation rates were improved compared to placebo interventions over 48 weeks of treatment (Wark 2018).
In the controlled studies that established the efficacy of hypertonic saline (Elkins 2006c; Eng 1996; Robinson 1996; Robinson 1997), each dose was nebulised immediately before the administration of airway clearance techniques. However, other timing regimens may have advantages. Nebulisation of hypertonic saline during airway clearance techniques could save time. It also may capitalise on the immediate peak in the airway surface liquid volume. Nebulisation after airway clearance techniques may capitalise on the reduction in airway obstruction by mucus and therefore allow delivery of the hypertonic saline to a greater portion of the bronchial tree.
In the clinical trials that established the efficacy of the regular use of hypertonic saline (Donaldson 2006; Elkins 2006c; Eng 1996), at least two doses per day were used. However, some individuals can tolerate (or for other reasons elect to use) only one dose per day. For these people, nebulising the dose at a particular time of the day may affect its efficacy. Given that spontaneous mucociliary clearance is faster during waking hours than sleep (Bateman 1978), morning inhalation of hypertonic saline may capitalise on faster daytime mucociliary clearance and on the mucus‐clearing effects of daytime activities such as exercise (Wolff 1977). Some people with CF find evening inhalation more convenient or report that it improves ease of expectoration the following morning. Since mucociliary clearance and coughing are suppressed overnight, evening inhalation of hypertonic saline may increase its dwell time in the airways, possibly increasing its clinical efficacy.
Why it is important to do this review
Despite the theoretical rationales presented to justify the investigation of alternative timing regimens in the previous section, it is also possible that any timing regimen may have adverse effects on the efficacy, tolerability and convenience of the treatment and on the duration of the airway clearance session. For example, nebulisation of hypertonic saline during airway clearance techniques could increase the complexity of the overall session of airway clearance, perhaps requiring modified equipment. Nebulisation after airway clearance techniques presumably delivers the hypertonic saline more directly to the exposed airway epithelium, rather than an overlying mucus layer, which may reduce tolerability. Evening delivery may increase nocturnal coughing and sleep disturbance. Therefore, it is important to review well‐designed research that compares the regimens.
There is a high treatment burden associated with CF for both people with the disease and for care providers. Hypertonic saline inhalation adds to the duration of the overall treatment regimen. Therefore, even if the various timing regimens have equal clinical efficacy, it is important that the review also investigates whether the interventions differ in their effects on the duration of the overall airway clearance session, in their convenience and in their side effects.
This is an update of a previously published Cochrane Review (Elkins 2012; Elkins 2016).
Objectives
To determine whether the timing of hypertonic saline inhalation, in relation to physical airway clearance techniques or time of day, has an impact on objective and subjective measures of clinical efficacy and tolerability in people with CF.
Methods
Criteria for considering studies for this review
Types of studies
Randomised trials (published and unpublished). Both random allocation and quasi‐random allocation (e.g. where there is alternate allocation to groups) were included. Parallel and cross‐over trials were eligible.
Types of participants
People of all ages and of both sexes with CF diagnosed by genetic testing or evidence on sweat chloride or nasal potential difference, including all degrees of disease severity.
Types of interventions
Nebulised hypertonic saline, where timing of inhalation was the randomised element in the study protocol:
-
hypertonic saline inhalation up to six hours before airway clearance techniques, compared to inhalation during airway clearance techniques;
-
hypertonic saline inhalation up to six hours before airway clearance techniques, compared to up to six hours after airway clearance techniques;
-
hypertonic saline inhalation during airway clearance techniques, compared to up to six hours after airway clearance techniques;
-
morning compared to evening inhalation with any definition provided by the author. If not defined, we accepted midnight to midday as morning and midday to midnight as evening.
Note: many individuals perform two treatments with physical airway clearance techniques each day. Even if these treatments are performed as far as possible from each other (i.e. 12 hours apart), any threshold greater than six hours would mean that the hypertonic saline labelled ‘before’ would actually be closer to ‘after’ the previous treatment with physical airway clearance techniques. Therefore, six hours is the broadest threshold possible to capture all potentially relevant trials. However, some of the mechanisms by which timing may affect the outcome are short‐lived. Therefore, a sensitivity analysis is performed that only considers trials where the hypertonic saline is within 30 min of the techniques (seeSensitivity analysis).
The timing regimen could be a single treatment or could be maintained for any duration.
Hypertonic saline treatment had to be a minimum of a single dose of at least 3% concentration. If studies mentioned co‐interventions (such as bronchodilators and other inhaled medications), these were permitted provided they were the same on all trial days and taken either before or after the period during which hypertonic saline and airway clearance techniques were used.
Airway clearance techniques (ACT) had to be a minimum of 10 minutes in duration and include at least one of the following:
-
postural drainage with percussion and vibration (PDPV). In other reviews this has been described as conventional chest physiotherapy (CCPT) (Elkins 2006c; Main 2009; van der Schans 2009);
-
active cycle of breathing techniques (ACBT).This comprises relaxation or breathing control, forced expiration technique (FET), thoracic expansion exercises and may include postural drainage or percussion (Robinson 2010);
-
autogenic drainage (AD). This breathing technique uses high expiratory flow rates at varying lung volumes to enhance mucus clearance while avoiding airway closure;
-
positive expiratory pressure (PEP) (Elkins 2006a);
-
oral oscillatory devices that provide oscillating PEP (such as the Flutter, Cornet and Acapella) or intrapulmonary percussive ventilation, which provides continuous oscillation of the air pressure in the airways via the mouth (Morrison 2009);
-
thoracic oscillating devices applied via a vest to provide external chest wall oscillation (Morrison 2009);
-
exercise prescribed for the purpose of airway clearance either independently or as an adjunct to other techniques.
Types of outcome measures
Primary outcomes
-
Lung function, i.e., change in lung function (measured in litres or % predicted). If change values are unavailable, final post‐treatment values will be used. Values in litres and in % predicted will be analysed separately.
-
forced expiratory volume at one second (FEV1)
-
forced vital capacity (FVC)
-
-
Patient‐reported outcomes, using validated scales or subjective reporting measures
-
measures of QoL
-
symptom scores (including cough, tolerability, subjective ease of clearance, or treatment satisfaction)
-
Secondary outcomes
-
Measures of sputum clearance, including measures of mucociliary clearance (assessed by radioactive tracer clearance) and objective measures of sputum volume
-
Measures of exercise capacity (either maximal or submaximal where measured directly, or by a standard field test)
-
Mortality (all cause or CF‐related, analysed separately)
-
Other pulmonary parameters
-
forced expiratory flow between 25% and 75% of the vital capacity (FEF25‐75)
-
maximal instantaneous forced flow when 25% of the FVC remains to be exhaled (MEF25)
-
total lung capacity (TLC)
-
residual volume (RV)
-
functional residual capacity (FRC)
-
lung clearance index (LCI)
-
-
Frequency of exacerbations of respiratory infection (where a clear definition is described demonstrating an increase in symptoms or a decline in pulmonary function)
-
admission rates to hospital (defined as either number of inpatient hospital admissions or days as a hospital inpatient)
-
courses of IV antibiotics (whether received in hospital or in the home)
-
outpatient treatments (presentations to hospital, unscheduled visits to the doctor)
-
-
Adherence to inhaled therapies, airway clearance techniques, and other therapies
-
Adverse effects such as bronchospasm, cough and acute decline in pulmonary function
Search methods for identification of studies
A comprehensive search strategy was formulated in an attempt to identify all relevant trials regardless of language or publication status (published, unpublished, in press, and in progress).
Electronic searches
We identified relevant trials from the Cochrane Cystic Fibrosis and Genetic Disorders Group's Cystic Fibrosis Trials Register using the term 'hypertonic saline'.
The Cystic Fibrosis Trials Register is compiled from electronic searches of the Cochrane Central Register of Controlled Trials (CENTRAL) (updated each new issue of the Cochrane Library), weekly searches of MEDLINE, a search of Embase to 1995 and the prospective handsearching of two journals ‐ Pediatric Pulmonology and the Journal of Cystic Fibrosis. Unpublished work was identified by searching the abstract books of relevant conferences, including the three major cystic fibrosis conferences: the International Cystic Fibrosis Conference, the European Cystic Fibrosis Conference and the North American Cystic Fibrosis Conference. For full details of all searching activities for the register, please see the relevant sections of the Cochrane Cystic Fibrosis and Genetic Disorders Group's website.
Date of last search of the Cochrane Cystic Fibrosis and Genetic Disorders Group's Cystic Fibrosis Trials Register: 28 February 2019.
In addition, we searched the Physiotherapy Evidence Database (PEDro) (Michaleff 2011) and the WHO International Clinical Trials Registry Platform for all years available (Appendix 1; Appendix 2). Date of last search: 21 February 2019.
Searching other resources
We hand‐searched the biennial Australia and New Zealand CF Conference Proceedings from 1995 to 2017.
We contacted trial authors, experts and manufacturers of hypertonic saline to identify additional trials.
We searched the reference lists of the included studies.
Data collection and analysis
Selection of studies
Both authors (RD, ME) independently selected the trials to be included in the review. We performed initial screening by title and abstract, and reviewed the full text for studies remaining after the initial screening phase. We resolved disagreements by discussion. We excluded irrelevant records and have presented the details of these excluded trials and the reasons for exclusion in tabular form (Characteristics of excluded studies).
Data extraction and management
Each author independently extracted data from the included studies using a standardised data extraction form. We resolved any disagreements by discussion. Where data were absent or difficult to interpret in the presented form, the authors contacted the trial investigators to gain the information required to evaluate risk of bias in the trial and to facilitate data analysis. Data extraction was also carried out at the editorial base for the Dentice trial given we (the Cochrane Review authors) are also two of the trial authors (Dentice 2012).
Assessment of risk of bias in included studies
We independently determined the risk of bias for each trial using published and unpublished data from the trial investigators, following the domain‐based evaluation as described in the Cochrane Handbook for Systematic Reviews of Interventions 5.1 (Higgins 2011). The risk of bias was also carried out at the editorial base for the Dentice trial given we (the Cochrane Review authors) are also two of the trial authors (Dentice 2012). We assessed the following domains as either low risk, unclear risk, or high risk of bias:
-
sequence generation;
-
allocation concealment;
-
blinding (of participants, personnel and outcome assessors);
-
incomplete outcome data;
-
selective outcome reporting;
-
other sources of bias.
We resolved any disagreements by discussion. In addition, each author independently rated each trial on the PEDro Scale (Maher 2003; de Morton 2009), using published and unpublished data from the trial investigators. The PEDro Scale was chosen because it has acceptably high reliability for individual ratings and for consensus ratings (Maher 2003; Shiwa 2011). It has undergone extensive validation including convergent and construct validity and the appropriateness of the scoring system has been justified with Rasch analysis (de Morton 2009). The PEDro Scale is also widely used and understood by physiotherapists (Elkins 2013). The Cochrane Risk of Bias tool has reliability that ranges from poor to slight (Armijo‐Olivo 2012; Hartling 2009; Hartling 2013).
Measures of treatment effect
For dichotomous data we planned to use the risk ratio (RR) with 95% confidence intervals (95% CIs) as a measure of treatment effect with an intention‐to‐treat analysis. An intention‐to‐treat analysis means that, where participants did not receive treatment as allocated, and were measures of outcomes were available, the analysis was performed as if participants received the treatment to which they were allocated. We considered a trial to have analysed by intention to treat if the report explicitly states that all participants received treatment or control conditions as allocated. Mortality and adverse events were the only dichotomous outcomes.
For continuous data we planned to record the difference in mean change from baseline and standard deviation (SD) (or standard errors (SE)) for each group, or the final group means and SDs if change data are unavailable. We planned to calculate a pooled estimate of treatment effect using the mean difference (MD) with 95% CIs.
However, given that both of the included trials were cross‐over in design, we used the generic inverse variance method. Where the MD and SE of the MD were available, we entered these directly into the meta‐analysis. Where only group means and SDs were available, we calculated the MD by subtraction of one group mean from the other. We imputed the SD of the differences from that obtained from the data in a similar trial, taking into account the paired nature of the data. We then calculated SEs using the formula: imputed SD / √n.
Unit of analysis issues
We incorporated data from cross‐over trials into meta‐analysis using the generic inverse variance method, involving expression of data in terms of the paired mean differences between treatments and their SE. We calculated these values either from paired individual patient data provided by authors, or by calculation of mean differences between interventions and their SE from means, SDs and P values reported in the manuscript (Elbourne 2002). We intended to combine data from parallel‐designed trials with those from cross‐over trials in the meta‐analyses, but only cross‐over trials were obtained. If necessary, we intended to calculate the SEs in parallel trials from the MDs between treatments and their CIs, but only cross‐over trials were obtained.
Dealing with missing data
Where data were absent or difficult to interpret in the presented form, we contacted the trial investigators in an attempt to obtain the data in a form that would facilitate data analysis. Had we not been able to obtain the data, our plan was to analyse only the available data (available‐case analysis). Additional data were obtained from the authors of the van Ginderdeuren trial (Van Ginderdeuren 2011). Additional data were sought from the authors of the O'Neill trial (O'Neill 2016) and data were received for all requested outcomes.
Assessment of heterogeneity
We visually inspected forest plots for overlap of the CIs and estimated statistical heterogeneity using the I² value (Higgins 2003). Given that thresholds for the interpretation of I² can be misleading (since the importance of inconsistency depends on several factors) we chose a rough guide to interpretation as follows: moderate heterogeneity was defined as an I² value of 30% to 60%, substantial heterogeneity was defined as an I² value of 50% to 90%, and considerable heterogeneity was defined as an I² value of 75% to 100%. The P value from the chi‐squared test was also used to interpret the importance of the observed value of I². Clinical heterogeneity was also assessed by considering differences in trial designs and participants characteristics.
Assessment of reporting biases
If we had included sufficient trials in the review, we planned to assess publication bias using a funnel plot. If we suspected outcome reporting bias, we planned to contact trial investigators to clarify whether they measured and analysed certain outcomes and obtained the data. However, only two eligible trials were obtained; this was fewer than the recommended number of studies to construct a funnel plot so we were unable to assess whether outcome reporting bias was likely.
Data synthesis
We analysed the following between‐group comparisons where possible:
-
hypertonic saline inhalation up to six hours before airway clearance techniques, compared to inhalation during airway clearance techniques;
-
hypertonic saline inhalation up to six hours before airway clearance techniques, compared to up to six hours after airway clearance techniques;
-
hypertonic saline inhalation during airway clearance techniques, compared to up to six hours after airway clearance techniques;
-
morning compared to evening inhalation with any definition provided by the author. If not defined, we accepted midnight to midday as morning and midday to midnight as evening.
We performed meta‐analyses using a fixed‐effect model. However, if we had observed substantial heterogeneity, we planned to use a random‐effects model. We planned to further explore heterogeneity in the planned subgroup analyses.
Subgroup analysis and investigation of heterogeneity
We planned a subgroup analysis for different concentrations of hypertonic saline inhalation: low hypertonic concentrations (3% to 5%); medium (6% to 7%); and high (8% to 10%). We also planned to perform a subgroup analysis for intervention duration: less than two weeks; two to eight weeks; and greater than eight weeks. However, the included studies did not permit these analyses.
Sensitivity analysis
We planned to conduct sensitivity analyses to assess the robustness of the review results by repeating the analyses with the following adjustments:
-
exclusion of trials with unclear or inadequate sequence generation;
-
exclusion of trials with unclear or inadequate allocation concealment;
-
exclusion of trials that scored less than 5 out of 10 on the PEDro Scale (Maher 2003);
-
modifying the definition of 'before' and 'after' airway clearance techniques to within 30 minutes of the techniques;
-
with and without cross‐over trials.
However, the included studies did not permit these analyses.
Summary of findings tables
In a post hoc change, we have presented three summary of findings tables, one for each comparison (summary of findings Table for the main comparison; summary of findings Table 2; summary of findings Table 3). We have included the following outcomes: FEV1, FVC, measures of QoL, symptom scores, measures of sputum clearance, lung clearance index and adverse events.
We determined the certainty of the evidence using the GRADE approach; and downgraded evidence in the presence of: a high risk of bias in at least one study; indirectness of the evidence; unexplained heterogeneity or inconsistency; imprecision of results, or a high probability of publication bias. We downgraded evidence by one level if we considered the limitation to be serious and by two levels if very serious.
Results
Description of studies
Results of the search
The searches identified 104 trial reports which represented 50 trials.
Included studies
Three trials were eligible for inclusion, which provided data for a total of 77 participants (Dentice 2012; Van Ginderdeuren 2011; O'Neill 2016) (Figure 1). One trial has not yet been published in full but has been presented as an oral presentation at a conference (although additional data has been provided by the trial authors) (Van Ginderdeuren 2011). No trial was identified regarding timing of hypertonic saline inhalation in relation to time of day.

Risk of bias graph: review authors' judgements about each risk of bias item presented as percentages across all included studies.
Trial characteristics
The three included studies were randomised, cross‐over trials with concealed allocation, intention to treat analysis and blinded assessors (Dentice 2012; Van Ginderdeuren 2011; O'Neill 2016). They investigated the impact of timing of hypertonic saline inhalation in relation to airway clearance techniques. The inhalation blocks were for one day. In one trial, three treatments of the allocated timing regimen were performed on each of the three trial days (Dentice 2012). In the second trial, a single treatment of 30 minutes was undertaken on each of the three trial days (Van Ginderdeuren 2011). One day was solely autogenic drainage and did not include hypertonic saline inhalation. This arm of the trial was not relevant to the study question of this review so the data were not included. The third trial also delivered a single treatment on each trial day, but only two timing regimens (inhalation before airway clearance techniques and inhalation during airway clearance techniques) were compared, so there were only two trial days (O'Neill 2016).
Participants
Clarification of participant data was requested from the authors of the two of the three studies. One trial included 50 adults (mean (SD) age 31 (10) years, range 18 to 64 years) with a confirmed diagnosis of cystic fibrosis who were clinically stable with an FEV1 within 10% of the best recorded value in the last six months (Dentice 2012). This trial excluded people who: were hypertonic saline naïve or previously intolerant; had received a lung transplant; were colonised with Burkholderia cepacia complex; were not clinically stable; had experienced haemoptysis greater than 60 mL within the last month; or were thrombocytopaenic or pregnant. The second trial recruited 13 hospitalised participants who were over 14 years (mean age 27 years, range 18 to 37 years) (Van Ginderdeuren 2011). All were productive daily and performed autogenic drainage for their airway clearance. The lung function of participants was not stated but some were noted to be on oxygen therapy. One participant withdrew after the first arm of the trial and therefore did not provide any cross‐over data that could be included in the analysis. The third study recruited 14 adults (mean (SD) age 33 (12) years), who were nearing the end of a course of intravenous antibiotics (days 10 to 14) for a pulmonary exacerbation of cystic fibrosis (O'Neill 2016). Eligibility criteria included being productive of at least 10 g of sputum daily and demonstrated tolerance of hypertonic (7%) saline through either past or current use, The participants' mean (SD) FEV1 was 51 (22) per cent predicted.
Interventions
One trial administered 4 mL of 6% hypertonic saline via an LC Star (PARI, Germany) nebuliser three times per day with the allocated timing regimen for that day (Dentice 2012). Hypertonic saline was nebulised immediately before or after airway clearance, or during airway clearance with blocks of inhalation and pauses for airway clearance. Participants using positive expiratory pressure (PEP) devices were not permitted to administer hypertonic saline simultaneously as this alters the inhaled dose and the distribution of the deposition (Laube 2005). The airway clearance technique was optimised for each participant on recruitment to the trial and was standardised for all three trial days. The second trial administered 4 mL of 6% hypertonic saline before or during 30 minutes of autogenic drainage (Van Ginderdeuren 2011). The third trial (O'Neill 2016) administered 4mL of 7% hypertonic saline via a Portex updraft nebuliser (Smiths Medical, UK). Airway clearance involved 10 supervised cycles of oscillating PEP using the Acapella Duet device with forced expiration techniques, which in total required about 20 minutes. When hypertonic saline was allocated to be administered during airway clearance, this was achieved by attaching the updraft nebuliser to the Acapella Duet. On both days, 200 micrograms of salbutamol was administered 15 minutes before the commencement of the randomly allocation intervention for that day. The use of co‐interventions (such as bronchodilators and other inhaled medications) was not reported in the other two studies (Dentice 2012; Van Ginderdeuren 2011).
Outcomes measures
One trial measured the change in FEV1 and FVC (in litres and percentage of the predicted value) recorded prior to and two hours following the middle treatment session of each trial day (Dentice 2012). Symptom scores at the end of each intervention arm were also recorded: perceived effectiveness; tolerability; and satisfaction rated on a 100‐mm visual analogue scale. Adverse events and adherence were also recorded. At the conclusion of the three‐day trial, participants reported their preferred timing regimen.
The second trial reported the change in dyspnoea scores at the conclusion of each intervention arm, wet weight of sputum in grams produced during the treatment session, and adverse events and adherence (Van Ginderdeuren 2011).
The third trial reported FEV1 and FEF25‐75 as a percentage of the predicted value (O'Neill 2016). Ease of use of the intervention and satisfaction with the intervention were also rated by the participants and the treating physiotherapists on a 100‐mm visual analogue scale. The wet weight of sputum produced and the number of coughs occurring during the allocated treatment session were also recorded, as was the wet weight of sputum during the subsequent 24 hours. Using a multiple breath washout test, the LCI and FRC were also recorded before, immediately after, and 90 minutes after each allocated treatment regimen. The duration of treatment was also noted.
Excluded studies
Of the remaining 46 studies identified through our search strategy, two were excluded because they did not involve the administration of hypertonic saline at all and one because the comparison of timing regimens was confounded by the use of different airway clearance techniques in the two arms of the study. A further 43 studies were excluded because the interventions they compared did not differ in the timing of hypertonic saline inhalation (Excluded studies).
Risk of bias in included studies
Please refer to Figure 1; Figure 2.

Risk of bias summary: review authors' judgements about each risk of bias item for each included study.
Allocation
Generation of sequence
All three trials reported adequate methods of random generation of the allocation sequence: computer‐generated list (Dentice 2012; O'Neill 2016) and allocations drawn from a box that had been shaken (Van Ginderdeuren 2011). Thus, the overall risk of bias for all trials due to the method of generation of the random sequence was low.
Concealment of allocation
Two trials reported using sealed opaque envelopes (Dentice 2012; Van Ginderdeuren 2011) and one reported using an independent investigator to conceal the allocation list (O'Neill 2016), so the overall risk of bias for all trials due to the non‐concealment of allocation was low.
Blinding
In all trials, participants were not blinded to the timing regimen, leading to a high risk of bias. In all trials, outcome assessors were blinded to the timing regimen, leading to a low risk of bias.
Incomplete outcome data
All trials reported all available data. One trial stated no withdrawals occurred (Dentice 2012). The second trial stated that one participant withdrew after the first arm of the trial and therefore did not provide any cross‐over data that could be included in the analysis (Van Ginderdeuren 2011) so analysis was conducted with all available data from 12 out of 13 participants (92%). The third trial ceased recruitment at 14 participants instead of the intended 31 because an interim analysis showed that the treatment was unlikely to be statistically or clinically significant (O'Neill 2016). Additionally, one of the 14 participants withdrew and data were reported on the remaining 13 participants (93%). Therefore, the risk of bias due to attrition was low across all trials.
Selective reporting
Two trials had a low risk of bias for this domain; one trial was prospectively registered and remained consistent with this protocol (Dentice 2012); one trial was prospectively registered and reported all of the registered outcome measures, but some additional unregistered outcome measures (ease, satisfaction, cough and treatment duration) were also reported (O'Neill 2016). The third trial was not registered and therefore had an unclear risk of bias (Van Ginderdeuren 2011).
Other potential sources of bias
No other potential sources of bias were identified.
All of the trials met the external validity criterion of the PEDro score by stating both the source of participants and the eligibility criteria. Both trials met eight of the ten internal validity criteria on the PEDro score, with neither trial blinding participants or therapists.
Effects of interventions
See: Summary of findings for the main comparison Inhalation before compared with during airway clearance techniques for cystic fibrosis; Summary of findings 2 Inhalation before compared with after airway clearance techniques for cystic fibrosis; Summary of findings 3 Inhalation during compared with after airway clearance techniques for cystic fibrosis
Inhalation before versus during airway clearance techniques
Three studies with a total of 77 participants contributed data to this comparison (Dentice 2012; Van Ginderdeuren 2011; O'Neill 2016).
Primary outcomes
1. Lung function
a. FEV1
One trial (50 participants) provided data in litres for this outcome (Dentice 2012). The change in FEV1 from immediately before a treatment to two hours later was higher on average when hypertonic saline was inhaled before airway clearance techniques, but this was not statistically significant (Analysis 1.1). Two trials (63 participants) reported estimates of the effect on FEV1 using % predicted data, however, this difference was not statistically significant (low‐certainty evidence) (Analysis 1.2) (Dentice 2012; O'Neill 2016).
b. FVC
One trial (50 participants) provided data for this outcome (Dentice 2012). The change in FVC from immediately before a treatment to two hours later was not statistically significantly different between trial arms when analysed using data in litres (Analysis 1.3). However, change in FVC from immediately before a treatment to two hours later was higher on average when hypertonic saline was inhaled before airway clearance techniques when analysed using % predicted data, with a MD of 2.09% pred (95% CI 0.08 to 4.11) (low‐certainty evidence) (Analysis 1.4).
2. Patient‐reported outcomes
a. QoL
No trial reported this outcome.
b. Symptom scores
Three studies with a total of 77 participants contributed data to this comparison (low‐certainty evidence) (Dentice 2012; O'Neill 2016; Van Ginderdeuren 2011).
Cough in the 24 hours following treatment was reported for 13 participants in one trial (O'Neill 2016). There was no significant difference between the groups in the number of coughs (Analysis 1.5).
The remaining symptoms were all measured on a 100‐mm visual analogue scale.
Dyspnoea was reported for 12 participants in one trial (Van Ginderdeuren 2011). There was no significant difference in the severity of dyspnoea between the groups (Analysis 1.6).
Tolerability and perceived efficacy were reported for 50 participants in one trial (Dentice 2012), there were no significant differences between the groups for either outcome (Analysis 1.7; Analysis 1.8).
Ease of sputum clearance was reported for 13 participants in one trial (O'Neill 2016). The same trial also reported data estimates of ease of sputum clearance from the treating physiotherapist. There were no significant between‐group differences for the patient ratings (Analysis 1.9), nor for the therapist ratings (Analysis 1.10).
Satisfaction with the treatment regimen was rated by the patients in two trials (64 participants) (Dentice 2012; O'Neill 2016). The pooled result of meta‐analysis indicated no significant difference between the groups (Analysis 1.11). The O'Neill trial also obtained data on satisfaction from the treating physiotherapist (O'Neill 2016). Again there was no significant difference between the groups (Analysis 1.12).
Secondary outcomes
1. Measures of sputum clearance
Two trials provided data from 25 participants for wet weight of sputum during the application of the intervention (O'Neill 2016; Van Ginderdeuren 2011). The pooled result of meta‐analysis indicated no significant difference between the groups (low‐certainty evidence) (Analysis 1.13). One of the trials also collected data on wet weight of sputum for the 24 hours following treatment, again there was no significant difference between the groups (O'Neill 2016) (Analysis 1.14).
2. Measures of exercise capacity
None of the trials reported on this outcome.
3. Mortality
No trial reported this outcome.
4. Other pulmonary parameters
a. FEF25‐75
One trial provided FEF25‐75 data as % predicted for 13 participants (O'Neill 2016) There was no significant difference between the groups (Analysis 1.15).
e. FRC
One trial (13 participants) provided data on FRC immediately after the treatment and 90 minutes later (O'Neill 2016). There was no significant difference between the groups immediately after the treatment (Analysis 1.16) or at 90 minutes (Analysis 1.17).
f. LCI
One trial provided data on LCI immediately after the treatment and 90 minutes later (O'Neill 2016). There was no significant difference between the groups immediately after the treatment (Analysis 1.18) or at 90 minutes (low‐certainty evidence) (Analysis 1.19).
No trial reported any of the other pulmonary parameters listed in the protocol.
5. Frequency of exacerbations of respiratory infection
No trial reported this outcome.
6. Adherence to inhaled therapies, airway clearance techniques, and other therapies
There was 100% compliance with all the single doses of each treatment under supervision in all trials (Dentice 2012; O'Neill 2016; Van Ginderdeuren 2011).
7. Adverse effects such as bronchospasm, cough and acute decline in pulmonary function
There were no adverse events in any trial (Dentice 2012; Van Ginderdeuren 2011; O'Neill 2016).
Inhalation before versus after airway clearance techniques
One trial with 50 participants contributed data to this comparison (Dentice 2012).
Primary outcomes
1. Lung function (absolute change and change in per cent predicted if possible, otherwise final values)
a. FEV1
The change in FEV1 from immediately before a treatment to two hours later was not significantly influenced by whether hypertonic saline was inhaled before or after airway clearance techniques, whether analysed using data in litres (Analysis 2.1) or % predicted (low‐certainty evidence) (Analysis 2.2).
b. FVC
The change in FVC from immediately before a treatment to two hours later was not significantly influenced by whether hypertonic saline was inhaled before or after airway clearance techniques, whether analysed using data in litres (Analysis 2.3) or % predicted (low‐certainty evidence) (Analysis 2.4).
2. Patient‐reported outcomes
a. QoL
The trial did not report this outcome.
b. Symptom scores
Perceived efficacy (i.e. ease of clearance) was rated statistically significantly better when hypertonic saline was inhaled before versus after airway clearance techniques, MD 10.62 mm (95% CI 2.54 to 18.70) (low‐certainty evidence) (Analysis 2.5)
Tolerability was not rated significantly differently when hypertonic saline was inhaled before versus after airway clearance techniques (low‐certainty evidence) (Analysis 2.6).
Satisfaction was rated significantly better when hypertonic saline was inhaled before versus after airway clearance techniques, MD 20.38 mm (95% CI 12.10 to 28.66) (low‐certainty evidence) (Analysis 2.7).
Secondary outcomes
1. Measures of sputum clearance
The trial did not report this outcome.
2. Measures of exercise capacity
The trial did not report this outcome.
3. Mortality
The trial did not report this outcome.
4. Other pulmonary parameters
The trial did not report this outcome.
5. Frequency of exacerbations of respiratory infection
The trial did not report this outcome.
6. Adherence to inhaled therapies, airway clearance techniques, and other therapies
There was 100% compliance with all the single doses of each treatment.
7. Adverse effects such as bronchospasm, cough and acute decline in pulmonary function
There were no adverse events in the trial.
Inhalation during versus after airway clearance techniques
One trial with 50 participants contributed data to this comparison (Dentice 2012).
Primary outcomes
1. Lung function
a. FEV1
The change in FEV1 from immediately before a treatment to two hours later was not significantly influenced by whether hypertonic saline was inhaled before or after airway clearance techniques, whether analysed using data in litres (low‐certainty evidence) (Analysis 3.1) or % predicted (Analysis 3.2).
b. FVC
The change in FVC from immediately before a treatment to two hours later was not significantly influenced by whether hypertonic saline was inhaled before or after airway clearance techniques, whether analysed using data in litres (low‐certainty evidence) (Analysis 3.3) or % predicted (Analysis 3.4).
2. Patient‐reported outcomes
a. QoL
The trial dd not report this outcome.
b. Symptom scores
Perceived efficacy (i.e. ease of clearance) was rated significantly better when hypertonic saline was inhaled during versus after airway clearance techniques, MD 15.60 mm (95% CI 17.55 to 23.65) (low‐certainty evidence) (Analysis 3.5).
Tolerability was not rated significantly differently when hypertonic saline was inhaled during versus after airway clearance techniques (low‐certainty evidence) (Analysis 3.6).
Satisfaction was rated significantly better when hypertonic saline was inhaled during versus after airway clearance techniques, MD 14.80 mm (95% CI 5.70 to 23.90) (low‐certainty evidence) (Analysis 3.7).
Secondary outcomes
1. Measures of sputum clearance
The trial did not report this outcome.
2. Measures of exercise capacity
The trial did not report this outcome.
3. Mortality
The trial did not report this outcome.
4. Other pulmonary parameters
The trial did not report this outcome.
5. Frequency of exacerbations of respiratory infection
The trial did not report this outcome.
6. Adherence to inhaled therapies, airway clearance techniques, and other therapies
There was 100% compliance with all the single doses of each treatment.
7. Adverse effects such as bronchospasm, cough and acute decline in pulmonary function
There were no adverse events in the trial.
Morning versus evening inhalation
No trial reported on this comparison.
Discussion
Summary of main results
The searches identified 51 studies, of which three studies were eligible for inclusion ‐ providing data for 77 participants. All studies used a cross‐over design. Intervention periods were short, so the overnight washout periods were probably appropriate. One trial provided three treatments in one day for each arm of the trial (Dentice 2012). The other two trials provided a single treatment for each arm of the trial on separate days (Van Ginderdeuren 2011; O'Neill 2016).
There were no clinically important differences between the timing regimens of before, during or after airway clearance techniques in the mean amount of improvement in lung function, with the between‐group comparisons being non‐significant (Dentice 2012; O'Neill 2016).
There were little or no differences in symptom scores when the timing regimens of before or during airway clearance techniques were compared. Outcomes included cough, dyspnoea, tolerability, ease of clearance and overall satisfaction (Dentice 2012; O'Neill 2016; Van Ginderdeuren 2011). Ease of sputum clearance and overall satisfaction were also estimated by the treating physiotherapist in one trial, but there were little or no differences between the timing regimens (O'Neill 2016).
Perceived efficacy was between 10 and 20 mm lower on a 100‐mm scale when hypertonic saline was inhaled after physical airway clearance techniques, as opposed to before or during the techniques (Dentice 2012). Satisfaction with the entire treatment regimen may be lower when hypertonic saline was inhaled after physical airway clearance techniques, as opposed to before or during the techniques (Dentice 2012).
Additional outcomes for the before versus during timing comparison, which included wet weight of sputum (during and 24hours following), FEF25‐75, FRC (immediately and 90 minutes post), LCI (immediately and 90 minutes post), showed there may be little or no difference between these timing regimens (Dentice 2012; O'Neill 2016; Van Ginderdeuren 2011).
One trial achieved delivery of hypertonic saline during airway clearance by using an Acapella duet device, which combines a nebuliser in series with an oscillating PEP mechanism (O'Neill 2016). Devices such as this may introduce additional considerations. For example, the Acapella duet device substantially reduces the duration of treatment (O'Neill 2016), but it also substantially reduces the dose received by the patient (Berlinski 2014). These other issues were not included in the outcome measures of this systematic review, but clinicians should nevertheless consider these issues when deciding whether to use such a device to deliver hypertonic saline during airway clearance.
Overall completeness and applicability of evidence
No trials were found comparing morning versus evening inhalation of hypertonic saline. No trials were found in paediatric populations. Recommendations of the review are therefore limited to timing of inhalation in relation to airway clearance techniques in adults.
Quality of the evidence
The evidence for each outcome was rated as low according to the GRADE system, indicating that further research is very likely to have an important impact on our confidence in the estimates of effect and is likely to change the estimates. The GRADE result reflects two limitations of the included studies. The first issue is poor applicability, because studies included only adults so results are not applicable to children. The other issue is the lack of blinding. While it is often difficult for trials of physical interventions to achieve blinding, this was achieved in most of the trials in the Cochrane Review of timing of dornase alpha (Dentice 2018) using a double‐dummy method. It is disappointing that none of the included trials in the present review used this method to achieve blinding.
Agreements and disagreements with other studies or reviews
This 2019 review update identified an additional trial (O'Neill 2016), which shared outcome measures with the previous two eligible trials, permitting meta‐analysis for the before versus during timing comparison. One of the included studies did repeat the data collection on 14 participants within one year of doing the trial (Dentice 2012), with very similar results to the original data collected on the 50 participants.
The data identified by this review support the traditional approach of inhalation of hypertonic saline before airway clearance techniques, as has been used in previous studies demonstrating the efficacy of hypertonic saline for people with cystic fibrosis (Elkins 2006c; Eng 1996; Robinson 1996; Robinson 1997). However, the data also suggest that inhalation during airway clearance may be equally effective.
When advising about inhalation of hypertonic saline in relation to time of day, what issues might be considered in the absence of direct comparisons of different timing regimens of hypertonic saline? The trials demonstrating the efficacy of regular hypertonic saline have prescribed at least two doses per day (Donaldson 2006; Elkins 2006c; Eng 1996). The effect of single daily dosing on clinical outcomes is not known. Several studies suggest that as the dose of salt received is reduced, there is a reduction in hypertonic saline's effect on sputum rheology (King 1997; Wills 1997), mucociliary clearance (Robinson 1997), and perhaps some clinical outcomes (Elkins 2006d). Therefore, individuals should be encouraged to take doses twice daily if tolerated; however, for those who only tolerate one dose per day and elect to pursue this regimen, a choice about diurnal timing must be made. In the absence of a randomised comparison of morning versus evening inhalation, individual factors such as convenience, compliance, and tolerability could be considered. For example, if an individual has a hectic morning schedule and spare time after their day's activities, evening inhalation may be more convenient. Conversely, if individuals note increased nocturnal coughing and sleep disturbance with evening inhalation, morning inhalation may be better tolerated.

Risk of bias graph: review authors' judgements about each risk of bias item presented as percentages across all included studies.

Risk of bias summary: review authors' judgements about each risk of bias item for each included study.

Comparison 1 Inhalation before versus during airway clearance techniques, Outcome 1 FEV1 (L).

Comparison 1 Inhalation before versus during airway clearance techniques, Outcome 2 FEV1 (% pred).

Comparison 1 Inhalation before versus during airway clearance techniques, Outcome 3 FVC (L).

Comparison 1 Inhalation before versus during airway clearance techniques, Outcome 4 FVC (% pred).
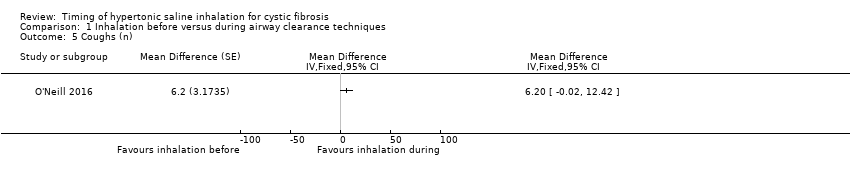
Comparison 1 Inhalation before versus during airway clearance techniques, Outcome 5 Coughs (n).

Comparison 1 Inhalation before versus during airway clearance techniques, Outcome 6 Dyspnoea (mm).

Comparison 1 Inhalation before versus during airway clearance techniques, Outcome 7 Tolerability (mm).
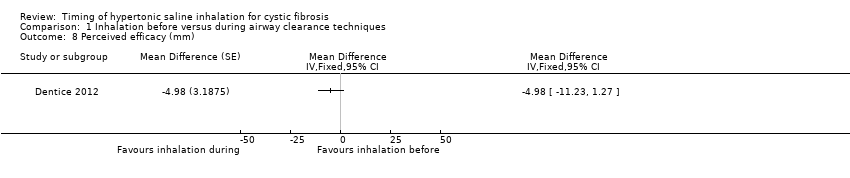
Comparison 1 Inhalation before versus during airway clearance techniques, Outcome 8 Perceived efficacy (mm).
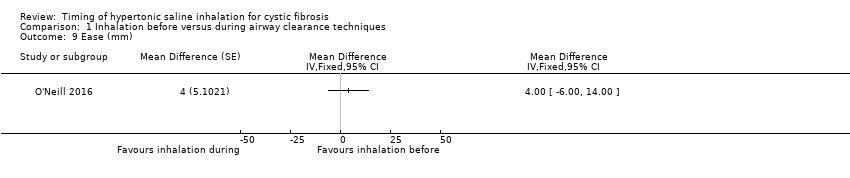
Comparison 1 Inhalation before versus during airway clearance techniques, Outcome 9 Ease (mm).

Comparison 1 Inhalation before versus during airway clearance techniques, Outcome 10 Ease rated by therapist (mm).
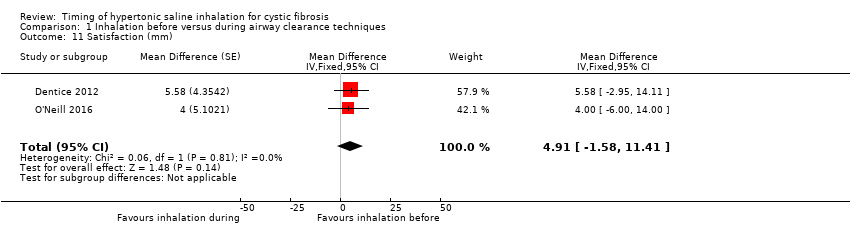
Comparison 1 Inhalation before versus during airway clearance techniques, Outcome 11 Satisfaction (mm).
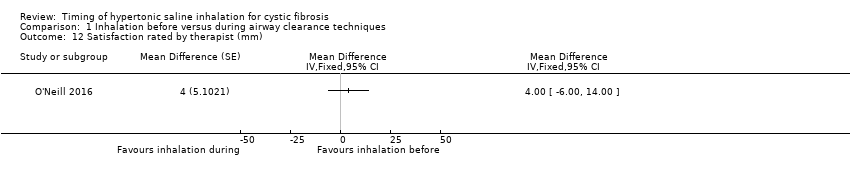
Comparison 1 Inhalation before versus during airway clearance techniques, Outcome 12 Satisfaction rated by therapist (mm).

Comparison 1 Inhalation before versus during airway clearance techniques, Outcome 13 Sputum wet weight immediately (g).
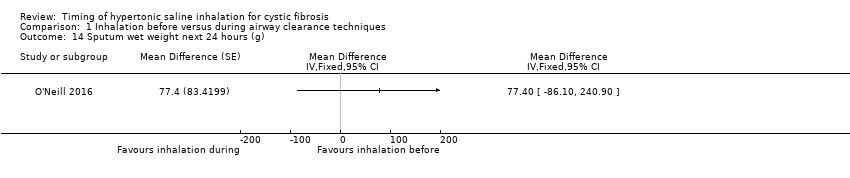
Comparison 1 Inhalation before versus during airway clearance techniques, Outcome 14 Sputum wet weight next 24 hours (g).
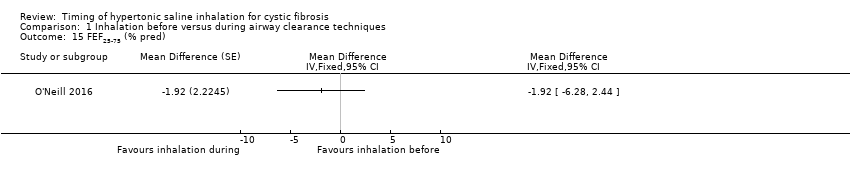
Comparison 1 Inhalation before versus during airway clearance techniques, Outcome 15 FEF25‐75 (% pred).

Comparison 1 Inhalation before versus during airway clearance techniques, Outcome 16 FRC immediately (L).

Comparison 1 Inhalation before versus during airway clearance techniques, Outcome 17 FRC at 90 min (L).

Comparison 1 Inhalation before versus during airway clearance techniques, Outcome 18 LCI immediately.

Comparison 1 Inhalation before versus during airway clearance techniques, Outcome 19 LCI at 90 min.

Comparison 2 Inhalation before versus after airway clearance techniques, Outcome 1 FEV1 (L).

Comparison 2 Inhalation before versus after airway clearance techniques, Outcome 2 FEV1 (% pred).

Comparison 2 Inhalation before versus after airway clearance techniques, Outcome 3 FVC (L).

Comparison 2 Inhalation before versus after airway clearance techniques, Outcome 4 FVC (% pred).

Comparison 2 Inhalation before versus after airway clearance techniques, Outcome 5 Perceived efficacy (mm).

Comparison 2 Inhalation before versus after airway clearance techniques, Outcome 6 Tolerability (mm).
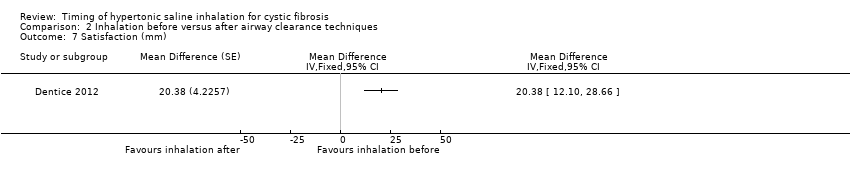
Comparison 2 Inhalation before versus after airway clearance techniques, Outcome 7 Satisfaction (mm).

Comparison 3 Inhalation during versus after airway clearance techniques, Outcome 1 FEV1 (L).

Comparison 3 Inhalation during versus after airway clearance techniques, Outcome 2 FEV1 (% pred).

Comparison 3 Inhalation during versus after airway clearance techniques, Outcome 3 FVC (L).

Comparison 3 Inhalation during versus after airway clearance techniques, Outcome 4 FVC (% pred).

Comparison 3 Inhalation during versus after airway clearance techniques, Outcome 5 Perceived efficacy (mm).

Comparison 3 Inhalation during versus after airway clearance techniques, Outcome 6 Tolerability (mm).

Comparison 3 Inhalation during versus after airway clearance techniques, Outcome 7 Satisfaction (mm).
| Inhalation before compared with during airway clearance techniques for cystic fibrosis | ||||||
| Patient or population: adults and children with cystic fibrosis Settings: outpatients Intervention: inhalation before airway clearance techniques Comparison: inhalation during airway clearance techniques | ||||||
| Outcomes | Illustrative comparative risks* (95% CI) | Relative effect | No of Participants | Certainty of the evidence | Comments | |
| Assumed risk | Corresponding risk | |||||
| Inhalation during airway clearance techniques | Inhalation before airway clearance techniques | |||||
| FEV1 % predicted Follow‐up: before treatment to ˜2 hours later | Not reported1 | The mean FEV1 (% predicted) was 0.56% higher (0.48% lower to 1.60% higher) in the inhalation before airway clearance techniques. | NA | 63 (2 studies) | ⊕⊕⊖⊖ low2,3 | FEV1 (L) also showed no statistically significant difference between groups. Participants received both inhalation approaches as cross‐over design. |
| FVC % predicted Follow‐up: before treatment to 2 hours later | Not reported1 | The mean FVC (% predicted) was 2.09% higher (0.08% higher to 4.11% higher) in the inhalation before airway clearance techniques. | NA | 50 (1 study) | ⊕⊕⊖⊖ low2,3 | FEV1 (L) showed no statistically significant difference between groups. Participants received both inhalation approaches as cross‐over design. |
| QoL | Outcome not reported. | NA | NA | NA | ||
| Symptom scores | See comments. | NA | 76 (3 studies) | ⊕⊕⊖⊖ low2,3 | All of the symptom scores suggest no statistically significant difference between the groups. This outcome includes a range of symptom scores from many different studies but number of participants contributing to each symptom score varies. | |
| Measures of sputum clearance: sputum wet weight immediately (g) | Not reported1 | The mean wet weight of sputum during the application of the intervention was 0.26 g lower (4.79 g lower to 4.27 g higher) in the inhalation before airway clearance techniques. | NA | 26 (2 studies) | ⊕⊕⊖⊖ low2,3 | The mean wet weight of sputum for the 24 hours following treatment suggests no statistically significant difference between the groups. Participants received both inhalation approaches as cross‐over design. |
| LCI Follow‐up: 90 minutes later | Not reported1 | The mean LCI was 0.02 lower (0.63 lower to 0.59 higher) in the inhalation before airway clearance techniques. | NA | 13 (1 study) | ⊕⊕⊖⊖ low2,3 | The mean LCI immediately after treatment suggests no statistically significant difference between the groups. Participants received both inhalation approaches as cross‐over design. |
| Adverse events | Outcome not reported. | NA | NA | NA | ||
| *The basis for the assumed risk (e.g. the median control group risk across studies) is provided in footnotes. The corresponding risk (and its 95% confidence interval) is based on the assumed risk in the comparison group and the relative effect of the intervention (and its 95% CI). | ||||||
| GRADE Working Group grades of evidence | ||||||
| 1. Only differences between inhalation before and during airway clearance techniques were presented, results within the inhalation during airway clearance techniques were not presented therefore an assumed risk cannot be calculated. 2. Downgraded once due to high risk due to lack of blinding of participants and personnel. 3. Downgraded once for lack of applicability as studies included only adults so results are not applicable to children. | ||||||
| Inhalation before compared with after airway clearance techniques for cystic fibrosis | ||||||
| Patient or population: adults and children with cystic fibrosis Settings: outpatients Intervention: inhalation before airway clearance techniques Comparison: inhalation after airway clearance techniques | ||||||
| Outcomes | Illustrative comparative risks* (95% CI) | Relative effect | No of Participants | Certainty of the evidence | Comments | |
| Assumed risk | Corresponding risk | |||||
| Inhalation after airway clearance techniques | Inhalation before airway clearance techniques | |||||
| FEV1 % predicted Follow‐up: before treatment to 2 hours later | Not reported1 | The mean FEV1 (% predicted) was 0.75% higher (0.45% lower to 1.95% higher) in the inhalation before airway clearance techniques. | NA | 50 (1 study) | ⊕⊕⊖⊖ low2,3 | FEV1 (L) also showed no statistically significant difference between groups. Participants received both inhalation approaches as cross‐over design. |
| FVC % predicted Follow‐up: before treatment to 2 hours later | Not reported1 | The mean FVC (% predicted) was 1.66% higher (1.42% lower to 4.74% higher) in the inhalation before airway clearance techniques. | NA | 50 (1 study) | ⊕⊕⊖⊖ low2,3 | FVC (L) showed no statistically significant difference between groups. Participants received both inhalation approaches as cross‐over design. |
| QoL | Outcome not reported. | NA | NA | NA | ||
| Symptom scores | See comments. | NA | 50 (1 study) | ⊕⊕⊖⊖ low2,3 | Three symptom scores have been presented: Perceived efficacy shows a statistically significant difference in favour of inhalation before airway clearance techniques (MD 10.62; 95% CI 2.54 to 18.70) Tolerability showed no statistically significant difference between groups. Satisfaction shows a statistically significant difference in favour of inhalation before airway clearance techniques, MD 20.38 (95% CI 12.10 to 28.66) | |
| Measures of sputum clearance | Outcome not reported. | NA | NA | NA | ||
| LCI | Outcome not reported | NA | NA | NA | ||
| Adverse events | Outcome not reported | NA | NA | NA | ||
| *The basis for the assumed risk (e.g. the median control group risk across studies) is provided in footnotes. The corresponding risk (and its 95% CI) is based on the assumed risk in the comparison group and the relative effect of the intervention (and its 95% CI). | ||||||
| GRADE Working Group grades of evidence | ||||||
| 1. Only differences between inhalation before and during airway clearance techniques were presented, results within the inhalation during airway clearance techniques were not presented therefore an assumed risk cannot be calculated. 2. Downgraded once due to high risk due to lack of blinding of participants and personnel. 3. Downgraded once for lack of applicability as studies included only adults so results are not applicable to children. | ||||||
| Inhalation during compared with after airway clearance techniques for cystic fibrosis | ||||||
| Patient or population: adults and children with cystic fibrosis Settings: outpatients Intervention: inhalation during airway clearance techniques Comparison: Inhalation after airway clearance techniques | ||||||
| Outcomes | Illustrative comparative risks* (95% CI) | Relative effect | No of Participants | Certainty of the evidence | Comments | |
| Assumed risk | Corresponding risk | |||||
| Inhalation after airway clearance techniques | Inhalation during airway clearance techniques | |||||
| FEV1 % predicted Follow‐up: before treatment to 2 hours later | Not reported1 | The mean FEV1 (% predicted) was 0.03% lower (1.19% lower to 1.12% higher) in the inhalation during airway clearance techniques. | NA | 50 (1 study) | ⊕⊕⊖⊖ low2,3 | FEV1 (L) also showed no statistically significant difference between groups. Participants received both inhalation approaches as cross‐over design. |
| FVC % predicted Follow‐up: before treatment to 2 hours later | Not reported1 | The mean FVC (% predicted) was 0.44% lower (3.34% lower to 2.46% higher) in the inhalation during airway clearance techniques. | NA | 50 (1 study) | ⊕⊕⊖⊖ low2,3 | FVC (L) also showed no statistically significant difference between groups. Participants received both inhalation approaches as cross‐over design. |
| QoL | Outcome not reported. | NA | NA | NA | ||
| Symptom scores | See comments. | NA | 50 (1 study) | ⊕⊕⊖⊖ low2,3 | Three symptom scores have been presented: Perceived efficacy shows a statistically significant difference in favour of inhalation during airway clearance techniques, MD 15.60 (95% CI 7.55 to 23.65) Tolerability showed no statistically significant difference between groups. Satisfaction shows a statistically significant difference in favour of inhalation during airway clearance techniques, MD 14.80 (95% CI 5.70 to 23.90) | |
| Measures of sputum clearance | Outcome not reported. | NA | NA | NA | ||
| LCI | Outcome not reported. | NA | NA | NA | ||
| Adverse events | Outcome not reported. | NA | NA | NA | ||
| *The basis for the assumed risk (e.g. the median control group risk across studies) is provided in footnotes. The corresponding risk (and its 95% CI) is based on the assumed risk in the comparison group and the relative effect of the intervention (and its 95% CI). | ||||||
| GRADE Working Group grades of evidence | ||||||
| 1. Only differences between inhalation before and during airway clearance techniques were presented, results within the inhalation during airway clearance techniques were not presented therefore an assumed risk cannot be calculated. 2. Downgraded once due to high risk due to lack of blinding of participants and personnel. 3. Downgraded once for lack of applicability as studies included only adults so results are not applicable to children. | ||||||
| Outcome or subgroup title | No. of studies | No. of participants | Statistical method | Effect size |
| 1 FEV1 (L) Show forest plot | 1 | Mean Difference (Fixed, 95% CI) | Totals not selected | |
| 2 FEV1 (% pred) Show forest plot | 2 | Mean Difference (Fixed, 95% CI) | 0.56 [‐0.48, 1.60] | |
| 3 FVC (L) Show forest plot | 1 | Mean Difference (Fixed, 95% CI) | Totals not selected | |
| 4 FVC (% pred) Show forest plot | 1 | Mean Difference (Fixed, 95% CI) | Totals not selected | |
| 5 Coughs (n) Show forest plot | 1 | Mean Difference (Fixed, 95% CI) | Totals not selected | |
| 6 Dyspnoea (mm) Show forest plot | 1 | Mean Difference (Fixed, 95% CI) | Totals not selected | |
| 7 Tolerability (mm) Show forest plot | 1 | Mean Difference (Fixed, 95% CI) | Totals not selected | |
| 8 Perceived efficacy (mm) Show forest plot | 1 | Mean Difference (Fixed, 95% CI) | Totals not selected | |
| 9 Ease (mm) Show forest plot | 1 | Mean Difference (Fixed, 95% CI) | Totals not selected | |
| 10 Ease rated by therapist (mm) Show forest plot | 1 | Mean Difference (Fixed, 95% CI) | Totals not selected | |
| 11 Satisfaction (mm) Show forest plot | 2 | Mean Difference (Fixed, 95% CI) | 4.91 [‐1.58, 11.41] | |
| 12 Satisfaction rated by therapist (mm) Show forest plot | 1 | Mean Difference (Fixed, 95% CI) | Totals not selected | |
| 13 Sputum wet weight immediately (g) Show forest plot | 2 | Mean Difference (Fixed, 95% CI) | ‐0.26 [‐4.79, 4.27] | |
| 14 Sputum wet weight next 24 hours (g) Show forest plot | 1 | Mean Difference (Fixed, 95% CI) | Totals not selected | |
| 15 FEF25‐75 (% pred) Show forest plot | 1 | Mean Difference (Fixed, 95% CI) | Totals not selected | |
| 16 FRC immediately (L) Show forest plot | 1 | Mean Difference (Fixed, 95% CI) | Totals not selected | |
| 17 FRC at 90 min (L) Show forest plot | 1 | Mean Difference (Fixed, 95% CI) | Totals not selected | |
| 18 LCI immediately Show forest plot | 1 | Mean Difference (Fixed, 95% CI) | Totals not selected | |
| 19 LCI at 90 min Show forest plot | 1 | Mean Difference (Fixed, 95% CI) | Totals not selected | |
| Outcome or subgroup title | No. of studies | No. of participants | Statistical method | Effect size |
| 1 FEV1 (L) Show forest plot | 1 | Mean Difference (Fixed, 95% CI) | Totals not selected | |
| 2 FEV1 (% pred) Show forest plot | 1 | Mean Difference (Fixed, 95% CI) | Totals not selected | |
| 3 FVC (L) Show forest plot | 1 | Mean Difference (Fixed, 95% CI) | Totals not selected | |
| 4 FVC (% pred) Show forest plot | 1 | Mean Difference (Fixed, 95% CI) | Totals not selected | |
| 5 Perceived efficacy (mm) Show forest plot | 1 | Mean Difference (Fixed, 95% CI) | Totals not selected | |
| 6 Tolerability (mm) Show forest plot | 1 | Mean Difference (Fixed, 95% CI) | Totals not selected | |
| 7 Satisfaction (mm) Show forest plot | 1 | Mean Difference (Fixed, 95% CI) | Totals not selected | |