| 1 Mortality Show forest plot | 4 | | Risk Ratio (M‐H, Fixed, 95% CI) | Subtotals only |
|
| 1.1 Aprotinin versus control | 1 | 37 | Risk Ratio (M‐H, Fixed, 95% CI) | 1.18 [0.18, 7.48] |
| 1.2 Tranexamic acid versus control | 1 | 217 | Risk Ratio (M‐H, Fixed, 95% CI) | 0.0 [0.0, 0.0] |
| 1.3 Recombinant VIIa (rFVIIa) high dose (80 to 100 mcg/kg) versus control | 2 | 272 | Risk Ratio (M‐H, Fixed, 95% CI) | 0.79 [0.18, 3.51] |
| 1.4 Recombinant VIIa (rFVIIa) low dose (20 to 50 mcg/kg) versus control | 2 | 273 | Risk Ratio (M‐H, Fixed, 95% CI) | 1.59 [0.43, 5.89] |
| 1.5 Recombinant VIIa (rFVIIa) high dose (80 to 100 mcg/kg) versus low dose (20 to 50 mcg/kg) | 2 | 267 | Risk Ratio (M‐H, Fixed, 95% CI) | 0.46 [0.10, 2.08] |
| 2 Survival Show forest plot | | | Other data | No numeric data |
|
| 2.1 Aprotinin versus control | | | Other data | No numeric data |
| 3 Liver failure Show forest plot | | | Other data | No numeric data |
|
| 3.1 Antithrombin III versus control | | | Other data | No numeric data |
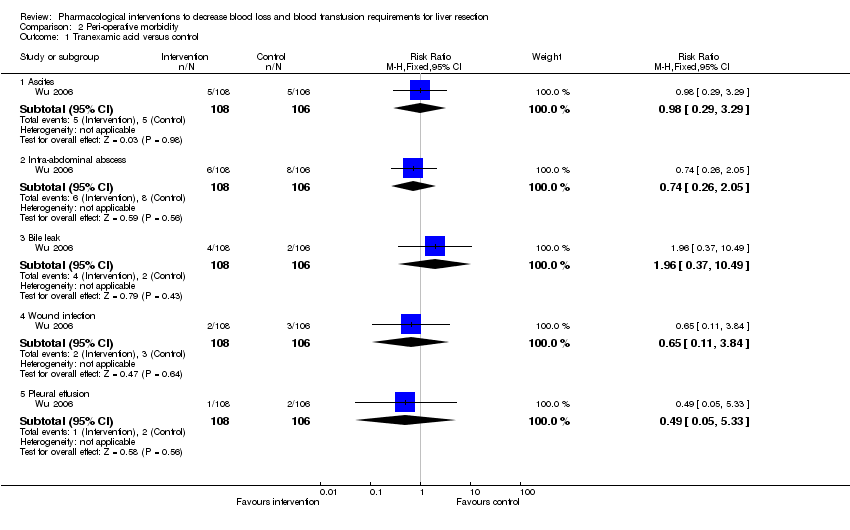
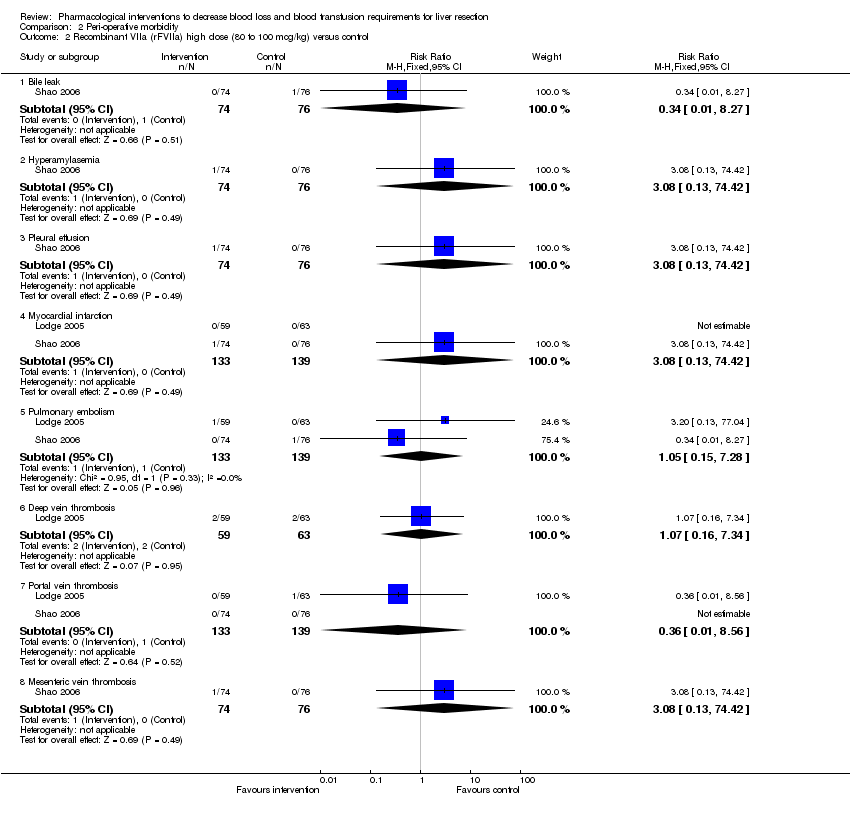
| 4 Peri‐operative morbidity | | | Other data | No numeric data |
| 4.1 See analysis 2 | | | Other data | No numeric data |
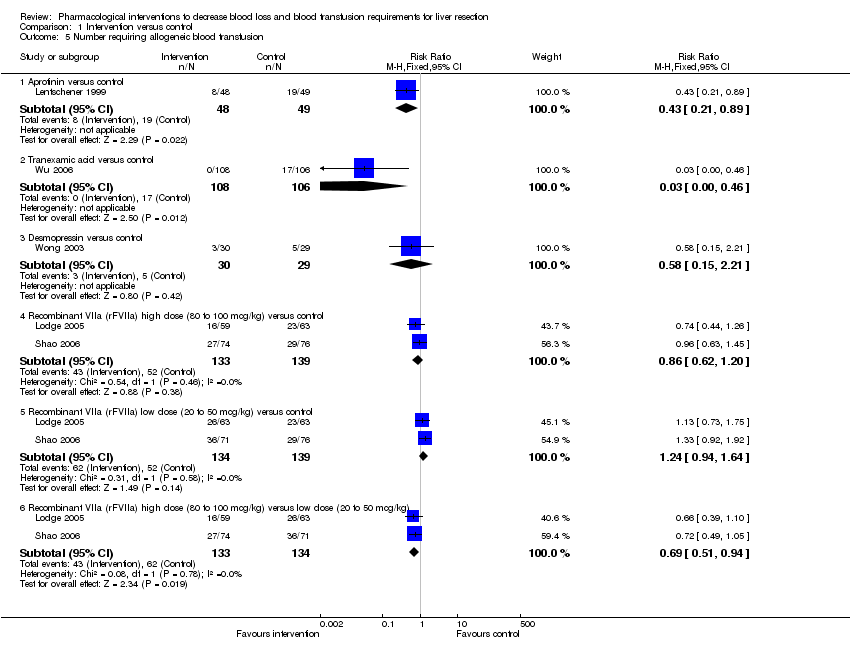
| 5 Number requiring allogeneic blood transfusion Show forest plot | 5 | | Risk Ratio (M‐H, Fixed, 95% CI) | Subtotals only |
|
| 5.1 Aprotinin versus control | 1 | 97 | Risk Ratio (M‐H, Fixed, 95% CI) | 0.43 [0.21, 0.89] |
| 5.2 Tranexamic acid versus control | 1 | 214 | Risk Ratio (M‐H, Fixed, 95% CI) | 0.03 [0.00, 0.46] |
| 5.3 Desmopressin versus control | 1 | 59 | Risk Ratio (M‐H, Fixed, 95% CI) | 0.58 [0.15, 2.21] |
| 5.4 Recombinant VIIa (rFVIIa) high dose (80 to 100 mcg/kg) versus control | 2 | 272 | Risk Ratio (M‐H, Fixed, 95% CI) | 0.86 [0.62, 1.20] |
| 5.5 Recombinant VIIa (rFVIIa) low dose (20 to 50 mcg/kg) versus control | 2 | 273 | Risk Ratio (M‐H, Fixed, 95% CI) | 1.24 [0.94, 1.64] |
| 5.6 Recombinant VIIa (rFVIIa) high dose (80 to 100 mcg/kg) versus low dose (20 to 50 mcg/kg) | 2 | 267 | Risk Ratio (M‐H, Fixed, 95% CI) | 0.69 [0.51, 0.94] |
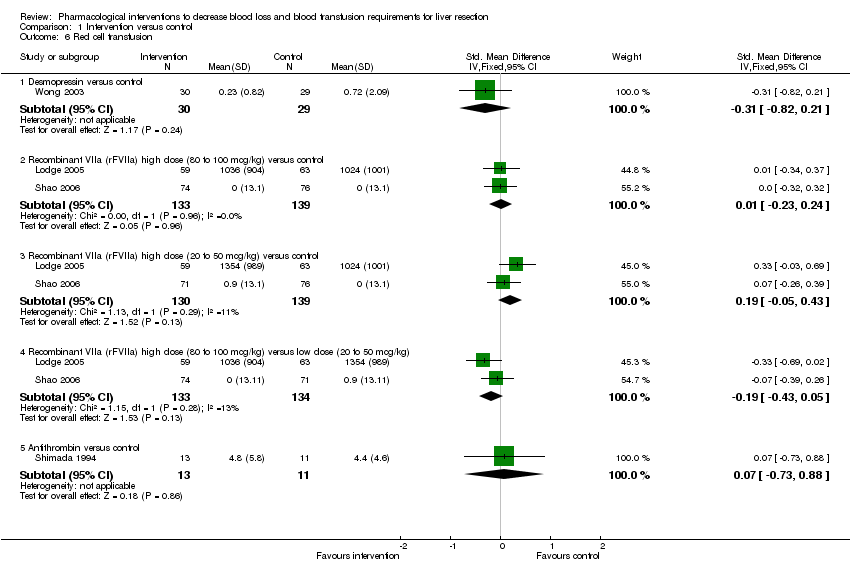
| 6 Red cell transfusion Show forest plot | 4 | | Std. Mean Difference (IV, Fixed, 95% CI) | Subtotals only |
|
| 6.1 Desmopressin versus control | 1 | 59 | Std. Mean Difference (IV, Fixed, 95% CI) | ‐0.31 [‐0.82, 0.21] |
| 6.2 Recombinant VIIa (rFVIIa) high dose (80 to 100 mcg/kg) versus control | 2 | 272 | Std. Mean Difference (IV, Fixed, 95% CI) | 0.01 [‐0.23, 0.24] |
| 6.3 Recombinant VIIa (rFVIIa) high dose (20 to 50 mcg/kg) versus control | 2 | 269 | Std. Mean Difference (IV, Fixed, 95% CI) | 0.19 [‐0.05, 0.43] |
| 6.4 Recombinant VIIa (rFVIIa) high dose (80 to 100 mcg/kg) versus low dose (20 to 50 mcg/kg) | 2 | 267 | Std. Mean Difference (IV, Fixed, 95% CI) | ‐0.19 [‐0.43, 0.05] |
| 6.5 Antithrombin versus control | 1 | 24 | Std. Mean Difference (IV, Fixed, 95% CI) | 0.07 [‐0.73, 0.88] |
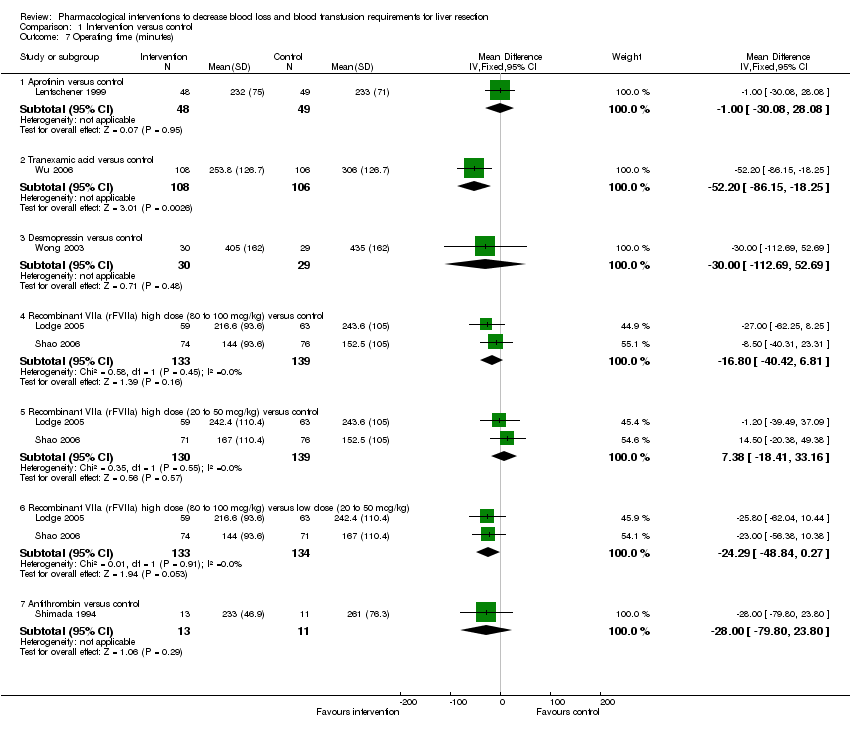
| 7 Operating time (minutes) Show forest plot | 6 | | Mean Difference (IV, Fixed, 95% CI) | Subtotals only |
|
| 7.1 Aprotinin versus control | 1 | 97 | Mean Difference (IV, Fixed, 95% CI) | ‐1.0 [‐30.08, 28.08] |
| 7.2 Tranexamic acid versus control | 1 | 214 | Mean Difference (IV, Fixed, 95% CI) | ‐52.20 [‐86.15, ‐18.25] |
| 7.3 Desmopressin versus control | 1 | 59 | Mean Difference (IV, Fixed, 95% CI) | ‐30.0 [‐112.69, 52.69] |
| 7.4 Recombinant VIIa (rFVIIa) high dose (80 to 100 mcg/kg) versus control | 2 | 272 | Mean Difference (IV, Fixed, 95% CI) | ‐16.80 [‐40.42, 6.81] |
| 7.5 Recombinant VIIa (rFVIIa) high dose (20 to 50 mcg/kg) versus control | 2 | 269 | Mean Difference (IV, Fixed, 95% CI) | 7.38 [‐18.41, 33.16] |
| 7.6 Recombinant VIIa (rFVIIa) high dose (80 to 100 mcg/kg) versus low dose (20 to 50 mcg/kg) | 2 | 267 | Mean Difference (IV, Fixed, 95% CI) | ‐24.29 [‐48.84, 0.27] |
| 7.7 Antithrombin versus control | 1 | 24 | Mean Difference (IV, Fixed, 95% CI) | ‐28.0 [‐79.80, 23.80] |
| 8 Hospital stay (days) Show forest plot | | | Other data | No numeric data |
|
| 8.1 Tranexamic acid versus control | | | Other data | No numeric data |
| 9 Transection blood loss (ml) Show forest plot | 2 | | Mean Difference (IV, Fixed, 95% CI) | Subtotals only |
|
| 9.1 Tranexamic acid versus control | 1 | 214 | Mean Difference (IV, Fixed, 95% CI) | ‐260.0 [‐434.99, ‐85.01] |
| 9.2 Desmopressin versus control | 1 | 59 | Mean Difference (IV, Fixed, 95% CI) | ‐45.0 [‐626.86, 536.86] |
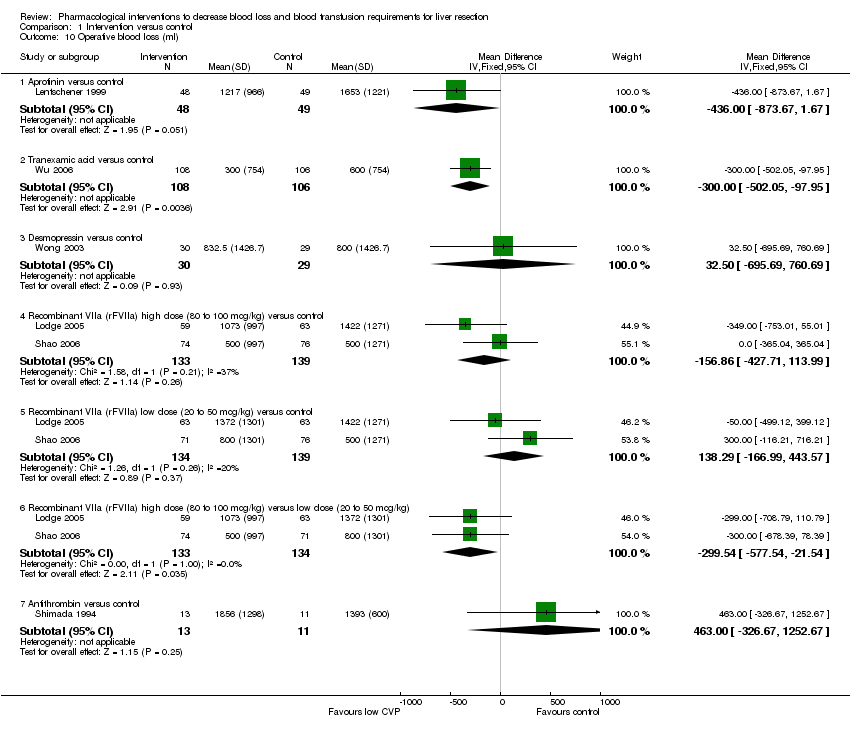
| 10 Operative blood loss (ml) Show forest plot | 6 | | Mean Difference (IV, Fixed, 95% CI) | Subtotals only |
|
| 10.1 Aprotinin versus control | 1 | 97 | Mean Difference (IV, Fixed, 95% CI) | ‐434.00 [‐873.67, 1.67] |
| 10.2 Tranexamic acid versus control | 1 | 214 | Mean Difference (IV, Fixed, 95% CI) | ‐300.0 [‐502.05, ‐97.95] |
| 10.3 Desmopressin versus control | 1 | 59 | Mean Difference (IV, Fixed, 95% CI) | 32.5 [‐695.69, 760.69] |
| 10.4 Recombinant VIIa (rFVIIa) high dose (80 to 100 mcg/kg) versus control | 2 | 272 | Mean Difference (IV, Fixed, 95% CI) | ‐156.86 [‐427.71, 113.99] |
| 10.5 Recombinant VIIa (rFVIIa) low dose (20 to 50 mcg/kg) versus control | 2 | 273 | Mean Difference (IV, Fixed, 95% CI) | 138.29 [‐166.99, 443.57] |
| 10.6 Recombinant VIIa (rFVIIa) high dose (80 to 100 mcg/kg) versus low dose (20 to 50 mcg/kg) | 2 | 267 | Mean Difference (IV, Fixed, 95% CI) | ‐299.54 [‐577.54, ‐21.54] |
| 10.7 Antithrombin versus control | 1 | 24 | Mean Difference (IV, Fixed, 95% CI) | 463.00 [‐326.67, 1252.67] |
| 11 Bilirubin (micromol/litre) Show forest plot | | | Other data | No numeric data |
|
| 11.1 Antithrombin III versus control | | | Other data | No numeric data |
| 12 Prothrombin activity (percentage of normal activity) Show forest plot | | | Other data | No numeric data |
|
| 12.1 Aprotinin versus control | | | Other data | No numeric data |
| 13 Aspartate transaminase (international units per litre) (peak) Show forest plot | | | Other data | No numeric data |
|
| 13.1 Antithrombin III versus control | | | Other data | No numeric data |
| 14 Alanine transminase (international units per litre) (peak) Show forest plot | | | Other data | No numeric data |
|
| 14.2 Antithrombin III versus control | | | Other data | No numeric data |