Métodos para reducir la pérdida sanguínea durante la resección hepática: un metanálisis en red
Resumen
Antecedentes
La resección hepática es una cirugía mayor con una mortalidad y morbilidad significativas. Los especialistas han estudiado diversos métodos para intentar limitar la pérdida sanguínea, la necesidad de trasfusión y la morbilidad durante la resección hepática electiva. Estos métodos incluyen enfoques diferentes (enfoque anterior versus convencional), uso de la donación de sangre autóloga, intervenciones cardiopulmonares como hipoventilación, presión venosa central baja, diferentes métodos de transección del parénquima, diferentes métodos de tratamiento de la superficie bruta del hígado, diferentes métodos de oclusión vascular y diferentes intervenciones farmacológicas. Habitualmente el cirujano utiliza sólo uno de los métodos de cada una de estas siete categorías. No se conoce el método óptimo para reducir la pérdida sanguínea y la necesidad de trasfusión en los pacientes sometidos a resección hepática.
Objetivos
Evaluar los efectos de diferentes intervenciones para la reducción de la pérdida sanguínea y la necesidad de transfusión sanguínea durante la resección hepática electiva.
Métodos de búsqueda
Se hicieron búsquedas en el Registro Cochrane Central de Ensayos Controlados (Cochrane Central Register of Controlled Trials) (CENTRAL), MEDLINE, EMBASE y en Science Citation Index Expanded hasta septiembre 2015 para identificar ensayos clínicos aleatorios. También se realizaron búsquedas en registros de ensayos y se hicieron búsquedas manuales en las listas de referencias de ensayos identificados.
Criterios de selección
Se incluyeron solamente los ensayos clínicos aleatorios (independientemente del idioma, el cegamiento o el estado de publicación) que compararon diferentes métodos de reducción de la pérdida sanguínea y la necesidad de transfusión sanguínea en pacientes sometidos a resección hepática.
Obtención y análisis de los datos
Dos autores de la revisión, de forma independiente, identificaron los ensayos y recopilaron los datos. Se evaluó el riesgo de sesgo mediante los dominios Cochrane. Se realizó un metanálisis de redes de Bayesian mediante el método de Markov Chain Monte Carlo en WinBUGS 1.4 de acuerdo a las guías de los documentos de la National Institute for Health and Care Excellence Decision Support Unit. Para los resultados binarios se calcularon los odds ratios (OR) con intervalos de confianza (IC) del 95%, las diferencias de medias (DM) con los IC del 95% para los resultados continuos, y los cocientes de tasas con los IC del 95% para los resultados de recuentos, y se utilizó el modelo de efectos fijos o el modelo de efectos aleatorios según fuera adecuado. Se evaluó la evidencia mediante GRADE.
Resultados principales
Se identificaron 67 ensayos clínicos aleatorios con un total de 6197 participantes. Todos los ensayos presentaron un alto riesgo de sesgo. Un total de 5771 participantes de 64 ensayos proporcionaron datos para uno o más resultados incluidos en esta revisión. No hubo pruebas de diferencias en la mayoría de las comparaciones y, cuando las hubo, estas diferencias fueron en ensayos únicos, principalmente con un tamaño pequeño de la muestra. A continuación se resumieron sólo las pruebas que estaban disponibles en más de un ensayo. De los resultados primarios, el único con pruebas de una diferencia a partir de más de un ensayo en la comparación pareada fue el número de eventos adversos (complicaciones), que fue mayor con el cauterizador de disección de radiofrecuencia que con el método de pinzamiento y trituración (cociente de tasas 1,85; IC del 95%: 1,07 a 3,26; 250 participantes; tres estudios; pruebas de muy baja calidad). Entre los resultados secundarios, las únicas diferencias que se encontraron a partir de más de un ensayo en la comparación pareada fueron las siguientes: la transfusión sanguínea (proporción) fue mayor en el grupo de presión central venosa baja que en el grupo de hemodilución normovolémica aguda más presión central venosa baja (OR 3,19; IC del 95%: 1,56 a 6,95; 208 participantes; dos estudios; pruebas de baja calidad); la cantidad de transfusión sanguínea (eritrocitos) fue inferior en el grupo de sellador de fibrina que en el grupo control (DM ‐0,53 unidades; IC del 95%: ‐1,00 a ‐0,07; 122 participantes; 2; pruebas de muy baja calidad); la cantidad de transfusión sanguínea (plasma fresco congelado) fue mayor en el grupo de celulosa oxidada que en el grupo de sellador de fibrina (DM 0,53 unidades; IC del 95%: 0,36 a 0,71; 80 participantes; dos estudios; pruebas de muy baja calidad); pérdida sanguínea (DM ‐0,34 l; IC del 95%: ‐0,46 a ‐0,22; 237 participantes; cuatro estudios; pruebas de muy baja calidad), la duración total de la estancia hospitalaria (DM ‐2,42 días; IC del 95%: ‐3,91 a ‐0,94; 197 participantes; tres estudios; pruebas de muy baja calidad) y el tiempo quirúrgico (DM ‐15,32 minutos; IC del 95%: ‐29,03 a ‐1,69; 192 participantes; cuatro estudios; pruebas de muy baja calidad) fueron inferiores con la presión venosa central baja que con el control. En las otras comparaciones las pruebas de diferencias se obtuvieron o se basaron en ensayos individuales pequeños o no hubo pruebas de diferencias. Ninguno de los ensayos informó la calidad de vida relacionada con la salud o el tiempo necesario para regresar al trabajo.
Conclusiones de los autores
La escasez de datos no permitió evaluar las suposiciones de transitividad e inconsistencia en la mayoría de los análisis. Cuando estuvieron disponibles las comparaciones directas e indirectas, el metanálisis en red proporcionó estimaciones adicionales del efecto en las comparaciones cuando no hubo comparaciones directas. Sin embargo, la escasez de datos reduce la confianza en los resultados del metanálisis en red. Pruebas de baja calidad indican que la resección hepática con cauterizador de disección de radiofrecuencia se puede asociar con más eventos adversos que el método de pinzamiento y trituración. Pruebas de baja calidad también indican que la proporción de pacientes que necesitan una transfusión sanguínea es mayor con la presión venosa central baja que con la hemodilución normovolémica aguda más presión venosa central baja; Pruebas de muy baja calidad indican que la cantidad de transfusión sanguínea (eritrocitos) fue inferior con el sellador de fibrina que con el control; la cantidad de transfusión sanguínea (plasma fresco congelado) fue mayor con la celulosa oxidada que con el sellador de fibrina; y la pérdida sanguínea, la duración total de la estancia hospitalaria y el tiempo quirúrgico fueron inferiores con la presión venosa central baja que con el control. No existen pruebas que indiquen que el uso de un equipo especial para la resección hepática sea beneficioso para la reducción de la mortalidad, la morbilidad o la necesidad de transfusión sanguínea (pruebas de muy baja calidad). El cauterizador de disección de radiofrecuencia no se debe utilizar fuera del contexto de ensayos clínicos ya que hay pruebas de baja calidad de un aumento en los efectos perjudiciales, sin pruebas de efectos beneficiosos. Además, se debe señalar que el tamaño de la muestra fue pequeño y los intervalos de confianza fueron amplios, por lo que no se pueden descartar efectos beneficiosos o perjudiciales considerables con un método específico de resección hepática.
PICO
Resumen en términos sencillos
Métodos quirúrgicos para reducir la pérdida sanguínea durante la cirugía hepática
Antecedentes
Muchos tumores cancerosos y no cancerosos que se desarrollan en el hígado son tratados mediante el retiro de parte del hígado (resección del hígado), una cirugía mayor con alto riesgo de complicaciones que incluye la pérdida sanguínea durante la división del tejido hepático. Los especialistas han estudiado varios métodos para reducir la pérdida sanguínea durante la resección hepática. Estos métodos incluyen reducir la presión en las venas hepáticas (presión venosa central baja) o reducir la cantidad de aire que entra y sale de los pulmones (hipoventilación), nuevamente con el objetivo de reducir la presión venosa central; diferentes maneras de cortar el hígado, por ejemplo, sin un equipo especial o con el uso de ondas ecográficas o de alta frecuencia (radiofrecuencia); la aplicación de cola para reducir la hemorragia de la superficie cortada; el bloqueo del suministro de sangre al hígado durante la cirugía, un proceso conocido como oclusión vascular, que podría realizarse de forma continua o intermitente. Además, se pueden proporcionar tratamientos médicos que mejoran la coagulación de la sangre para reducir la pérdida sanguínea. Habitualmente el cirujano utiliza uno o más métodos para reducir la pérdida sanguínea durante la cirugía hepática. Se desconoce el método óptimo. Se intentó identificar los mejores métodos de reducción de la pérdida sanguínea durante la cirugía hepática al realizar una búsqueda bibliográfica que incluyó todos los estudios informados hasta septiembre de 2015. Se utilizaron métodos estadísticos especiales, el denominado metanálisis en red, para considerar los diferentes tratamientos de forma simultánea en comparación con el método Cochrane tradicional de comparación de dos tratamientos a la vez, ya que existen múltiples estrategias terapéuticas.
Características de los estudios
Se identificaron 67 ensayos clínicos aleatorios con un total de 6197 participantes que cumplieron los criterios de inclusión. Sin embargo, sólo fue posible incluir a 5771 participantes de 64 ensayos ya que los investigadores no incluyeron a los participantes restantes en el análisis o no informaron los resultados de interés.
Fuente de financiación: 24 ensayos (35,8%) fueron financiados por organizaciones sin interés económico en obtener resultados positivos del tratamiento que se evaluaba. Los ensayos restantes recibieron financiamiento de organizaciones que obtendrían ganancias económicas con los resultados del estudio o no informaron el financiamiento.
Calidad de la evidencia
Todos los ensayos tuvieron alto riesgo de sesgo, o sea, los investigadores pueden haber sobrestimado los efectos beneficiosos o subestimado los efectos perjudiciales de un método o el otro debido a la forma en la que se realizaron los estudios. Muchos ensayos incluyeron pocos participantes, lo que hizo que aumentaran las probabilidades de establecer conclusiones equivocadas. La calidad general de las pruebas era baja o muy baja.
Resultados clave
No hubo pruebas de diferencias en la mayoría de las comparaciones y, cuando las hubo, estas diferencias fueron en ensayos únicos, principalmente con un tamaño pequeño de la muestra. Dichas pruebas son poco seguras. Por lo tanto, sólo se mencionan las pruebas que estuvieron disponibles en más de un ensayo. De los resultados primarios, el único sobre el que hubo pruebas de una diferencia fue el número de eventos adversos, que fue mayor con el cauterizador de disección de radiofrecuencia que con el método de pinzamiento y trituración. Entre los resultados secundarios, las únicas pruebas de diferencia fueron las siguientes:
Transfusión sanguínea (porcentaje): mayor en el grupo de presión central venosa baja que en el grupo de hemodilución normovolémica aguda (diluir la sangre al administrar líquidos durante la cirugía) más presión central venosa baja.
Cantidad de transfusión sanguínea: menor en el grupo de sellador de fibrina (un tipo de goma aplicada a la superficie cortada del hígado) que en el control.
Transfusión sanguínea (plasma fresco congelado [un componente de la sangre]): mayor en el grupo de celulosa oxidada (otro tipo de goma aplicada a la superficie cortada del hígado) que en el grupo de sellador de fibrina.
Pérdida sanguínea, duración total de la estancia hospitalaria y tiempo quirúrgico: menor en el grupo de presión central venosa baja que el control.
En las otras comparaciones, las pruebas de diferencias se basaron en ensayos individuales pequeños o no hubo pruebas de diferencias. Ninguno de los ensayos informó la calidad de vida relacionada con la salud o el tiempo necesario para regresar al trabajo. No existen pruebas que indiquen que el uso de un equipo especial para la resección hepática sea beneficioso.
Conclusiones de los autores
Summary of findings
| Methods to decrease blood loss during liver resection: a network meta‐analysis. Primary outcomes | |||||||
| Patient or population: people undergoing liver resection Settings: secondary or tertiary setting Intervention and control: various treatments Follow‐up: until discharge or 1 month (except for mortality (long‐term follow‐up) which was reported at 1 year | |||||||
| Outcomes | Anterior approach versus conventional approach | Autologous blood donation versus control | Cardiopulmonary interventions | Methods of parenchymal transection | Methods of dealing with cut surface | Methods of vascular occlusion | Pharmacological interventions |
| Treatments The first treatment listed is the control. The remaining are interventions. |
|
|
|
|
|
|
|
| Link for detailed 'Summary of Findings tables' | |||||||
| Mortality (perioperative) | There was no evidence of differences in perioperative mortality between the 2 groups. Quality of evidence = very low1,2,3. | There was no evidence of differences in perioperative mortality between the two groups. Quality of evidence = very low1,2,3. | There was no evidence of differences in perioperative mortality for any of the comparisons. Quality of evidence = very low1,2,3. | There was no evidence of differences in perioperative mortality for any of the comparisons. Quality of evidence = very low1,2,3. | There was no evidence of differences in perioperative mortality for any of the comparisons Quality of evidence = very low1,2,3. | There was no evidence of differences in perioperative mortality for any of the comparisons. Quality of evidence = very low1,2,3. | There was no evidence of differences in perioperative mortality for any of the comparisons. Quality of evidence = very low1,2,3. |
| Mortality (longest follow‐up) | None of the trials reported this outcome. | There was no evidence of differences in mortality at 1 year between the 2 groups. Quality of evidence = very low)1,2,3. | None of the trials reported this outcome. | None of the trials reported this outcome. | None of the trials reported this outcome. | None of the trials reported this outcome. | None of the trials reported this outcome. |
| Serious adverse events (proportion) | There was no evidence of differences in the proportion of participants experiencing serious adverse events between the 2 groups. Quality of evidence = very low1,2,3. | None of the trials reported this outcome. | There was no evidence of differences in the proportion of participants experiencing serious adverse events (for any of the comparisons Quality of evidence = very low1,2,3. | There was no evidence of differences in the proportion of participants experiencing serious adverse events for any of the comparisons Quality of evidence = very low1,2,3. | There was no evidence of differences in the proportion of participants experiencing serious adverse events for any of the comparisons Quality of evidence = very low1,2,3. | The proportion of participants experiencing serious adverse eventsa was lower in continuous selective portal triad clamping than continuous portal triad clamping
There was no evidence of differences in other comparisons. Quality of evidence = very low1,2,3 | There was no evidence of differences in the proportion of participants experiencing serious adverse events for any of the comparisons Quality of evidence = very low1,2,3. |
| Serious adverse events (number) | None of the trials reported this outcome. | None of the trials reported this outcome. | There was no evidence of differences in the number of serious adverse events for any of the comparisons Quality of evidence = very low1,2,3. | The number of serious adverse events was higher in radiofrequency dissecting sealer than clamp‐crush method.
There was no evidence of differences in other comparisons. Quality of evidence = very low1,2,3. | The number of serious adverse events was higher in fibrin sealant than argon beam.
There was no evidence of differences in other comparisons. Quality of evidence = very low1,2,3. | The number of serious adverse events was lower in intermittent portal triad clamping than continuous portal triad clamping.
There was no evidence of differences in other comparisons Quality of evidence = very low1,2,3. | There was no evidence of differences in the number of serious adverse events for any of the comparisons Quality of evidence = very low1,2,3. |
| Health‐related quality of life | None of the trials reported this outcome. | None of the trials reported this outcome. | None of the trials reported this outcome at any time point. | None of the trials reported this outcome at any time point. | None of the trials reported this outcome at any time point. | None of the trials reported this outcome at any time point. | None of the trials reported this outcome at any time point. |
| CrI: credible intervals; OR: odds ratio. | |||||||
| GRADE Working Group grades of evidence | |||||||
| 1 Risk of bias was unclear or high in the trial(s) (downgraded by 1 point). | |||||||
| Outcomes | Illustrative comparative risks* (95% CrI) | Relative effect (95% CrI) | No of participants | Quality of the evidence | |
| Assumed risk | Corresponding risk | ||||
| Control | Intervention | ||||
| Mortality (perioperative) | 76 per 1000 | 19 per 1000 | OR 0.23 | 185 | ⊕⊝⊝⊝ |
| Mortality (longest follow‐up) | None of the trials reported this outcome. | ||||
| Serious adverse events (proportion) | 125 per 1000 | 154 per 1000 | OR 1.27 | 65 | ⊕⊝⊝⊝ |
| Serious adverse events (number) | None of the trials reported this outcome. | ||||
| Health‐related quality of life (30 days, 3 months) | None of the trials reported this outcome. | ||||
| Health‐related quality of life (maximal follow‐up) | None of the trials reported this outcome. | ||||
| *The basis for the assumed risk is the mean control group proportion. The corresponding risk (and its 95% credible interval) is based on the assumed risk in the comparison group and the relative effect of the intervention (and its 95% CrI). Network meta‐analysis was not performed for any of the outcomes since there were only two treatments. CrI: credible intervals; OR: odds ratio. | |||||
| GRADE Working Group grades of evidence | |||||
| 1 Risk of bias was unclear or high in the trial(s) (downgraded by 1 point). | |||||
| Outcomes | Illustrative comparative risks* (95% CrI) | Relative effect (95% CrI) | No of participants | Quality of the evidence | |
| Assumed risk | Corresponding risk | ||||
| Control | Intervention | ||||
| Mortality (perioperative) | There was no mortality in either group. | 28 (1 study) | ⊕⊝⊝⊝ Very low1,2,3 | ||
| Mortality (longest follow‐up): reported at 1 year | There was no mortality in either group. | 28 (1 study) | ⊕⊝⊝⊝ Very low1,2,3 | ||
| Serious adverse events (proportion) | None of the trials reported this outcome. | ||||
| Serious adverse events (number) | None of the trials reported this outcome. | ||||
| Health‐related quality of life (30 days, 3 months) | None of the trials reported this outcome. | ||||
| Health‐related quality of life (longest follow‐up) | None of the trials reported this outcome. | ||||
| *The basis for the assumed risk is the mean control group proportion. The corresponding risk (and its 95% credible interval) is based on the assumed risk in the comparison group and the relative effect of the intervention (and its 95% CrI). Network meta‐analysis was not performed for any of the outcomes since there were only two treatments. CrI: credible intervals; OR: odds ratio | |||||
| GRADE Working Group grades of evidence | |||||
| 1 Risk of bias was unclear or high in the trial(s) (downgraded by 1 point). | |||||
| Outcomes | Illustrative comparative risks* (95% CrI) | Relative effect (95% CrI) | No of participants | Quality of the evidence | |
| Assumed risk | Corresponding risk | ||||
| Control | Intervention | ||||
| Mortality (perioperative) | |||||
| Hypoventilation vs control | There was no mortality in either group. | 79 (1 study) | ⊕⊝⊝⊝ Very low1,2,3 | ||
| Low central venous pressure vs control | There was no mortality in either group. | 85 (1 study) | ⊕⊝⊝⊝ Very low1,2,3 | ||
| Mortality (longest follow‐up) | None of the trials reported this outcome. | ||||
| Serious adverse events (proportion) | |||||
| Hypoventilation vs control | 26 per 1000 | 60 per 1000 (5 to 679) | OR 2.41 (0.18 to 80.4) | 79 (1 study) | ⊕⊝⊝⊝ Very low1,2,3 |
| Low central venous pressure vs acute normovolemic haemodilution plus low CVP | 302 per 1000 | 284 per 1000 (157 to 460) | OR 0.92 (0.43 to 1.97) | 63 (1 study) | ⊕⊝⊝⊝ Very low1,2,3 |
| Serious adverse events (number) | |||||
| Low central venous pressure vs control | 100 per 1000 | 0 per 1000 (0 to 2) | Rate ratio 0.00 (0 to 0.02) | 42 (1 study) | ⊕⊝⊝⊝ Very lowa,b,c |
| Low central venous pressure vs acute normovolemic haemodilution plus low central venous pressure | 103 per 1000 | 77 per 1000 (15 to 287) | Rate ratio 0.73 (0.13 to 3.53) | 78 (1 study) | ⊕⊝⊝⊝ Very lowa,b,c |
| Health‐related quality of life (30 days, 3 months) | None of the trials reported this outcome. | ||||
| Health‐related quality of life (longest follow‐up) | None of the trials reported this outcome. | ||||
| *The basis for the assumed risk is the mean control group proportion. The corresponding risk (and its 95% credible interval) is based on the assumed risk in the comparison group and the relative effect of the intervention (and its 95% CrI). Network meta‐analysis was not performed for any of the outcomes because of the lack of availability of direct and indirect comparisons in the network. CrI: credible intervals; OR: odds ratio. | |||||
| GRADE Working Group grades of evidence | |||||
| 1aRisk of bias was unclear or high in the trial(s) (downgraded by 1 point). | |||||
| Outcomes | Illustrative comparative risks* (95% CrI) | Relative effect (95% CrI) | No of participants | Quality of the evidence | |
| Assumed risk | Corresponding risk | ||||
| Control | Intervention | ||||
| Mortality (perioperative) | |||||
| CUSA vs clamp‐crush method | 23 per 1000 | 6 per 1000 (0 to 54) | OR 0.24 (0.01 to 2.41) | 172 (2 studies) | ⊕⊝⊝⊝ Very low1,2,3 |
| Radiofrequency dissecting sealer vs clamp‐crush method | 10 per 1000 | 16 per 1000 (4 to 65) | OR 1.60 (0.43 to 6.7) | 390 (5 studies) | ⊕⊝⊝⊝ Very low1,2,3 |
| Sharp transection method vs clamp‐crush method | There was no mortality in either group. | 82 (1 study) | ⊕⊝⊝⊝ Very low1,2,3 | ||
| Stapler vs clamp‐crush method | 31 per 1000 | 67 per 1000 (12 to 375) | OR 2.26 (0.39 to 18.93) | 130 (1 study) | ⊕⊝⊝⊝ Very low1,2,3 |
| Hydrojet vs CUSA | 55 per 1000 | 54 per 1000 (9 to 258) | OR 0.98 (0.16 to 6.04) | 111 (2 studies) | ⊕⊝⊝⊝ Very low1,2,3 |
| Radiofrequency dissecting sealer vs CUSA | 44 per 1000 | 28 per 1000 (3 to 166) | OR 0.61 (0.07 to 4.28) | 90 (2 studies) | ⊕⊝⊝⊝ Very low1,2,3 |
| Stapler vs CUSA | There was no mortality in either group. | 79 (1 study) | ⊕⊝⊝⊝ Very low1,2,3 | ||
| Radiofrequency dissecting sealer vs hydrojet | 80 per 1000 | 9 per 1000 (0 to 145) | OR 0.10 (0 to 1.95) | 50 (1 study) | ⊕⊝⊝⊝ Very low1,2,3 |
| Mortality (longest follow‐up) | None of the trials reported this outcome. | ||||
| Serious adverse events (proportion) | |||||
| CUSA vs clamp‐crush method | 93 per 1000 | 31 per 1000 (6 to 110) | OR 0.31 (0.06 to 1.2) | 172 (2 studies) | ⊕⊝⊝⊝ Very low1,2,3 |
| Radiofrequency dissecting sealer vs clamp‐crush method | 58 per 1000 | 49 per 1000 (15 to 145) | OR 0.83 (0.24 to 2.74) | 240 (3 studies) | ⊕⊝⊝⊝ Very low1,2,3 |
| Sharp transection method vs clamp‐crush method | 49 per 1000 | 106 per 1000 (20 to 502) | OR 2.31 (0.39 to 19.69) | 82 (1 study) | ⊕⊝⊝⊝ Very low1,2,3 |
| Hydrojet vs CUSA | 100 per 1000 | 124 per 1000 (61 to 238) | OR 1.27 (0.58 to 2.81) | 61 (1 study) | ⊕⊝⊝⊝ Very low1,2,3 |
| Radiofrequency dissecting sealer vs CUSA | 50 per 1000 | 30 per 1000 (3 to 180) | OR 0.58 (0.06 to 4.16) | 40 (1 study) | ⊕⊝⊝⊝ Very low1,2,3 |
| Stapler vs CUSA | 246 per 1000 | 246 per 1000 (6 to 931) | OR 1.00 (0.02 to 41.22) | 130 (1 study) | ⊕⊝⊝⊝ Very low1,2,3 |
| Serious adverse events (number) | |||||
| CUSA vs clamp‐crush method | 45 per 1000 | 29 per 1000 (3 to 166) | Rate ratio 0.63 (0.07 to 4.17) | 132 (1 study) | ⊕⊝⊝⊝ Very low1,2,3 |
| Radiofrequency dissecting sealer vs clamp‐crush method | 61 per 1000 | 190 per 1000 (75 to 474) | Rate ratio 3.64 (1.25 to 13.97) | 130 (2 studies) | ⊕⊕⊝⊝ Low1,2 |
| Hydrojet vs CUSA | 80 per 1000 | 121 per 1000 (20 to 546) | Rate ratio 1.59 (0.24 to 13.83) | 50 (1 study) | ⊕⊝⊝⊝ Very low1,2,3 |
| Radiofrequency dissecting sealer vs CUSA | 80 per 1000 | 121 per 1000 (20 to 546) | Rate ratio 1.59 (0.24 to 13.83) | 50 (1 study) | ⊕⊝⊝⊝ Very low1,2,3 |
| Stapler vs CUSA | 180 per 1000 | 230 per 1000 (109 to 424) | Rate ratio 1.36 (0.56 to 3.36) | 100 (1 study) | ⊕⊝⊝⊝ Very low1,2,3 |
| Radiofrequency dissecting sealer vs hydrojet | 120 per 1000 | 120 per 1000 (23 to 445) | Rate ratio 1.00 (0.17 to 5.88) | 50 (1 study) | ⊕⊝⊝⊝ Very low1,2,3 |
| Health‐related quality of life (30 days, 3 months) | None of the trials reported this outcome. | ||||
| Health‐related quality of life (maximal follow‐up) | None of the trials reported this outcome. | ||||
| *The basis for the assumed risk is the mean control group proportion. The corresponding risk (and its 95% credible interval) is based on the assumed risk in the comparison group and the relative effect of the intervention (and its 95% CrI). Network meta‐analysis was not performed for any of the outcomes because of the lack of availability of direct and indirect comparisons in the network. CrI: credible intervals; CUSA: cavitron ultrasonic surgical aspirator; OR: odds ratio | |||||
| GRADE Working Group grades of evidence | |||||
| 1 Risk of bias was unclear or high in the trial(s) (downgraded by 1 point). | |||||
| Outcomes | Illustrative comparative risks* (95% CrI) | Relative effect (95% CrI) | No of participants | Quality of the evidence | |
| Assumed risk | Corresponding risk | ||||
| Control | Intervention | ||||
| Mortality (perioperative) | |||||
| Fibrin sealant vs control | 11 per 1000 | 41 per 1000 (10 to 253) | OR 4.03 (0.9 to 31.72) | 380 (2 studies) | ⊕⊝⊝⊝ Very low1,2,3 |
| Fibrin sealant and collagen vs control | 13 per 1000 | 45 per 1000 (10 to 268) | OR 3.48 (0.74 to 27.03) | 300 (1 study) | ⊕⊝⊝⊝ Very low1,2,3 |
| Fibrin sealant vs argon beam | 53 per 1000 | 72 per 1000 (25 to 198) | OR 1.39 (0.46 to 4.45) | 227 (2 studies) | ⊕⊝⊝⊝ Very low1,2,3 |
| Fibrin sealant vs collagen | 33 per 1000 | 30 per 1000 (7 to 123) | OR 0.91 (0.2 to 4.14) | 256 (3 studies) | ⊕⊝⊝⊝ Very low1,2,3 |
| Oxidised cellulose vs fibrin sealant | 56 per 1000 | 31 per 1000 (1 to 565) | OR 0.54 (0.01 to 22.09) | 50 (1 study) | ⊕⊝⊝⊝ Very low1,2,3 |
| Plasmajet vs fibrin sealant | 103 per 1000 | 65 per 1000 (7 to 332) | OR 0.60 (0.06 to 4.31) | 58 (1 study) | ⊕⊝⊝⊝ Very low1,2,3 |
| Mortality (longest follow‐up) | None of the trials reported this outcome. | ||||
| Serious adverse events (proportion) | |||||
| Fibrin sealant vs control | 186 per 1000 | 191 per 1000 (128 to 275) | OR 1.03 (0.64 to 1.66) | 457 (3 studies) | ⊕⊝⊝⊝ Very low1,2,3 |
| Fibrin sealant vs argon beam | 269 per 1000 | 183 per 1000 (78 to 360) | OR 0.61 (0.23 to 1.53) | 106 (1 study) | ⊕⊝⊝⊝ Very low1,2,3 |
| Fibrin sealant vs collagen | 258 per 1000 | 356 per 1000 (205 to 547) | OR 1.59 (0.74 to 3.47) | 127 (1 study) | ⊕⊝⊝⊝ Very low1,2,3 |
| Oxidised cellulose vs fibrin sealant | 444 per 1000 | 309 per 1000 (113 to 603) | OR 0.56 (0.16 to 1.9) | 50 (1 study) | ⊕⊝⊝⊝ Very low1,2,3 |
| Plasmajet vs fibrin sealant | 207 per 1000 | 25 per 1000 (0 to 165) | OR 0.10 (0 to 0.76) | 58 (1 study) | ⊕⊝⊝⊝ Very low1,2,3 |
| Serious adverse events (number) | |||||
| Fibrin sealant vs control | 486 per 1000 | 470 per 1000 (307 to 640) | Rate ratio 0.94 (0.47 to 1.88) | 70 (1 study) | ⊕⊝⊝⊝ Very low1,2,3 |
| Fibrin sealant & collagen vs control | 147 per 1000 | 186 per 1000 (116 to 286) | Rate ratio 1.33 (0.76 to 2.33) | 300 (1 study) | ⊕⊝⊝⊝ Very low1,2,3 |
| Fibrin sealant vs argon beam | 65 per 1000 | 249 per 1000 (107 to 547) | Rate ratio 4.81 (1.73 to 17.5) | 121 (1 study) | ⊕⊕⊝⊝ Low1,2 |
| Fibrin sealant vs collagen | 323 per 1000 | 369 per 1000 (266 to 488) | Rate ratio 1.23 (0.76 to 2) | 189 (2 studies) | ⊕⊝⊝⊝ Very low1,2,3 |
| Fibrin sealant vs cyanoacrylate | 67 per 1000 | 67 per 1000 (2 to 733) | Rate ratio 1.01 (0.03 to 38.36) | 30 (1 study) | ⊕⊝⊝⊝ Very low1,2,3 |
| Oxidised cellulose vs cyanoacrylate | 67 per 1000 | 277 per 1000 (46 to 921) | Rate ratio 5.37 (0.67 to 163.2) | 30 (1 study) | ⊕⊝⊝⊝ Very low1,2,3 |
| Oxidised cellulose vs fibrin sealant | 67 per 1000 | 278 per 1000 (46 to 926) | Rate ratio 5.40 (0.67 to 174.86) | 30 (1 study) | ⊕⊝⊝⊝ Very low1,2,3 |
| Health‐related quality of life (30 days, 3 months) | None of the trials reported this outcome. | ||||
| Health‐related quality of life (longest follow‐up) | None of the trials reported this outcome. | ||||
| *The basis for the assumed risk is the mean control group proportion. The corresponding risk (and its 95% credible interval) is based on the assumed risk in the comparison group and the relative effect of the intervention (and its 95% CrI). Network meta‐analysis was not performed for any of the outcomes because of the lack of availability of direct and indirect comparisons in the network. CrI: credible intervals; OR: odds ratio. | |||||
| GRADE Working Group grades of evidence | |||||
| 1 Risk of bias was unclear or high in the trial(s) (downgraded by 1 point). | |||||
| Outcomes | Illustrative comparative risks* (95% CrI) | Relative effect (95% CrI) | No of participants | Quality of the evidence | |
| Assumed risk | Corresponding risk | ||||
| Control | Intervention | ||||
| Mortality (perioperative) | |||||
| Continuous portal triad clamping vs control | There was no mortality in either group. | 15 (1 study) | ⊕⊝⊝⊝ Very low1,2,3 | ||
| Intermittent portal triad clamping vs control | 26 per 1000 | 15 per 1000 (3 to 60) | OR 0.60 (0.13 to 2.42) | 392 (4 studies) | ⊕⊝⊝⊝ Very low1,2,3 |
| Continuous portal triad clamping vs continuous hepatic vascular exclusion | 1 per 1000 | 5 per 1000 (4 to 15) | OR 4.91 (3.68 to 15.64) | 170 (2 studies) | ⊕⊝⊝⊝ Very low1,2,3 |
| Continuous selective hepatic vascular exclusion vs continuous portal triad clamping | There was no mortality in either group. | 160 (1 study) | ⊕⊝⊝⊝ Very low1,2,3 | ||
| Continuous selective portal triad clamping vs continuous portal triad clamping | There was no mortality in either group. | 120 (1 study) | ⊕⊝⊝⊝ Very low1,2,3 | ||
| Intermittent portal triad clamping vs continuous portal triad clamping | 67 per 1000 | 10 per 1000 (0 to 70) | OR 0.14 (0 to 1.05) | 121 (2 studies) | ⊕⊝⊝⊝ Very low1,2,3 |
| Intermittent portal triad clamping vs continuous selective portal triad clamping | There was no mortality in either group. | 80 (1 study) | ⊕⊝⊝⊝ Very low1,2,3 | ||
| Intermittent selective portal triad clamping vs intermittent portal triad clamping | 1 per 1000 | 2 per 1000 (0 to 69) | OR 2.27 (0.17 to 74) | 138 (2 studies) | ⊕⊝⊝⊝ Very low1,2,3 |
| Mortality (longest follow‐up) | None of the trials reported this outcome. | ||||
| Serious adverse events (proportion)* | |||||
| Continuous hepatic vascular exclusion vs control | 99 per 1000 | 200 per 1000 (19 to 785) | Rate ratio 2.27 (0.18 to 33.05) | 815 (6 studies) | ⊕⊝⊝⊝ Very low1,2,3 |
| Continuous portal triad clamping vs control | 99 per 1000 | 135 per 1000 (30 to 439) | Rate ratio 1.42 (0.28 to 7.09) | 815 (6 studies) | ⊕⊝⊝⊝ Very low1,2,3 |
| Continuous selective hepatic vascular exclusion vs control | 99 per 1000 | 15 per 1000 (0 to 325) | Rate ratio 0.14 (0 to 4.37) | 815 (6 studies) | ⊕⊝⊝⊝ Very low1,2,3 |
| Continuous selective portal triad clamping vs control | 99 per 1000 | 55 per 1000 (11 to 226) | Rate ratio 0.53 (0.1 to 2.65) | 815 (6 studies) | ⊕⊝⊝⊝ Very low1,2,3 |
| Intermittent portal triad clamping vs control | 99 per 1000 | 113 per 1000 (56 to 217) | Rate ratio 1.16 (0.54 to 2.51) | 815 (6 studies) | ⊕⊝⊝⊝ Very low1,2,3 |
| Continuous portal triad clamping vs continuous hepatic vascular exclusion | 50 per 1000 | 32 per 1000 (2 to 412) | Rate ratio 0.63 (0.03 to 13.31) | 815 (6 studies) | ⊕⊝⊝⊝ Very low1,2,3 |
| Continuous selective hepatic vascular exclusion vs continuous hepatic vascular exclusion | 50 per 1000 | 3 per 1000 (0 to 442) | Rate ratio 0.06 (0 to 15.06) | 815 (6 studies) | ⊕⊝⊝⊝ Very low1,2,3 |
| Continuous selective portal triad clamping vs continuous hepatic vascular exclusion | 50 per 1000 | 12 per 1000 (1 to 209) | Rate ratio 0.23 (0.01 to 5.02) | 815 (6 studies) | ⊕⊝⊝⊝ Very low1,2,3 |
| Intermittent portal triad clamping vs continuous hepatic vascular exclusion | 50 per 1000 | 26 per 1000 (2 to 288) | Rate ratio 0.51 (0.03 to 7.68) | 815 (6 studies) | ⊕⊝⊝⊝ Very low1,2,3 |
| Continuous selective hepatic vascular exclusion vs continuous portal triad clamping | 139 per 1000 | 16 per 1000 (0 to 724) | Rate ratio 0.10 (0 to 16.28) | 815 (6 studies) | ⊕⊝⊝⊝ Very low1,2,3 |
| Continuous selective portal triad clamping vs continuous portal triad clamping | 139 per 1000 | 56 per 1000 (6 to 374) | Rate ratio 0.37 (0.04 to 3.7) | 815 (6 studies) | ⊕⊝⊝⊝ Very low1,2,3 |
| Intermittent portal triad clamping vs continuous portal triad clamping | 139 per 1000 | 117 per 1000 (22 to 439) | Rate ratio 0.82 (0.14 to 4.86) | 815 (6 studies) | ⊕⊝⊝⊝ Very low1,2,3 |
| Continuous selective portal triad clamping vs continuous selective hepatic vascular exclusion | As there were no serious adverse events in either group, the credible intervals were extremely wide. This is equivalent to not estimable in direct comparisons. | 815 (6 studies) | ⊕⊝⊝⊝ Very low1,2,3 | ||
| Intermittent portal triad clamping vs continuous selective hepatic vascular exclusion | As there were no serious adverse events in either group, the credible intervals were extremely wide. This is equivalent to not estimable in direct comparisons. | 815 (6 studies) | ⊕⊝⊝⊝ Very low1,2,3 | ||
| Intermittent portal triad clamping vs continuous selective portal triad clamping | 130 per 1000 | 247 per 1000 (51 to 665) | Rate ratio 2.19 (0.36 to 13.26) | 815 (6 studies) | ⊕⊝⊝⊝ Very low1,2,3 |
| Serious adverse events (number) | |||||
| Intermittent portal triad clamping vs control | 80 per 1000 | 119 per 1000 (36 to 358) | Rate ratio 1.55 (0.43 to 6.4) | 100 (1 study) | ⊕⊝⊝⊝ Very lowa,b,c |
| Continuous portal triad clamping vs continuous hepatic vascular exclusion | 179 per 1000 | 36 per 1000 (2 to 218) | Rate ratio 0.17 (0.01 to 1.28) | 52 (1 study) | ⊕⊝⊝⊝ Very lowa,b,c |
| Intermittent portal triad clamping vs continuous portal triad clamping | 190 per 1000 | 21 per 1000 (0 to 116) | Rate ratio 0.09 (0 to 0.56) | 86 (1 study) | ⊕⊕⊝⊝ Lowa,b |
| Intermittent selective portal triad clamping vs intermittent portal triad clamping | 134 per 1000 | 165 per 1000 (76 to 328) | Rate ratio 1.27 (0.53 to 3.15) | 138 (2 studies) | ⊕⊝⊝⊝ Very lowa,b,c |
| Health‐related quality of life (30 days, 3 months) | None of the trials reported this outcome. | ||||
| Health‐related quality of life (longest follow‐up) | None of the trials reported this outcome. | ||||
| *The basis for the assumed risk is the mean control group proportion. The corresponding risk (and its 95% credible interval) is based on the assumed risk in the comparison group and the relative effect of the intervention (and its 95% CrI). Network meta‐analysis was not performed for any of the outcomes other than serious adverse events (proportion) because of the lack of availability of direct and indirect comparisons in the network. CrI: credible intervals; OR: odds ratio. | |||||
| GRADE Working Group grades of evidence | |||||
| 1 Risk of bias was unclear or high in the trial(s) (downgraded by 1 point). | |||||
| Outcomes | Illustrative comparative risks* (95% CrI) | Relative effect (95% CrI) | No of participants | Quality of the evidence | |
| Assumed risk | Corresponding risk | ||||
| Control | Intervention | ||||
| Mortality (perioperative) | |||||
| Recombinant factor VIIa vs control | 51 per 1000 | 33 per 1000 (7 to 158) | OR 0.63 (0.13 to 3.51) | 185 (1 study) | ⊕⊝⊝⊝ Very low1,2,3 |
| Tranexamic acid vs control | There was no mortality in either group. | 214 (1 study) | ⊕⊝⊝⊝ Very low1,2,3 | ||
| Mortality (longest follow‐up) | None of the trials reported this outcome. | ||||
| Serious adverse events (proportion) | |||||
| Anti‐thrombin III vs control | 273 per 1000 | 312 per 1000 (67 to 761) | OR 1.21 (0.19 to 8.49) | 24 (1 study) | ⊕⊝⊝⊝ Very low1,2,3 |
| Recombinant Factor VIIa vs control | 376 per 1000 | 396 per 1000 (256 to 555) | OR 1.09 (0.57 to 2.07) | 432 (2 studies) | ⊕⊝⊝⊝ Very low1,2,3 |
| Serious adverse events (number) | |||||
| Recombinant Factor VIIa vs control | 81 per 1000 | 120 per 1000 (68 to 217) | Rate ratio 1.55 (0.83 to 3.16) | 432 (2 studies) | ⊕⊝⊝⊝ Very low1,2,3 |
| Tranexamic acid vs control | 75 per 1000 | 65 per 1000 (23 to 164) | Rate ratio 0.85 (0.29 to 2.41) | 214 (1 study) | ⊕⊝⊝⊝ Very low1,2,3 |
| Health‐related quality of life (30 days, 3 months) | None of the trials reported this outcome. | ||||
| Health‐related quality of life (maximal follow‐up) | None of the trials reported this outcome. | ||||
| *The basis for the assumed risk is the mean control group proportion. The corresponding risk (and its 95% credible interval) is based on the assumed risk in the comparison group and the relative effect of the intervention (and its 95% CrI). Network meta‐analysis was not performed for any of the outcomes because of the lack of availability of direct and indirect comparisons in the network. CrI: credible intervals; OR: odds ratio | |||||
| GRADE Working Group grades of evidence | |||||
| 1 Risk of bias was unclear or high in the trial(s) (downgraded by 1 point). | |||||
Antecedentes
Descripción de la afección
La resección hepática se refiere a la extracción de parte del hígado. Cada año, como promedio 2400 personas se someten a resecciones hepáticas en Inglaterra (HSCIC 2015), 11 000 en los EE.UU. (Asiyanbola 2008) y 7200 en Francia (Farges 2012). En occidente, la indicación principal para la resección hepática son las metástasis hepáticas colorrectales. El cáncer colorrectal es el tercer cáncer más frecuente en el mundo. Aproximadamente 1 360 000 personas desarrollan cáncer colorrectal cada año (IARC 2012) y del 50% al 60% presentará metástasis hepáticas colorrectales (Garden 2006). La resección hepática, la única opción curativa para los pacientes con metástasis hepáticas colorrectales, está indicada en el 20% al 30% de los pacientes en los que la metástasis se limita al hígado (Garden 2006). La supervivencia a los cinco años de los pacientes con metástasis hepáticas colorrectales sometidos a resección hepática está alrededor del 45% (Garden 2006; Nordlinger 2013).
La segunda razón más habitual de resección hepática es el carcinoma hepatocelular. El carcinoma hepatocelular es uno de los cánceres más frecuentes, con una incidencia anual global de 780 000 pacientes (IARC 2012). La mayoría de los carcinomas hepatocelulares se presentan en los hígados con cirrosis (Llovet 2005). La resección hepática y el trasplante hepático son los principales tratamientos curativos (Llovet 2005; Taefi 2013). De los pacientes que presentan carcinoma hepatocelular, cerca del 5% son candidatos a resección hepática (Chen 2006). La supervivencia después de la cirugía depende del estadio del cáncer y la gravedad de la enfermedad hepática crónica subyacente. Los pacientes con enfermedad en estadio inicial (cánceres más pequeños de 5 cm) tienen una supervivencia a los cinco años de alrededor del 50%, mientras que los pacientes con enfermedad más avanzada tienen una supervivencia a los cinco años de alrededor del 30% (Chen 2006; Navadgi 2016). En teoría los programas de cribado deberían dar lugar a un diagnóstico en un estadio más temprano, cuando la cirugía es factible y se asocia con mejores resultados.
La resección hepática también se puede realizar para los tumores hepáticos benignos (Belghiti 1993).
El hígado puede dividirse en ocho segmentos (Couinaud 1999), que se pueden eliminar de manera individual por hemihepatectomía derecha (segmentos de Couinaud 5 a 8), hemihepatectomía izquierda (segmentos 2 a 4), triseccionectomía derecha (segmentos 4 a 8) o triseccionectomía izquierda (segmentos 2 a 5 y 8 ± 1) (Strasberg 2000). Aunque la resección hepática se considera una cirugía mayor, solamente la resección de tres o más segmentos se considera una resección hepática mayor (Belghiti 1993).
La pérdida sanguínea durante la resección hepática es un factor importante que influye en las complicaciones y la mortalidad de los pacientes sometidos a resección hepática (Shimada 1998; Yoshimura 2004; Ibrahim 2006). Se calcula que la pérdida sanguínea varía de 200 ml a 2 l por paciente (Gurusamy 2009a). Una pérdida sanguínea grave durante la cirugía o en el período posoperatorio inmediato puede provocar la muerte del paciente. La pérdida sanguínea grave se puede definir según el Advanced Trauma Life Support (definición ATLS de shock clase 3 o clase 4, cuando hay una pérdida del 30% o más del volumen de sangre) (ATLS 2008). Durante la resección hepática, el parénquima hepático se incinde en el plano de la resección. Los vasos sanguíneos y las ramas del conducto biliar en el plano de la resección (superficie cortada) se cierran luego mediante diferentes métodos para impedir la pérdida de sangre o bilis.
Descripción de la intervención
Los especialistas han estudiado diversas intervenciones en intentos por reducir la pérdida sanguínea durante la resección hepática. Estas intervenciones incluyen el enfoque anterior en comparación con el enfoque quirúrgico estándar (convencional) (Capussotti 2012); la donación de sangre autóloga con el objetivo de disminuir la administración de sangre de otras personas (transfusión sanguínea heteróloga) (Kajikawa 1994), diversas intervenciones cardiopulmonares como la hemodilución normovolémica aguda (ANH), la presión venosa central baja (presión venosa central) y la hipoventilación, que se pueden utilizar solas o en combinación para reducir la pérdida sanguínea (Gurusamy 2012; Tabla 1); diferentes métodos de transección (la manera en que se divide el parénquima hepático) del parénquima hepático, como el método de pinzamiento y trituración, el aspirador quirúrgico ultrasónico cavitron, o el cauterizador de disección de radiofrecuencia (Gurusamy 2009b; Tabla 2); diferentes métodos de tratamiento de la superficie cortada del hígado (la manera en que se trata el plano de resección del hígado remanente) como el uso de un sellador de fibrina, un emisor de haz de argón, o un electrocauterio y material de sutura (Frilling 2005; Tabla 3); la oclusión temporal de los vasos sanguíneos que irrigan el hígado (Gurusamy 2009a; Tabla 4); y diversas intervenciones farmacológicas como el factor VIIa recombinante, la antitrombina III y el ácido tranexámico (Gurusamy 2009c).
Las intervenciones seleccionadas para disminuir la pérdida sanguínea se pueden utilizar solas o en diversas combinaciones. Generalmente los cirujanos de diferentes centros siguen su propio protocolo para reducir la pérdida sanguínea. Las técnicas de división con los dedos y el pinzamiento y trituración no incluyen un equipo especializado. El método mínimo y estándar de tratamiento de la superficie cortada incluye el uso del electrocauterio para cerrar los vasos pequeños y suturar los vasos más grandes. En general, el objetivo de estas intervenciones es disminuir la pérdida sanguínea y la morbilidad y la mortalidad asociada.
De qué manera podría funcionar la intervención
La oclusión temporal de los vasos que irrigan el hígado puede reducir la pérdida sanguínea a través de los vasos cortados. Se utilizan diferentes métodos de transección hepática para identificar los vasos principales y poder suturarlos y dividirlos. Lo anterior podría dar lugar a la visualización clara de los vasos sanguíneos, que se pueden pinzar y luego dividir. Diferentes métodos tópicos de tratamiento de la superficie cortada intentan cerrar los vasos sanguíneos en el plano de resección, lo que evita la pérdida sanguínea. Las intervenciones cardiopulmonares reducen la cantidad de sangre perdida mediante la dilución de la sangre o la reducción de la presión en las venas hepáticas (presión venosa central baja). La donación de sangre autóloga incluye la venodisección del paciente antes de la cirugía y el almacenamiento de la sangre para poderla reemplazar si se requiere durante o después de la cirugía, con la intención de reducir la transfusión sanguínea homóloga. Las intervenciones farmacológicas funcionan al aumentar la coagulación de la sangre con el objetivo de reducir la pérdida sanguínea. El enfoque anterior es una técnica quirúrgica que incluye ocluir la entrada y la salida de los vasos y realizar la transección del parénquima antes de la movilización del hígado derecho (Liu 2006). La posible ventaja del enfoque anterior sobre el enfoque convencional, en el cual el hígado se moviliza primero, es que se puede evitar la lesión inadvertida a los vasos sanguíneos y la hemorragia resultante ya que los vasos sanguíneos se ocluyen antes de la movilización hepática en el enfoque anterior. Los vasos sanguíneos también se pueden ocluir primero en el enfoque convencional si se utiliza uno de los métodos de oclusión vascular.
Por qué es importante realizar esta revisión
La resección hepática es un procedimiento quirúrgico mayor con mortalidad (calculada del 3,5%) y morbilidad (calculada en alrededor del 40%) significativas (Finch 2007; Reissfelder 2011). Las intervenciones que reducen la pérdida sanguínea pueden mejorar los resultados de la resección hepática. En revisiones sistemáticas anteriores se han evaluado algunas de las categorías de intervenciones (Gurusamy 2009a; Gurusamy 2009b; Gurusamy 2009c; Gurusamy 2012). También se realizó un metanálisis en red que evalúa la combinación de un método de oclusión vascular, transección del parénquima y método de tratar la superficie bruta como un empaque (Simillis 2014). Sin embargo, en esta revisión se encontró que la mayoría de los autores no informaron aspectos diferentes del método de resección hepática que no fueran que el factor se asignó al azar o que se permitió que los cirujanos eligieran cómo lidiar con los otros factores según su preferencia. Debido a que esta revisión excluyó dichos ensayos, los revisores sólo pudieron incluir unos pocos estudios. En esta revisión actualizada, se han cubierto todos los diferentes aspectos de los métodos para reducir la pérdida sanguínea y la necesidad de transfusión sanguínea durante la resección hepática. Se incluyeron los ensayos en los que al menos uno de los métodos para reducir la pérdida sanguínea y la necesidad de transfusión sanguínea durante la resección hepática se incluyó en una comparación aleatoria con los otros aspectos, ya sea que no se informaron o que se permitió que variaran según la preferencia de los cirujanos. Esta revisión sistemática está concebida como una guía útil para los pacientes y los profesionales sanitarios ya que procura comprender la función de diferentes métodos para reducir la pérdida sanguínea y la necesidad de transfusión sanguínea en los pacientes sometidos a resección hepática electiva.
Objetivos
Evaluar los efectos de diferentes intervenciones para la reducción de la pérdida sanguínea y la necesidad de transfusión sanguínea durante la resección hepática electiva.
Métodos
Criterios de inclusión de estudios para esta revisión
Tipos de estudios
En este metanálisis en red sólo se consideraron los ensayos clínicos aleatorios. Se excluyeron los estudios con otros diseños.
Tipos de participantes
Se incluyeron los ensayos clínicos aleatorios en los cuales los participantes recibieron resección hepática electiva mediante diferentes tipos de oclusión vascular o ninguna oclusión vascular, independientemente del método de oclusión vascular o la naturaleza del estado del hígado (es decir, normal o cirrótico), diferentes tipos de transección del parénquima, diferentes tipos de tratamiento de la superficie cortada, o si se utilizaron intervenciones farmacológicas. Se excluyeron los ensayos clínicos aleatorios en los que los participantes recibieron resección hepática combinada con otros procedimientos quirúrgicos mayores (p.ej. resección hepática y del intestino en una etapa por metástasis sincrónicas de tumores colorrectales).
Tipos de intervenciones
Se incluyeron ensayos clínicos aleatorios que evaluaron una o más de las siguientes intervenciones en esta revisión.
-
Enfoque anterior versus enfoque convencional.
-
Donación de sangre autóloga versus control.
-
Intervenciones cardiopulmonares.
-
Métodos de transección del parénquima hepático.
-
Métodos de tratamiento de la superficie bruta (plano de resección) del hígado.
-
Métodos de oclusión vascular (incluida ninguna oclusión vascular).
-
Intervenciones farmacológicas.
El cirujano (y en consecuencia los autores de los ensayos) puede utilizar una combinación particular de cada uno de los anteriores. Por ejemplo, un cirujano puede realizar la resección hepática mediante la oclusión vascular intermitente, la técnica de pinzamiento y trituración como el método de transección del parénquima hepático y un sellador de fibrina en la superficie cortada, mientras otro cirujano puede realizar la resección hepática sin utilizar un método de oclusión vascular, con el aspirador quirúrgico ultrasónico cavitron como el método de transección del parénquima hepático, sin utilizar un sellador de fibrina en el corte de la superficie, ni ninguna intervención farmacológica adicional.
Habitualmente las técnicas quirúrgicas utilizadas en cada una de las categorías anteriores se enumeran en Tabla 1, Tabla 2, Tabla 3 y Tabla 4. En la práctica, los cirujanos pueden utilizar cualquier intervención de la Tabla 1 en combinación con una intervención de la Tabla 2, la Tabla 3 o la Tabla 4. cualquier intervención en la Tabla 2 se puede utilizar en combinación con una intervención de la Tabla 3 o la Tabla 4. cualquier intervención en la Tabla 3 se puede utilizar en combinación con una intervención en la Tabla 4. cualquiera de estas combinaciones se puede utilizar en combinación con el enfoque anterior o convencional, con donación de sangre autóloga, y con o sin una intervención farmacológica.
Tipos de medida de resultado
Se evaluó la efectividad comparativa de las estrategias de tratamiento disponibles que intentaron reducir la pérdida sanguínea durante la resección hepática en los siguientes resultados.
Resultados primarios
-
Mortalidad.
-
perioperatoria (mortalidad a los 30 días o mortalidad posoperatoria). La mortalidad hospitalaria se utilizó como se definió en los ensayos incluidos.
-
A largo plazo (al seguimiento más largo).
-
-
Eventos adversos. Los eventos adversos se definieron como cualquier suceso médico desfavorable, que no necesariamente tuviera una relación causal con el tratamiento, pero que provocara la reducción de la dosis o la interrupción del tratamiento (ICH‐GCP 1997). Se consideró como grave cualquier evento adverso que aumentara la mortalidad; fuera potencialmente mortal; requiriera atención hospitalaria; motivara una discapacidad persistente o significativa; que pudiera haber puesto en peligro al paciente; o requiriera una intervención para prevenirlo. Los eventos adversos graves corresponden aproximadamente a los grado III o mayor en la clasificación Clavien‐Dindo (el único sistema validado para clasificar las complicaciones posoperatorias) (Dindo 2004; Clavien 2009; Tabla 5). En los casos donde los autores no clasificaron la gravedad de los eventos adversos, se siguieron los criterios proporcionados en la Tabla 5 para clasificar la gravedad. Se analizó la siguiente información.
-
Proporción de participantes que experimentaron eventos adversos graves.
-
Número de eventos adversos graves.
-
Proporción de participantes que experimentaron eventos adversos.
-
Número de eventos adversos.
-
-
Calidad de vida como se definió en los ensayos incluidos.
-
Corto plazo (30 días, tres meses).
-
Largo plazo (seguimiento más prolongado).
-
Resultados secundarios
-
Necesidad de transfusión sanguínea.
-
Número de participantes que necesitaron transfusión sanguínea heteróloga de eritrocitos o sangre total.
-
Cantidad de transfusión sanguínea (eritrocitos heterólogos o productos de sangre total, plaquetas o plasma fresco congelado).
-
Pérdida sanguínea quirúrgica total.
-
Número de participantes que tuvieron una pérdida sanguínea quirúrgica grave.
-
-
Estancia hospitalaria.
-
Duración de la estancia hospitalaria total (incluyendo reingresos).
-
Estancia en la unidad de terapia intensiva.
-
-
Duración de la cirugía.
-
Tiempo necesario para volver al trabajo.
Results
Description of studies
Results of the search
We identified 2938 references through electronic searches of CENTRAL (N = 342), MEDLINE (N = 1431), Embase (N = 445), Science Citation Index Expanded (N = 641), WHO ICTRP (N = 47), and ClinicalTrials.gov (N = 32). We excluded 893 duplicates and 1883 clearly irrelevant references through screening titles and reading abstracts. We retrieved 162 references for further assessment. We did not identify any references by scanning reference lists of the identified randomised trials. We excluded 76 references (67 studies) for the reasons listed in the Characteristics of excluded studies table. In total, 83 references for 67 completed randomised clinical trials met the inclusion criteria. Two references were for ongoing studies (Schmidt 2008; Chen 2015). We were unable to obtain one reference (Franceschi 2006). We included three studies under 'Studies awaiting classification' because there were no separate data for people who underwent liver resection, that is, the studies included a number of different surgical procedures, and information on people who underwent liver resection was not available (Chapman 2006; Bochicchio 2015; Wright 2015). This is summarised in the study flow diagram (Figure 1).

Study flow diagram.
Included studies
We describe the treatments used in the 67 randomised clinical trials in the Characteristics of included studies table and in Table 12.
| Study | Intervention | Co‐interventions | ||||||||
| Intervention | Control | Other information | Type of intervention | Vascular occlusion | Parenchymal transection method | Raw surface | Pharmacological methods | Cardiopulmonary methods | Autologous transfusion | |
| Anterior approach | Control | — | Anterior approach | Not stated | Clamp‐crush, bipolar dissecting sealer | Not stated | Not stated | Not stated | Not stated | |
| Anterior approach | Control | — | Anterior approach | Not stated | Cavitron ultrasonic surgical aspirator | Not stated | Not stated | Not stated | Not stated | |
| Autologous blood donation | Control | Note: autologous blood donation group was further randomised to recombinant erythropoietin and no erythropoietin | Autologous transfusion | Not stated | Not stated | Not stated | Not stated | Not stated | Factor being randomised | |
| Autologous blood donation | Control | Autologous blood donation: 2 units of blood were withdrawn before surgery | Autologous transfusion | Hepatic vascular exclusion | Not stated | Not stated | Not stated | Not stated | Factor being randomised | |
| Acute normovolemic haemodilution plus low central venous pressure | Control | Acute normovolemic dilution plus low central venous pressure: blood withdrawn to a target of 28% haematocrit and replaced with fluid. Target for central venous pressure was not reported | Cardiopulmonary methods | Not stated | Not stated | Not stated | Not stated | Factor being randomised | Not stated | |
| Acute normovolemic haemodilution plus low central venous pressure | Low central venous pressure | Acute normovolemic haemodilution: blood was withdrawn and replaced by colloids and crystalloids to reach a haematocrit target of 8 gm/dL. | Cardiopulmonary methods | Intermittent portal triad clamping | Not stated | Not stated | Not stated | Factor being randomised | Not stated | |
| Acute normovolemic haemodilution plus low central venous pressure | Low central venous pressure | Acute normovolemic haemodilution: blood was withdrawn and replaced by colloids to reach a haematocrit target of 24%. | Cardiopulmonary methods | Not stated | Not stated | Not stated | Not stated | Factor being randomised | Not stated | |
| Acute normovolemic haemodilution | Acute normovolemic haemodilution with hypotension | Acute normovolemic haemodilution: withdrawal of blood and replacement with fluids to maintain a target haematocrit of 30%. | Cardiopulmonary methods | Not stated | Not stated | Not stated | Not stated | Factor being randomised | Not stated | |
| Hypoventilation | Control | — | Cardiopulmonary methods | Intermittent portal triad clamping or selective occlusion | Clamp crush or cavitron ultrasonic surgical aspirator | Not stated | Not stated | Factor being randomised | None | |
| Low central venous pressure | Control | Low central venous pressure: by restricting flow from legs | Cardiopulmonary methods | Not stated | Not stated | Not stated | Not stated | Factor being randomised | Not stated | |
| Low central venous pressure | Control | Low central venous pressure: nitroglycerine | Cardiopulmonary intervention | Intermittent portal triad clamping | Not stated | Not stated | Not stated | Factor being randomised | Not stated | |
| Low central venous pressure | Control | Low central venous pressure: by inferior IVC clamping | Cardiopulmonary methods | Intermittent portal triad clamping | Cavitron ultrasonic surgical aspirator | Fibrin glue used | Not stated | Factor being randomised | Not stated | |
| Low central venous pressure | Control | Low central venous pressure: by limiting fluid, nitroglycerine, and furosemide | Cardiopulmonary methods | Varied | Clamp‐crush | Not stated | Not stated | Factor being randomised | Not stated | |
| Low central venous pressure | Low central venous pressure + acute normovolemic haemodilution. | Low central venous pressure: fluid restriction and nitroglycerine. | Cardiopulmonary methods | Not stated | Not stated | Not stated | Not stated | Factor being randomised | Not stated | |
| Stapler | Clamp‐crush method | Stapler: Autosuture EndoGIA stapler (Covidien) | Parenchumal transection | Variable | Factor being randomised | Variable | Not stated | Low central venous pressure | Not stated | |
| Cavitron ultrasonic surgical aspirator | Clamp‐crush method | — | Parenchymal transection | No vascular occlusion | Factor being randomised | Not stated | Not stated | Not stated | Not stated | |
| Cavitron ultrasonic surgical aspirator | Clamp‐crush method | — | Parenchymal transection | Intermittent total or selective portal triad clamping | Factor being randomised | Fibrin glue used | Not stated | Not stated | Not stated | |
| Cavitron ultrasonic surgical aspirator | Clamp‐crush method | Ultrasonic dissector: cavitron ultrasonic surgical aspirator. | Parenchymal transection | Intermittent portal triad clamping | Factor being randomised | Not stated | Not stated | Low central venous pressure | Not stated | |
| Cavitron ultrasonic surgical aspirator | Hydrojet | Hydrojet: Jet Cutter | Parenchymal transection | Portal triad clamping | Factor being randomised | Variable | Not stated | Not stated | Not stated | |
| Cavitron ultrasonic surgical aspirator | Stapler | Stapler: Endostapler (Covidien) | Parenchymal transection | Variable | Factor being randomised | Not stated | Not stated | Not stated | Not stated | |
| Cavitron ultrasonic surgical aspirator | Radiofrequency dissecting sealer. | Radiofrequency dissecting sealer: Tissue Link | Parenchymal transection | No vascular occlusion | Factor being randomised | Not stated | Not stated | Not stated | Not stated | |
| Radiofrequency dissecting sealer | Clamp‐crush method | Radiofrequency dissecting sealer: Ligasure | Parenchymal transection | Intermittent portal triad clamping or hemihepatic occlusion | Factor being randomised | Not stated | Not stated | Not stated | No | |
| Radiofrequency dissecting sealer | Clamp‐crush method | Radiofrequency dissecting sealer: Radionics needles | Parenchymal transection | No vascular occlusion | Factor being randomised | Not stated | Not stated | Not stated | Not stated | |
| Radiofrequency dissecting sealer | Clamp‐crush method | Radiofrequency dissecting sealer: Ligasure (Covidien) | Parenchymal transection | Not stated | Factor being randomised | No fibrin glue used | Not stated | Low central venous pressure | Not stated | |
| Radio‐frequency dissecting sealer | Clamp‐crush method | Radio‐frequency dissecting sealer: Tissue Link (Valley Lab) | Parenchymal transection | Variable | Factor being randomised | Not stated | Not stated | Not stated | Not stated | |
| Sharp transection | Clamp‐crush method | Sharp transection: using scalpel | Parenchymal transection | Selective hepatic vascular exclusion | Factor being randomised | Not stated | Not stated | Low central venous pressure | Not stated | |
| Anti‐thrombin III concentrate | Control | Anti‐thrombin concentrate: 1500 IU IV over 30 min: immediately before the operation, just before hepatic division, and immediately after operation | Pharmacological methods | Not stated | Not stated | Not stated | Factor being randomised | Not stated | Not stated | |
| Aprotinin | Control | Aprotinin: | Pharmacological methods | Intermittent portal triad clamping | Kelly clamp | Fibrin glue used | Factor being randomised | None | Not stated | |
| Desmopressin | Control | Desmopressin: 30 mcg/kg shortly after induction | Pharmacological methods | Varied | Cavitron ultrasonic surgical aspirator | Not stated | Factor being randomised | Not stated | Not stated | |
| Recombinant factor VIIa | Control | Recombinant factor VIIa: | Pharmacological methods | Mixture of methods | Not stated | No fibrin glue used | Factor being randomised | Not stated | No | |
| Recombinant factor VIIa | Control | Recombinant factor VIIa: brand not stated | Pharmacological methods | Not stated | Not stated | Not stated | Factor being randomised | Not stated | Not stated | |
| Tranexamic acid | Control | Tranexamic acid: 500 mg just before the surgery followed by 250 mg 4x/day for 3 days | Pharmacological methods | Varied | Clamp‐crush method | Not stated | Factor being randomised | Not stated | Not stated | |
| Collagen | Fibrin sealant | Collagen: Instat (Johnson & Johnson) | Raw surface | Not stated | Not stated | Factor being randomised | Not stated | Not stated | Not stated | |
| Collagen | Fibrin sealant | Collagen: Instat (Ethicon) | Raw surface | Not stated | Not stated | Factor being randomised | Not stated | Not stated | Not stated | |
| Collagen | Fibrin sealant | Collagen: Avitene (Alcon Inc). | Raw surface | Not stated | Not stated | Factor being randomised | Not stated | Not stated | Not stated | |
| Collagen | Fibrin sealant | Collagen: Sangustop fleece (Aesculap AG). | Raw surface | Not stated | A number of parenchymal transection techniques | Factor being randomised | None | Not stated | Not stated | |
| Fibrin sealant | Argon beam coagulator | Fibrin sealant: Tacchosil (Nycomed) | Raw surface | A mixture of approaches | A mixture of approaches | Factor being randomised | Not stated | Not stated | Not stated | |
| Fibrin sealant | Argon beam coagulator | Fibrin sealant: Tacchosil | Raw surface | Not stated | A mixture of approaches | Factor being randomised | Not stated | Not stated | Not stated | |
| Fibrin sealant | Control | Fibrin sealant: TISSEEL (Baxter Health Corporation) Spray; 5 mL of fibrinogen with synthetic aprotinin and 5 mL of thrombin (500 IU/mL) | Raw surface | Intermittent portal triad clamping | Different types of liver resection | Factor being randomised | Not stated | Not stated | Not stated | |
| Fibrin sealant | Control | Fibrin sealant: Quixil (Johnson & Johnson Medical) spray; 5 mL of fibrinogen and tranexamic acid and 5 mL of thrombin | Raw surface | With and without inflow occlusion | Clamp‐crush, cavitron ultrasonic surgical aspirator, electric coagulation based, combined | Factor being randomised | Not stated | Not stated | Not stated | |
| Fibrin sealant | Control | Fibrin sealant: name not available | Raw surface | Not stated | Not stated | Factor being randomised | Not stated | Not stated | Not stated | |
| Fibrin sealant | Control | Fibrin sealant: Biocol | Raw surface | Varied | Clamp‐crush method or cavitron ultrasonic surgical aspirator | Factor being randomised | Not stated | Not stated | Not stated | |
| Fibrin sealant | Gelatin | Fibrin sealant: Fibrocaps (ProFibrix) | Raw surface | Not stated | Not stated | Factor being randomised | Not stated | Not stated | Not stated | |
| Fibrin sealant | Oxidised cellulose | Fibrin sealant: Tacchosil | Raw surface | Not stated | Not stated | Factor being randomised | Not stated | Not stated | Not stated | |
| Fibrin sealant | Oxidised cellulose | Fibrin sealant: Fibrin Pad | Raw surface | Not stated | Not stated | Factor being randomised | Not stated | Not stated | Not stated | |
| Fibrin sealant | Oxidised cellulose | Fibrin sealant: Tachosil (Nycomed) | Raw surface | Varied | Not stated | Factor being randomised | Not stated | Not stated | Not stated | |
| Fibrin sealant | Oxidised cellulose | Oxidised cellulose: Surgicel (Ethicon Inc) | Raw surface | Not stated | Clamp‐crush method | Factor being randomised | Not stated | Not stated | Not stated | |
| Fibrin sealant | PlasmaJet coagulator | Fibrin sealant: fibrin glue (no further details) | Raw surface | Not stated | Cavitron ultrasonic surgical aspirator | Factor being randomised | Not stated | Not stated | Not stated | |
| Fibrin sealant plus collagen | Control | Fibrin sealant spray: Tissucol | Raw surface | Intermittent portal triad or selective clamping | Cavitron ultrasonic surgical aspirator | Factor being randomised | Not stated | Not stated | Not stated | |
| Continuous portal triad clamping | Continuous hepatic vascular exclusion | Hepatic vascular exclusion by encircling the entire retrohepatic inferior vena cava | Vascular occlusion | Factor being randomised | Clamp‐crush or cavitron ultrasonic surgical aspirator | Fibrin glue used | Not stated | Not stated | Not stated | |
| Continuous portal triad clamping | Continuous hepatic vascular exclusion | Hepatic vascular exclusion by encircling the entire infrahepatic inferior vena cava | Vascular occlusion | Factor being randomised | Clamp‐crush method | Not stated | Not stated | Not stated | Not stated | |
| Continuous portal triad clamping | Continuous selective hepatic vascular exclusion | — | Vascular occlusion | Factor being randomised | Not stated | Not stated | Not stated | Low central venous pressure | Not stated | |
| Continuous portal triad clamping | Continuous selective portal triad clamping | — | Vascular occlusion | Factor being randomised | Clamp‐crush method | Not stated | Not stated | Low central venous pressure | Not stated | |
| Continuous portal triad clamping | Control | — | Vascular occlusion | Factor being randomised | Not stated | Not stated | Not stated | Not stated | Not stated | |
| Continuous portal triad clamping | Control | Note: After every 1 hour of continuous portal triad clamping (or 30 minutes for cirrhotic patients), the clamp was released for 10 minutes before reclamping | Vascular occlusion | Factor being randomised | Not stated | Not stated | Not stated | Not stated | Not stated | |
| Continuous portal triad clamping | Control | — | Vascular occlusion | Factor being randomised | Not stated | Not stated | Not stated | Not stated | Not stated | |
| Continuous portal triad clamping | Control | — | Vascular occlusion | Factor being randomised | Not stated | Not stated | Not stated | Not stated | Not stated | |
| Continuous portal triad clamping | Intermittent portal triad clamping | Continuous portal triad clamping: until end of transection | Vascular occlusion | Factor being randomised | Cavitron ultrasonic surgical aspirator | Not stated | Not stated | Low central venous pressure | Not stated | |
| Continuous portal triad clamping | Intermittent portal triad clamping | Intermittent portal triad clamping: 15 minutes on and 5 minutes off | Vascular occlusion | Factor being randomised | Clamp‐crush | Fibrin glue used | Not stated | Not stated | Not stated | |
| Continuous selective portal triad clamping | Intermittent portal triad clamping | Intermittent portal triad clamping: 20 minutes on and 5 minutes off | Vascular occlusion | Factor being randomised | Clamp crush | Not stated | None | Not stated | Not stated | |
| Intermittent portal triad clamping | Control | Intermittent portal triad clamping: 15 minutes on and 5 minutes off | Vascular occlusion | Factor being randomised | Clamp‐crush or bipolar dissecting sealer | Not stated | Not stated | Low central venous pressure | Not stated | |
| Intermittent portal triad clamping | Control | Intermittent portal triad clamping: 15 minutes on and 5 minutes off | Vascular occlusion | Factor being randomised | Cavitron ultrasonic surgical aspirator | Fibrin glue used | Not stated | Low central venous pressure | Not stated | |
| Intermittent portal triad clamping | Control | Intermittent portal triad clamping: 20 minutes on and 5 minutes off | Vascular occlusion | Factor being randomised | Cavitron ultrasonic surgical aspirator | Not stated | Not stated | Not stated | Not stated | |
| Intermittent portal triad clamping | Control | Intermittent portal triad clamping: 20 minutes on and 5 minutes off (until resection is completed or a maximum of 6 cycles) | Vascular occlusion | Factor being randomised | Not stated | Not stated | Not stated | Not stated | Not stated | |
| Intermittent portal triad clamping | Control | Intermittent portal triad clamping: 15 minutes on and 5 minutes off | Vascular occlusion | Factor being randomised | Not stated | Not stated | Not stated | Not stated | Not stated | |
| Intermittent portal triad clamping | Intermittent selective portal triad clamping | Intermittent clamping: 15 minutes on and 5 minutes off | Vascular occlusion | Factor being randomised | Not stated | Not stated | Not stated | Not stated | Not stated | |
| Intermittent portal triad clamping | Intermittent selective portal triad clamping | Intermittent portal triad clamping: 15 minutes on and 5 minutes off | Vascular occlusion | Factor being randomised | Clamp‐crush method | Not stated | Not stated | Not stated | Not stated | |
Two trials compared anterior approach versus conventional approach (Liu 2006; Capussotti 2012). Two trials compared autologous blood donation versus control (Kajikawa 1994; Kostopanagiotou 2007). Ten trials compared different methods of cardiopulmonary interventions (Hasegawa 2002; Matot 2002; El‐Kharboutly 2004; Wang 2006; Yao 2006; Choi 2007; Jarnagin 2008; Kato 2008; Guo 2013; Guo 2014). Twelve trials different compared methods of parenchymal transection (Takayama 2001; Rau 2001; Arita 2005; Koo 2005; Lesurtel 2005; Smyrniotis 2005; Lupo 2007; Ikeda 2009; Doklestic 2012; Savlid 2013; Muratore 2014; Rahbari 2014). Seventeen trials compared different methods of dealing with raw surface (Kohno 1992; Liu 1993; Noun 1996; Chapman 2000; Frilling 2005; Franceschi 2006; Figueras 2007; Fischer 2011; Gugenheim 2011; De Boer 2012; Porte 2012; Kakaei 2013; Koea 2013; Ollinger 2013; Bektas 2014; Genyk 2014; Moench 2014). Eighteen trials compared different methods of vascular occlusion (Belghiti 1996; Clavien 1996; Man 1997; Belghiti 1999; Wu 2002; Capussotti 2003; Man 2003; Chouker 2004; Figueras 2005; Capussotti 2006; Chen 2006; Liang 2009; Dayangac 2010; Pietsch 2010; Lee 2012; Park 2012; Ni 2013; Si‐Yuan 2014). Six trials compared different pharmacological interventions (Shimada 1994; Lentschener 1997; Wong 2003; Lodge 2005; Shao 2006; Wu 2006).
All the trials assessed different methods of open liver resection. Four trials were three‐armed trials (Yao 2006; Doklestic 2012; Kakaei 2013; Guo 2014), one trial was a four‐armed trial of which we included three arms (Lesurtel 2005), and the remaining trials were two‐armed trials. The 67 trials involved a total of 6197 participants. After exclusion of 133 participants after randomisation and 293 participants in three trials that did not provide any information about the outcomes included in this review (Franceschi 2006; Porte 2012; Koea 2013), we included 5771 participants who contributed to one or more outcomes of interest in this review.
Excluded studies
Of the 64 excluded studies, we excluded 6 because they were comments on included or excluded studies (Gonzalez 2009; Petras 2009; Schilling 2009; Strobel 2012; Strobel 2014; Hamady 2015); 19 because they were not randomised clinical trials (Le Treut 1995; Man 2002; Yin 2003; Azoulay 2005; Arru 2007; Kim 2008; Nagano 2009; Wang 2010; Wang 2011; Bellolio 2012; Beppu 2012; Narita 2012; NCT01651182; Palibrk 2012; Yang 2012; Dominioni 2014; Vlad 2014; Li 2015; Takatsuki 2015); 7 because of inadequate randomisation (Rau 1995; Smyrniotis 2002; Smyrniotis 2003a; Smyrniotis 2003b; Richter 2009; Obiekwe 2014; Shu 2014); 6 because they were comparisons of interventions that were not of interest to this review (Figueras 2003; Grobmyer 2009; Harimoto 2011; Levit 2012; Correa‐Gallego 2015; Feldheiser 2015); 18 since they were trials comparing variations within the treatments included in this review (for example, different periods of intermittent vascular occlusion or different methods of achieving low central venous pressure) (Standl 1998; Esaki 2006; Saiura 2006; Chapman 2007; Hashimoto 2007; Kim 2007; Torzilli 2008; El‐Moghazy 2009; Ryu 2010; Broek 2011; Rahbari 2011; Dello 2012; Zhu 2012; Frankel 2013; Kaibori 2013; Yang 2013; Saiura 2014; Zhang 2014); and 8 because the co‐interventions were not used equally in the intervention and control (Schwartz 2004; Petrowsky 2006; Smyrniotis 2006; Si‐Yuan 2011; Li 2013; Lu 2014; Gotohda 2015; Hanyong 2015).
Risk of bias in included studies
We summarise the risk of bias in the included trials in Figure 2 and Figure 3. Overall, we judged all trials to be at high risk of bias. The risk of bias according to the type of comparison is shown in Table 13.

Risk of bias graph: review authors' judgements about each risk of bias item presented as percentages across all included studies.
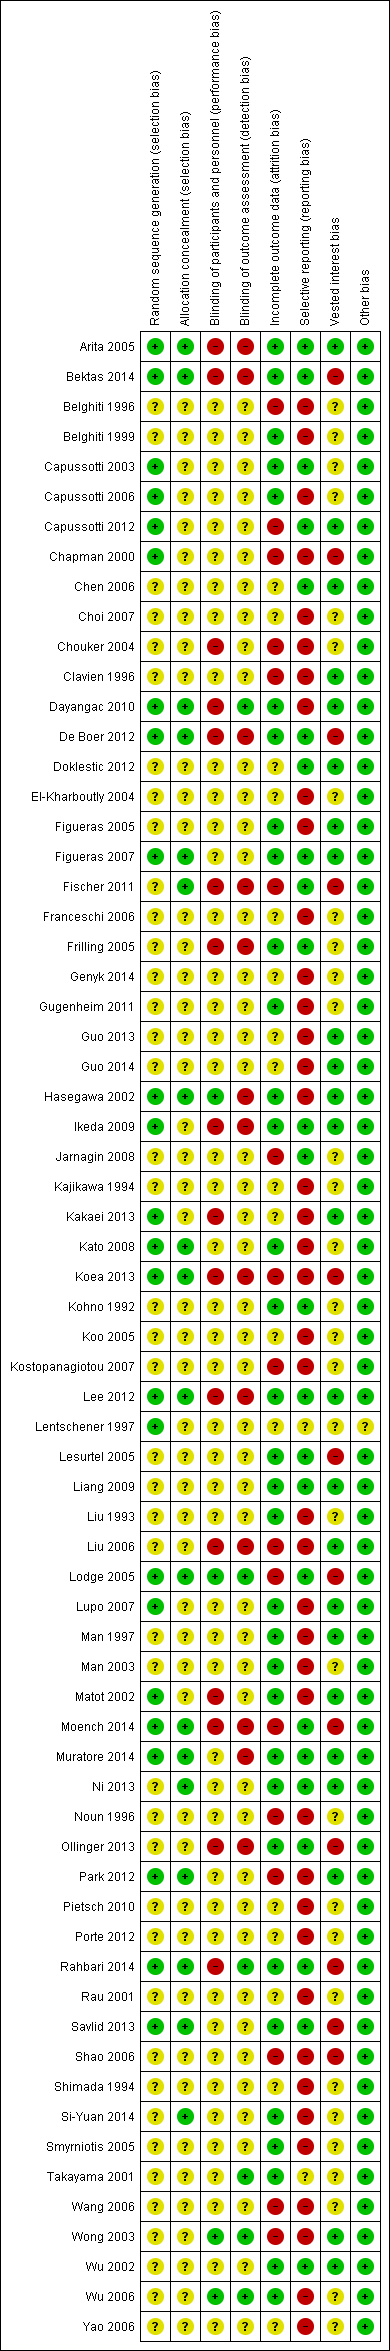
Risk of bias summary: review authors' judgements about each risk of bias item for each included study.
| Study | Intervention | Control | Sequence generation | Allocation concealment | Blinding of participants and healthcare providers | Blinding of outcome assessors | Missing outcome bias | Selective reporting bias | Source of funding bias | Other bias | Overall risk of bias |
| Anterior approach | Control | Low | Unclear | Unclear | Unclear | High | Low | Low | Low | Unclear or high | |
| Anterior approach | Control | Unclear | Unclear | High | High | High | High | Low | Low | Unclear or high | |
| Autologous blood donation | Control | Unclear | Unclear | Unclear | Unclear | Unclear | High | Unclear | Low | Unclear or high | |
| Autologous blood donation | Control | Unclear | Unclear | Unclear | Unclear | High | High | Unclear | Low | Unclear or high | |
| Acute normovolemic haemodilution plus low central venous pressure | Control | Unclear | Unclear | Unclear | Unclear | Unclear | High | Low | Low | Unclear or high | |
| Acute normovolemic haemodilution plus low central venous pressure | Low central venous pressure | Unclear | Unclear | Unclear | Unclear | High | Low | Unclear | Low | Unclear or high | |
| Acute normovolemic haemodilution plus low central venous pressure | Low central venous pressure | Low | Unclear | High | Unclear | Low | High | Low | Low | Unclear or high | |
| Acute normovolemic haemodilution | Acute normovolemic haemodilution with hypotension | Unclear | Unclear | Unclear | Unclear | Unclear | High | Unclear | Low | Unclear or high | |
| Hypoventilation | Control | Low | Low | Low | High | Low | High | Low | Low | Unclear or high | |
| Low central venous pressure | Control | Unclear | Unclear | Unclear | Unclear | Unclear | High | Unclear | Low | Unclear or high | |
| Low central venous pressure | Control | Unclear | Unclear | Unclear | Unclear | Unclear | High | Unclear | Low | Unclear or high | |
| Low central venous pressure | Control | Low | Low | Unclear | Unclear | Low | High | Unclear | Low | Unclear or high | |
| Low central venous pressure | Control | Unclear | Unclear | Unclear | Unclear | High | High | Unclear | Low | Unclear or high | |
| Low central venous pressure | Low central venous pressure + acute normovolemic haemodilution. | Unclear | Unclear | Unclear | Unclear | Unclear | High | Low | Low | Unclear or high | |
| Stapler | Clamp‐crush method | Low | Low | High | Low | Low | Low | High | Low | Unclear or high | |
| Cavitron ultrasonic surgical aspirator | Clamp‐crush method | Unclear | Unclear | Unclear | Unclear | Unclear | High | Unclear | Low | Unclear or high | |
| Cavitron ultrasonic surgical aspirator | Clamp‐crush method | Unclear | Unclear | Unclear | Unclear | Low | Low | Unclear | Low | Unclear or high | |
| Cavitron ultrasonic surgical aspirator | Clamp‐crush method. | Unclear | Unclear | Unclear | Unclear | Unclear | Low | Low | Low | Unclear or high | |
| Cavitron ultrasonic surgical aspirator | Hydrojet | Unclear | Unclear | Unclear | Unclear | Unclear | High | Unclear | Low | Unclear or high | |
| Cavitron ultrasonic surgical aspirator | Stapler | Low | Low | Unclear | Unclear | Low | Low | High | Low | Unclear or high | |
| Cavitron ultrasonic surgical aspirator | Radiofrequency dissecting sealer. | Unclear | Unclear | Unclear | Unclear | Low | Low | High | Low | Unclear or high | |
| Radiofrequency dissecting sealer | Clamp‐crush method | Low | Unclear | High | High | Low | Low | Low | Low | Unclear or high | |
| Radiofrequency dissecting sealer | Clamp‐crush method | Low | Unclear | Unclear | Unclear | Low | High | Low | Low | Unclear or high | |
| Radiofrequency dissecting sealer | Clamp‐crush method | Low | Low | Unclear | High | Low | Low | Low | Low | Unclear or high | |
| Radio‐frequency dissecting sealer | Clamp‐crush method | Low | Low | High | High | Low | Low | Low | Low | Unclear or high | |
| Sharp transection | Clamp‐crush method | Unclear | Unclear | Unclear | Unclear | Low | High | Unclear | Low | Unclear or high | |
| Anti‐thrombin III concentrate | Control | Unclear | Unclear | Unclear | Unclear | Unclear | High | Unclear | Low | Unclear or high | |
| Aprotinin | Control | Low | Unclear | Unclear | Low | High | High | High | Low | Unclear or high | |
| Desmopressin | Control | Unclear | Unclear | Low | Low | High | High | Low | Low | Unclear or high | |
| Recombinant factor VIIa | Control | Low | Low | Low | Low | High | Low | High | Low | Unclear or high | |
| Recombinant factor VIIa | Control | Unclear | Unclear | Unclear | Unclear | High | High | High | Low | Unclear or high | |
| Tranexamic acid | Control | Unclear | Unclear | Low | Low | Low | High | Unclear | Low | Unclear or high | |
| Collagen | Fibrin sealant | Low | Unclear | Unclear | Unclear | High | High | High | Low | Unclear or high | |
| Collagen | Fibrin sealant | Unclear | Unclear | Unclear | Unclear | Unclear | High | Unclear | Low | Unclear or high | |
| Collagen | Fibrin sealant | Unclear | Unclear | Unclear | Unclear | Low | Low | Unclear | Low | Unclear or high | |
| Collagen | Fibrin sealant | Low | Low | High | High | High | Low | High | Low | Unclear or high | |
| Fibrin sealant | Argon beam coagulator | Unclear | Low | High | High | High | Low | High | Low | Unclear or high | |
| Fibrin sealant | Argon beam coagulator | Unclear | Unclear | High | High | Low | Low | Unclear | Low | Unclear or high | |
| Fibrin sealant | Control | Low | Low | High | High | Low | Low | High | Low | Unclear or high | |
| Fibrin sealant | Control | Low | Low | High | High | Low | Low | High | Low | Unclear or high | |
| Fibrin sealant | Control | Unclear | Unclear | Unclear | Unclear | Low | High | Unclear | Low | Unclear or high | |
| Fibrin sealant | Control | Unclear | Unclear | Unclear | Unclear | High | High | Unclear | Low | Unclear or high | |
| Fibrin sealant | Gelatin | Unclear | Unclear | Unclear | Unclear | Unclear | High | Unclear | Low | Unclear or high | |
| Fibrin sealant | Oxidised cellulose | Unclear | Unclear | Unclear | Unclear | Unclear | High | Unclear | Low | Unclear or high | |
| Fibrin sealant | Oxidised cellulose | Low | Low | High | High | High | High | High | Low | Unclear or high | |
| Fibrin sealant | Oxidised cellulose | Unclear | Unclear | High | High | Low | Low | High | Low | Unclear or high | |
| Fibrin sealant | Oxidised cellulose | Low | Unclear | High | Unclear | Unclear | High | Low | Low | Unclear or high | |
| Fibrin sealant | PlasmaJet coagulator | Unclear | Unclear | Unclear | Unclear | Low | High | Unclear | Low | Unclear or high | |
| Fibrin sealant plus collagen | Control | Low | Low | Unclear | Unclear | Low | Low | Low | Low | Unclear or high | |
| Continuous portal triad clamping | Continuous hepatic vascular exclusion | Unclear | Unclear | Unclear | Unclear | High | High | Unclear | Low | Unclear or high | |
| Continuous portal triad clamping | Continuous hepatic vascular exclusion | Unclear | Unclear | Unclear | Unclear | Unclear | Low | Low | Low | Unclear or high | |
| Continuous portal triad clamping | Continuous selective hepatic vascular exclusion | Unclear | Low | Unclear | Unclear | Low | High | Unclear | Low | Unclear or high | |
| Continuous portal triad clamping | Continuous selective portal triad clamping | Unclear | Low | Unclear | Unclear | Low | Low | Low | Low | Unclear or high | |
| Continuous portal triad clamping | Control | Unclear | Unclear | High | Unclear | High | High | Unclear | Low | Unclear or high | |
| Continuous portal triad clamping | Control | Unclear | Unclear | Unclear | Unclear | High | High | Low | Low | Unclear or high | |
| Continuous portal triad clamping | Control | Low | Low | High | Low | Low | High | Low | Low | Unclear or high | |
| Continuous portal triad clamping | Control | Unclear | Unclear | Unclear | Unclear | Unclear | High | Unclear | Low | Unclear or high | |
| Continuous portal triad clamping | Intermittent portal triad clamping | Unclear | Unclear | Unclear | Unclear | Low | High | Unclear | Low | Unclear or high | |
| Continuous portal triad clamping | Intermittent portal triad clamping | Low | Unclear | Unclear | Unclear | Low | Low | Unclear | Low | Unclear or high | |
| Continuous selective portal triad clamping | Intermittent portal triad clamping | Unclear | Unclear | Unclear | Unclear | Low | Low | Low | Low | Unclear or high | |
| Intermittent portal triad clamping | Control | Low | Unclear | Unclear | Unclear | Low | High | Unclear | Low | Unclear or high | |
| Intermittent portal triad clamping | Control | Low | Low | High | High | Low | Low | Low | Low | Unclear or high | |
| Intermittent portal triad clamping | Control | Unclear | Unclear | Unclear | Unclear | Low | High | Low | Low | Unclear or high | |
| Intermittent portal triad clamping | Control | Unclear | Unclear | Unclear | Unclear | Low | High | Unclear | Low | Unclear or high | |
| Intermittent portal triad clamping | Control | Low | Low | Unclear | Unclear | High | High | Low | Low | Unclear or high | |
| Intermittent portal triad clamping | Intermittent selective portal triad clamping | Unclear | Unclear | Unclear | Unclear | Low | High | Low | Low | Unclear or high | |
| Intermittent portal triad clamping | Intermittent selective portal triad clamping | Unclear | Unclear | Unclear | Unclear | Low | Low | Low | Low | Unclear or high |
Allocation
Twenty‐four trials (35.8%) were at low risk of bias in the 'sequence generation' domain (Lentschener 1997; Chapman 2000; Hasegawa 2002; Matot 2002; Capussotti 2003; Arita 2005; Lodge 2005; Capussotti 2006; Figueras 2007; Lupo 2007; Kato 2008; Ikeda 2009; Dayangac 2010; Capussotti 2012; De Boer 2012; Lee 2012; Park 2012; Kakaei 2013; Koea 2013; Savlid 2013; Bektas 2014; Moench 2014; Muratore 2014; Rahbari 2014). Eighteen trials (26.9%) were at low risk of bias in the 'allocation concealment' domain (Hasegawa 2002; Arita 2005; Lodge 2005; Figueras 2007; Kato 2008; Dayangac 2010; Fischer 2011; De Boer 2012; Lee 2012; Park 2012; Koea 2013; Ni 2013; Savlid 2013; Bektas 2014; Moench 2014; Muratore 2014; Rahbari 2014; Si‐Yuan 2014). Fifteen trials (22.4%) were at low risk of bias in the 'both sequence generation and allocation concealment' domains and were free from selection bias (Hasegawa 2002; Arita 2005; Lodge 2005; Figueras 2007; Kato 2008; Dayangac 2010; De Boer 2012; Lee 2012; Park 2012; Koea 2013; Savlid 2013; Bektas 2014; Moench 2014; Muratore 2014; Rahbari 2014).
Blinding
Four trials (6.0%) were at low risk of bias in the 'blinding of participants and healthcare providers' domain (Hasegawa 2002; Wong 2003; Lodge 2005; Wu 2006). Six trials (9.0%) were at low risk of bias in the 'blinding of outcome assessors' domain (Lentschener 1997; Wong 2003; Lodge 2005; Wu 2006; Dayangac 2010; Rahbari 2014). Three trials (4.5%) were at low risk of bias in both the 'blinding of participants and healthcare providers' and 'blinding of outcome assessors' domains and were free from performance and detection bias (Wong 2003; Lodge 2005; Wu 2006).
Incomplete outcome data
Thirty‐three trials (49.3%) were at low risk of bias in the 'missing outcome bias' domain (Kohno 1992; Liu 1993; Man 1997; Belghiti 1999; Takayama 2001; Hasegawa 2002; Matot 2002; Wu 2002; Capussotti 2003; Man 2003; Arita 2005; Figueras 2005; Frilling 2005; Lesurtel 2005; Smyrniotis 2005; Capussotti 2006; Wu 2006; Figueras 2007; Lupo 2007; Kato 2008; Ikeda 2009; Liang 2009; Dayangac 2010; Gugenheim 2011; De Boer 2012; Lee 2012; Ni 2013; Ollinger 2013; Savlid 2013; Bektas 2014; Muratore 2014; Rahbari 2014; Si‐Yuan 2014).
Selective reporting
Twenty‐five trials (37.3%) reported mortality and serious adverse events and hence were considered to be at low risk of bias in the 'selective reporting bias' domain (Kohno 1992; Takayama 2001; Wu 2002; Capussotti 2003; Arita 2005; Frilling 2005; Lesurtel 2005; Lodge 2005; Chen 2006; Figueras 2007; Jarnagin 2008; Ikeda 2009; Liang 2009; Fischer 2011; Capussotti 2012; De Boer 2012; Doklestic 2012; Lee 2012; Ni 2013; Ollinger 2013; Savlid 2013; Bektas 2014; Moench 2014; Muratore 2014; Rahbari 2014).
Other potential sources of bias
Twenty‐four trials (35.8%) were at low risk of bias in the 'source of funding bias' domain (Clavien 1996; Man 1997; Hasegawa 2002; Matot 2002; Wu 2002; Wong 2003; Arita 2005; Figueras 2005; Chen 2006; Liu 2006; Figueras 2007; Lupo 2007; Ikeda 2009; Liang 2009; Dayangac 2010; Capussotti 2012; Doklestic 2012; Lee 2012; Park 2012; Guo 2013; Kakaei 2013; Ni 2013; Guo 2014; Muratore 2014).
We did not identify any other bias in the trials.
Effects of interventions
See: Summary of findings for the main comparison
We provide the data used in network meta‐analysis in Appendix 3; the data used for direct comparisons in Data and analyses; and the overall results in summary of findings Table for the main comparison, Appendix 9, and Appendix 10. We present the data in the following format for each comparison.
-
Outcome.
-
Different methods of measuring the outcome.
-
Direct comparison.
-
Network meta‐analysis (when applicable).
-
Differences between direct comparison and network meta‐analysis (when applicable).
-
-
-
Differences between Bayesian and frequentist meta‐analysis.
-
An overall summary for the comparison.
In addition, we also provide an overall summary for each outcome across all interventions at the end.
Anterior approach versus conventional approach
Two trials compared anterior approach versus conventional approach (Liu 2006; Capussotti 2012). Since this comparison only involved two treatments, we did not perform network meta‐analysis.
Quality of evidence
The quality of evidence was very low for all the outcomes. This was because of high risk of bias in the trials (downgraded by one point), imprecision due to small sample size (downgraded by one point), and wide credible intervals for all outcomes (downgraded by one point) as well as considerable heterogeneity for blood transfusion (proportion) and major blood loss (proportion) (downgraded by two points).
Mortality
Mortality (perioperative)
Two trials reported perioperative mortality (Liu 2006; Capussotti 2012). The unadjusted proportions of perioperative mortality are as follows.
-
Conventional approach: 7/92 (7.6%).
-
Anterior approach: 2/93 (2.2%).
Based on the DIC, we chose the fixed‐effect model. There was no evidence of differences in perioperative mortality between the two groups (OR 0.23, 95% CrI 0.03 to 1.08; 185 participants; 2 studies).
Mortality (longest follow‐up)
None of the trials reported this outcome.
Adverse events
Serious adverse events (proportion)
One trial reported serious adverse events as a proportion of participants who experienced one or more (Capussotti 2012). The unadjusted proportions of serious adverse events are as follows.
-
Conventional approach: 4/32 (12.5%).
-
Anterior approach: 5/33 (15.2%).
There was no evidence of differences in the proportion of participants experiencing serious adverse events between the two groups (OR 1.27, 95% CrI 0.29 to 5.89; 65 participants; 1 study).
Serious adverse events (number)
None of the trials reported this outcome.
Adverse events (proportion)
Two trials reported adverse events as a proportion (Liu 2006; Capussotti 2012). The unadjusted proportions of adverse events are as follows.
-
Conventional approach: 33/92 (35.9%).
-
Anterior approach: 31/93 (33.3%).
Based on the DIC, we chose the fixed‐effect model. There was no evidence of differences in the proportion of participants experiencing adverse events between the two groups (OR 0.89, 95% CrI 0.48 to 1.64; 185 participants; 2 studies).
Adverse events (number)
One trial reported the number of adverse events (Capussotti 2012). The unadjusted rates of adverse events (number) are as follows.
-
Conventional approach: 18/32 (56.3 per 100 participants).
-
Anterior approach: 17/33 (51.5 per 100 participants).
There was no evidence of differences in the number of adverse events between the two groups (rate ratio 0.91, 95% CrI 0.47 to 1.78; 65 participants; 2 studies).
Health‐related quality of life
None of the trials reported this outcome at any time point.
Blood transfusion requirements
Blood transfusion (proportion)
Two trials reported blood transfusion as a proportion of participants requiring one (Liu 2006; Capussotti 2012). The unadjusted proportions of participants receiving a blood transfusion are as follows.
-
Conventional approach: 20/92 (21.7%).
-
Anterior approach: 10/93 (10.8%).
Based on the DIC, we chose the random‐effects model. The between‐study standard deviation was 2.60. There was no evidence of differences in the proportion of participants receiving a blood transfusion between the two groups (OR 0.57, 95% CrI 0.01 to 50.91; 185 participants; 2 studies).
Blood transfusion (quantity)
None of the trials reported the quantity of blood transfusion in red blood cells, platelets, fresh frozen plasma, or cryoprecipitate.
Blood loss
Two trials reported blood loss (Liu 2006; Capussotti 2012). The median blood loss reported for each treatment in the two trials are as follows.
-
Conventional approach: 0.5 L and 1 L.
-
Anterior approach: 0.437 L and 0.8 L.
We did not perform meta‐analysis since both trials reported the median blood loss rather than the mean and standard deviation of blood loss. There was no evidence of differences in blood loss in either trial (Liu 2006; Capussotti 2012).
Major blood loss (proportion)
Two trials reported major blood loss as a proportion of participants experiencing it (Liu 2006; Capussotti 2012). One trial defined major blood loss as more than one litre of blood loss (Capussotti 2012), while the other trial defined it as more than two litres (Liu 2006). The unadjusted proportions of major blood loss (proportion) are as follows.
-
Conventional approach: 22/92 (23.9%).
-
Anterior approach: 12/93 (12.9%).
Based on the DIC, we chose the random‐effects model. The between‐study standard deviation was 2.3. There was no evidence of differences in the proportion of participants experiencing major blood loss between the two groups (OR 0.54, 95% CrI 0.01 to 34.54; 185 participants; 2 studies).
Hospital stay
Total hospital stay
Two trials reported hospital stay (Liu 2006; Capussotti 2012). The median hospital stay reported for each treatment in the two trials are as follows.
-
Conventional approach: 11.5 days (d) and 12.5 d.
-
Anterior approach: 10 d and 11 d.
We did not perform meta‐analysis since both trials reported the median hospital stay rather than the mean and standard deviation of hospital stay. There was no evidence of differences in hospital stay in either trial (Liu 2006; Capussotti 2012).
Intensive therapy unit (ITU) stay
One trial reported ITU stay (Liu 2006). The median ITU stay reported for each treatment is as follows.
-
Conventional approach: 2 d.
-
Anterior approach: 1.5 d.
We did not perform meta‐analysis since the trial reported the median ITU stay rather than the mean and standard deviation of ITU stay. There was no evidence of differences in ITU stay in this trial (Liu 2006).
Operating time
Two trials reported operating time (Liu 2006; Capussotti 2012). The median operating times reported for each treatment are as follows.
-
Conventional approach: 312.8 minutes (min) and 415 min.
-
Anterior approach: 295.8 min and 420 min.
We did not perform meta‐analysis since both trials reported the median operating time rather than the mean and standard deviation of operating time. There was no evidence of differences in operating time in either trial.
Time needed to return to work
None of the trials reported this outcome.
Difference between Bayesian and frequentist meta‐analysis
The interpretation of information and conclusions did not alter by using the frequentist meta‐analysis.
Overall summary
There was no evidence of differences between the anterior approach and conventional approach in any of the reported outcomes of interest for this review.
Autologous blood donation versus control
Two trials compared autologous blood donation versus control (Kajikawa 1994; Kostopanagiotou 2007). As this comparison only included two treatments, we did not perform network meta‐analysis.
Quality of evidence
The quality of evidence was very low for all the outcomes and comparisons unless specifically indicated within the results. This was because of unclear or high risk of bias in the trials (downgraded by one point), imprecision due to small sample size (downgraded by one point), and wide credible intervals (downgraded by one point) for all outcomes with very low quality of evidence.
Mortality
Mortality (perioperative)
One trial (28 participants) reported perioperative mortality (Kostopanagiotou 2007); there was none in either group.
Mortality (longest follow‐up)
One trial (28 participants) reported mortality at longest follow‐up (Kostopanagiotou 2007). There was no mortality in either group after a follow‐up period of one year.
Adverse events
Serious adverse events (proportion)
None of the trials reported this outcome.
Serious adverse events (number)
None of the trials reported this outcome.
Adverse events (proportion)
One trial reported adverse events as a proportion of participants experiencing at least one (Kostopanagiotou 2007). The unadjusted proportions of participants experiencing an adverse event are as follows.
-
Control: 5/13 (38.5%).
-
Autologous blood donation: 5/15 (33.3%).
There was no evidence of differences in the proportion of participants experiencing adverse events between groups (OR 0.79, 95% CrI 0.15 to 3.98; 28 participants; 1 study).
Adverse events (number)
None of the trials reported this outcome.
Health‐related quality of life
None of the trials reported this outcome at any time point.
Blood transfusion requirements
Blood transfusion (proportion)
One trial reported the proportion of participants requiring a blood transfusion (Kajikawa 1994). The unadjusted proportions are as follows.
-
Control: 13/21 (61.9%).
-
Autologous blood donation: 5/21 (23.8%).
The proportion of participants requiring a blood transfusion was lower in the autologous blood donation group than in the control (OR 0.18, 95% CrI 0.04 to 0.66; 42 participants; 1 study; low‐quality evidence: downgraded one point for unclear or high risk of bias and one point for small sample size).
Blood transfusion (red blood cells)
One trial reported blood transfusion quantity in red blood cells (Kostopanagiotou 2007). The mean blood transfusion quantities reported for each treatment are as follows.
-
Control: 1.7 units.
-
Autologous blood donation: 1.6 units.
There was no evidence of differences in blood transfusion quantity (red blood cells) between the groups (MD −0.10 units, 95% CrI −0.59 to 0.38; 28 participants; 1 study).
Blood transfusion (platelets)
None of the trials reported this outcome.
Blood transfusion (fresh frozen plasma)
None of the trials reported this outcome.
Blood transfusion (cryoprecipitate)
None of the trials reported this outcome.
Blood loss
Two trials reported blood loss (Kajikawa 1994; Kostopanagiotou 2007). The mean blood loss reported for each treatment are as follows.
-
Control: 0.78 L and 1.193 L
-
Autologous blood donation: 0.68 L and 1.272 L
Based on the DIC, we chose the fixed‐effect model. There was no evidence of differences in blood loss between the groups (MD −0.02 L, 95% CrI −0.37 to 0.34; 70 participants; 2 studies).
Major blood loss (proportion)
One trial reported the proportion of participants experiencing major blood loss, defined as the loss of more than two litres (Kajikawa 1994). The unadjusted proportions of participants with major blood loss are as follows.
-
Control: 2/21 (9.5%).
-
Autologous blood donation: 4/21 (19.0%).
There was no evidence of differences in the proportion of participants experiencing major blood loss between the groups (OR 2.44, 95% CrI 0.39 to 21.5; 42 participants; 1 study).
Hospital stay
Total hospital stay
One trial reported total hospital stay (Kostopanagiotou 2007). The mean hospital stays reported for each treatment are as follows.
-
Control: 10 d.
-
Autologous blood donation: 11 d.
There was no evidence of differences in hospital stay between the groups (MD 0.99 d, 95% CrI −0.92 to 2.91; 28 participants; 1 study).
ITU stay
None of the trials reported this outcome.
Operating time
Two trials reported operating time (Kajikawa 1994; Kostopanagiotou 2007). The mean operating times reported for each treatment are as follows.
-
Control: 190 min and 290 min.
-
Autologous blood donation: 175 min and 318 min.
Based on the DIC, we chose the fixed‐effect model. There was no evidence of differences in operating times between the groups (MD 1.78 min, 95% CrI −28.13 to 31.68; 70 participants; 2 studies).
Time needed to return to work
None of the trials reported this outcome.
Difference between Bayesian and frequentist meta‐analysis
The interpretation of information and conclusions did not alter by using the frequentist meta‐analysis.
Overall summary
There was no evidence of difference between autologous blood donation and control in any of the reported outcomes of interest for this review other than the proportion of people who required blood transfusion, which was lower in the autologous blood donation group than control (OR 0.18, 95% CrI 0.04 to 0.66; 42 participants; 1 study).
Cardiopulmonary interventions
Ten trials compared different methods of cardiopulmonary interventions (Hasegawa 2002; Matot 2002; El‐Kharboutly 2004; Wang 2006; Yao 2006; Choi 2007; Jarnagin 2008; Kato 2008; Guo 2013; Guo 2014). We performed network meta‐analysis only for blood transfusion quantity (red blood cells) and blood loss since direct comparison and indirect comparison effect estimates (which would enable assessment of inconsistency) were available only for these outcomes. We present only direct comparison results for other outcomes.
Quality of evidence
The quality of evidence was very low for all the outcomes and comparisons unless specifically indicated within the results. This was because of unclear or high risk of bias in the trials (downgraded by one point), imprecision due to small sample size (downgraded by one point), and wide credible intervals (downgraded by one point) for all outcomes with very low quality of evidence.
Mortality
Mortality (perioperative)
Four trials reported perioperative mortality (Hasegawa 2002; Matot 2002; Jarnagin 2008; Kato 2008). These studies used four treatments in 372 participants. The unadjusted proportions of perioperative mortality are as follows.
-
Control: 0/81 (0.0%).
-
Acute normovolemic haemodilution plus low central venous pressure: 1/102 (1.0%).
-
Hypoventilation: 0/40 (0.0%).
-
Low central venous pressure: 3/149 (2.0%).
There was no evidence of differences in perioperative mortality for any of the comparisons.
Mortality (longest follow‐up)
None of the trials reported this outcome.
Adverse events
Serious adverse events (proportion)
Two trials reported the proportion of participants experiencing serious adverse events (Hasegawa 2002; Jarnagin 2008). A total of four treatments were used in a total of 209 participants in these studies. The unadjusted proportions of participants with serious adverse events are as follows.
-
Control: 1/39 (2.6%).
-
Acute normovolemic haemodilution plus low central venous pressure: 19/63 (30.2%).
-
Hypoventilation: 2/40 (5.0%).
-
Low central venous pressure: 19/67 (28.4%).
There was no evidence of differences in the proportion of participants experiencing serious adverse events for any of the comparisons.
Serious adverse events (number)
Two trials reported the total number of serious adverse events (Matot 2002; El‐Kharboutly 2004). These studies used three treatments in 118 participants. The unadjusted rates of serious adverse events (number) are as follows.
-
Control: 2/20 (10.0 per 100 participants).
-
Acute normovolemic haemodilution plus low central venous pressure: 4/39 (10.3 per 100 participants).
-
Low central venous pressure: 3/59 (5.1 per 100 participants).
There was no evidence of differences in the number of serious adverse events observed for any of the comparisons.
Adverse events (proportion)
Four trials reported the proportion of participants experiencing adverse events (Hasegawa 2002; Matot 2002; Wang 2006; Jarnagin 2008). These studies used four treatments in 337 participants. The unadjusted proportions of participants experiencing adverse events are as follows.
-
Control: 19/64 (29.7%).
-
Acute normovolemic haemodilution plus low central venous pressure: 37/102 (36.3%).
-
Hypoventilation: 16/40 (40.0%).
-
Low central venous pressure: 35/131 (26.7%).
There was no evidence of differences in the proportion of participants experiencing adverse events for any of the comparisons.
Adverse events (number)
Two trials reported adverse events (number) (Matot 2002; El‐Kharboutly 2004). These studies used three treatments in 118 participants. The unadjusted rates of adverse events (number) are as follows.
-
Control: 6/20 (30.0 per 100 participants).
-
Acute normovolemic haemodilution plus low central venous pressure: 12/39 (30.8 per 100 participants).
-
Low central venous pressure: 15/59 (25.4 per 100 participants).
There was no evidence of differences in adverse events (number) for any of the comparisons.
Health‐related quality of life
None of the trials reported this outcome at any time point.
Blood transfusion requirements
Blood transfusion (proportion)
Six trials reported the proportion of participants requiring a blood transfusion (Hasegawa 2002; Matot 2002; El‐Kharboutly 2004; Wang 2006; Jarnagin 2008; Kato 2008). These studies used four treatments in 462 participants. The unadjusted proportions of participants requiring a blood transfusion are as follows.
-
Control: 29/126 (23.0%).
-
Acute normovolemic haemodilution plus low central venous pressure: 12/102 (11.8%).
-
Hypoventilation: 3/40 (7.5%).
-
Low central venous pressure: 48/194 (24.7%).
Based on the DIC, we chose the fixed‐effect model. The proportion of participants requiring a blood transfusion was higher in the low central venous pressure group than in the group receiving acute normovolemic haemodilution plus low central venous pressure (OR 3.19, 95% CrI 1.56 to 6.95; 208 participants; 2; low‐quality evidence: downgraded by one point for unclear or high risk of bias in the trials and one more point for small sample size). There was no evidence of differences in other comparisons.
Blood transfusion (red blood cells)
Six trials reported blood transfusion quantity (as red blood cells) (Matot 2002; El‐Kharboutly 2004; Wang 2006; Yao 2006; Jarnagin 2008; Guo 2013), testing five treatments in 358 participants. The median and range of the mean blood transfusion quantity (red blood cells) reported for each treatment are as follows.
-
Control: 1.38 units (range 0.88 to 3.22).
-
Acute normovolemic haemodilution: 0.17 units (range 0.17 to 0.17).
-
Acute normovolemic haemodilution plus hypotension: 0.00 units (range 0.00 to 0.00).
-
Acute normovolemic haemodilution plus low central venous pressure: 0.44 (range 0.00 to 1.15).
-
Low central venous pressure: 0.61 (range 0.00 to 1.31).
Direct comparison
Based on the DIC, we chose the fixed‐effect model. The blood transfusion quantity (in red blood cells) was lower in the group receiving acute normovolemic haemodilution (MD −1.25 units, 95% CrI −1.75 to −0.74; 20 participants; 1 study; low‐quality evidence: downgraded by one point for unclear or high risk of bias in the trials and one more point for small sample size) and acute normovolemic haemodilution plus hypotension (MD −1.67 units, 95% CrI −2.06 to −1.32; 20 participants; 1 study; low‐quality evidence: downgraded by one point for unclear or high risk of bias in the trials and one more point for small sample size) than control.The blood transfusion quantity (red blood cells) was higher inthe acute normovolemic haemodilution plus low central venous pressure group than in the control group (MD 0.27 units, 95% CrI 0.01 to 0.52; 30 participants; 1 study). There was no evidence of differences in other comparisons. We imputed either the mean or standard deviation in two trials (Matot 2002; Jarnagin 2008). Excluding these trials did not alter the conclusions.
Network meta‐analysis
We present the network plots in Figure 4. Based on the DIC, we chose the random‐effects model. There was no evidence of differences in blood transfusion quantity (red blood cells) for any of the comparisons. Excluding the trials in which we imputed the mean or standard deviation (Matot 2002; Jarnagin 2008), we could not assess whether the direct and indirect evidence was consistent. We show the probability of each treatment being best, second best, third best, and so on in Figure 5 and the cumulative probability of a treatment being best in Figure 6.
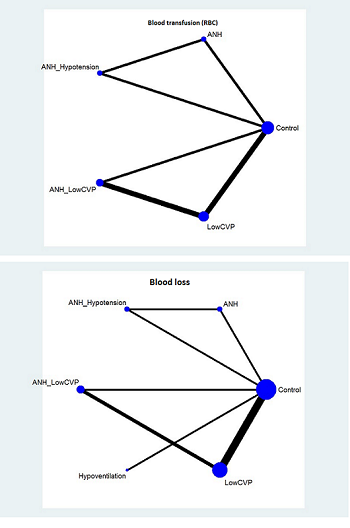
The network plot showing the comparisons in the trials included in the comparison of cardiopulmonary interventions in which network meta‐analysis was performed. The size of the node (circle) provides a measure of the number of trials in which the particular treatment was included as one of the arms. The thickness of the line provides a measure of the number of direct comparisons between two nodes (treatments).
ANH: acute normovolemic haemodilution; CVP: central venous pressure; RBC: red blood cells.

Probability of best treatment: probability of being best, second best, third best, etc. for each treatment for blood transfusion (red blood cells) (cardiopulmonary interventions). A probability of more than 90% is a reliable indicator that a treatment is best with regards to the specific outcome. A probability of less than 90% is less reliable. None of the treatments have a 90% probability of being best treatment.
ANH: acute normovolemic haemodilution; CVP: central venous pressure; RBC: red blood cells.
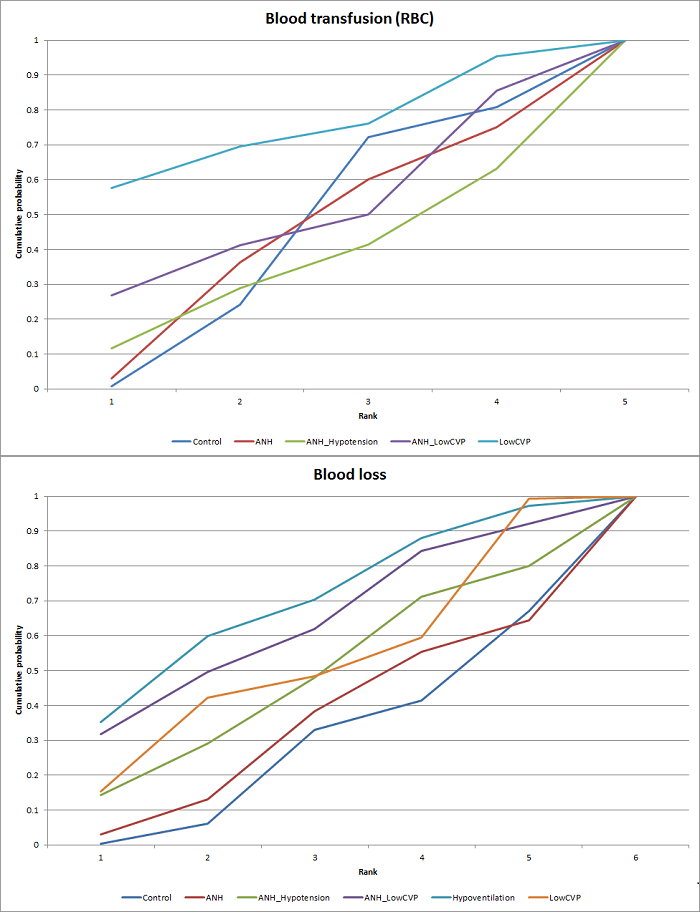
Cumulative probability of being best treatment: cumulative probability of being best for each treatment for cardiopulmonary interventions. Rank 1 indicates the probability that a treatment is best, rank 2 indicates the probability that a treatment is in the two best treatments, rank 3 indicates the probability that a treatment is in the three best treatments, and so on.
ANH: acute normovolemic haemodilution; CVP: central venous pressure; RBC: red blood cells.
Direct evidence compared to network meta‐analysis
We compare the information on direct evidence to network meta‐analysis in Figure 7. The mean effect goes in opposite directions in the indirect and direct estimates, suggesting that there may be discrepancies (incongruence or inconsistency) between direct and indirect estimates. Direct evidence appears to be preferable over indirect evidence and network meta‐analysis based on the quality of evidence.

Cardiopulmonary intervention: blood transfusion (red blood cells)
Forest plot of the comparisons in which direct and indirect estimates were available. The mean effect is in opposite directions in the indirect estimate and the direct estimates, thus suggesting that there may be discrepancies between direct and indirect estimates. Direct evidence appears to be preferable over indirect evidence and network meta‐analysis based on the quality of evidence.
1 Risk of bias was unclear or high in the trial(s) (downgraded by 1 point).
2 Sample size was low (downgraded by 1 point).
3Confidence intervals spanned no effect and clinically significant effect (downgraded by 1 point).
4There was substantial or considerable heterogeneity (downgraded by 2 points).
Blood transfusion (platelets)
None of the trials reported this outcome.
Blood transfusion (fresh frozen plasma)
Two trials reported blood transfusion quantity (as fresh frozen plasma) (Wang 2006; Jarnagin 2008), testing three interventions in 180 participants. The mean blood transfusion quantities (fresh frozen plasma) reported for each treatment are as follows.
-
Control: 4.23 units.
-
Acute normovolemic haemodilution plus low central venous pressure: 0.17 units.
-
Low central venous pressure: 0.28 and 1.75 units.
The blood transfusion quantity (fresh frozen plasma) was lower in the low central venous pressure group than the control group (MD −2.48 units, 95% CrI −3.58 to −1.37; 50 participants; 1 study; low‐quality evidence: downgraded by one point for unclear or high risk of bias in the trials and one more point for small sample size). There was no evidence of differences in the other comparison (low central venous pressure versus acute normovolemic haemodilution plus low central venous pressure) (MD 0.11 units, 95% CrI −0.79 to 1.01; 130 participants; 1 study). We imputed the standard deviation in one of the trials (Jarnagin 2008). Excluding this trial did not alter the outcome.
Blood transfusion (cryoprecipitate)
One trial reported blood transfusion quantity (cryoprecipitate) (Hasegawa 2002). The mean blood transfusion quantities (cryoprecipitate) are as follows.
-
Control: 0.076 units.
-
Hypoventilation: 0.052 units.
There was no evidence of differences in blood transfusion quantity (cryoprecipitate) between the groups (MD −0.02 units, 95% CrI −0.12 to 0.07; 79 participants; 1 study).
Blood loss
Nine trials reported blood loss (Hasegawa 2002; Matot 2002; El‐Kharboutly 2004; Wang 2006; Yao 2006; Choi 2007; Jarnagin 2008; Kato 2008; Guo 2013),testing six interventions in 584 participants. The median and range of the mean blood loss reported for each treatment are as follows.
-
Control: 0.711 L (range 0.584 to 2.329).
-
Acute normovolemic haemodilution: 0.654 L (one trial only).
-
Acute normovolemic haemodilution plus hypotension: 0.404 L (one trial only).
-
Acute normovolemic haemodilution plus low central venous pressure: 0.75 L (range 0.735 to 0.8).
-
Hypoventilation: 0.63 L (one trial only).
-
Low central venous pressure: 0.6445 L (range 0.49 to 0.904).
Direct comparison
Based on the DIC, we chose the fixed‐effect model. The blood loss was lower in the acute normovolemic haemodilution plus hypotension group (MD −0.25 L; 95% CrI −0.37 to −0.13; 20 participants; 1 study) and the low central venous pressure group than in the control (MD −0.34 L, 95% CrI −0.46 to −0.22; 237 participants; 4 studies).The blood loss was lower for acute normovolemic haemodilution plus hypotension than for acute normovolemic haemodilution (MD −0.25 L; 95% CrI −0.40 to −0.10; 20 participants; 1 study). There was no evidence of differences in other comparisons. We imputed either the mean or standard deviation in four trials (Hasegawa 2002; Matot 2002; Jarnagin 2008; Kato 2008). Excluding these trials did not alter the conclusions.
Network meta‐analysis
We present the network plots in Figure 4. Based on the DIC, we chose the random‐effects model. There was no evidence of differences in blood loss for any of the comparisons. Excluding the trials in which we imputed the mean or standard deviation (Hasegawa 2002; Matot 2002; Jarnagin 2008; Kato 2008) meant that there would be no evidence from direct and indirect evidence, which would allow the assessment of whether the direct and indirect evidence was consistent. We show the probability of each treatment being the best, second best, third best, and so on in Figure 8. The cumulative probability of a treatment being best is shown in Figure 6.
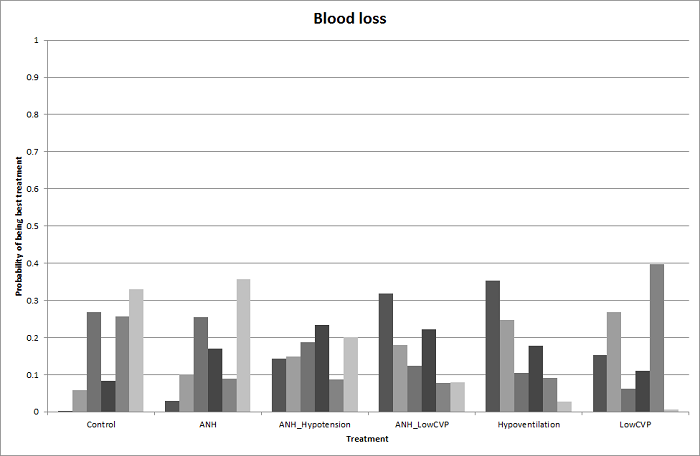
Probability of best treatment: probability of being best, second best, third best, etc. for each treatment for blood loss (cardiopulmonary interventions). A probability of more than 90% is a reliable indicator that a treatment is best with regards to the specific outcome. A probability of less than 90% is less reliable. None of the treatments have a 90% probability of being best treatment.
ANH: acute normovolemic haemodilution; CVP: central venous pressure.
Direct evidence compared to network meta‐analysis
We show the information on direct evidence compared to network meta‐analysis in Figure 9. There does not appear to be any discrepancy between the direct and indirect estimates, although the indirect estimates have wide credible intervals. Direct evidence appears to be preferable over indirect evidence and network meta‐analysis based on the quality of evidence.

Cardiopulmonary intervention: blood loss
Forest plot of the comparisons in which direct and indirect estimates were available. There does not appear to be any discrepancy between the direct and indirect estimates, although the indirect estimates have wide credible intervals.
Direct evidence appears to be preferable over indirect evidence and network meta‐analysis based on the quality of evidence.
ANH: acute normovolemic haemodilution; CVP: central venous pressure.
1Risk of bias was unclear or high in the trial(s) (downgraded by 1 point).
2Sample size was low (downgraded by 1 point).
3Confidence intervals spanned no effect and clinically significant effect (downgraded by 1 point).
4There was substantial or considerable heterogeneity (downgraded by 2 points).
Major blood loss (proportion)
One trial reported the proportion of participants experiencing major blood loss (Jarnagin 2008), defined as more than 0.8 L. The unadjusted proportions of of participants experiencing major blood loss are as follows.
-
Acute normovolemic haemodilution plus low central venous pressure: 33/63 (52.4%).
-
Low central venous pressure: 29/67 (43.3%).
There was no evidence of differences in the proportion of participants experiencing major blood loss between the groups (OR 0.69, 95% CrI 0.34 to 1.38; 130 participants; 1 study).
Hospital stay
Total hospital stay
Five trials reported hospital stay (Hasegawa 2002; Wang 2006; Choi 2007; Jarnagin 2008; Kato 2008). They used four treatments in 406 participants. The median length and range of the mean or median hospital stay reported for each treatment are as follows.
-
Control: 21 d (range 14 to 30).
-
Acute normovolemic haemodilution plus low central venous pressure: 7 d (one trial only).
-
Hypoventilation: 20 d (one trial only).
-
Low central venous pressure: 15 d (range 7 to 26).
Based on the DIC, we chose the fixed‐effect modelwhen there were two or more trials under the comparison. The total hospital stay was lower in the low central venous pressure group than in the control group (MD −2.42 d, 95% CrI −3.91 to −0.94; 197 participants; 3 studies). There was no evidence of differences in the remaining comparisons. In three trials, either the mean or the standard deviation was not available (Hasegawa 2002; Jarnagin 2008; Kato 2008), so we did not perform a meta‐analysis. Exclusion of these three trials did not alter the conclusions.
ITU stay
None of the trials reported this outcome.
Operating time
Seven trials reported operating time (Hasegawa 2002; Matot 2002; El‐Kharboutly 2004; Wang 2006; Choi 2007; Jarnagin 2008; Guo 2014). They used four treatments in 499 participants. The median and range of the mean operating times reported for each treatment are as follows.
-
Control: 246 min (range 190 to 498).
-
Acute normovolemic haemodilution plus low central venous pressure: 255 min (range 179 to 293).
-
Hypoventilation: 498 min (one trial only).
-
Low central venous pressure: 244 min (range 164 to 321).
Based on the DIC, we chose the fixed‐effect model. The operating time was lower in the low central venous pressure group than in the control group (MD −15.32 min, 95% CrI −29.03 to −1.69; 192 participants; 4 studies). There was no evidence of differences in other comparisons. Two trials failed to report the mean, standard deviation, or both (Hasegawa 2002; Jarnagin 2008). Excluding these trials did not alter the conclusions.
Time needed to return to work
None of the trials reported this outcome.
Difference between Bayesian and frequentist meta‐analysis
The interpretation of information and conclusions did not alter by using the frequentist meta‐analysis.
Overall summary
There was no evidence of differences between different cardiopulmonary interventions in any of the reported outcomes of interest for this review other than the following.
-
The proportion of participants requiring a blood transfusion was higher in those receiving low central venous pressure than in those receiving acute normovolemic haemodilution plus low central venous pressure (OR 3.19, 95% CrI 1.56 to 6.95; 208 participants; 2 studies).
-
The blood transfusion quantity (red blood cells) was lower in the acute normovolemic haemodilution group (MD −1.25 units, 95% CrI −1.75 to −0.74; 20 participants; 1 study) and the acute normovolemic haemodilution plus hypotension group (MD −1.67 units, 95% CrI −2.06 to −1.32; 20 participants; 1 study) than in the control group. The blood transfusion quantity (red blood cells) was higher in the acute normovolemic haemodilution plus low central venous pressure group than in the control group (MD 0.27 units, 95% CrI 0.01 to 0.52; 30 participants; 1 study).
-
The blood transfusion quantity (fresh frozen plasma) was lower for low central venous pressure than for control (MD −2.48 units, 95% CrI −3.58 to −1.37; 50 participants; 1 study).
-
The blood loss was lower in the acute normovolemic haemodilution plus hypotension group (MD −0.25 L; 95% CrI −0.37 to −0.13; 20 participants; 1 study) and the low central venous pressure group than in the control (MD −0.34 L, 95% CrI −0.46 to −0.22; 237 participants; 4 studies). The blood loss was lower in the acute normovolemic haemodilution plus hypotension group than in the acute normovolemic haemodilution group (MD −0.25; 95% CrI −0.40 to −0.10; 20 participants; 1 study).
-
The total hospital stay was lower in the low central venous pressure group than in the control (MD −2.42 d, 95% CrI −3.91 to −0.94; 197 participants; 3 studies).
-
The operating time was lower in the low central venous pressure group than in the control (MD −15.32 min, 95% CrI −29.03 to −1.69; 192 participants; 4 studies).
Methods of parenchymal transection
Twelve trials compared different methods of parenchymal transection (Rau 2001; Takayama 2001; Arita 2005; Koo 2005; Lesurtel 2005; Smyrniotis 2005; Lupo 2007; Ikeda 2009; Doklestic 2012; Savlid 2013; Muratore 2014; Rahbari 2014). We performed network meta‐analysis only for adverse events (proportion), adverse events (number), and proportion requiring blood transfusion, since direct comparison and indirect comparison effect estimates (which would enable assessment of inconsistency) were available only for these outcomes. We present only direct comparison results for other outcomes.
Quality of evidence
The quality of evidence was very low for all the outcomes and comparisons unless specifically indicated within the results. This was because of unclear or high risk of bias in the trials (downgraded by one point), imprecision due to small sample size (downgraded by one point), and wide credible intervals (downgraded by one point) for all outcomes with very low‐quality of evidence. In addition, we downgraded the outcome of blood transfusion (proportion) by two points because of the presence of substantial or considerable heterogeneity in the pair‐wise comparison or in the network.
Mortality
Mortality (perioperative)
Eleven trials reported perioperative mortality (Rau 2001; Takayama 2001; Arita 2005; Lesurtel 2005; Smyrniotis 2005; Lupo 2007; Ikeda 2009; Doklestic 2012; Savlid 2013; Muratore 2014; Rahbari 2014). They used six treatments in 990 participants. The unadjusted proportions of perioperative mortality are as follows.
-
Clamp‐crush method: 4/368 (1.1%).
-
Cavitron ultrasonic surgical aspirator: 3/191 (1.6%).
-
Hydrojet: 3/56 (5.4%).
-
Radiofrequency dissecting sealer: 4/219 (1.8%).
-
Sharp transection method: 0/41 (0.0%).
-
Stapler: 4/115 (3.5%).
Based on the DIC, the fixed‐effect model was chosen for all comparisons involving two or more trials. There was no evidence of differences in perioperative mortality for any of the comparisons.
Mortality (longest follow‐up)
None of the trials reported this outcome.
Adverse events
Serious adverse events (proportion)
Seven trials reported the proportion of participants experiencing serious adverse events (Rau 2001; Takayama 2001; Arita 2005; Smyrniotis 2005; Ikeda 2009; Doklestic 2012; Rahbari 2014). They used six treatments in 665 participants. The unadjusted proportions of participants experiencing serious adverse events are as follows.
-
Clamp‐crush method: 28/292 (9.6%).
-
Cavitron ultrasonic surgical aspirator: 6/116 (5.2%).
-
Hydrojet: 2/31 (6.5%).
-
Radiofrequency dissecting sealer: 6/120 (5.0%).
-
Sharp transection method: 4/41 (9.8%).
-
Stapler: 19/65 (29.2%).
Based on the DIC, we chose the fixed‐effect model for all comparisons involving two or more trials. There was no evidence of differences in serious adverse events (proportion) for any of the comparisons.
Serious adverse events (number)
Five trials reported the number of serious adverse events (Takayama 2001; Arita 2005; Lesurtel 2005; Lupo 2007; Savlid 2013). They used five treatments in 437 participants. The unadjusted rates of serious adverse events (number) are as follows.
-
Clamp‐crush method: 7/132 (5.3 per 100 participants).
-
Cavitron ultrasonic surgical aspirator: 13/141 (9.2 per 100 participants).
-
Hydrojet: 3/25 (12.0 per 100 participants).
-
Radiofrequency dissecting sealer: 16/89 (18.0 per 100 participants).
-
Stapler: 12/50 (24.0 per 100 participants)..
Based on the DIC, we chose the fixed‐effect model for all comparisons involving two or more trials. The number of serious adverse events was higher in the radiofrequency dissecting sealer group than in the clamp‐crush method group (rate ratio 3.64, 95% CrI 1.25 to 13.97; 130 participants; 2 studies; low‐quality evidence: downgraded by one point for unclear or high risk of bias in the trials and one more point for small sample size). There was no evidence of differences in other comparisons.
Adverse events (proportion)
Eight trials reported the proportion of participants experiencing adverse events (Rau 2001; Takayama 2001; Arita 2005; Koo 2005; Smyrniotis 2005; Doklestic 2012; Muratore 2014; Rahbari 2014). They used six treatments in 695 participants. The unadjusted proportions of participants experiencing adverse events are as follows.
-
Clamp‐crush method: 116/307 (37.8%).
-
Cavitron ultrasonic surgical aspirator: 60/141 (42.6%).
-
Hydrojet: 3/31 (9.7%).
-
Radiofrequency dissecting sealer: 37/110 (33.6%).
-
Sharp transection method: 17/41 (41.5%).
-
Stapler: 31/65 (47.7%).
Direct comparison
Based on the DIC, we chose the fixed‐effect model for all comparisons involving two or more trials. There was no evidence of differences in adverse events (proportion) for any of the comparisons.
Network meta‐analysis
We show the network plots in Figure 10. Based on the DIC, we chose the random‐effects model. The between‐study standard deviation was 2.44. There was no evidence of differences in the proportion of participants experiencing adverse events for any of the comparisons. We show the probability of each treatment being best, second best, third best, and so on in Figure 11 and the cumulative probability of a treatment being best in Figure 12.

The network plot showing the comparisons in the trials included in the comparison of methods for parenchymal transection in which network meta‐analysis was performed. The size of the node (circle) provides a measure of the number of trials in which the particular treatment was included as one of the arms. The thickness of the line provides a measure of the number of direct comparisons between two nodes (treatments).
CUSA: cavitron ultrsonic surgical aspirator; RFDS: radiofrequency dissecting sealer.

Probability of best treatment: probability of being best, second best, third best, etc. for each treatment for adverse events (proportion) (parenchymal transection methods). A probability of more than 90% is a reliable indicator that a treatment is best with regards to the specific outcome. A probability of less than 90% is less reliable. None of the treatments have a 90% probability of being best treatment.
CUSA: cavitron ultrsonic surgical aspirator; RFDS: radiofrequency dissecting sealer.

Cumulative probability of being best treatment: cumulative probability of being best for each treatment for parenchymal transection methods. Rank 1 indicates the probability that a treatment is best, rank 2 indicates the probability that a treatment is in the two best treatments, rank 3 indicates the probability that a treatment is in the three best treatments, and so on.
CUSA: cavitron ultrsonic surgical aspirator; RFDS: radiofrequency dissecting sealer.
Direct evidence compared to network meta‐analysis
Figure 13 shows the information on direct evidence compared to network meta‐analysis. There does not appear to be any discrepancy between the direct and indirect estimates, although the indirect estimates have wide credible intervals. Direct evidence appears to be preferable over indirect evidence and network meta‐analysis based on the quality of evidence.

Parenchymal transection: adverse events (proportion)
Forest plot of the comparisons in which direct and indirect estimates were available. There does not appear to be any discrepancy between the direct and indirect estimates, although the indirect estimates have wide credible intervals.
Direct evidence appears to be preferable over indirect evidence and network meta‐analysis based on the quality of evidence.
CUSA: cavitron ultrsonic surgical aspirator; RFDS: radiofrequency dissecting sealer.
1Risk of bias was unclear or high in the trial(s) (downgraded by 1 point).
2Sample size was low (downgraded by 1 point).
3Confidence intervals spanned no effect and clinically significant effect (downgraded by 1 point).
4There was substantial or considerable heterogeneity (downgraded by 2 points).
Adverse events (number)
Seven trials reported the number of adverse events (Takayama 2001; Arita 2005; Lesurtel 2005; Smyrniotis 2005; Lupo 2007; Ikeda 2009; Savlid 2013). They used six treatments in 639 participants. The unadjusted rates of adverse events (number) are as follows.
-
Clamp‐crush method: 52/233 (22.3 per 100 participants).
-
Cavitron ultrasonic surgical aspirator: 52/141 (36.9 per 100 participants).
-
Hydrojet: 7/25 (28.0 per 100 participants).
-
Radiofrequency dissecting sealer: 45/149 (30.2 per 100 participants).
-
Sharp transection method: 18/41 (43.9 per 100 participants)
-
Stapler: 22/50 (44.0 per 100 participants).
Direct comparison
Based on the DIC, we chose the fixed‐effect model for all comparisons involving two or more trials. There was evidence for a higher adverse events (number) with radiofrequency dissecting sealer than with the clamp‐crush method (rate ratio 1.85, 95% CrI 1.07 to 3.26; 250 participants; 3 studies). There was no evidence of differences in the number of adverse events for any of the comparisons.
Network meta‐analysis
Figure 10 shows the network plots. Based on the DIC, we chose the fixed‐effect model. There was evidence of more adverse events (number) with the radiofrequency dissecting sealer method than with the clamp‐crush method (rate ratio 1.84, 95% CrI 1.13 to 3.06). There was no evidence of differences in other comparisons. Figure 14 shows the probability of each treatment being best, second best, third best, and so on, and Figure 12 shows the cumulative probability of a treatment being best.
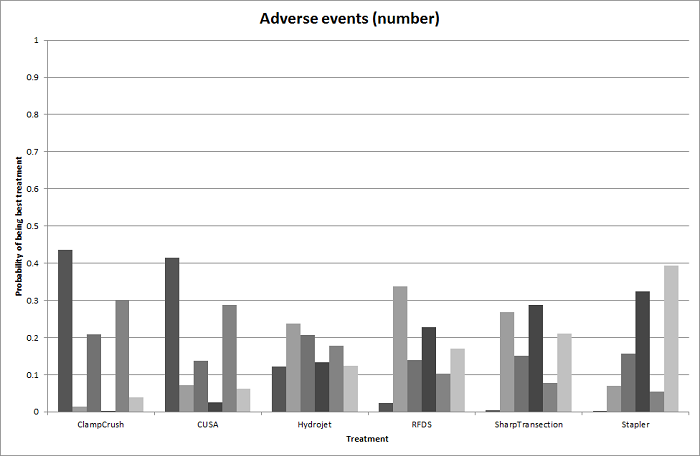
Probability of best treatment: probability of being best, second best, third best, etc. for each treatment for adverse events (number) (parenchymal transection methods). A probability of more than 90% is a reliable indicator that a treatment is best with regards to the specific outcome. A probability of less than 90% is less reliable. None of the treatments have a 90% probability of being best treatment.
CUSA: cavitron ultrsonic surgical aspirator; RFDS: radiofrequency dissecting sealer.
Direct evidence compared to network meta‐analysis
Figure 15 shows the information on direct evidence compared to network meta‐analysis. There does not appear to be any discrepancy between the direct and indirect estimates. Direct evidence appears to be preferable over indirect evidence and network meta‐analysis based on the quality of evidence.

Parenchymal transection: adverse events (number)
Forest plot of the comparisons in which direct and indirect estimates were available. There does not appear to be any discrepancy between the direct and indirect estimates.
Direct evidence appears to be preferable over indirect evidence and network meta‐analysis based on the quality of evidence.
CUSA: cavitron ultrsonic surgical aspirator; RFDS: radiofrequency dissecting sealer.
1Risk of bias was unclear or high in the trial(s) (downgraded by 1 point).
2Sample size was low (downgraded by 1 point).
3Confidence intervals spanned no effect and clinically significant effect (downgraded by 1 point).
Health‐related quality of life
None of the trials reported this outcome at any time point.
Blood transfusion requirements
Blood transfusion (proportion)
Eight trials reported the proportion of participants requiring a blood transfusion (Takayama 2001; Arita 2005; Lesurtel 2005; Smyrniotis 2005; Lupo 2007; Ikeda 2009; Doklestic 2012; Muratore 2014). They used five treatments in 699 participants. The unadjusted proportions of blood transfusion (proportion) are as follows.
-
Clamp‐crush method: 46/303 (15.2%).
-
Cavitron ultrasonic surgical aspirator: 12/111 (10.8%).
-
Hydrojet: 8/25 (32.0%).
-
Radiofrequency dissecting sealer: 37/219 (16.9%).
-
Sharp transection method: 13/41 (31.7%).
Direct comparison
Based on the DIC, we chose the fixed‐effect model for comparisons involving two or more trials. There was no evidence of differences in the proportion of participants requiring a blood transfusion for any of the comparisons.
Network meta‐analysis
Figure 10 shows the network plots. Based on the DIC, we chose the fixed‐effect model. There was no evidence of differences in the proportion of participants requiring a blood transfusion for any of the comparisons. Figure 16 shows the probability of each treatment being best, second best, third best, and so on. Figure 12 shows the cumulative probability of a treatment being best.

Probability of best treatment: probability of being best, second best, third best, etc. for each treatment for blood transfusion (proportion) (parenchymal transection methods). A probability of more than 90% is a reliable indicator that a treatment is best with regards to the specific outcome. A probability of less than 90% is less reliable. None of the treatments have a 90% probability of being best treatment.
CUSA: cavitron ultrsonic surgical aspirator; RFDS: radiofrequency dissecting sealer.
Direct evidence compared to network meta‐analysis
Figure 17 shows the information on direct evidence compared to network meta‐analysis. There does not appear to be any discrepancy between the direct and indirect estimates, although the indirect estimates have wide credible intervals for some comparisons. There was little apparent difference in the quality of evidence between direct, indirect estimates, and network meta‐analysis; so, we could not choose one estimate over the others based on the quality of evidence.
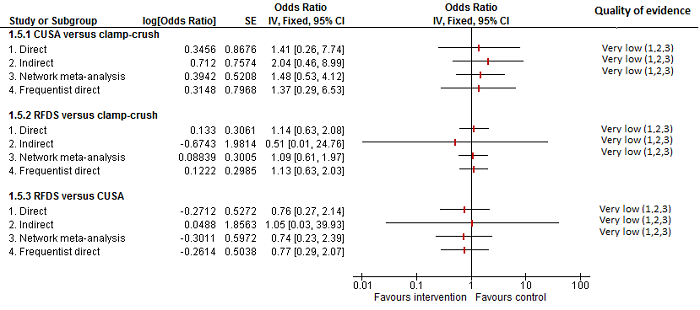
Parenchymal transection:blood transfusion (proportion)
Forest plot of the comparisons in which direct and indirect estimates were available. There does not appear to be any discrepancy between the direct and indirect estimates, although the indirect estimates have wide credible intervals for some comparisons. There was little apparent difference in the quality of evidence between direct, indirect estimates, and network meta‐analysis; so, we could not choose one estimate over the others based on the quality of evidence.
CUSA: cavitron ultrsonic surgical aspirator; RFDS: radiofrequency dissecting sealer.
1Risk of bias was unclear or high in the trial(s) (downgraded by 1 point).
2Sample size was low (downgraded by 1 point).
3Confidence intervals spanned no effect and clinically significant effect (downgraded by 1 point).
Blood transfusion (red blood cells)
Four trials reported blood transfusion quantity (in red blood cells) (Rau 2001; Smyrniotis 2005; Savlid 2013; Rahbari 2014). They used five treatments in 373 participants. The median or mean blood transfusion quantity (red blood cells) reported for each treatment are as follows.
-
Clamp‐crush method: 0.00 and 1.20 units (two trials only).
-
Cavitron ultrasonic surgical aspirator: 2.48 and 4.00 units (two trials only).
-
Hydrojet: 1.50 units (one trial only).
-
Sharp transection method: 0.00 units (one trial only).
-
Stapler: 1.10 and 4.00 units (two trials only).
The blood transfusion quantity (red blood cells) was lower in the hydrojet group than in the cavitron ultrasonic surgical aspirator group (MD −0.98 units, 95% CrI −1.90 to −0.06; 61 participants; 1 study). There was no evidence of difference in blood transfusion quantity (red blood cells) in the remaining comparisons. Either mean or standard deviation or both were not available in two trials (Smyrniotis 2005; Savlid 2013). Excluding these two trials did not change the conclusion.
Blood transfusion (platelets)
None of the trials reported this outcome.
Blood transfusion (fresh frozen plasma)
One trial reported blood transfusion quantity (fresh frozen plasma) (Rahbari 2014). It used two treatments in 130 participants in these studies. The mean blood transfusion quantity (fresh frozen plasma) reported for each treatment are as follows.
-
Clamp‐crush method: 0.5 units.
-
Stapler: 0.3 units.
There was no evidence of differences in blood transfusion quantity (fresh frozen plasma) between the groups (MD −0.20 units, 95% CrI −0.66 to 0.26; 130 participants;1 study).
Blood transfusion (cryoprecipitate)
None of the trials reported this outcome.
Blood loss
Ten trials reported blood loss (Rau 2001; Takayama 2001; Arita 2005; Koo 2005; Smyrniotis 2005; Ikeda 2009; Doklestic 2012; Savlid 2013; Muratore 2014; Rahbari 2014). They used six treatments in 915 participants. The median or mean blood loss reported for each treatment are as follows.
-
Clamp‐crush method: 0.56 L (range 0.2 to 1.05).
-
Cavitron ultrasonic surgical aspirator: 0.875 L (range 0.15 to 1.797).
-
Hydrojet: 1.479 L (range 1.479 to 1.479).
-
Radiofrequency dissecting sealer: 0.47 L (range 0.15 to 0.665).
-
Sharp transection method: 0.5 L (range 0.5 to 0.5).
-
Stapler: 0.9625 L (range 0.925 to 1).
Of the 10 trials, 8 did not provide either the mean, the standard deviation or both (Takayama 2001; Arita 2005; Smyrniotis 2005; Ikeda 2009; Doklestic 2012; Savlid 2013; Muratore 2014; Rahbari 2014), so we performed the analysis only for two trials (Rau 2001; Koo 2005). There was no evidence of differences in blood loss for any of the comparisons.
Major blood loss (proportion)
None of the trials reported this outcome.
Hospital stay
Total hospital stay
Ten trials reported hospital stay (Doklestic 2012; Takayama 2001; Arita 2005; Lesurtel 2005; Smyrniotis 2005; Lupo 2007; Ikeda 2009; Savlid 2013; Muratore 2014; Rahbari 2014). They used six treatments in 929 participants. The mean and range of the mean hospital stays reported for each treatment are as follows.
-
Clamp‐crush method: 11 d (range 7 to 18).
-
Cavitron ultrasonic surgical aspirator: 11.95 d (range 8.5 to 17).
-
Hydrojet: 9 d (one trial only).
-
Radiofrequency dissecting sealer: 10.5 d (range 8 to 16).
-
Sharp transection method: 11 d (one trial only).
-
Stapler: 10 to 14.9 d (two trials only).
All 10 trials failed to provide the mean, standard deviation or both. There was no evidence of differences in total hospital stay for any of the comparisons.
ITU stay
Four trials reported ITU stay (Lesurtel 2005; Smyrniotis 2005; Doklestic 2012; Rahbari 2014). They used six treatments in 347 participants. The median ITU stays reported for each treatment are as follows.
-
Clamp‐crush method: 1 d (range 0 to 1.5).
-
Cavitron ultrasonic surgical aspirator: 0 and 1 d (two trials only).
-
Hydrojet: 1 d (one trial only).
-
Radiofrequency dissecting sealer: 1 d (two trials only).
-
Sharp transection method: 1 d (one trial only).
-
Stapler: 0 d (one trial only).
Either the mean, the standard deviation, or both were not available in all the four trials. There was no evidence of differences in ITU stay for any of the comparisons.
Operating time
Six trials reported operating time (Koo 2005; Smyrniotis 2005; Lupo 2007; Doklestic 2012; Savlid 2013; Rahbari 2014). They used five treatments in 472 participants. The median or mean operating time reported for each treatment are as follows.
-
Clamp‐crush method: 231 min (range 211 to 278).
-
Cavitron ultrasonic surgical aspirator: 270 min (range 259 to 298).
-
Radiofrequency dissecting sealer: 292 and 295 min (two trials only).
-
Sharp transection method: 205 min (one trial only).
-
Stapler: 190 and 272 min (two trials only).
Based on the DIC, we chose the fixed‐effect model when there were two or more studies in a comparison. There was no evidence of differences in operating time in any of the comparisons. We imputed either the mean or the standard deviation in two trials (Lupo 2007; Doklestic 2012). Excluding this trial did not alter the results.
Time needed to return to work
None of the trials reported this outcome.
Difference between Bayesian and frequentist meta‐analysis
The interpretation of information and conclusions did not change upon use of the frequentist meta‐analysis except for the following.
Adverse events (number): the number of adverse events was higher in the radiofrequency dissecting sealer group than in the group receiving the clamp‐crush method with Bayesian meta‐analysis (rate ratio 1.85, 95% CrI 1.07 to 3.26; 250 participants; 3 studies), while there was no evidence of difference in adverse events (number) in any comparisons by frequentist meta‐analysis (rate ratio 1.67, 95% CI 0.95 to 2.94; 250 participants; 3 studies).
Operating time: there was no evidence of difference in operating time in any comparisons by Bayesian meta‐analysis (stapler resection versus clamp‐crush method: MD −27.99 min, 95% CrI −56.91 to 1.02; 130 participants; 1 study), while the operating time was lower in stapler resection than clamp‐crush method with frequentist meta‐analysis (MD −31.00 min, 95% CI −60.40 to −1.60; 130 participants; 1 study).
Overall summary
There was no evidence of differences between different parenchymal transection methods in any of the reported outcomes of interest for this review other than the following.
-
The adverse events (number) was higher with the radiofrequency dissecting sealer than with the clamp‐crush method (rate ratio 1.85, 95% CrI 1.07 to 3.26; 250 participants; 3 studies) (Bayesian analysis only: both direct and network meta‐analysis).
-
The blood transfusion quantity (red blood cells) was lower in the hydrojet group than with the cavitron ultrasonic surgical aspirator group (MD −0.98 units, 95% CrI −1.90 to −0.06; 61 participants; 1 study).
-
The operating time was lower with stapler resection than with the clamp‐crush method with frequentist meta‐analysis (MD −31.00 min, 95% CI −60.40 to −1.60; 130 participants; 1 study) (frequentist analysis only).
Methods of dealing with cut surface
Seventeen trials compared different methods of dealing with cut surface (Kohno 1992; Liu 1993; Noun 1996; Chapman 2000; Frilling 2005; Franceschi 2006; Figueras 2007; Fischer 2011; Gugenheim 2011; De Boer 2012; Porte 2012; Kakaei 2013; Koea 2013; Ollinger 2013; Bektas 2014; Genyk 2014; Moench 2014). We did not perform network meta‐analysis since direct comparison and indirect comparison effect estimates (which would enable assessment of inconsistency) were not available for any of the outcomes.
Quality of evidence
The quality of evidence was very low for all the outcomes and comparisons unless specifically indicated within the results. This was because of unclear or high risk of bias in the trials (downgraded by one point), imprecision due to small sample size (downgraded by one point), and wide credible intervals (downgraded by one point) for all outcomes with very low quality of evidence. In addition, some of the pair‐wise comparisons in blood transfusion proportion and blood transfusion (red blood cells) were downgraded by two points because of the presence of substantial or considerable heterogeneity.
Mortality
Mortality (perioperative)
Ten trials reported perioperative mortality (Kohno 1992; Chapman 2000; Frilling 2005; Figueras 2007; Fischer 2011; Gugenheim 2011; De Boer 2012; Ollinger 2013; Bektas 2014; Moench 2014). They used seven interventions in 1271 participants. The unadjusted proportions of perioperative mortality are as follows.
-
Control: 4/339 (1.2%).
-
Argon beam: 6/114 (5.3%).
-
Collagen: 4/122 (3.3%).
-
Fibrin sealant: 23/485 (4.7%).
-
Fibrin sealant plus collagen: 6/150 (4.0%).
-
Oxidised cellulose: 1/32 (3.1%).
-
Plasmajet: 2/29 (6.9%).
Based on the DIC, we chose the fixed‐effect model when there were two or more trials. There was no evidence of differences in perioperative mortality for any of the comparisons.
Mortality (longest follow‐up)
None of the trials reported this outcome.
Adverse events
Serious adverse events (proportion)
Seven trials reported the proportion of participants experiencing serious adverse events (Noun 1996; Fischer 2011; Gugenheim 2011; De Boer 2012; Ollinger 2013; Bektas 2014; Moench 2014). They used six interventions in 798 participants. The unadjusted proportions of serious adverse events (proportion) are as follows.
-
Control: 43/231 (18.6%).
-
Argon beam: 14/52 (26.9%).
-
Collagen: 16/62 (25.8%).
-
Fibrin sealant: 90/392 (23.0%).
-
Oxidised cellulose: 10/32 (31.3%).
-
Plasmajet: 1/29 (3.4%).
Based on the DIC, we chose the fixed‐effect model when there were two or more trials. There was no evidence of differences in serious adverse events (proportion) for any of the comparisons.
Serious adverse events (number)
Six trials reported the number of serious adverse events (Kohno 1992; Frilling 2005; Figueras 2007; Kakaei 2013; Bektas 2014; Moench 2014). They used seven interventions in 725 participants. The unadjusted rates of serious adverse events (number) are as follows.
-
Control: 39/185 (21.1 per 100 participants).
-
Argon beam: 4/62 (6.5 per 100 participants).
-
Collagen: 30/93 (32.3 per 100 participants).
-
Cyanoacrylate: 1/15 (6.7 per 100 participants).
-
Fibrin sealant: 72/205 (35.1 per 100 participants).
-
Fibrin sealant plus collagen: 29/150 (19.3 per 100 participants).
-
Oxidised cellulose: 4/15 (26.7 per 100 participants).
Based on the DIC, we chose the fixed‐effect model when there were two or more trials. The serious adverse events (number) was higher in the fibrin sealant group than in the argon beam group (rate ratio 4.81, 95% CrI 1.73 to 17.5; 121 participants; 1 study; low‐quality evidence: downgraded one point for unclear or high risk of bias in the trial and one more point for small sample size). There was no evidence of differences in other comparisons.
Adverse events (proportion)
Nine trials reported the proportion of participants experiencing adverse events (Noun 1996; Frilling 2005; Figueras 2007; Fischer 2011; De Boer 2012; Ollinger 2013; Bektas 2014; Genyk 2014; Moench 2014). They used six interventions in 1385 participants. The unadjusted proportions of adverse events (proportion) are as follows.
-
Control: 166/381 (43.6%).
-
Argon beam: 52/114 (45.6%).
-
Collagen: 38/62 (61.3%).
-
Fibrin sealant: 227/536 (42.4%).
-
Fibrin sealant plus collagen: 35/150 (23.3%).
-
Oxidised cellulose: 27/142 (19.0%).
Based on the DIC, we chose the fixed‐effect model when there were two or more trials. There was no evidence of differences in adverse events (proportion) for any of the comparisons.
Adverse events (number)
Five trials reported the number of adverse events (Kohno 1992; Frilling 2005; Kakaei 2013; Bektas 2014; Moench 2014). They used six interventions in 425 participants. The unadjusted rates of adverse events (number) are as follows.
-
Control: 89/35 (254.3 per 100 participants).
-
Argon beam: 47/62 (75.8 per 100 participants).
-
Collagen: 135/93 (145.2 per 100 participants).
-
Cyanoacrylate: 2/15 (13.3 per 100 participants).
-
Fibrin sealant: 302/205 (147.3 per 100 participants).
-
Oxidised cellulose: 7/15 (46.7 per 100 participants).
Based on the DIC, we chose the fixed‐effect model when there were two or more trials. There was no evidence of differences in adverse events (number) for any of the comparisons.
Health‐related quality of life
None of the trials reported this outcome at any time point.
Blood transfusion requirements
Blood transfusion (proportion)
Four trials reported the proportion of participants requiring a blood transfusion (Noun 1996; Figueras 2007; De Boer 2012; Kakaei 2013). They used five interventions in 737 participants. The unadjusted proportions of participants requiring a blood transfusion are as follows.
-
Control: 62/348 (17.8%).
-
Cyanoacrylate: 2/15 (13.3%).
-
Fibrin sealant: 38/209 (18.2%).
-
Fibrin sealant plus collagen: 40/150 (26.7%).
-
Oxidised cellulose: 4/15 (26.7%).
Based on the DIC, we chose the fixed‐effect model when there were two or more trials. There was no evidence of differences in blood transfusion (proportion) for any of the comparisons.
Blood transfusion (red blood cells)
Five trials reported blood transfusion (red blood cells) (Liu 1993; Noun 1996; Figueras 2007; Kakaei 2013; Ollinger 2013). They used five interventions in 517 participants. The median and range of the mean blood transfusion (red blood cells) reported for each treatment are as follows.
-
Control: 3.50 units (range 0.31 to 8.13).
-
Cyanoacrylate: 2.13 units (one trial only).
-
Fibrin sealant: 4.30 units (range 3.00 to 5.94).
-
Fibrin sealant plus collagen: 0.30 units (one trial only).
-
Oxidised cellulose: 1.86 and 4.35 units (two trials only).
Based on the DIC, we chose the fixed‐effect model for the comparison of fibrin sealant versus control and the random‐effects model for the comparison of oxidised cellulose versus fibrin sealant. The remaining comparisons had only one trial. The blood transfusion quantity (red blood cells) was lower in the fibrin sealant group than in the control (MD −0.53 units, 95% CrI −1.00 to −0.07; 122 participants; 2 studies). The blood transfusion quantity (red blood cells) was higher in the fibrin sealant group than the cyanoacrylate group (MD 2.20 units; 95% CrI 1.59 to 2.81; 30 participants; 1 study; low‐quality evidence: downgraded one point for unclear or high risk of bias in the trial and one more point for small sample size). There was no evidence of differences in other comparisons.
Blood transfusion (platelets)
None of the trials reported this outcome.
Blood transfusion (fresh frozen plasma)
Two trials reported blood transfusion quantity (fresh frozen plasma) (Kakaei 2013; Ollinger 2013). They used three treatments in 95 participants. The median blood transfusion quantities (fresh frozen plasma) reported for each treatment are as follows.
-
Cyanoacrylate: 0.80 units (one trial only).
-
Fibrin sealant: 0.00 and 17.64 units (two trials only).
-
Oxidised cellulose: 0.53 and 20.12 units (two trials only).
Based on the DIC, we chose the fixed‐effect model when there were two or more trials. The blood transfusion quantity (fresh frozen plasma) was lower in the fibrin sealant group than in the cyanoacrylate group (MD −0.81 units, 95% CrI −1.04 to −0.62; 30 participants; 1 study). The blood transfusion quantity (fresh frozen plasma) was higher with oxidised cellulose than with fibrin sealant (MD 0.53 units, 95% CrI 0.36 to 0.71; 80 participants; 2 studies). There was no evidence of differences in other comparisons.
Blood transfusion (cryoprecipitate)
None of the trials reported this outcome.
Blood loss
Five trials reported blood loss (Kohno 1992; Liu 1993; Figueras 2007; De Boer 2012; Kakaei 2013). They usedsix interventions in 757 participants. The median and range of the mean blood loss reported for each treatment are as follows.
-
Control: 0.82 L (range 0.55 to 4.052).
-
Collagen: 1.027 L (one trial only).
-
Cyanoacrylate: 0.653 L (one trial only).
-
Fibrin sealant: 0.9325 L (range 0.675 to 3.047).
-
Fibrin sealant plus collagen: 0.884 L (one trial only).
-
Oxidised cellulose: 0.573 L (one trial only).
Based on the DIC, we chose the fixed‐effect model when there were two or more trials. There was no evidence of differences in blood loss for any of the comparisons. Excluding the trial for which the mean and standard deviation were not available did not alter the conclusions (De Boer 2012).
Major blood loss (proportion)
None of the trials reported this outcome.
Hospital stay
Total hospital stay
Four trials reported hospital stay (Noun 1996; Figueras 2007; Kakaei 2013; Ollinger 2013). They used five interventions in 477 participants. The median and range of the mean hospital stay reported for each treatment are as follows.
-
Control: 11.3 d and 12.6 d (two trials only).
-
Cyanoacrylate: 8.8 d (one trial only).
-
Fibrin sealant: 10.8 d (range 7.5 to 18.5).
-
Fibrin sealant plus collagen: 13.3 d (one trial only).
-
Oxidised cellulose: 8.1 d, 15.2 d (two trials only).
Based on the DIC, we chose the fixed‐effect model when there were two or more trials. There was no evidence of differences in hospital stay for any of the comparisons.
ITU stay
One trial (50 participants) reported ITU stay (Ollinger 2013). The median ITU stay reported for each treatment are as follows.
-
Fibrin sealant: 2.2 d (one trial only).
-
Oxidised cellulose: 2.8 d (one trial only).
There was no evidence of differences in ITU stay for any of the comparisons.
Operating time
Five trials reported operating time (Kohno 1992; Liu 1993; Noun 1996; Figueras 2007; Ollinger 2013). They used five interventions in 534 participants. The median and range of the mean operating time reported for each treatment are as follows.
-
Control: 263 min (range 258 to 343).
-
Collagen: 169 min (one trial only).
-
Fibrin sealant: 245 min (range 165 to 295).
-
Fibrin sealant plus collagen: 282 min (one trial only).
-
Oxidised cellulose: 253 min (one trial only).
Based on the DIC, we chose the fixed‐effect model when there were two or more trials. The operating time was higher in the group receiving fibrin sealant and collagen than in the control group (MD 19.72 min, 95% CrI 2.93 to 36.57; 300 participants; 1 study). There was no evidence of differences in other comparisons.
Time needed to return to work
None of the trials reported this outcome.
Difference between Bayesian and frequentist meta‐analysis
The interpretation of information and conclusions did not alter by using the frequentist meta‐analysis.
Overall summary
There was no evidence of differences between different methods of dealing with cut surface in any of the reported outcomes of interest for this review other than the following.
-
The serious adverse events (number) was higher in the fibrin sealant group than in the argon beam group (rate ratio 4.81, 95% CrI 1.73 to 17.5; 121 participants; 1 study).
-
The blood transfusion quantity (red blood cells) was lower in the fibrin sealant group than in the control (MD −0.53 units, 95% CrI −1.00 to −0.07; 122 participants; 2 studies). The blood transfusion quantity (red blood cells) was higher in fibrin sealant than cyanoacrylate (MD 2.20 units; 95% CrI 1.59 to 2.81; 30 participants; 1 study).
-
The blood transfusion quantity (fresh frozen plasma) was lower with fibrin sealant than with cyanoacrylate (MD −0.81 units, 95% CrI −1.04 to −0.62; 30 participants; 1 study). The blood transfusion quantity (fresh frozen plasma) was higher with oxidised cellulose than with fibrin sealant (MD 0.53 units, 95% CrI 0.36 to 0.71; 80 participants; 2 studies).
-
The operating time was higher with fibrin sealant and collagen than with control (MD 19.72 min, 95% CrI 2.93 to 36.57; 300 participants; 1 study).
Methods of vascular occlusion
Eighteen trials compared different methods of vascular occlusion (Belghiti 1996; Clavien 1996; Man 1997; Belghiti 1999; Wu 2002; Capussotti 2003; Man 2003; Chouker 2004; Figueras 2005; Capussotti 2006; Chen 2006; Liang 2009; Dayangac 2010; Pietsch 2010; Lee 2012; Park 2012; Ni 2013; Si‐Yuan 2014). We performed network meta‐analysis only for serious adverse events (proportion), adverse events (proportion), blood transfusion (proportion), and blood transfusion quantity (red blood cells) since direct comparison and indirect comparison effect estimates (which would enable assessment of inconsistency) were not available for the other outcomes. We present only direct comparison results for other outcomes.
Quality of evidence
The quality of evidence was very low for all the outcomes and comparisons unless specifically indicated within the results. This was because of unclear or high risk of bias in the trials (downgraded by one point), imprecision due to small sample size (downgraded by one point), and wide credible intervals (downgraded by one point) for all outcomes with very low quality of evidence. In addition, we downgraded the evidence for blood transfusion quantity (red blood cells), blood loss, and operating time by two points because of the presence of substantial or considerable heterogeneity in the pair‐wise comparison or in the network.
Mortality
Mortality (perioperative)
Fourteen trials reported perioperative mortality (Belghiti 1996; Clavien 1996; Man 1997; Belghiti 1999; Wu 2002; Capussotti 2003; Man 2003; Figueras 2005; Capussotti 2006; Chen 2006; Liang 2009; Lee 2012; Ni 2013; Si‐Yuan 2014). They used seven treatments in 1196 participants. The unadjusted proportions of perioperative mortality are as follows.
-
Control: 5/203 (2.5%).
-
Continuous hepatic vascular exclusion: 0/88 (0.0%).
-
Continuous portal triad clamping: 6/290 (2.1%).
-
Continuous selective hepatic vascular exclusion: 0/80 (0.0%).
-
Continuous selective portal triad clamping: 0/100 (0.0%).
-
Intermittent portal triad clamping: 3/364 (0.8%).
-
Intermittent selective portal triad clamping: 1/71 (1.4%).
Based on the DIC, we chose the fixed‐effect model for all comparisons with two or more trials. There was no evidence of differences in perioperative mortality for any of the comparisons.
Mortality (longest follow‐up)
None of the trials reported this outcome.
Adverse events
Serious adverse events (proportion)
Eight trials reported the proportion of participants experiencing serious adverse events (Capussotti 2003; Capussotti 2006; Chen 2006; Liang 2009; Lee 2012; Park 2012; Ni 2013; Si‐Yuan 2014). They used six treatments in 815 participants. The unadjusted proportions of participants experiencing serious adverse events are as follows.
-
Control: 15/151 (9.9%).
-
Continuous hepatic vascular exclusion: 3/60 (5.0%).
-
Continuous portal triad clamping: 30/216 (13.9%).
-
Continuous selective hepatic vascular exclusion: 0/80 (0.0%).
-
Continuous selective portal triad clamping: 13/100 (13.0%).
-
Intermittent portal triad clamping: 23/208 (11.1%).
Direct comparison
Based on the DIC, we chose the fixed‐effect model for all comparisons with two or more trials. The serious adverse events (proportion) was lower in the group receiving continuous selective portal triad clamping than in the continuous portal triad clamping group (OR 0.42, 95% CrI 0.18 to 0.96; 120 participants; 1 study). There was no evidence of differences in other comparisons.
Network meta‐analysis
The network plots are shown in Figure 18. Based on the DIC, we chose the fixed‐effect model. There was no evidence of differences in adverse events (proportion) for any of the comparisons. Figure 19 shows the probability of each treatment being best, second best, third best, and so on. Figure 20 shows the cumulative probability of a treatment being best.
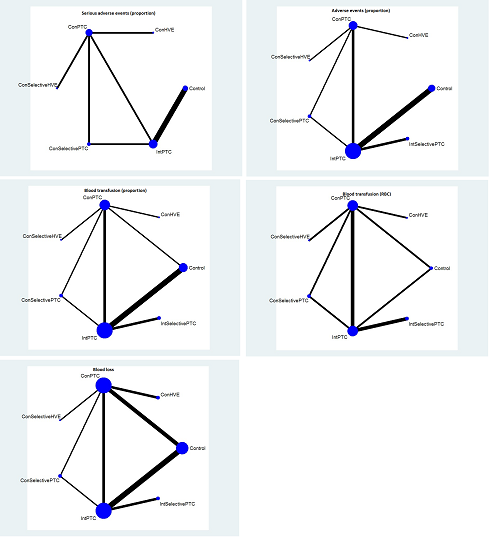
The network plot showing the comparisons in the trials included in the comparison of methods for vascular occlusion in which network meta‐analysis was performed. The size of the node (circle) provides a measure of the number of trials in which the particular treatment was included as one of the arms. The thickness of the line provides a measure of the number of direct comparisons between two nodes (treatments).
Con: continuous; Int: intermittent; HVE: hepatic vascular exclusion; PTC: portal triad clamping; RBC: red blood cells.
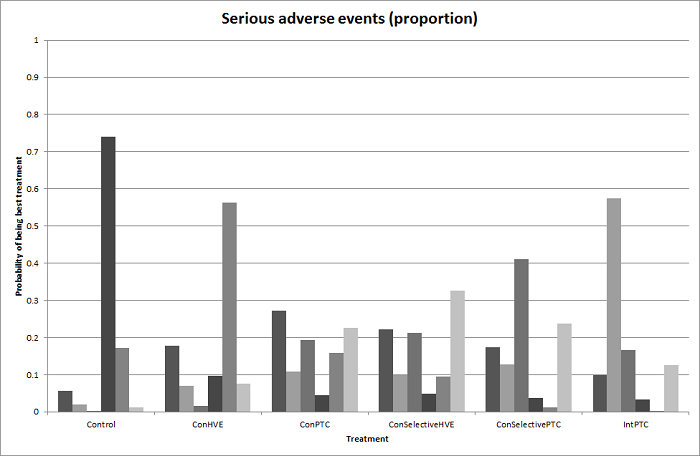
Probability of best treatment: probability of being best, second best, third best, etc. for each treatment for serious adverse events (proportion) (vascular occlusion methods). A probability of more than 90% is a reliable indicator that a treatment is best with regards to the specific outcome. A probability of less than 90% is less reliable. None of the treatments have a 90% probability of being best treatment.
Con: continuous; Int: intermittent; HVE: hepatic vascular exclusion; PTC: portal triad clamping.

Cumulative probability of being best treatment: cumulative probability of being best for each treatment for vascular occlusion methods. Rank 1 indicates the probability that a treatment is best, rank 2 indicates the probability that a treatment is in the two best treatments, rank 3 indicates the probability that a treatment is in the three best treatments, and so on.
Con: continuous; Int: intermittent; HVE:hepatic vascular exclusion; PTC: portal triad clamping.
Direct evidence compared to network meta‐analysis
Figure 21 shows the information on direct evidence compared to network meta‐analysis. Although there is overlap of credible intervals, the mean indirect estimate seems to be quite different from the direct estimate (sometimes suggesting an opposite effect), thus suggesting that there may be discrepancies between direct and indirect estimates. There was little apparent difference in the quality of evidence between direct, indirect estimates, and network meta‐analysis; so, we could not choose one estimate over the others based on the quality of evidence.
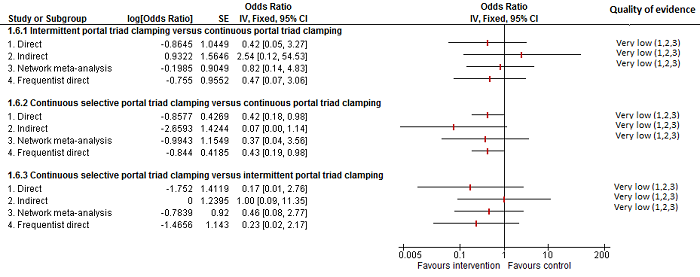
Methods of vascular occlusion: serious adverse events (proportion)
Forest plot of the comparisons in which direct and indirect estimates were available. Although there is overlap of confidence intervals, the mean indirect estimate seems to be quite different from the direct estimate (sometimes, suggesting an opposite effect), thus suggesting that there may be discrepancies between direct and indirect estimates.
There was little apparent difference in the quality of evidence between direct, indirect estimates, and network meta‐analysis; so, we could not choose one estimate over the others based on the quality of evidence.
1Risk of bias was unclear or high in the trial(s) (downgraded by 1 point).
2Sample size was low (downgraded by 1 point).
3Confidence intervals spanned no effect and clinically significant effect (downgraded by 1 point).
Serious adverse events (number)
Five trials reported the number of serious adverse events (Belghiti 1996; Man 1997; Belghiti 1999; Wu 2002; Figueras 2005). They used five treatments in 376 participants. The unadjusted rates of serious adverse events (number) are as follows.
-
Control: 4/50 (8.0 per 100 participants).
-
Continuous hepatic vascular exclusion: 5/28 (17.9 per 100 participants).
-
Continuous portal triad clamping: 9/66 (13.6 per 100 participants).
-
Intermittent portal triad clamping: 16/161 (9.9 per 100 participants).
-
Intermittent selective portal triad clamping: 12/71 (16.9 per 100 participants).
Based on the DIC, we chose the fixed‐effect model for all comparisons with two or more trials. The number of serious adverse events was lower in the intermittent portal triad clamping group than in the continuous portal triad clamping group (rate ratio 0.09, 95% CrI 0.00 to 0.56; 86 participants; 1 study; low‐quality evidence: downgraded one point for unclear or high risk of bias in trial and one more point for small sample size). There was no evidence of differences in other comparisons.
Adverse events (proportion)
Twelve trials reported the proportion of participants experiencing adverse events (Man 1997; Belghiti 1999; Wu 2002; Capussotti 2003; Man 2003; Figueras 2005; Capussotti 2006; Chen 2006; Liang 2009; Lee 2012; Ni 2013; Si‐Yuan 2014). They used seven treatments in 1129 participants. The unadjusted proportions of adverse events (proportion) are as follows.
-
Control: 55/196 (28.1%).
-
Continuous hepatic vascular exclusion: 19/60 (31.7%).
-
Continuous portal triad clamping: 75/258 (29.1%).
-
Continuous selective hepatic vascular exclusion: 9/80 (11.3%).
-
Continuous selective portal triad clamping: 22/100 (22.0%).
-
Intermittent portal triad clamping: 109/364 (29.9%).
-
Intermittent selective portal triad clamping: 22/71 (31.0%).
Direct comparison
Based on the DIC, we chose the fixed‐effect model for comparisons with two or more studies. The proportion of participants experiencing adverse events was lower in the continuous selective portal triad clamping group than in the continuous portal triad clamping group (OR 0.41, 95% CrI 0.18 to 0.90; 120 participants; 1 study). There was no evidence of differences in other comparisons.
Network meta‐analysis
Figure 18 shows the network plots. Based on the DIC, we chose the fixed‐effect model. There was no evidence of differences in the proportion of participants experiencing adverse events for any of the comparisons. Figure 22 shows the probability of each treatment being best, second best, third best, and so on. Figure 20 shows the cumulative probability of a treatment being best.

Probability of best treatment: probability of being best, second best, third best, etc. for each treatment for adverse events (proportion) (vascular occlusion methods). A probability of more than 90% is a reliable indicator that a treatment is best with regards to the specific outcome. A probability of less than 90% is less reliable. None of the treatments have a 90% probability of being best treatment.
Con: continuous; Int: intermittent; HVE: hepatic vascular exclusion; PTC: portal triad clamping.
Direct evidence compared to network meta‐analysis
Figure 23 shows the information on direct evidence compared to network meta‐analysis. There do not appear to be any discrepancies between direct and indirect estimates. Direct evidence appears to be preferable over indirect evidence and network meta‐analysis based on the quality of evidence.

Methods of vascular occlusion: adverse events (proportion)
Forest plot of the comparisons in which direct and indirect estimates were available. There does not appear to be any discrepancies between direct and indirect estimates. Direct evidence appears to be preferable over indirect evidence and network meta‐analysis based on the quality of evidence.
1Risk of bias was unclear or high in the trial(s) (downgraded by 1 point).
2Sample size was low (downgraded by 1 point).
3Confidence intervals spanned no effect and clinically significant effect (downgraded by 1 point).
Adverse events (number)
Six trials reported the number of adverse events (Belghiti 1996; Man 1997; Belghiti 1999; Wu 2002; Figueras 2005; Lee 2012). They used five in 502 participants. The unadjusted rates of adverse events (number) are as follows.
-
Control: 47/113 (41.6 per 100 participants).
-
Continuous hepatic vascular exclusion: 19/28 (67.9 per 100 participants).
-
Continuous portal triad clamping: 28/66 (42.4 per 100 participants).
-
Intermittent portal triad clamping: 97/224 (43.3 per 100 participants).
-
Intermittent selective portal triad clamping: 36/71 (50.7 per 100 participants).
Based on the DIC, we chose the fixed‐effect model for comparisons with two or more studies. There was no evidence of differences in adverse events (number) for any of the comparisons.
Health‐related quality of life
None of the trials reported this outcome at any time point.
Blood transfusion requirements
Blood transfusion (proportion)
Thirteen trials reported the proportion of participants requiring a blood transfusion (Man 1997; Belghiti 1999; Wu 2002; Capussotti 2003; Man 2003; Chouker 2004; Figueras 2005; Capussotti 2006; Chen 2006; Liang 2009; Lee 2012; Ni 2013; Si‐Yuan 2014). They used seven treatments in 1163 participants. The unadjusted proportions of participants requiring a blood transfusion are as follows.
-
Control: 64/211 (30.3%).
-
Continuous hepatic vascular exclusion: 8/60 (13.3%).
-
Continuous portal triad clamping: 71/277 (25.6%).
-
Continuous selective hepatic vascular exclusion: 13/80 (16.3%).
-
Continuous selective portal triad clamping: 21/100 (21.0%).
-
Intermittent portal triad clamping: 101/364 (27.7%).
-
Intermittent selective portal triad clamping: 11/71 (15.5%).
Direct comparison
Based on the DIC, we used the random‐effects model for comparisons with two or more studies for intermittent portal triad clamping versus continuous portal triad clamping and the fixed‐effect model for the remaining comparisons with two or more studies. The proportion of participants requiring a blood transfusion was lower in the continuous portal triad clamping group than in the control (OR 0.06, 95% CrI 0.00 to 0.49; 34 participants; 1 study; low‐quality evidence: downgraded one point for unclear or high risk of bias in trial and one more point for small sample size). The blood transfusion (proportion) was higher in continuous portal triad clamping than continuous hepatic vascular exclusion (OR 5.90, 95% CrI 2.45 to 15.58; 118 participants; 1 study; low‐quality evidence: downgraded one point for unclear or high risk of bias in trial and one more point for small sample size). There was no evidence of differences in other comparisons.
Network meta‐analysis
Figure 18 shows the network plots. Based on the DIC, we chose the random‐effects model. There was no evidence of differences in the proportion of participants requiring a blood transfusion for any of the comparisons. Figure 24 shows the probability of each treatment being best, second best, third best, and so on. Figure 20 shows the cumulative probability of a treatment being the best.
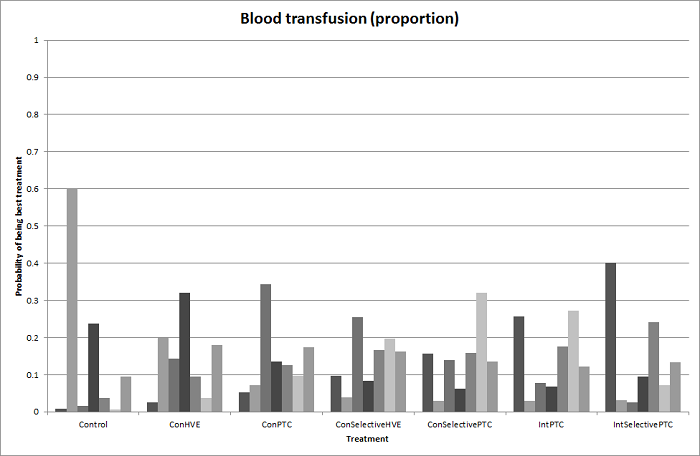
Probability of best treatment: probability of being best, second best, third best, etc. for each treatment for blood transfusion (proportion) (vascular occlusion methods). A probability of more than 90% is a reliable indicator that a treatment is best with regards to the specific outcome. A probability of less than 90% is less reliable. None of the treatments have a 90% probability of being best treatment.
Con: continuous; Int: intermittent; HVE: hepatic vascular exclusion; PTC: portal triad clamping.
Direct evidence compared to network meta‐analysis
Figure 25 shows the information on direct evidence compared to network meta‐analysis. Although the credible intervals overlap, there appears to be some discrepancies between direct and indirect estimates for continuous portal triad clamping versus control, intermittent portal triad clamping versus control, and intermittent portal triad clamping versus continuous portal triad clamping. Direct evidence appears to be preferable over indirect evidence and network meta‐analysis based on the quality of evidence.
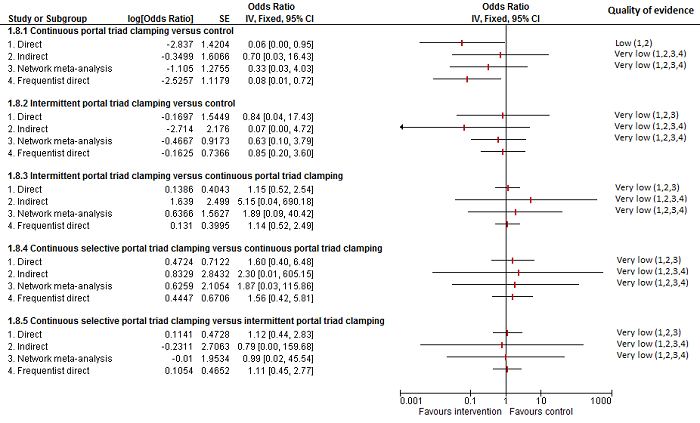
Methods of vascular occlusion: blood transfusion (proportion)
Forest plot of the comparisons in which direct and indirect estimates were available. Although the confidence intervals overlap, there appear to be some discrepancies between direct and indirect estimates for continuous portal triad clamping versus control, intermittent portal triad clamping versus control, and intermittent portal triad clamping versus continuous portal triad clamping. Direct evidence appears to be preferable over indirect evidence and network meta‐analysis based on the quality of evidence.
1Risk of bias was unclear or high in the trial(s) (downgraded by 1 point).
2Sample size was low (downgraded by 1 point).
3Confidence intervals spanned no effect and clinically significant effect (downgraded by 1 point).
4There was substantial or considerable heterogeneity (downgraded by 2 points).
Blood transfusion (red blood cells)
Ten trials reported blood transfusion quantity (red blood cells) (Belghiti 1996; Clavien 1996; Man 1997; Belghiti 1999; Wu 2002; Capussotti 2003; Figueras 2005; Liang 2009; Ni 2013; Si‐Yuan 2014). They usedseven treatments in 786 participants. The median and range of the mean blood transfusion quantity (red blood cells) reported for each treatment are as follows.
-
Control: 1.50 units and 1.90 units (two trials only).
-
Continuous hepatic vascular exclusion: 2.50 units (one trial only).
-
Continuous portal triad clamping: 1.80 units (range 0.50 to 30).
-
Continuous selective hepatic vascular exclusion: 1.00 unit (one trial only).
-
Continuous selective portal triad clamping: 1.20 units and 1.37 units (two trials only).
-
Intermittent portal triad clamping: 0.99125 units (range 0.00 to 2.54).
-
Intermittent selective portal triad clamping: 0.34 units, 2.24 units (two trials only).
Direct comparison
Based on the DIC, we chose the fixed‐effect model for comparisons with two or more studies. The blood transfusion quantity (red blood cells) was lower in the group receiving intermittent portal triad clamping than in the control (−1.50, 95% CrI −2.75 to −0.26; 100 participants; 1 study). The blood transfusion quantity (red blood cells) was lower in the group receiving continuous selective hepatic vascular exclusion than in the continuous portal triad clamping group (MD −1.20 units, 95% CrI −2.37 to −0.04; 160 participants; 1 study). The blood transfusion quantity (red blood cells) was lower in the continuous selective portal triad clamping group than in the continuous portal triad clamping group (MD −0.20 units, 95% CrI −0.31 to −0.09; 120 participants; 1 study). There was no evidence of differences in other comparisons. Exclusion of four trials in which we calculated the mean, standard deviation, or both did not change the conclusions (Man 1997; Belghiti 1999; Wu 2002; Si‐Yuan 2014).
Network meta‐analysis
Figure 18 shows the network plots. Based on the DIC, we chose the fixed‐effect model. Compared with the control group, there was evidence for a lower blood transfusion quantity (red blood cells) with continuous portal triad clamping (MD −1.25 units, 95% CrI −2.39 to −0.10), continuous selective hepatic vascular exclusion (MD −2.45 units, 95% CrI −4.08 to −0.82), continuous selective portal triad clamping (MD −1.45 units, 95% CrI −2.59 to −0.31), intermittent portal triad clamping (MD −1.36 units, 95% CrI −2.48 to −0.23), and intermittent selective portal triad clamping (MD −1.43 units, 95% CrI −2.61 to −0.24). There was no evidence of differences in other comparisons. On excluding the trials in which either mean or standard deviation was not available, there was no evidence of differences in any of the comparisons. Figure 26 shows the probability of each treatment being best, second best, third best, and so on. Figure 20 shows the cumulative probability of a treatment being best.

Probability of best treatment: probability of being best, second best, third best, etc. for each treatment for blood transfusion (red blood cells) (vascular occlusion methods). A probability of more than 90% is a reliable indicator that a treatment is best with regards to the specific outcome. A probability of less than 90% is less reliable. Intermittent selective portal triad clamping has about 90% probability of being best treatment. However, other random and systematic errors make this finding unreliable.
Con: continuous; Int: intermittent; HVE: hepatic vascular exclusion; PTC: portal triad clamping.
Direct evidence compared to network meta‐analysis
Figure 27 shows the information on direct evidence compared to network meta‐analysis. There do not appear to be any discrepancies between direct and indirect estimates, although the credible intervals are different (the direct evidence had narrower credible intervals in four of the five comparisons above) resulting in the differences in the comparisons in which there was evidence for difference. Direct evidence appears to be preferable over indirect evidence and network meta‐analysis based on the quality of evidence for the comparison 'continuous selective portal triad clamping versus continuous portal triad clamping'. Indirect evidence and network meta‐analysis appear to be preferable over direct evidence for the comparison 'continuous portal triad clamping versus control'. Direct evidence and network meta‐analysis appear to be preferable over indirect evidence for the comparison 'intermittent portal triad clamping versus control'. There was little apparent difference in the quality of evidence between direct, indirect estimates, and network meta‐analysis; so, we could not choose one estimate over the others based on the quality of evidence.

Methods of vascular occlusion:blood transfusion (red blood cells)
Forest plot of the comparisons in which direct and indirect estimates were available. There do not appear to be any discrepancies between direct and indirect estimates, although the credible intervals are different (the direct evidence had narrower credible intervals in four of the five comparisons above) resulting in the differences in the comparisons in which there was evidence for difference. Direct evidence appears to be preferable over indirect evidence and network meta‐analysis based on the quality of evidence for the comparison 'continuous selective portal triad clamping versus continuous portal triad clamping'. Indirect evidence and network meta‐analysis appear to be preferable over direct evidence for the comparison 'continuous portal triad clamping versus control'. Direct evidence and network meta‐analysis appear to be preferable over indirect evidence for the comparison 'intermittent portal triad clamping versus control'. There was little apparent difference in the quality of evidence between direct, indirect estimates, and network meta‐analysis; so, we could not choose one estimate over the others based on the quality of evidence.
1Risk of bias was unclear or high in the trial(s) (downgraded by 1 point).
2Sample size was low (downgraded by 1 point).
3Confidence intervals spanned no effect and clinically significant effect (downgraded by 1 point).
Blood transfusion (platelets)
None of the trials reported this outcome.
Blood transfusion (fresh frozen plasma)
None of the trials reported this outcome.
Blood transfusion (cryoprecipitate)
None of the trials reported this outcome.
Blood loss
Sixteen trials reported blood loss (Belghiti 1996; Man 1997; Belghiti 1999; Wu 2002; Capussotti 2003; Chouker 2004; Figueras 2005; Capussotti 2006; Chen 2006; Liang 2009; Dayangac 2010; Pietsch 2010; Lee 2012; Park 2012; Ni 2013; Si‐Yuan 2014). They used seven interventions in 1322 participants. The median and range of the mean blood loss reported for each treatment are as follows.
-
Control: 0.489 L (range 0.204 to 2.17).
-
Continuous hepatic vascular exclusion: 0.42 L and 1.195 L (two trials only).
-
Continuous portal triad clamping: 0.77 L (range 0.2 to 1.38).
-
Continuous selective hepatic vascular exclusion: 0.529 L (one trial only).
-
Continuous selective portal triad clamping: 0.3 L and 0.649 L (two trials only).
-
Intermittent portal triad clamping: 0.671 L (range 0.184 to 1.685).
-
Intermittent selective portal triad clamping: 0.735 L and 1.159 L (two trials only)..
Direct comparison
Based on the DIC, we chose the fixed‐effect model for intermittent portal triad clamping versus continuous portal triad clamping and the random‐effects model for the remaining comparisons with two or more studies. There was no evidence of differences in blood loss for any of the comparisons. Either the mean, the standard deviation, or both were not available in six trials (Man 1997; Wu 2002; Capussotti 2006; Pietsch 2010; Ni 2013; Si‐Yuan 2014). Excluding these trials did not alter the conclusions.
Network meta‐analysis
Figure 18 shows the network plots. Based on the DIC, we chose the random‐effects model. There was no evidence of differences in blood loss for any of the comparisons. Excluding the six trials in which either the mean, the standard deviation, or both were not available did not alter the results (Man 1997; Wu 2002; Capussotti 2006; Pietsch 2010; Ni 2013; Si‐Yuan 2014). Figure 28 shows the probability of each treatment being best, second best, third best, and so on. Figure 20 shows the cumulative probability of a treatment being best.

Probability of best treatment: probability of being best, second best, third best, etc. for each treatment for blood loss (vascular occlusion methods). A probability of more than 90% is a reliable indicator that a treatment is best with regards to the specific outcome. A probability of less than 90% is less reliable. None of the treatments have a 90% probability of being best treatment.
Con: continuous; Int: intermittent; HVE: hepatic vascular exclusion; PTC: portal triad clamping.
Direct evidence compared to network meta‐analysis
Figure 29 shows the information on direct evidence compared to network meta‐analysis. There do not appear to be any discrepancies between direct and indirect estimates, although the credible intervals are different (the direct evidence had narrower credible intervals in three of the five comparisons above). Direct evidence appears to be preferable over indirect evidence and network meta‐analysis based on the quality of evidence.

Methods of vascular occlusion:blood loss
Forest plot of the comparisons in which direct and indirect estimates were available. There does not appear to be any discrepancies between direct and indirect estimates, although the credible intervals are different (the direct evidence had narrower credible intervals in three of the five comparisons above). Direct evidence appears to be preferable over indirect evidence and network meta‐analysis based on the quality of evidence.
1Risk of bias was unclear or high in the trial(s) (downgraded by 1 point).
2 Sample size was low (downgraded by 1 point).
3Confidence intervals spanned no effect and clinically significant effect (downgraded by 1 point).Ç
4There was substantial or considerable heterogeneity (downgraded by 2 points).
Major blood loss (proportion)
Three trials reported the proportion of participants experiencing major blood loss (Lee 2012; Ni 2013; Si‐Yuan 2014), defined as more than one litre in Lee 2012 and Ni 2013 and as more than two litres in Si‐Yuan 2014. The trials used five interventions in 406 participants. The unadjusted proportions of participants experiencing major blood loss are as follows.
-
Control: 4/63 (6.3%).
-
Continuous portal triad clamping: 8/140 (5.7%).
-
Continuous selective hepatic vascular exclusion: 2/80 (2.5%).
-
Continuous selective portal triad clamping: 0/60 (0.0%).
-
Intermittent portal triad clamping: 5/63 (7.9%).
There was only one trial for each comparison. There was no evidence of differences in major blood loss (proportion) for any of the comparisons.
Hospital stay
Total hospital stay
Ten trials reported total hospital stay (Belghiti 1996; Man 1997; Belghiti 1999; Wu 2002; Figueras 2005; Capussotti 2006; Liang 2009; Lee 2012; Park 2012; Si‐Yuan 2014). They used seven treatments in 918 participants. The medians and ranges of the mean hospital stay reported for each treatment are as follows.
-
Control: 9 d (range 7 to 19).
-
Continuous hepatic vascular exclusion: 22 d (one trial only).
-
Continuous portal triad clamping: 14 d (range 13 to 14).
-
Continuous selective hepatic vascular exclusion: 10 d (one trial only).
-
Continuous selective portal triad clamping: 10 d (one trial only).
-
Intermittent portal triad clamping: 10 d (range 8 to 16).
-
Intermittent selective portal triad clamping: 8 d and 16 d (two trials only)..
Based on the DIC, we chose the fixed‐effect model for comparisons with two or more studies. The total hospital stay was lower in the continuous portal triad clamping group than in the continuous hepatic vascular exclusion group (MD −8.00 d, 95% CrI −13.03 to −2.95; 52 participants; 1 study; low‐quality evidence: downgraded one point for unclear or high risk of bias in trial and one more point for small sample size). The total hospital stay was lower in the continuous selective hepatic vascular exclusion group than in the continuous portal triad clamping group (MD −2.80 d, 95% CrI −4.13 to −1.47; 160 participants; 1 study; low‐quality evidence: downgraded 1 point for unclear or high risk of bias in trial and one more point for small sample size). There was no evidence of differences in other comparisons. Either the mean, the standard deviation, or both were not available in four trials (Man 1997; Wu 2002; Capussotti 2006; Lee 2012). Excluding these trials did not alter the conclusions except for intermittent portal triad clamping versus control. We excluded three of the four trials under this comparison because of the lack of availability of either the mean, the standard deviation, or both (Man 1997; Capussotti 2006; Lee 2012). Excluding these trials, the hospital stay was shorter in the intermittent portal triad clamping group than in the control (MD −3.51 d, 95% CrI −6.85 to −0.16; 50 participants; 1 study).
ITU stay
One trial reported ITU stay (Si‐Yuan 2014); the mean ITU stays reported for each treatment are as follows.
-
Continuous portal triad clamping: 1.5 d.
-
Continuous selective hepatic vascular exclusion: 1.2 d.
The ITU stay was lower in the continuous selective hepatic vascular exclusion group than in the continuous portal triad clamping group (MD −0.30 d, 95% CrI −0.55 to −0.06; 160 participants; 1 study).
Operating time
Twelve trials reported operating time (Belghiti 1996; Clavien 1996; Wu 2002; Capussotti 2003; Figueras 2005; Chen 2006; Liang 2009; Pietsch 2010; Lee 2012; Park 2012; Ni 2013; Si‐Yuan 2014). They used seven treatments in 919 participants. The medians and ranges of the mean operating times reported for each treatment are as follows.
-
Control: 292 min (range 239 to 339).
-
Continuous hepatic vascular exclusion: 133 min and 366 min (two trials only).
-
Continuous portal triad clamping: 200 min (range 116 to 301).
-
Continuous selective hepatic vascular exclusion: 131 min (one trial only).
-
Continuous selective portal triad clamping: 136 min and 236 min (two trials only).
-
Intermittent portal triad clamping: 241 min (range 204 to 409).
-
Intermittent selective portal triad clamping: 219 min and 399 min (two trials only).
Based on the DIC, we chose the fixed‐effect model for continuous portal triad clamping versus control and intermittent selective portal triad clamping versus intermittent portal triad clamping, and we used the random‐effects model for the remaining comparisons with two or more studies. The operating time was lower in the intermittent portal triad clamping group than in the continuous selective portal triad clamping group (MD −30.53 min, 95% CrI −49.68 to −11.29; 80 participants; 1 study). There was no evidence of differences in other comparisons. Either the mean, the standard deviation, or both were not available in four trials (Wu 2002; Pietsch 2010; Lee 2012; Si‐Yuan 2014). Excluding these trials did not alter the conclusions except for intermittent portal triad clamping versus control. We excluded Lee 2012 from this two‐trial comparison because no mean or standard deviation were available (Lee 2012; Park 2012). Excluding this trial, the operating time was longer in the intermittent portal triad clamping group than in the control (MD 49.63 min, 95% CrI 26.72 to 72.55; 50 participants; 1 study; low‐quality evidence: downgraded one point for unclear or high risk of bias in trial and one more point for small sample size).
Time needed to return to work
None of the trials reported this outcome.
Difference between Bayesian and frequentist meta‐analysis
The interpretation of information and conclusions did not alter by using the frequentist meta‐analysis.
Overall summary
There was no evidence of differences between the tested methods of vascular occlusion in any of the reported outcomes of interest for this review other than the following − and they all ought to be considered of low or very low quality .
-
The proportion of participants experiencing serious adverse events was lower in the continuous selective portal triad clamping group than in the continuous portal triad clamping group (OR 0.42, 95% CrI 0.18 to 0.96; 120 participants; 1 study).
-
The number of serious adverse events was lower in the intermittent portal triad clamping group than in the continuous portal triad clamping group (rate ratio 0.09, 95% CrI 0.00 to 0.56; 86 participants; 1 study).
-
The proportion of participants experiencing adverse events was lower in the continuous selective portal triad clamping group than in the continuous portal triad clamping group (OR 0.41, 95% CrI 0.18 to 0.90; 120 participants; 1 study).
-
The proportion of participants requiring a blood transfusion was lower in the continuous portal triad clamping group than in the control (OR 0.06, 95% CrI 0.00 to 0.49; 34 participants; 1 study). The proportion of participants requiring a blood transfusion was higher in the continuous portal triad clamping group than in the continuous hepatic vascular exclusion group (OR 5.90, 95% CrI 2.45 to 15.58; 118 participants; 1 study).
-
The blood transfusion quantity (red blood cells) was lower with continuous portal triad clamping than in the control (MD −1.25 units, 95% CrI −2.39 to −0.10; network meta‐analysis: 786 participants; 10 studies). The blood transfusion quantity (red blood cells) was lower in the intermittent portal triad clamping group than in the control (−1.50, 95% CrI −2.75 to −0.26; 100 participants; 1 study). The blood transfusion quantity (red blood cells) was lower in the continuous selective hepatic vascular exclusion group than in the continuous portal triad clamping group(MD −1.20 units, 95% CrI −2.37 to −0.04; 160 participants; 1 study). The blood transfusion quantity (red blood cells) was lower in the continuous selective portal triad clamping group than in the continuous portal triad clamping group (MD −0.20, 95% CrI −0.31 to −0.09; 120 participants; 1 study).
-
The hospital stay was lower in the continuous portal triad clamping group than in the continuous hepatic vascular exclusion group (MD −8.00 d, 95% CrI −13.03 to −2.95; 52 participants; 1 study). The hospital stay was lower in the continuous selective hepatic vascular exclusion group than in the continuous portal triad clamping group (MD −2.80 d, 95% CrI −4.13 to −1.47; 160 participants; 1 study).
-
The ITU stay was lower in the continuous selective hepatic vascular exclusion group than in the continuous portal triad clamping group (MD −0.30 d, 95% CrI −0.55 to −0.06; 160 participants; 1 study).
-
The operating time was lower in the intermittent portal triad clamping group than in the continuous selective portal triad clamping group (MD −30.53 min, 95% CrI −49.68 to −11.29; 80 participants; 1 study).
Pharmacological interventions
Six trials compared different pharmacological interventions (Shimada 1994; Lentschener 1997; Wong 2003; Lodge 2005; Shao 2006; Wu 2006). We did not perform network meta‐analysis since direct comparison and indirect comparison effect estimates (which would enable assessment of inconsistency) were not available for any of the outcomes.
Quality of evidence
The quality of evidence was very low for all the outcomes and comparisons unless specifically indicated within the results. This was because of unclear or high risk of bias in the trials (downgraded by one point), imprecision due to small sample size (downgraded by one point), and wide credible intervals (downgraded by one point) for all outcomes with very low quality of evidence. In addition, we downgraded the quality for blood transfusion (as a proportion of participants requiring one) by two points because of the presence of substantial or considerable heterogeneity in the pair‐wise comparison or in the network.
Mortality
Mortality (perioperative)
Two trials reported perioperative mortality (Lodge 2005; Wu 2006). They used three treatments in 399 participants. The unadjusted proportions of perioperative mortality are as follows.
-
Control: 3/165 (1.8%).
-
Recombinant factor VIIa: 4/126 (3.2%).
-
Tranexamic acid: 0/108 (0.0%).
There was no evidence of differences in perioperative mortality for any of the comparisons.
Mortality (longest follow‐up)
None of the trials reported this outcome.
Adverse events
Serious adverse events (proportion)
Three trials reported the proportion of participants experiencing serious adverse events (Shimada 1994; Lodge 2005; Shao 2006). They used three treatments in 456 participants. The unadjusted proportions of participants experiencing serious adverse events are as follows.
-
Control: 59/160 (36.9%).
-
Anti‐thrombin III: 4/13 (30.8%).
-
Recombinant factor VIIa: 111/283 (39.2%).
There was no evidence of differences in the proportion of participants experiencing serious adverse events for any of the comparisons.
Serious adverse events (number)
Three trials reported the number of serious adverse events (Lodge 2005; Shao 2006; Wu 2006). They used three treatments in 646 participants. The unadjusted rates of serious adverse events (number) are as follows.
-
Control: 20/255 (7.8 per 100 participants).
-
Recombinant factor VIIa: 35/283 (12.4 per 100 participants).
-
Tranexamic acid: 7/108 (6.5 per 100 participants).
There was no evidence of differences in the number of serious adverse events for any of the comparisons.
Adverse events (proportion)
Three trials reported the proportion of participants experiencing adverse events (Shimada 1994; Shao 2006; Wu 2006). A total of four treatments were used in a total of 470 participants in these studies. The unadjusted proportions of adverse events (proportion) are as follows.
-
Control: 98/198 (49.5%)
-
Anti‐thrombin III: 4/13 (30.8%)
-
Recombinant factor VIIa: 142/151 (94.0%)
-
Tranexamic acid: 14/108 (13.0%).
There was no evidence of differences in the proportion of participants experiencing adverse events for any of the comparisons.
Adverse events (number)
Three trials reported the number of adverse events (number) (Lodge 2005; Shao 2006; Wu 2006). They used three treatments in 646 participants. The unadjusted rates of adverse events (number) are as follows.
-
Control: 467/255 (183.1 per 100 participants).
-
Recombinant factor VIIa: 824/283 (291.2 per 100 participants).
-
Tranexamic acid: 19/108 (17.6 per 100 participants).
There was no evidence of differences in the number of adverse events reported for any of the comparisons.
Health‐related quality of life
None of the trials reported this outcome at any time point.
Blood transfusion requirements
Blood transfusion (proportion)
Five trials reported the proportion of participants requiring a blood transfusion (Lentschener 1997; Wong 2003; Lodge 2005; Shao 2006; Wu 2006). They used five treatments in 787 participants. The unadjusted proportions of participants requiring a blood transfusion (proportion) are as follows.
-
Control: 93/320 (29.1%).
-
Aprotinin: 8/48 (16.7%).
-
Desmopressin: 3/30 (10.0%).
-
Recombinant factor VIIa: 104/281 (37.0%).
-
Tranexamic acid: 0/108 (0.0%).
The the proportion of participants requiring a blood transfusion was lower in the aprotinin group (OR 0.31, 95% CrI 0.11 to 0.78; 97 participants; 1 study; low‐quality evidence: downgraded one point for unclear or high risk of bias in trial and one more point for small sample size) and in the tranexamic acid group than in the control (OR 0.01, 95% CrI 0.00 to 0.13; 214 participants; 1 study; low‐quality evidence: downgraded one point for unclear or high risk of bias in trial and one more point for small sample size). There was no evidence of differences in other comparisons.
Blood transfusion (red blood cells)
Four trials reported blood transfusion quantity (red blood cells) (Shimada 1994; Lentschener 1997; Lodge 2005; Shao 2006). They used four interventions in 537 participants. The median and range of the mean blood transfusion quantity (red blood cells) reported for each treatment are as follows.
-
Control: 2.07 units (range 0.00 to 4.40).
-
Anti‐thrombin III: 4.80 units (one trial only).
-
Aprotinin: 0.63 units (one trial only).
-
Recombinant factor VIIa: 0.40 and 3.00 units (two trials only).
We did not perform meta‐analysis since none of the studies provided both the mean and the standard deviation. The blood transfusion quantity (red blood cells) was lower in the aprotinin group than in the control (MD −0.94 units; P = 0.015; 97 participants; 1 study). There was no evidence of differences in other comparisons.
Blood transfusion (platelets)
Two trials reported blood transfusion quantity (platelets) (Lentschener 1997; Shao 2006). They used three treatments in 328 participants. No participants received a platelets transfusion in Lentschener 1997 (aprotinin versus control). The median platelets transfused was 0 in both groups in the other trial (Shao 2006; recombinant factor VIIa versus control).
Blood transfusion (fresh frozen plasma)
Three trials reported blood transfusion quantity (fresh frozen plasma) (Lentschener 1997; Wong 2003; Shao 2006). They used four treatments in 388 participants. The median and range of the mean or median blood transfusion quantity (fresh frozen plasma) reported for each treatment are as follows.
-
Control: 0.45 units (range 0.00 to 0.80).
-
Aprotinin: 0.04 units (one trial only).
-
Desmopressin: 0.20 units (one trial only).
-
Recombinant factor VIIa: 0.00 units (one trial only).
We did not perform meta‐analysis since either mean or standard deviation was not available in two trials (Lentschener 1997; Shao 2006). There was no evidence of differences in blood transfusion quantity (fresh frozen plasma) for any of the comparisons.
Blood transfusion (cryoprecipitate)
None of the trials reported this outcome.
Blood loss
Six trials reported blood loss (Shimada 1994; Lentschener 1997; Wong 2003; Lodge 2005; Shao 2006; Wu 2006). They used six treatments in 810 participants. The median and range of the mean blood loss reported for each treatment are as follows.
-
Control: 1.10 L (range 0.50 to 1.65).
-
Anti‐thrombin III: 1.86 L (one trial only).
-
Aprotinin: 1.22 L (one trial only).
-
Desmopressin: 0.83 L (one trial only).
-
Recombinant factor VIIa: 0.65 L and 1.23 L (two trials only).
-
Tranexamic acid: 0.30 L (one trial only).
We did not perform meta‐analysis since we imputed the mean, standard deviation, or both in five trials (Shimada 1994; Wong 2003; Lodge 2005; Shao 2006; Wu 2006). The blood loss was lower in the tranexamic acid group than in the control (difference in median: −0.30 L, P < 0.001; 214 participants; 1 study). There was no evidence of any difference in other comparisons.
Major blood loss (proportion)
None of the trials reported this outcome.
Total hospital stay
Hospital stay
One trial (214 participants) reported hospital stay (Wu 2006). The median hospital stays reported for each treatment are as follows.
-
Control: 9 d (one trial only).
-
Tranexamic acid: 8 d (one trial only).
There was no evidence of difference in median hospital stay between the groups.
ITU stay
None of the trials reported this outcome.
Operating time
Five trials reported operating time (Shimada 1994; Lentschener 1997; Wong 2003; Lodge 2005; Wu 2006). They used six treatments in 580 participants. The medians and ranges of the mean operating times reported for each treatment are as follows.
-
Control: 261 min (range 233 to 435).
-
Anti‐thrombin III: 233 min (one trial only).
-
Aprotinin: 232 min (one trial only).
-
Desmopressin: 405 min (one trial only).
-
Recombinant factor VIIa: 230 min (one trial only).
-
Tranexamic acid: 254min (one trial only).
The mean, standard deviation or both were not available from four studies (Shimada 1994; Wong 2003; Lodge 2005; Wu 2006). The operating time was lower in the tranexamic acid group than in the control group (difference in medians −52.20 min; P = 0.003; 214 participants; 1 study; low‐quality evidence: downgraded one point for unclear or high risk of bias in trial and one more point for small sample size). There was no evidence of differences in other comparisons.
Time needed to return to work
None of the trials reported this outcome.
Difference between Bayesian and frequentist meta‐analysis
The interpretation of information and conclusions did not alter by using the frequentist meta‐analysis.
Overall summary
There was no evidence of differences between different pharmacological interventions in any of the reported outcomes of interest for this review other than the following.
-
The proportion of participants requiring a blood transfusion was lower in the aprotinin group (OR 0.31, 95% CrI 0.11 to 0.78; 97 participants; 1 study) and in the tranexamic acid group (OR 0.01, 95% CrI 0.00 to 0.13; 214 participants; 1 study) than in the control.
-
The blood transfusion quantity (red blood cells) was lower in the aprotinin group than in the control (MD −0.94 units; P = 0.015; 97 participants; 1 study).
-
The blood loss was lower in the tranexamic acid group than in the control (difference in median: −0.3 L, P < 0.001; 214 participants; 1 study).
-
The operating time was lower in the tranexamic acid group than in the control (difference in medians −52.20 min; P = 0.003; 214 participants; 1 study).
Overall summary across all interventions
Mortality (perioperative)
There was no evidence of differences in perioperative mortality for any of the comparisons for which this information was available.
Mortality at longest follow‐up
There was no evidence of differences in mortality at longest follow‐up for any of the comparisons for which this information was available.
Serious adverse events (proportion)
-
The proportion of participants experiencing serious adverse events was lower in the continuous selective portal triad clamping group than in the continuous portal triad clamping group (OR 0.42, 95% CrI 0.18 to 0.96; 120 participants; 1 study).
-
There was no evidence of differences in other comparisons for which this information was available.
Serious adverse events (number)
-
The number of serious adverse events was higher in the fibrin sealant group than in the argon beam group (rate ratio 4.81, 95% CrI 1.73 to 17.5; 121 participants; 1 study).
-
The number of serious adverse events was lower in the intermittent portal triad clamping group than in the continuous portal triad clamping group (rate ratio 0.09, 95% CrI 0.00 to 0.56; 86 participants; 1 study).
-
There was no evidence of differences in other comparisons for which this information was available.
Adverse events (proportion)
-
The proportion of participants experiencing adverse events was lower in the continuous selective portal triad clamping group than in the continuous portal triad clamping group (OR 0.41, 95% CrI 0.18 to 0.90; 120 participants; 1 study).
-
There was no evidence of differences in other comparisons for which this information was available.
Adverse events (number)
-
The number of adverse events was higher with radiofrequency dissecting sealer than with the clamp‐crush method (rate ratio 1.85, 95% CrI 1.07 to 3.26; 250 participants; 3 studies) (Bayesian analysis only: both direct and network meta‐analysis).
-
There was no evidence of differences in other comparisons for which this information was available.
Health‐related quality of life
None of the trials reported this outcome.
Blood transfusion (proportion)
-
The proportion of participants requiring a blood transfusion was lower in the group receiving an autologous blood donation than in the control (OR 0.18, 95% CrI 0.04 to 0.66; 42 participants; 1 study).
-
The proportion of participants requiring a blood transfusion was higher in the low central venous pressure group than in the acute normovolemic haemodilution plus low central venous pressure group (OR 3.19, 95% CrI 1.56 to 6.95; 208 participants; 2 studies).
-
The proportion of participants requiring a blood transfusion was lower in the continuous portal triad clamping group than in the control (OR 0.06, 95% CrI 0.00 to 0.49; 34 participants; 1 study). The proportion of participants requiring a blood transfusion was higher in the continuous portal triad clamping group than in the continuous hepatic vascular exclusion group (OR 5.90, 95% CrI 2.45 to 15.58; 118 participants; 1 study).
-
The proportion of participants requiring a blood transfusion was lower in the aprotinin group (OR 0.31, 95% CrI 0.11 to 0.78; 97 participants; 1 study) and in the tranexamic acid group than in the control (OR 0.01, 95% CrI 0.00 to 0.13; 214 participants; 1 study).
-
There was no evidence of differences in other comparisons for which this information was available.
Blood transfusion (red blood cells)
-
Compared to control, the blood transfusion quantity (red blood cells) was lower in the acute normovolemic haemodilution group (MD −1.25 units, 95% CrI −1.75 to −0.74; 20 participants; 1 study) and in the acute normovolemic haemodilution plus hypotension group (MD −1.67 units, 95% CrI −2.06 to −1.32; 20 participants; 1 study). The blood transfusion quantity (red blood cells) was higher in the acute normovolemic haemodilution plus low central venous pressure group than in the control (MD 0.27 units, 95% CrI 0.01 to 0.52; 30 participants; 1 study).
-
The blood transfusion quantity (red blood cells) was lower in the hydrojet group than in the cavitron ultrasonic surgical aspirator group (MD −0.98 units, 95% CrI −1.90 to −0.06; 61 participants; 1 study).
-
The blood transfusion quantity (red blood cells) was lower in the fibrin sealant group than in the control (MD −0.53 units, 95% CrI −1.00 to −0.07; 122 participants; 2 studies). The blood transfusion quantity (red blood cells) was higher in the fibrin sealant group than in the cyanoacrylate group (MD 2.20 units; 95% CrI 1.59 to 2.81; 30 participants; 1 study).
-
The blood transfusion quantity (red blood cells) was lower with continuous portal triad clamping than control (MD −1.25 units, 95% CrI −2.39 to −0.10; network meta‐analysis: 786 participants; 10 studies). The blood transfusion quantity (red blood cells) was lower in the intermittent portal triad clamping group than in the control (−1.50, 95% CrI −2.75 to −0.26; 100 participants; 1 study). The blood transfusion quantity (red blood cells) was lower in the continuous selective hepatic vascular exclusion group than in the continuous portal triad clamping group (MD −1.20 units, 95% CrI −2.37 to −0.04; 160 participants; 1 study). The blood transfusion quantity (red blood cells) was lower in the continuous selective portal triad clamping group than in the continuous portal triad clamping group (MD −0.20, 95% CrI −0.31 to −0.09; 120 participants; 1 study).
-
The blood transfusion quantity (red blood cells) was lower in the aprotinin group than in the control (MD −0.94; P = 0.015; 97 participants; 1 study).
-
There was no evidence of differences in other comparisons for which this information was available.
Blood transfusion (platelets)
There was no evidence of differences in blood transfusion quantity (platelets) in any of the comparisons for which this information was available.
Blood transfusion (fresh frozen plasma)
-
The blood transfusion quantity (fresh frozen plasma) was lower in the low central venous pressure group than in the control (MD −2.48 units, 95% CrI −3.58 to −1.37; 50 participants; 1 study).
-
The blood transfusion quantity (fresh frozen plasma) was lower in the fibrin sealant group than in the cyanoacrylate group (MD −0.81 units, 95% CrI −1.04 to −0.62; 30 participants; 1 study). The blood transfusion quantity (fresh frozen plasma) was higher in the oxidised cellulose group than in the fibrin sealant group (MD 0.53 units, 95% CrI 0.36 to 0.71; 80 participants; 2 studies).
-
There was no evidence of differences in other comparisons for which this information was available.
Blood transfusion (cryoprecipitate)
There was no evidence of differences in blood transfusion quantity (cryoprecipitate) in any of the comparisons for which this information was available.
Blood loss
-
The blood loss was lower in the acute normovolemic haemodilution plus hypotension group (MD −0.25 L; 95% CrI −0.37 to −0.13; 20 participants; 1 study) and in the low central venous pressure group than in the control (MD −0.34 L, 95% CrI −0.46 to −0.22; 237 participants; 4 studies). The blood loss was lower in the acute normovolemic haemodilution plus hypotension group than in the acute normovolemic haemodilution group (MD −0.25; 95% CrI −0.40 to −0.10; 20 participants; 1 study).
-
The blood loss was lower in the tranexamic acid group than in the control (difference in median: −0.3 L, P < 0.001; 214 participants; 1 study).
-
There was no evidence of differences in other comparisons for which this information was available.
Major blood loss (proportion)
There was no evidence of differences in the proportion of participants experiencing major blood loss in any of the comparisons for which this information was available.
Hospital stay
-
The total hospital stay was lower in the low central venous pressure group than in the control (MD −2.42 d, 95% CrI −3.91 to −0.94; 197 participants; 3 studies).
-
The total hospital stay was lower in the continuous portal triad clamping group than in the continuous hepatic vascular exclusion group (MD −8.00 d, 95% CrI −13.03 to −2.95; 52 participants; 1 study). The total hospital stay was lower in the continuous selective hepatic vascular exclusion group than in the continuous portal triad clamping group (MD −2.80 d, 95% CrI −4.13 to −1.47; 160 participants; 1 study).
-
There was no evidence of differences in other comparisons for which this information was available.
ITU stay
-
The ITU stay was lower in the continuous selective hepatic vascular exclusion group than in the continuous portal triad clamping group (MD −0.30 d, 95% CrI −0.55 to −0.06; 160 participants; 1 study).
-
There was no evidence of differences in other comparisons for which this information was available.
Operating time
-
The operating time was lower in the low central venous pressure group than in the control (MD −15.32 min, 95% CrI −29.03 to −1.69; 192 participants; 4 studies).
-
The operating time was lower in the stapler resection group than in the clamp‐crush method group with frequentist meta‐analysis (MD −31.00 min, 95% CI −60.40 to −1.60; 130 participants; 1 study) (frequentist analysis only).
-
The operating time was higher in the fibrin sealant and collagen group than in the control (MD 19.72 min, 95% CrI 2.93 to 36.57; 300 participants; 1 study).
-
The operating time was lower in the intermittent portal triad clamping group than in the continuous selective portal triad clamping group (MD −30.53 min, 95% CrI −49.68 to −11.29; 80 participants; 1 study).
-
The operating time was lower in the tranexamic acid group than in the control (difference in medians −52.20 min; P = 0.003; 214 participants; 1 study).
-
There was no evidence of differences in other comparisons for which this information was available.
Time needed to return to work
None of the trials reported this outcome.
Subgroup analysis
We did not perform subgroup analyses because of the paucity of data.
Reporting bias
For outcomes with 10 or more trials, we explored reporting bias using funnel plots. There were nine comparisons with at least 10 trials. Of these, there was no evidence of funnel plot asymmetry on visualisation for perioperative mortality for methods of parenchymal transection, methods of dealing with cut surface, or methods of vascular occlusion. There was funnel plot asymmetry in the remaining six comparisons, all of which fall under the comparison of different methods of vascular occlusion: adverse events (proportion), blood transfusion (proportion), blood transfusion (red blood cells), blood loss, hospital stay, and operating time. The funnels plots of blood transfusion (proportion), blood transfusion (red blood cells), and blood loss are shown in Figure 30, Figure 31, and Figure 32.

Funnel plot of blood transfusion (proportion): The funnel plot shows funnel plot asymmetry (i.e. some trials with large variance with large effects favouring one treatment were not matched by other trials with similarly large variance with large effects favouring the other treatment). This may be evidence of reporting bias or could be because of heterogeneity between the studies.

Funnel plot of blood transfusion (red blood cells): The funnel plot shows funnel plot asymmetry (i.e. some trials with large variance with large effects favouring one treatment were not matched by other trials with similarly large variance with large effects favouring the other treatment). This may be evidence of reporting bias or could be because of heterogeneity between the studies.

Funnel plot of blood loss: The funnel plot shows funnel plot asymmetry (i.e. some trials with large variance with large effects favouring one treatment were not matched by other trials with similarly large variance with large effects favouring the other treatment). This may be evidence of reporting bias or could be because of heterogeneity between the studies.
Since none of the comparisons had 10 or more trials, we did not perform Egger's test to assess the funnel plot asymmetry.
Discusión
Resumen de los resultados principales
En este metanálisis en red actualizado se compararon todas las intervenciones encaminadas a reducir la pérdida sanguínea y la necesidad de transfusión sanguínea en los pacientes sometidos a resección hepática. Se incluyeron 67 ensayos clínicos aleatorios con 6197 participantes en esta revisión. Un total de 5771 participantes en 64 ensayos proporcionaron datos para uno o más resultados evaluados.
Para realizar un metanálisis en red, es necesario satisfacer la presuposición de transitividad, o sea, los participantes tuvieron que ser suficientemente similares entre las comparaciones pareadas. Aunque algunos ensayos restringieron el reclutamiento de los participantes a los que no presentaban hígados con cirrosis o eran sometidos a resecciones hepáticas mayores, otros no. Aunque no existen pruebas claras de una interacción entre la presencia de cirrosis o la extensión de la resección hepática y el efecto del tratamiento, la falta de pruebas que apoyen una interacción no significa que no exista. Por ejemplo, los estudios de investigación experimentales han indicado que los hígados con cirrosis son más sensibles a la isquemia que los hígados normales (Figueras 1997; Jang 2008). Por lo tanto, la oclusión vascular puede ser beneficiosa al limitar la pérdida sanguínea en los pacientes sin cirrosis, mientras que el mismo tratamiento puede ser perjudicial en los pacientes con hígado con cirrosis. Cuando diferentes ensayos utilizan diferentes tipos de participantes (con respecto a la presencia de cirrosis), pueden presentarse problemas con la heterogeneidad clínica en las comparaciones pareadas y socavar la presuposición de transitividad en el metanálisis en red. De igual manera, un método de tratamiento de la superficie cortada puede ser más beneficioso en los pacientes sometidos a resecciones hepáticas mayores con superficies cortadas más grandes que en los sometidos a resecciones hepáticas menores con superficies cortadas más pequeñas que sangran. En presencia de datos suficientes, se podría haber evaluado la interacción entre los efectos del tratamiento y la presencia de cirrosis y la extensión de la resección hepática; sin embargo, esto no fue posible debido a la escasez de los datos. Por lo tanto, no es posible formular observaciones sobre la presuposición de transitividad. Se realizaron metanálisis en red sólo cuando se calculó el efecto directo e indirecto de una de más comparaciones en una red. Lo anterior permitió evaluar la inconsistencia en la red. Aunque no se encontraron inconsistencias en las redes, la falta de pruebas de inconsistencia no indicó que los resultados fueran consistentes. Con la escasez de datos debido a los pocos ensayos y los pocos participantes en cada comparación, no fue posible establecer conclusiones firmes acerca de la inconsistencia. Asimismo, la escasez de datos reduce la confianza en los resultados del metanálisis en red. Como resultado de estas limitaciones, los lectores deben interpretar este metanálisis en red con precaución. No obstante, estos resultados proporcionan estimaciones relativas entre los tratamientos que no se han comparado en comparaciones directas.
Se presenta el resumen de hallazgos en el Resumen de hallazgos para la comparación principal, Apéndice 9 y Apéndice 10, así como en la sección Resultados. No hubo pruebas de diferencias de la mayoría de las comparaciones y cuando dichas diferencias existieron fueron en ensayos únicos, la mayoría con un tamaño pequeño de la muestra. Sin la confirmación de los hallazgos en ensayos adicionales, en conjunto con la falta de información en algunos (posiblemente debido al informe selectivo de los resultados), las pruebas de estos ensayos únicos no son fiables. Debido a lo anterior sólo se analizarán a continuación las pruebas que estaban disponibles en más de un ensayo. De los resultados primarios, la única comparación que mostró pruebas de una diferencia fue el número de eventos adversos y fue mayor con el cauterizador de disección de radiofrecuencia que con el método de pinzamiento y trituración (cociente de tasas 1,85; IC del 95%: 1,07 a 3,26; 250 participantes; tres estudios). Sin embargo, incluso en esta comparación, los intervalos de confianza se superponen con una diferencia clínicamente no significativa (es decir, diferencia < del 20%). Por lo tanto, hay incertidumbre significativa en la diferencia en el número de eventos adversos entre los pacientes en los que se utilizó el cauterizador de disección de radiofrecuencia en comparación con el método de pinzamiento y trituración debido a la imprecisión, además de la incertidumbre provocada por el riesgo de sesgo en los ensayos.
No hubo evidencia de una reducción de la mortalidad para ninguna de las intervenciones. La pérdida sanguínea grave puede provocar insuficiencia multiorgánica que conduce a sepsis y muerte. La mortalidad fue generalmente baja en todos los grupos comparada con la informada en estudios previos (Finch 2007). Este resultado se puede deber a la selección cuidadosa de los participantes incluidos en los ensayos clínicos aleatorios en comparación con una serie de pacientes consecutivos, que informa los resultados de todas las resecciones hepáticas. Los cálculos de los tamaños de la muestra se proporcionaron según la mortalidad del 1,8% observada en los grupos control. Para demostrar una reducción relativa significativa del 20% en la mortalidad (reducción del riesgo relativo del 20%) del 1,8% al 1,4%, se requieren aproximadamente 38 000 participantes para una única comparación directa con una intervención. Como se muestra en el Apéndice 7, el tamaño de la muestra efectivo en una comparación indirecta que incluye solamente tres tratamientos es sólo una fracción del número de participantes incluidos en los ensayos. Por ejemplo, 10 000 participantes incluidos en las comparaciones indirectas equivalen a menos de 2000 participantes "directos" en ausencia de heterogeneidad y a menos de 1000 participantes "directos" en presencia de heterogeneidad moderada. Incluso sin estos cálculos complicados, se puede observar fácilmente que los intervalos de confianza fueron muy amplios, lo que significa que no es posible descartar un efecto beneficioso o perjudicial significativo de los tratamientos diferentes en cuanto a la mortalidad. Aproximadamente el 16,7% de los pacientes del grupo control (como se definió anteriormente) desarrollaron eventos adversos graves. Para demostrar una reducción relativa significativa del 20% en los eventos adversos graves (reducción del riesgo relativo del 20%) del 16,7% al 13,4%, se requieren aproximadamente 3592 participantes para una única comparación directa con una intervención específica. Esta masa crítica de información no se ha alcanzado y existe riesgo significativo de errores aleatorios tipo I (alfa) y tipo II (beta), o sea, existe un riesgo significativo de obtener conclusiones falsas positivas y falsas negativas. Debido al número de participantes que se requieren para mostrar un efecto beneficioso significativo del tratamiento con respecto a la mortalidad y los eventos adversos graves, es poco probable que se patrocinen ensayos con la magnitud suficiente.
De los resultados secundarios, la medida de resultado principal de los ensayos incluidos fue la pérdida sanguínea y la necesidad de transfusión. Las únicas comparaciones con más de un ensayo donde hubo pruebas de diferencias fueron las siguientes: proporción de participantes que necesitaron una transfusión sanguínea fue mayor en el grupo de presión central venosa baja que en el grupo de hemodilución normovolémica aguda más presión central venosa baja; la transfusión sanguínea (eritrocitos) fue inferior en el grupo de sellador de fibrina que en el control; la transfusión sanguínea (plasma fresco congelado) fue mayor en el grupo de celulosa oxidada que en el grupo de sellador de fibrina; y la pérdida sanguínea, la duración total de la estancia hospitalaria y el tiempo quirúrgico fueron inferiores con la presión venosa central baja en comparación con el control. Los ensayos midieron la pérdida sanguínea de diferentes maneras. La mayoría de los informes no especificaron si midieron la cantidad de sangre obtenida en la succión, pesaron las torundas o midieron la disminución de la hemoglobina. En cualquier caso, lo anterior sólo es importante si la intervención reduce la necesidad de transfusión sanguínea, el tiempo quirúrgico o los eventos adversos graves. Excepto la presión venosa central baja, que reduce la pérdida sanguínea, el tiempo quirúrgico y la estancia hospitalaria, ninguna de las intervenciones redujeron de forma sistemática la necesidad de trasfusión sanguínea ni mejoraron otros resultados clínicos.
Aproximadamente el 21,8% de los pacientes del grupo control necesitaron una transfusión sanguínea. La reducción de esta necesidad puede disminuir las reacciones anafilácticas relacionadas con la transfusión y la transmisión de enfermedades relacionadas con la transfusión. Además, hay costos significativos asociados con la transfusión sanguínea, de manera que este es un resultado importante. Para demostrar una reducción relativa del 20% (significativa) de los eventos adversos graves (reducción del riesgo relativo del 20%) del 21,8% al 17,4%, se requieren aproximadamente 2600 participantes para una comparación directa única con una intervención específica. Esta masa crítica de información no se ha alcanzado y también hay riesgo significativo de errores aleatorios alfa y beta en los resultados secundarios.
Ninguno de los ensayos informó la calidad de vida, que es un resultado importante utilizado para evaluar el costo‐eficacia de un tratamiento en un sistema de asistencia sanitaria financiado por el estado. Debido a que la calidad de vida dependería de diversos factores que incluyen las complicaciones perioperatorias, la duración de la estancia hospitalaria y el tiempo necesario para regresar al trabajo, es probable que sea más fácil demostrar una diferencia significativa en la calidad de vida si el tratamiento es efectivo que demostrar una diferencia en la mortalidad o los eventos adversos graves. Los ensayos clínicos aleatorios futuros deben utilizar una medida validada de calidad de vida como uno de los resultados. Es probable que los eventos adversos graves den lugar a la reducción en la calidad de vida de los pacientes y aumenten los costos del profesional sanitario y, por lo tanto, son variables principales de evaluación más importantes que una disminución moderada en la transfusión sanguínea. La duración total de la estancia hospitalaria y la estancia en la unidad de terapia intensiva son importantes para los pacientes, los cuidadores y los financiadores de la asistencia sanitaria. Estos resultados se deben informar en los ensayos futuros que evalúen las intervenciones para reducir la pérdida sanguínea o la necesidad de transfusión sanguínea. Ninguno de los ensayos informó el tiempo necesario para regresar al trabajo, que es un resultado importante para el paciente y los cuidadores a falta de un efecto beneficioso significativo sobre la enfermedad, y es un resultado importante para el profesional sanitario en un sistema de asistencia sanitaria financiado por el estado, con efectos beneficiosos significativos sobre la enfermedad.
El objetivo principal de utilizar diferentes métodos de resección hepática es limitar la pérdida sanguínea y la necesidad de transfusión sanguínea. Algunos métodos no requieren equipos adicionales (p.ej. oclusión vascular), mientras que otros métodos los necesitan (p.ej. aspirador quirúrgico ultrasónico cavitron o cauterizador de disección de radiofrecuencia). Ninguna de las intervenciones que requieren equipo especial fue mejor que el método de pinzamiento y trituración en cuanto a la necesidad de transfusión sanguínea u otros resultados importantes orientados al paciente y, por lo tanto, no se puede recomendar en lugar de la norma. Sin embargo, como se mencionó previamente, hay un riesgo significativo de errores aleatorios debido a los tamaños pequeños de la muestra y los efectos beneficiosos o perjudiciales posiblemente importantes.
Compleción y aplicabilidad general de las pruebas
Los participantes incluidos en este ensayo recibieron resección hepática abierta electiva y en general eran apropiados para recibir anestesia. Los resultados de esta revisión son aplicables sólo a dichos pacientes.
Calidad de la evidencia
La calidad general de la evidencia fue baja o muy baja como se muestra en el Resumen de los hallazgos para la comparación principal, Apéndice 9 y Apéndice 10. El riesgo de sesgo fue alto en muchos de los dominios de los ensayos. El uso de métodos apropiados de asignación al azar y de informe sobre el método de asignación al azar reducirá de forma adecuada el sesgo de selección. Aunque los cirujanos que realizan la cirugía no se pueden cegar a los tratamientos, es posible cegar a los cirujanos que participan en el tratamiento posoperatorio diario del paciente. Aunque puede ser difícil cegar al anestesista a los grupos de tratamiento, el uso de criterios objetivos para la transfusión puede superar el problema del sesgo debido a la falta de cegamiento con respecto a la transfusión sanguínea intraoperatoria (NHS Blood and Transplant 2007). Es fácil cegar al intensivista involucrado en la atención posoperatoria del paciente. Los criterios objetivos para la detección de las complicaciones, junto con el tratamiento posoperatorio del paciente por un equipo de atención sanitaria que no participó en la cirugía, pueden reducir el sesgo de detección y de realización. Aunque el cegamiento de los participantes y los profesionales sanitarios no se tomó como criterio para considerar que el ensayo tenía bajo riesgo de sesgo (es decir, incluso si se consideró que los ensayos tenían bajo riesgo de sesgo si se consideraron con bajo riesgo de sesgo en todos los dominios, excepto en el cegamiento de los participantes y los profesionales sanitarios), ninguno de los ensayos se habría considerado con bajo riesgo de sesgo. Con respecto a los abandonos, asignar al azar a los participantes después de confirmar que el tumor se puede eliminar puede evitar los abandonos después de la asignación al azar debido a la diseminación metastásica identificada en el momento de la laparotomía. Esta situación puede causar sesgo de deserción. La información sobre todos los resultados clínicos importantes puede reducir el sesgo de informe selectivo.
Hubo heterogeneidad en algunas de las comparaciones, lo que dio lugar a la disminución del nivel de las pruebas, pero no se observó heterogeneidad en la mayoría de las comparaciones en las que hubo dos o más ensayos. Sin embargo, no fue posible evaluar la consistencia de las pruebas en muchas comparaciones debido a la presencia de ensayos únicos.
Las estimaciones del efecto fueron amplias y los intervalos de confianza abarcaron 0,80 (una reducción del 20%) o 1,20 (un aumento del 20%), y ambos se pueden considerar efectos clínicamente significativos. El número total de participantes incluidos en el análisis fue sólo una fracción pequeña del tamaño de la muestra necesario incluso sin ajustar para la heterogeneidad. Estos resultados indican que hay riesgo significativo de imprecisión en todas las comparaciones. Los ensayos futuros deben tener un poder estadístico suficiente para reducir el riesgo de errores aleatorios. No hubo indireccionalidad de las pruebas en ninguno de los resultados. Aunque no se encontraron sesgos de informe debido a la escasez de ensayos que impidió la creación de gráficos en embudo, muchos de los ensayos no informaron de manera suficiente algunos de los resultados importantes. Solamente 25 ensayos (37,3%) informaron la mortalidad y los eventos adversos graves, aunque estos resultados se deben medir de forma sistemática en los ensayos que comparen las intervenciones dirigidas a limitar la pérdida sanguínea. Lo anterior indica pruebas indirectas de sesgo de informe.
Sesgos potenciales en el proceso de revisión
Se seleccionaron varias bases de datos sin restricciones de idiomas y el metanálisis se realizó según NICE TSU (Dias 2012a; Dias 2012b; Dias 2012c; Dias 2013a; Dias 2013b; Dias 2013c; Dias 2013d; Dias 2013e). El metanálisis en red se realizó sólo cuando los tratamientos estaban conectados entre sí y sólo cuando fue posible obtener estimaciones directas e indirectas para una comparación. Este hecho permitió evaluar la calidad de las pruebas de las estimaciones directas, las estimaciones indirectas y las estimaciones del metanálisis en red, y elegir las estimaciones con la mejor calidad de las pruebas. Estas son fortalezas del proceso de revisión.
La principal posible fuente de sesgo fue que cada una de estas intervenciones (diferentes métodos de intervenciones cardiopulmonares, métodos de transección del parénquima, métodos de tratamiento de la superficie bruta, métodos de oclusión vascular e intervenciones farmacológicas) se consideró como redes separadas. Lo anterior se debió a la falta de información suficiente en los ensayos (lo que dio lugar a que hubiera muy pocos ensayos en la versión anterior) y al diseño de los ensayos. En muchos de los ensayos a los cirujanos involucrados en el ensayo se les permitió elegir el método de resección hepática aparte del factor que se asignó al azar. Este diseño se basa en la presuposición de que los otros factores son independientes entre sí, o sea, no hay una interacción entre los factores, o la elección de un factor no depende de la elección de otro factor. No hay pruebas a favor o en contra de esta presuposición. Sin embargo, si se planificó incluir solamente ensayos en los que se incluyeron todos los factores, incluso así no se habrían podido incluir tantos ensayos como se hizo en la versión anterior, ya que ahora se incluyeron todas las intervenciones dirigidas a limitar la pérdida sanguínea y la necesidad de transfusión sanguínea durante la resección hepática. Cada uno de los factores es independiente del otro, es decir, el método de transección del parénquima no afecta el método de oclusión vascular que utilice el cirujano. Sin embargo, es muy posible que hubiera interacciones entre los diferentes métodos. Por ejemplo, cuando se eligió un método de transección del parénquima con pérdida sanguínea alta, se pueden haber utilizado intervenciones adicionales como la goma de fibrina para tratar la superficie cortada (aunque actualmente no hay pruebas de que la goma de fibrina sea efectiva). Es posible que dicho uso no signifique necesariamente que hubiera una interacción, a menos que hubiera una diferencia sistemática en el uso de los otros métodos para limitar la pérdida sanguínea entre la intervención y el control. Sin embargo, sólo sería posible evaluarlo si hay detalles acerca de todos los métodos para reducir la pérdida sanguínea a partir del informe del ensayo. Los ensayos futuros deben describir los métodos utilizados para reducir la pérdida sanguínea aunque no fuera el factor asignado al azar. Sólo es posible evaluar la presencia de interacción (es decir, la intervención es más efectiva o menos efectiva en dependencia de la presencia o la ausencia de un segundo factor) en ensayos factoriales bien diseñados. Sin embargo, el tamaño de la muestra requerido para detectar una interacción es mucho mayor que el análisis primario habitual de los "márgenes". Es muy poco probable que se puedan realizar ensayos con poder estadístico para medir las interacciones debido al tamaño muy grande de la muestra.
Se excluyeron los estudios que compararan variaciones en los métodos enumerados en la Tabla 1, la Tabla 2, la Tabla 3 y la Tabla 4 y las variaciones en el método se consideraron como un tratamiento único. Por ejemplo, el pinzamiento intermitente de la tríada portal de diferentes duraciones se incluyó como un tratamiento único y no incluyó comparaciones de diferentes métodos de pinzamiento intermitente de la tríada portal, a menos que los ensayos lo compararan con un método diferente de oclusión vascular. Por lo tanto, esta revisión no proporciona información sobre si una variación es mejor que otra. Las desviaciones estándar se imputaron cuando no estuvieron disponibles a partir de los ensayos. Se realizó un análisis de sensibilidad en todas estas situaciones y no hubo cambios en los resultados.
Otra limitación importante de la revisión fue la escasez de datos. Muchas de las redes tuvieron pocos lazos cerrados (es decir, cuando estuvieron disponibles pruebas directas e indirectas para una comparación particular). Además, se incluyeron pocos ensayos en cada comparación. Lo anterior también hace que la evaluación de la inconsistencia tenga poco poder estadístico. La ausencia de pruebas de inconsistencia no se debe considerar lo mismo que la falta de inconsistencia. Esta escasez de datos reduce la confianza en los resultados del metanálisis en red.
Diferentes intervenciones pueden tener diferentes efectos según la extensión de la resección hepática y si el resto del hígado presenta la enfermedad. Sin embargo, no fue posible evaluar esta posibilidad debido a la escasez de los datos.
En esta revisión, sólo se incluyeron ensayos clínicos aleatorios. Aunque esta decisión es la mejor manera de impedir que se establezcan conclusiones falsas sesgadas sobre los efectos beneficiosos de un tratamiento, los efectos perjudiciales del tratamiento no se pueden determinar completamente. Lo anterior se debe al grupo muy seleccionado de pacientes que entran en los ensayos clínicos aleatorios en comparación con la práctica clínica. Además, los ensayos clínicos aleatorios pueden no informar sobre los eventos adversos graves poco frecuentes o tardíos, sencillamente debido a que en general tienen un tamaño pequeño de la muestra y una duración corta del seguimiento.
Acuerdos y desacuerdos con otros estudios o revisiones
Esta es una actualización del primer metanálisis en red de 2014 sobre los métodos para reducir la pérdida sanguínea durante la resección hepática (Simillis 2014). En aquella revisión se concluyó que la resección hepática con el uso de un cauterizador de disección de radiofrecuencia sin oclusión vascular o sellador de fibrina puede aumentar los eventos adversos graves. En dicha revisión también se destacó la escasez de los datos. Previamente, también se compararon los componentes individuales incluidos en esta revisión y se concluyó que la oclusión vascular intermitente y el método de pinzamiento y trituración pueden disminuir la pérdida sanguínea (Gurusamy 2009a; Gurusamy 2009b). En esta revisión se concluyó que no existen pruebas de ninguna ventaja significativa de diferentes métodos de resección hepática con respecto a la pérdida sanguínea. Las diferencias en la conclusión se pueden deber a la disminución en la importancia que se le ha dado a elegir ensayos únicos con un tamaño pequeño de la muestra y a la inclusión de ensayos en los que no se informaron los métodos, o donde otros aspectos de la resección hepática diferentes del componente que se comparó se eligieron de una manera no aleatoria.

Study flow diagram.

Risk of bias graph: review authors' judgements about each risk of bias item presented as percentages across all included studies.

Risk of bias summary: review authors' judgements about each risk of bias item for each included study.

The network plot showing the comparisons in the trials included in the comparison of cardiopulmonary interventions in which network meta‐analysis was performed. The size of the node (circle) provides a measure of the number of trials in which the particular treatment was included as one of the arms. The thickness of the line provides a measure of the number of direct comparisons between two nodes (treatments).
ANH: acute normovolemic haemodilution; CVP: central venous pressure; RBC: red blood cells.
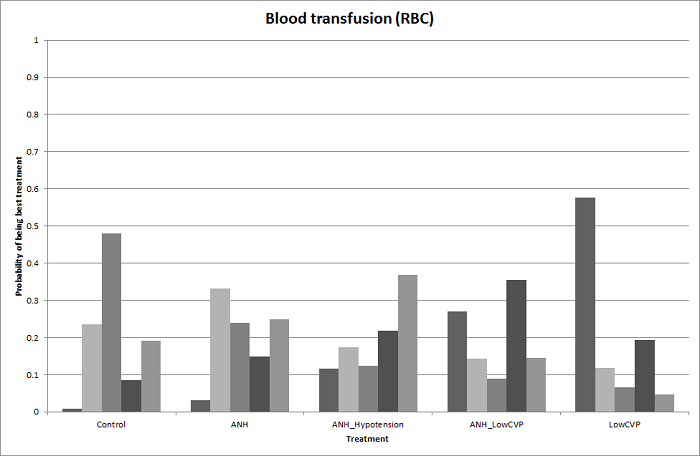
Probability of best treatment: probability of being best, second best, third best, etc. for each treatment for blood transfusion (red blood cells) (cardiopulmonary interventions). A probability of more than 90% is a reliable indicator that a treatment is best with regards to the specific outcome. A probability of less than 90% is less reliable. None of the treatments have a 90% probability of being best treatment.
ANH: acute normovolemic haemodilution; CVP: central venous pressure; RBC: red blood cells.

Cumulative probability of being best treatment: cumulative probability of being best for each treatment for cardiopulmonary interventions. Rank 1 indicates the probability that a treatment is best, rank 2 indicates the probability that a treatment is in the two best treatments, rank 3 indicates the probability that a treatment is in the three best treatments, and so on.
ANH: acute normovolemic haemodilution; CVP: central venous pressure; RBC: red blood cells.
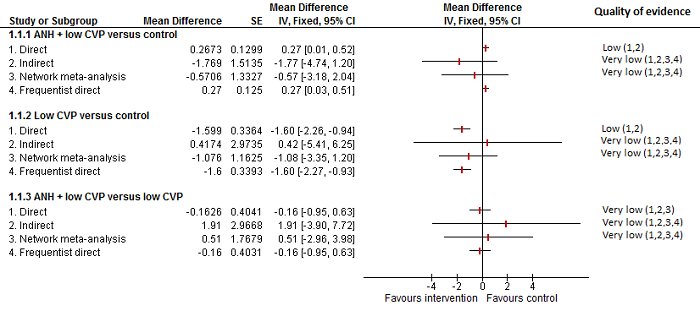
Cardiopulmonary intervention: blood transfusion (red blood cells)
Forest plot of the comparisons in which direct and indirect estimates were available. The mean effect is in opposite directions in the indirect estimate and the direct estimates, thus suggesting that there may be discrepancies between direct and indirect estimates. Direct evidence appears to be preferable over indirect evidence and network meta‐analysis based on the quality of evidence.
1 Risk of bias was unclear or high in the trial(s) (downgraded by 1 point).
2 Sample size was low (downgraded by 1 point).
3Confidence intervals spanned no effect and clinically significant effect (downgraded by 1 point).
4There was substantial or considerable heterogeneity (downgraded by 2 points).

Probability of best treatment: probability of being best, second best, third best, etc. for each treatment for blood loss (cardiopulmonary interventions). A probability of more than 90% is a reliable indicator that a treatment is best with regards to the specific outcome. A probability of less than 90% is less reliable. None of the treatments have a 90% probability of being best treatment.
ANH: acute normovolemic haemodilution; CVP: central venous pressure.
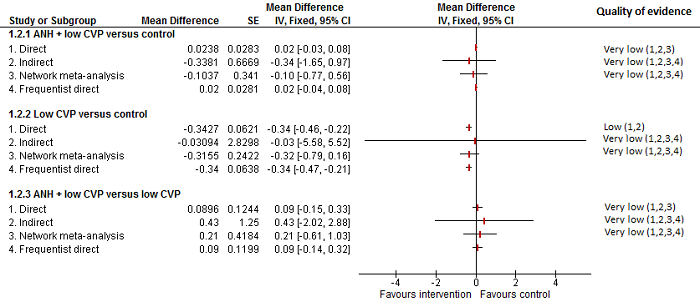
Cardiopulmonary intervention: blood loss
Forest plot of the comparisons in which direct and indirect estimates were available. There does not appear to be any discrepancy between the direct and indirect estimates, although the indirect estimates have wide credible intervals.
Direct evidence appears to be preferable over indirect evidence and network meta‐analysis based on the quality of evidence.
ANH: acute normovolemic haemodilution; CVP: central venous pressure.
1Risk of bias was unclear or high in the trial(s) (downgraded by 1 point).
2Sample size was low (downgraded by 1 point).
3Confidence intervals spanned no effect and clinically significant effect (downgraded by 1 point).
4There was substantial or considerable heterogeneity (downgraded by 2 points).

The network plot showing the comparisons in the trials included in the comparison of methods for parenchymal transection in which network meta‐analysis was performed. The size of the node (circle) provides a measure of the number of trials in which the particular treatment was included as one of the arms. The thickness of the line provides a measure of the number of direct comparisons between two nodes (treatments).
CUSA: cavitron ultrsonic surgical aspirator; RFDS: radiofrequency dissecting sealer.
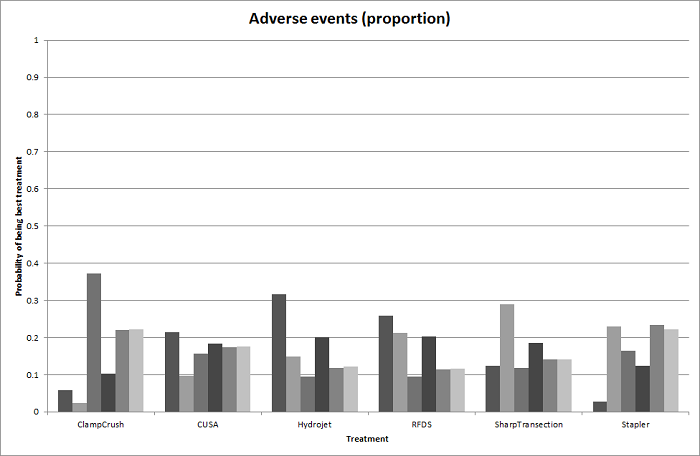
Probability of best treatment: probability of being best, second best, third best, etc. for each treatment for adverse events (proportion) (parenchymal transection methods). A probability of more than 90% is a reliable indicator that a treatment is best with regards to the specific outcome. A probability of less than 90% is less reliable. None of the treatments have a 90% probability of being best treatment.
CUSA: cavitron ultrsonic surgical aspirator; RFDS: radiofrequency dissecting sealer.
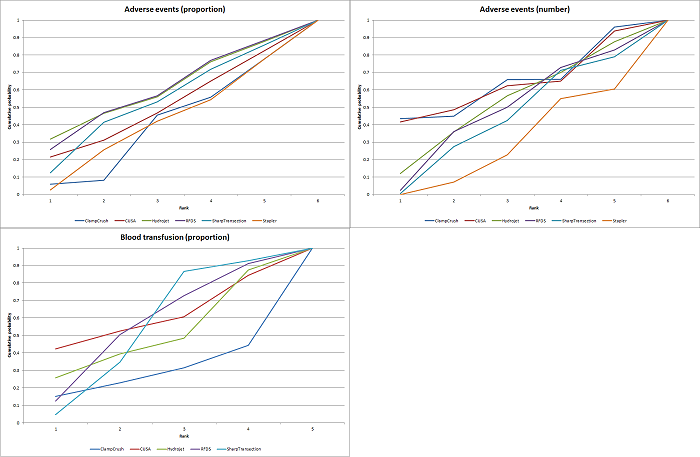
Cumulative probability of being best treatment: cumulative probability of being best for each treatment for parenchymal transection methods. Rank 1 indicates the probability that a treatment is best, rank 2 indicates the probability that a treatment is in the two best treatments, rank 3 indicates the probability that a treatment is in the three best treatments, and so on.
CUSA: cavitron ultrsonic surgical aspirator; RFDS: radiofrequency dissecting sealer.

Parenchymal transection: adverse events (proportion)
Forest plot of the comparisons in which direct and indirect estimates were available. There does not appear to be any discrepancy between the direct and indirect estimates, although the indirect estimates have wide credible intervals.
Direct evidence appears to be preferable over indirect evidence and network meta‐analysis based on the quality of evidence.
CUSA: cavitron ultrsonic surgical aspirator; RFDS: radiofrequency dissecting sealer.
1Risk of bias was unclear or high in the trial(s) (downgraded by 1 point).
2Sample size was low (downgraded by 1 point).
3Confidence intervals spanned no effect and clinically significant effect (downgraded by 1 point).
4There was substantial or considerable heterogeneity (downgraded by 2 points).

Probability of best treatment: probability of being best, second best, third best, etc. for each treatment for adverse events (number) (parenchymal transection methods). A probability of more than 90% is a reliable indicator that a treatment is best with regards to the specific outcome. A probability of less than 90% is less reliable. None of the treatments have a 90% probability of being best treatment.
CUSA: cavitron ultrsonic surgical aspirator; RFDS: radiofrequency dissecting sealer.

Parenchymal transection: adverse events (number)
Forest plot of the comparisons in which direct and indirect estimates were available. There does not appear to be any discrepancy between the direct and indirect estimates.
Direct evidence appears to be preferable over indirect evidence and network meta‐analysis based on the quality of evidence.
CUSA: cavitron ultrsonic surgical aspirator; RFDS: radiofrequency dissecting sealer.
1Risk of bias was unclear or high in the trial(s) (downgraded by 1 point).
2Sample size was low (downgraded by 1 point).
3Confidence intervals spanned no effect and clinically significant effect (downgraded by 1 point).

Probability of best treatment: probability of being best, second best, third best, etc. for each treatment for blood transfusion (proportion) (parenchymal transection methods). A probability of more than 90% is a reliable indicator that a treatment is best with regards to the specific outcome. A probability of less than 90% is less reliable. None of the treatments have a 90% probability of being best treatment.
CUSA: cavitron ultrsonic surgical aspirator; RFDS: radiofrequency dissecting sealer.

Parenchymal transection:blood transfusion (proportion)
Forest plot of the comparisons in which direct and indirect estimates were available. There does not appear to be any discrepancy between the direct and indirect estimates, although the indirect estimates have wide credible intervals for some comparisons. There was little apparent difference in the quality of evidence between direct, indirect estimates, and network meta‐analysis; so, we could not choose one estimate over the others based on the quality of evidence.
CUSA: cavitron ultrsonic surgical aspirator; RFDS: radiofrequency dissecting sealer.
1Risk of bias was unclear or high in the trial(s) (downgraded by 1 point).
2Sample size was low (downgraded by 1 point).
3Confidence intervals spanned no effect and clinically significant effect (downgraded by 1 point).

The network plot showing the comparisons in the trials included in the comparison of methods for vascular occlusion in which network meta‐analysis was performed. The size of the node (circle) provides a measure of the number of trials in which the particular treatment was included as one of the arms. The thickness of the line provides a measure of the number of direct comparisons between two nodes (treatments).
Con: continuous; Int: intermittent; HVE: hepatic vascular exclusion; PTC: portal triad clamping; RBC: red blood cells.

Probability of best treatment: probability of being best, second best, third best, etc. for each treatment for serious adverse events (proportion) (vascular occlusion methods). A probability of more than 90% is a reliable indicator that a treatment is best with regards to the specific outcome. A probability of less than 90% is less reliable. None of the treatments have a 90% probability of being best treatment.
Con: continuous; Int: intermittent; HVE: hepatic vascular exclusion; PTC: portal triad clamping.

Cumulative probability of being best treatment: cumulative probability of being best for each treatment for vascular occlusion methods. Rank 1 indicates the probability that a treatment is best, rank 2 indicates the probability that a treatment is in the two best treatments, rank 3 indicates the probability that a treatment is in the three best treatments, and so on.
Con: continuous; Int: intermittent; HVE:hepatic vascular exclusion; PTC: portal triad clamping.

Methods of vascular occlusion: serious adverse events (proportion)
Forest plot of the comparisons in which direct and indirect estimates were available. Although there is overlap of confidence intervals, the mean indirect estimate seems to be quite different from the direct estimate (sometimes, suggesting an opposite effect), thus suggesting that there may be discrepancies between direct and indirect estimates.
There was little apparent difference in the quality of evidence between direct, indirect estimates, and network meta‐analysis; so, we could not choose one estimate over the others based on the quality of evidence.
1Risk of bias was unclear or high in the trial(s) (downgraded by 1 point).
2Sample size was low (downgraded by 1 point).
3Confidence intervals spanned no effect and clinically significant effect (downgraded by 1 point).
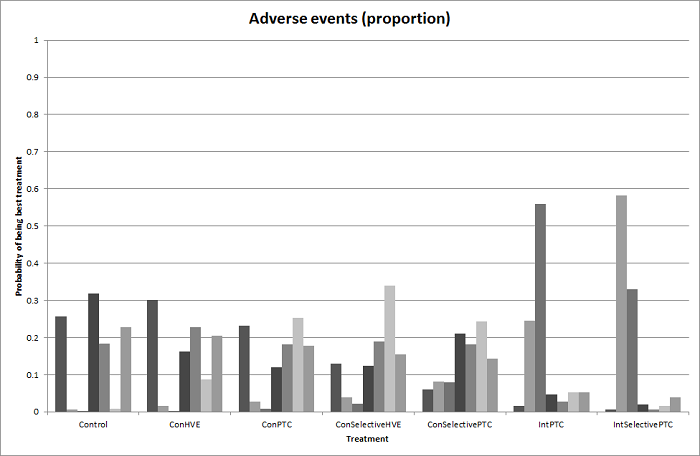
Probability of best treatment: probability of being best, second best, third best, etc. for each treatment for adverse events (proportion) (vascular occlusion methods). A probability of more than 90% is a reliable indicator that a treatment is best with regards to the specific outcome. A probability of less than 90% is less reliable. None of the treatments have a 90% probability of being best treatment.
Con: continuous; Int: intermittent; HVE: hepatic vascular exclusion; PTC: portal triad clamping.

Methods of vascular occlusion: adverse events (proportion)
Forest plot of the comparisons in which direct and indirect estimates were available. There does not appear to be any discrepancies between direct and indirect estimates. Direct evidence appears to be preferable over indirect evidence and network meta‐analysis based on the quality of evidence.
1Risk of bias was unclear or high in the trial(s) (downgraded by 1 point).
2Sample size was low (downgraded by 1 point).
3Confidence intervals spanned no effect and clinically significant effect (downgraded by 1 point).

Probability of best treatment: probability of being best, second best, third best, etc. for each treatment for blood transfusion (proportion) (vascular occlusion methods). A probability of more than 90% is a reliable indicator that a treatment is best with regards to the specific outcome. A probability of less than 90% is less reliable. None of the treatments have a 90% probability of being best treatment.
Con: continuous; Int: intermittent; HVE: hepatic vascular exclusion; PTC: portal triad clamping.

Methods of vascular occlusion: blood transfusion (proportion)
Forest plot of the comparisons in which direct and indirect estimates were available. Although the confidence intervals overlap, there appear to be some discrepancies between direct and indirect estimates for continuous portal triad clamping versus control, intermittent portal triad clamping versus control, and intermittent portal triad clamping versus continuous portal triad clamping. Direct evidence appears to be preferable over indirect evidence and network meta‐analysis based on the quality of evidence.
1Risk of bias was unclear or high in the trial(s) (downgraded by 1 point).
2Sample size was low (downgraded by 1 point).
3Confidence intervals spanned no effect and clinically significant effect (downgraded by 1 point).
4There was substantial or considerable heterogeneity (downgraded by 2 points).

Probability of best treatment: probability of being best, second best, third best, etc. for each treatment for blood transfusion (red blood cells) (vascular occlusion methods). A probability of more than 90% is a reliable indicator that a treatment is best with regards to the specific outcome. A probability of less than 90% is less reliable. Intermittent selective portal triad clamping has about 90% probability of being best treatment. However, other random and systematic errors make this finding unreliable.
Con: continuous; Int: intermittent; HVE: hepatic vascular exclusion; PTC: portal triad clamping.

Methods of vascular occlusion:blood transfusion (red blood cells)
Forest plot of the comparisons in which direct and indirect estimates were available. There do not appear to be any discrepancies between direct and indirect estimates, although the credible intervals are different (the direct evidence had narrower credible intervals in four of the five comparisons above) resulting in the differences in the comparisons in which there was evidence for difference. Direct evidence appears to be preferable over indirect evidence and network meta‐analysis based on the quality of evidence for the comparison 'continuous selective portal triad clamping versus continuous portal triad clamping'. Indirect evidence and network meta‐analysis appear to be preferable over direct evidence for the comparison 'continuous portal triad clamping versus control'. Direct evidence and network meta‐analysis appear to be preferable over indirect evidence for the comparison 'intermittent portal triad clamping versus control'. There was little apparent difference in the quality of evidence between direct, indirect estimates, and network meta‐analysis; so, we could not choose one estimate over the others based on the quality of evidence.
1Risk of bias was unclear or high in the trial(s) (downgraded by 1 point).
2Sample size was low (downgraded by 1 point).
3Confidence intervals spanned no effect and clinically significant effect (downgraded by 1 point).

Probability of best treatment: probability of being best, second best, third best, etc. for each treatment for blood loss (vascular occlusion methods). A probability of more than 90% is a reliable indicator that a treatment is best with regards to the specific outcome. A probability of less than 90% is less reliable. None of the treatments have a 90% probability of being best treatment.
Con: continuous; Int: intermittent; HVE: hepatic vascular exclusion; PTC: portal triad clamping.

Methods of vascular occlusion:blood loss
Forest plot of the comparisons in which direct and indirect estimates were available. There does not appear to be any discrepancies between direct and indirect estimates, although the credible intervals are different (the direct evidence had narrower credible intervals in three of the five comparisons above). Direct evidence appears to be preferable over indirect evidence and network meta‐analysis based on the quality of evidence.
1Risk of bias was unclear or high in the trial(s) (downgraded by 1 point).
2 Sample size was low (downgraded by 1 point).
3Confidence intervals spanned no effect and clinically significant effect (downgraded by 1 point).Ç
4There was substantial or considerable heterogeneity (downgraded by 2 points).

Funnel plot of blood transfusion (proportion): The funnel plot shows funnel plot asymmetry (i.e. some trials with large variance with large effects favouring one treatment were not matched by other trials with similarly large variance with large effects favouring the other treatment). This may be evidence of reporting bias or could be because of heterogeneity between the studies.

Funnel plot of blood transfusion (red blood cells): The funnel plot shows funnel plot asymmetry (i.e. some trials with large variance with large effects favouring one treatment were not matched by other trials with similarly large variance with large effects favouring the other treatment). This may be evidence of reporting bias or could be because of heterogeneity between the studies.

Funnel plot of blood loss: The funnel plot shows funnel plot asymmetry (i.e. some trials with large variance with large effects favouring one treatment were not matched by other trials with similarly large variance with large effects favouring the other treatment). This may be evidence of reporting bias or could be because of heterogeneity between the studies.

Comparison 1 Anterior approach vs conventional approach, Outcome 1 Mortality (perioperative).

Comparison 1 Anterior approach vs conventional approach, Outcome 2 Serious adverse events (proportion).

Comparison 1 Anterior approach vs conventional approach, Outcome 3 Adverse events (proportion).
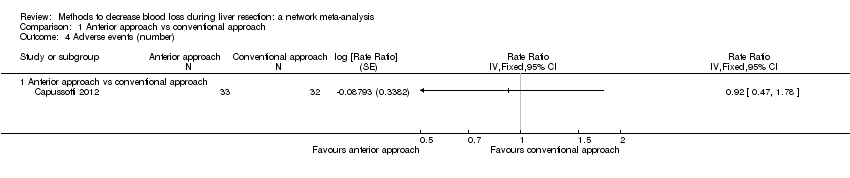
Comparison 1 Anterior approach vs conventional approach, Outcome 4 Adverse events (number).
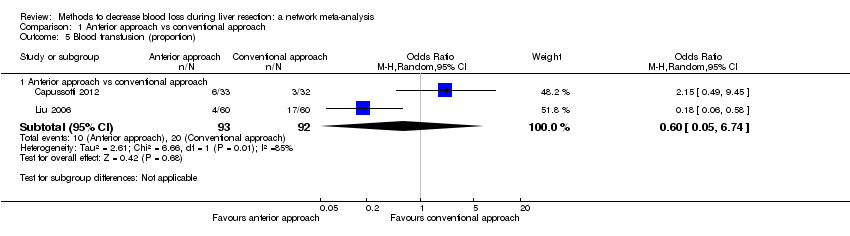
Comparison 1 Anterior approach vs conventional approach, Outcome 5 Blood transfusion (proportion).
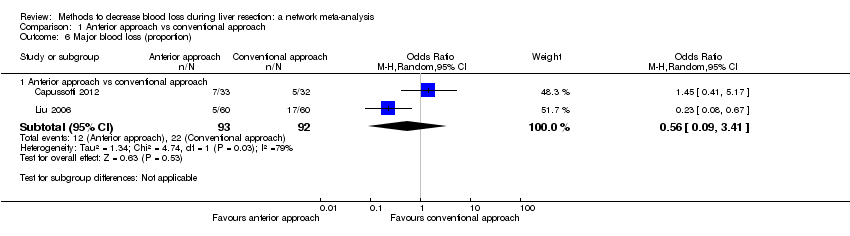
Comparison 1 Anterior approach vs conventional approach, Outcome 6 Major blood loss (proportion).

Comparison 2 Autologous blood donation vs control, Outcome 1 Adverse events (proportion).

Comparison 2 Autologous blood donation vs control, Outcome 2 Blood transfusion (proportion).
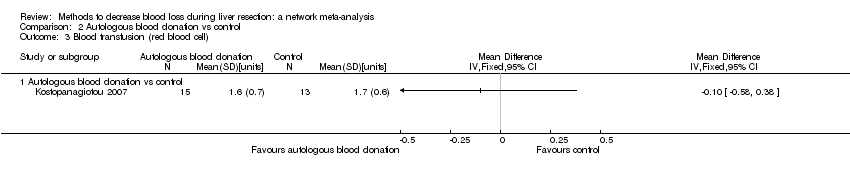
Comparison 2 Autologous blood donation vs control, Outcome 3 Blood transfusion (red blood cell).

Comparison 2 Autologous blood donation vs control, Outcome 4 Blood loss.

Comparison 2 Autologous blood donation vs control, Outcome 5 Major blood loss (proportion).

Comparison 2 Autologous blood donation vs control, Outcome 6 Total hospital stay.

Comparison 2 Autologous blood donation vs control, Outcome 7 Operating time.

Comparison 3 Cardiopulmonary interventions, Outcome 1 Mortality (perioperative).

Comparison 3 Cardiopulmonary interventions, Outcome 2 Serious adverse events (proportion).

Comparison 3 Cardiopulmonary interventions, Outcome 3 Serious adverse events (number).
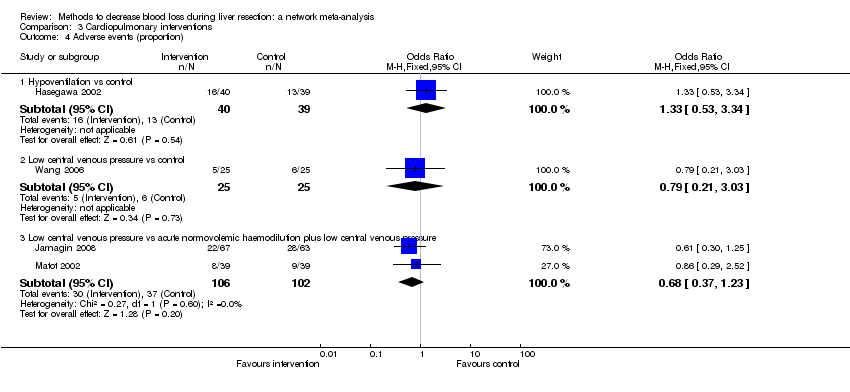
Comparison 3 Cardiopulmonary interventions, Outcome 4 Adverse events (proportion).

Comparison 3 Cardiopulmonary interventions, Outcome 5 Adverse events (number).

Comparison 3 Cardiopulmonary interventions, Outcome 6 Blood transfusion (proportion).

Comparison 3 Cardiopulmonary interventions, Outcome 7 Blood transfusion (red blood cell).
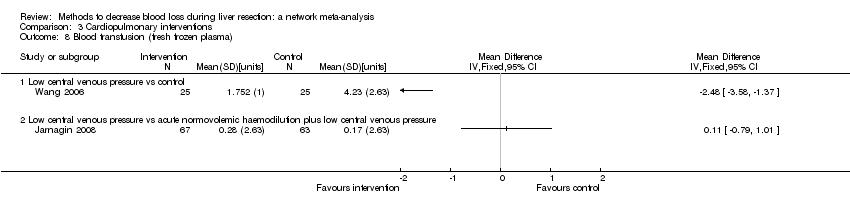
Comparison 3 Cardiopulmonary interventions, Outcome 8 Blood transfusion (fresh frozen plasma).
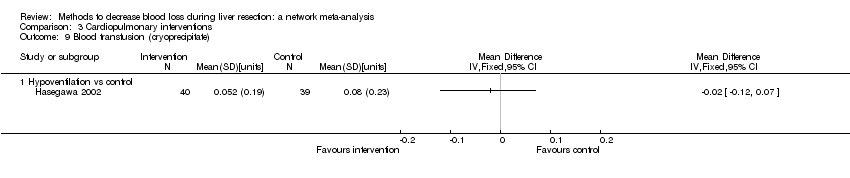
Comparison 3 Cardiopulmonary interventions, Outcome 9 Blood transfusion (cryoprecipitate).
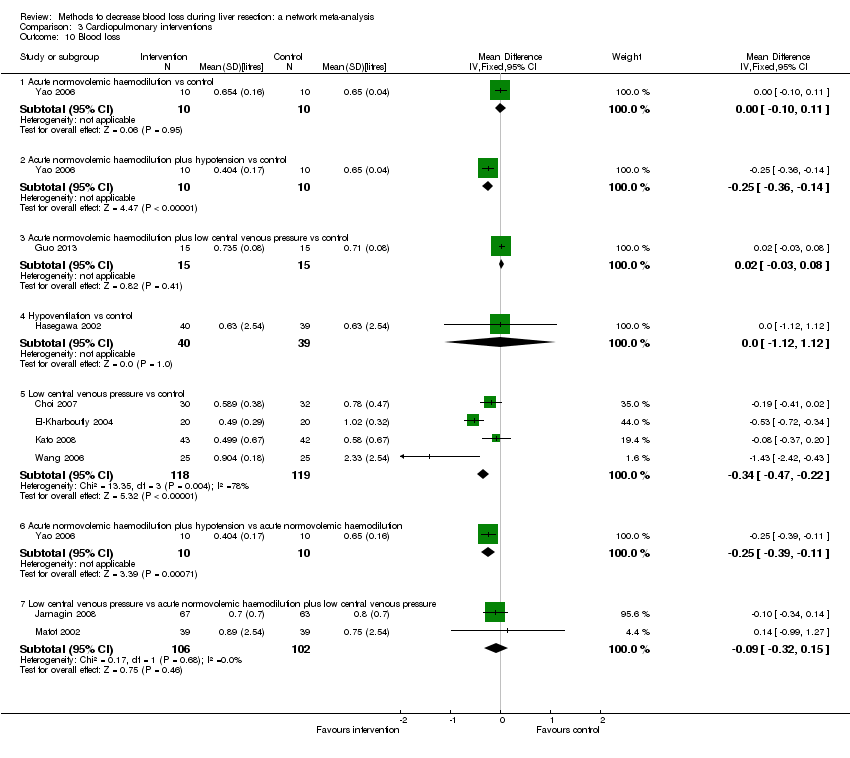
Comparison 3 Cardiopulmonary interventions, Outcome 10 Blood loss.
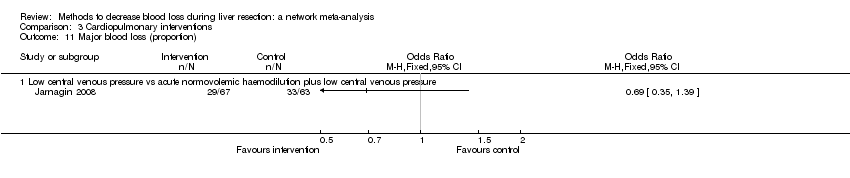
Comparison 3 Cardiopulmonary interventions, Outcome 11 Major blood loss (proportion).

Comparison 3 Cardiopulmonary interventions, Outcome 12 Hospital stay.
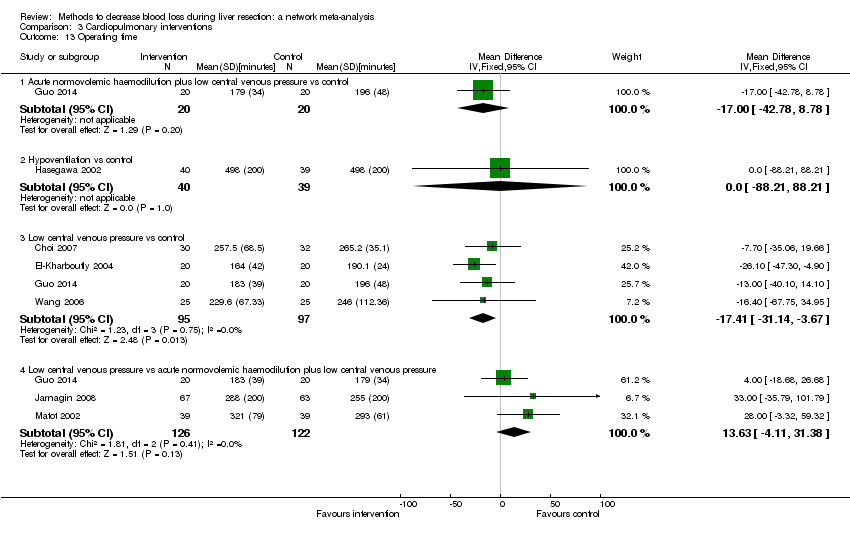
Comparison 3 Cardiopulmonary interventions, Outcome 13 Operating time.

Comparison 4 Methods of parenchymal transection, Outcome 1 Mortality (perioperative).
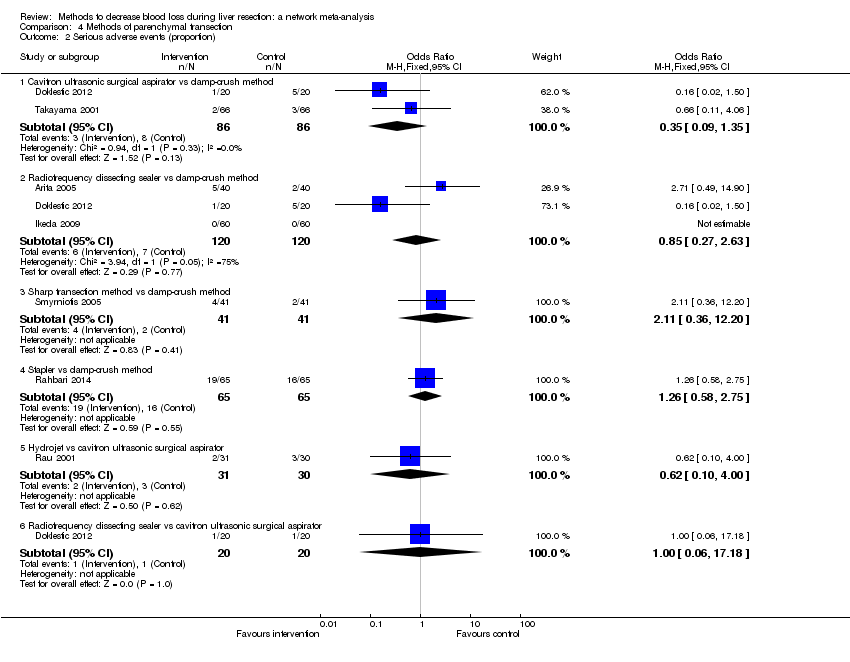
Comparison 4 Methods of parenchymal transection, Outcome 2 Serious adverse events (proportion).

Comparison 4 Methods of parenchymal transection, Outcome 3 Serious adverse events (number).

Comparison 4 Methods of parenchymal transection, Outcome 4 Adverse events (proportion).

Comparison 4 Methods of parenchymal transection, Outcome 5 Adverse events (number).

Comparison 4 Methods of parenchymal transection, Outcome 6 Blood transfusion (proportion).

Comparison 4 Methods of parenchymal transection, Outcome 7 Blood transfusion (red blood cell).

Comparison 4 Methods of parenchymal transection, Outcome 8 Blood transfusion (fresh frozen plasma).
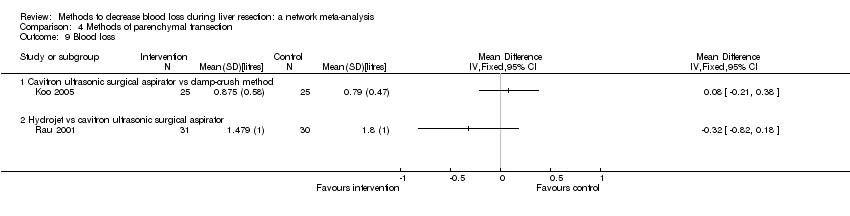
Comparison 4 Methods of parenchymal transection, Outcome 9 Blood loss.

Comparison 4 Methods of parenchymal transection, Outcome 10 Operating time.
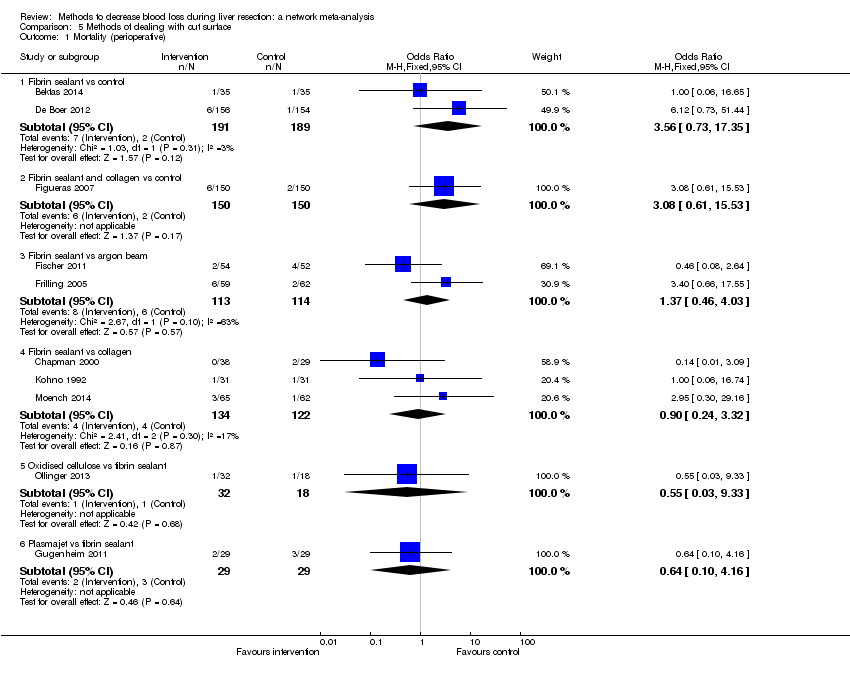
Comparison 5 Methods of dealing with cut surface, Outcome 1 Mortality (perioperative).

Comparison 5 Methods of dealing with cut surface, Outcome 2 Serious adverse events (proportion).

Comparison 5 Methods of dealing with cut surface, Outcome 3 Serious adverse events (number).

Comparison 5 Methods of dealing with cut surface, Outcome 4 Adverse events (proportion).

Comparison 5 Methods of dealing with cut surface, Outcome 5 Adverse events (number).
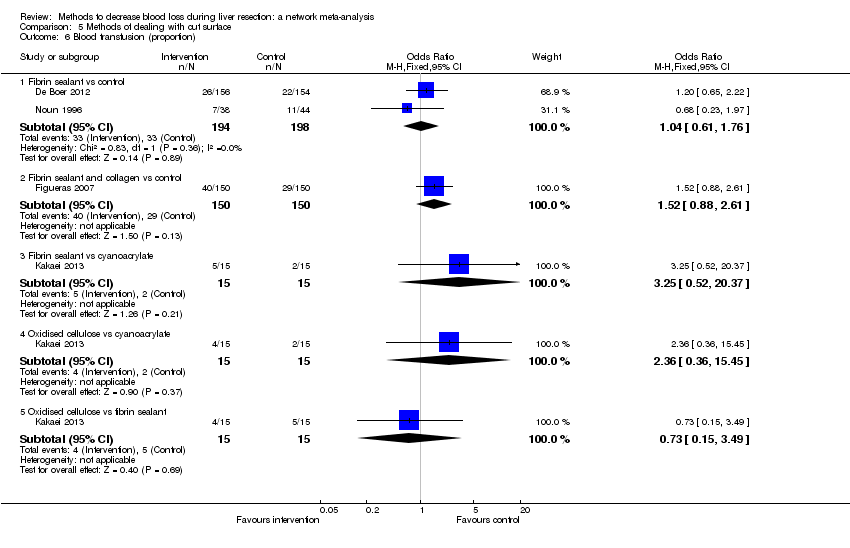
Comparison 5 Methods of dealing with cut surface, Outcome 6 Blood transfusion (proportion).
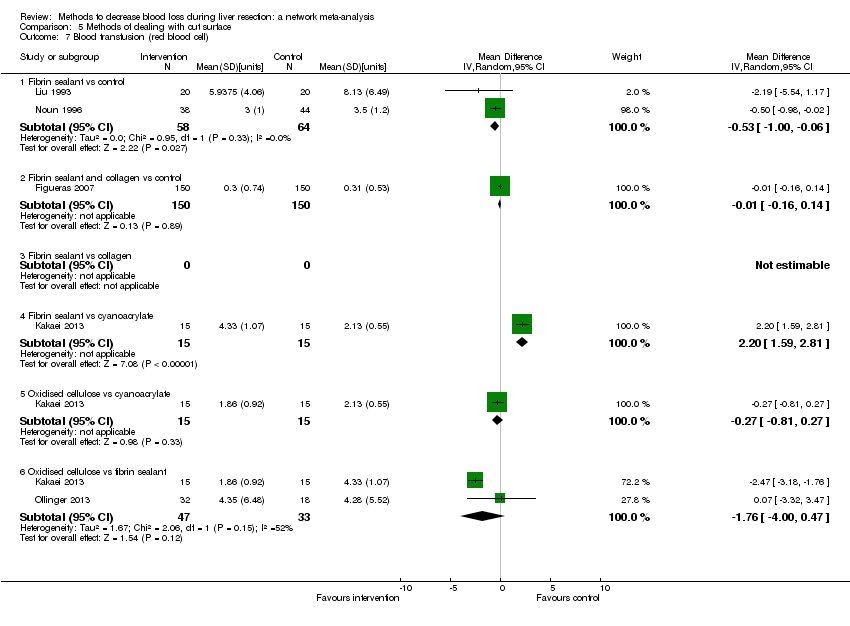
Comparison 5 Methods of dealing with cut surface, Outcome 7 Blood transfusion (red blood cell).

Comparison 5 Methods of dealing with cut surface, Outcome 8 Blood transfusion (fresh frozen plasma).

Comparison 5 Methods of dealing with cut surface, Outcome 9 Blood loss.

Comparison 5 Methods of dealing with cut surface, Outcome 10 Total hospital stay.
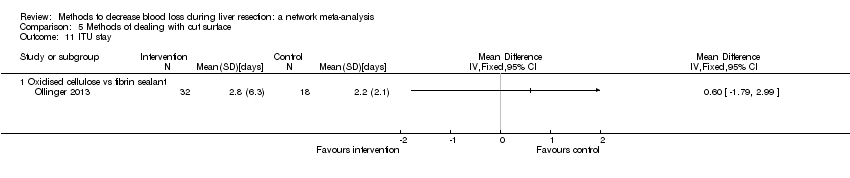
Comparison 5 Methods of dealing with cut surface, Outcome 11 ITU stay.

Comparison 5 Methods of dealing with cut surface, Outcome 12 Operating time.

Comparison 6 Methods of vascular occlusion, Outcome 1 Mortality (perioperative).

Comparison 6 Methods of vascular occlusion, Outcome 2 Serious adverse events (proportion).
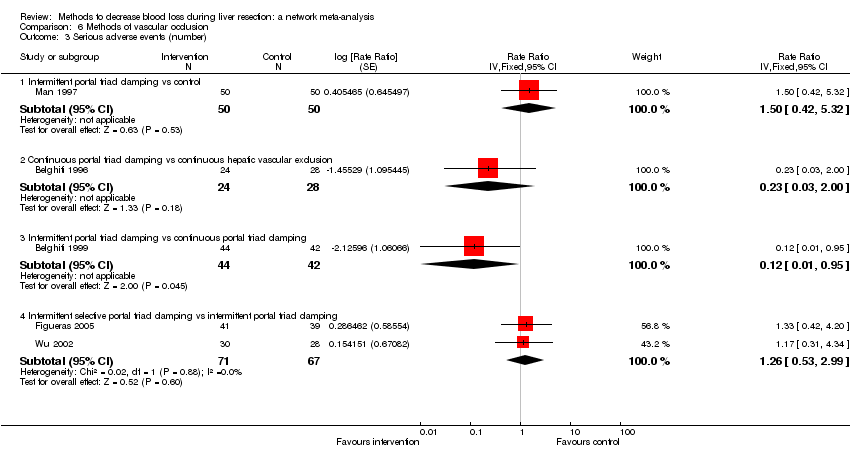
Comparison 6 Methods of vascular occlusion, Outcome 3 Serious adverse events (number).
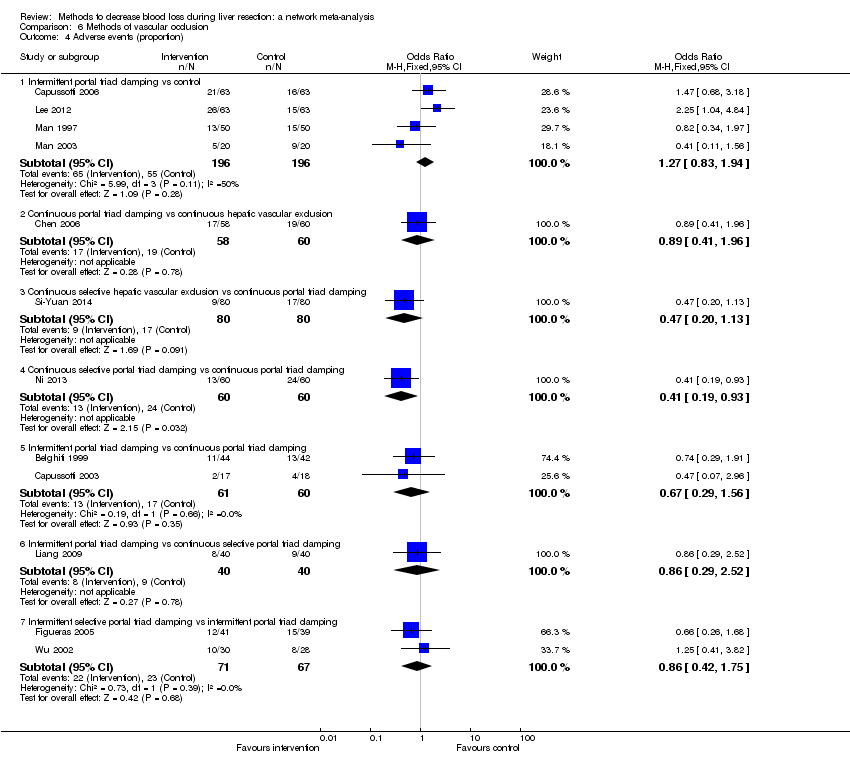
Comparison 6 Methods of vascular occlusion, Outcome 4 Adverse events (proportion).

Comparison 6 Methods of vascular occlusion, Outcome 5 Adverse events (number).

Comparison 6 Methods of vascular occlusion, Outcome 6 Blood transfusion (proportion).
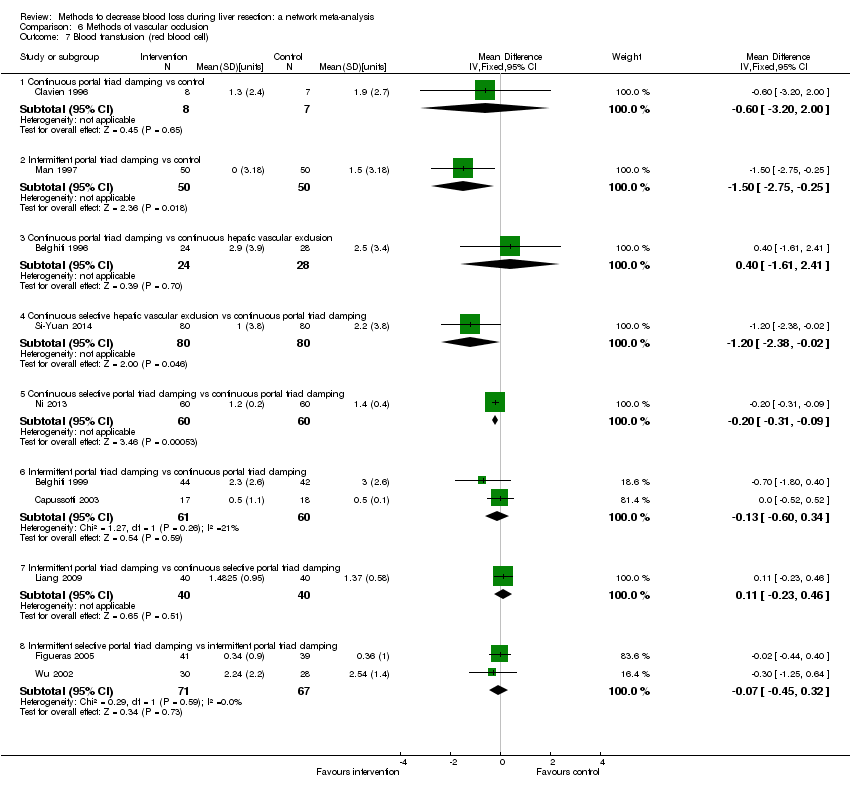
Comparison 6 Methods of vascular occlusion, Outcome 7 Blood transfusion (red blood cell).
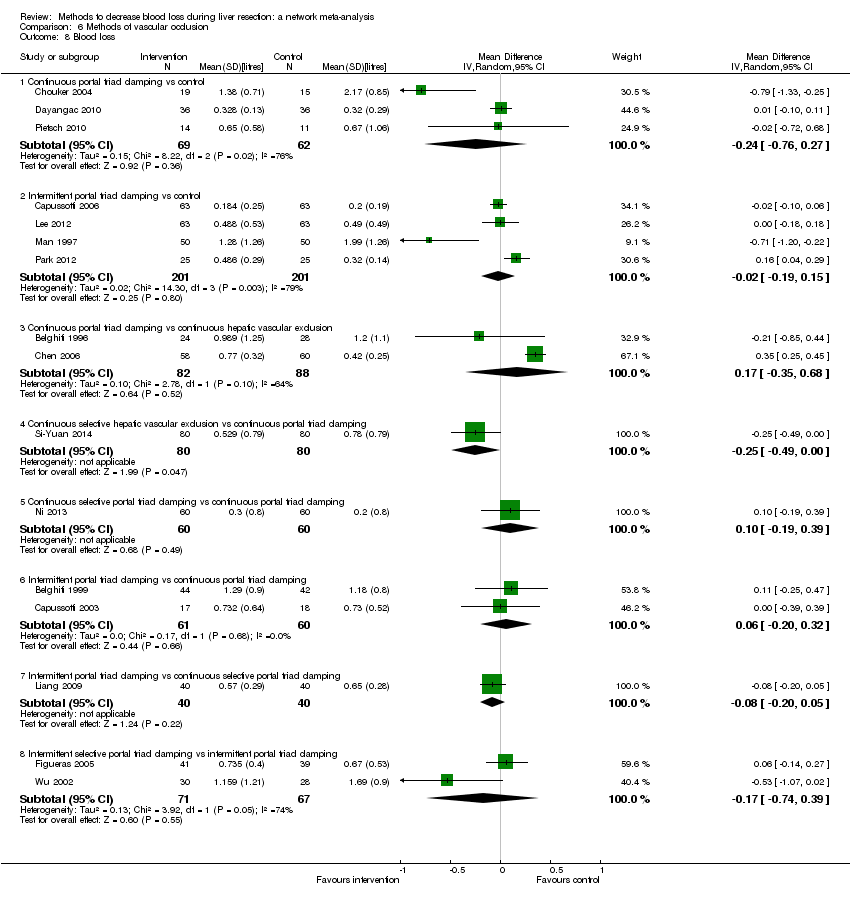
Comparison 6 Methods of vascular occlusion, Outcome 8 Blood loss.

Comparison 6 Methods of vascular occlusion, Outcome 9 Major blood loss (proportion).

Comparison 6 Methods of vascular occlusion, Outcome 10 Total hospital stay.

Comparison 6 Methods of vascular occlusion, Outcome 11 ITU stay.

Comparison 6 Methods of vascular occlusion, Outcome 12 Operating time.

Comparison 7 Pharmacological interventions, Outcome 1 Mortality (perioperative).

Comparison 7 Pharmacological interventions, Outcome 2 Serious adverse events (proportion).
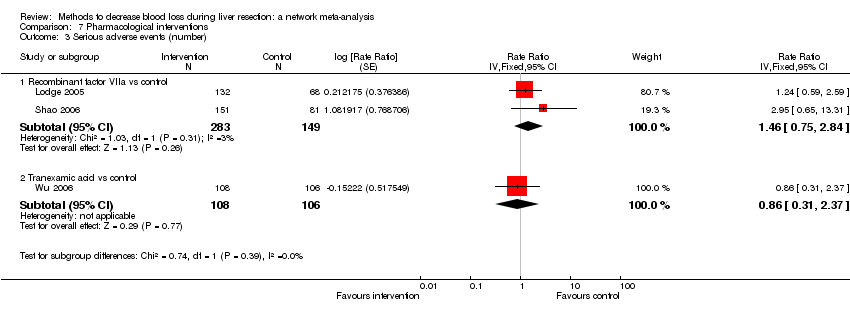
Comparison 7 Pharmacological interventions, Outcome 3 Serious adverse events (number).

Comparison 7 Pharmacological interventions, Outcome 4 Adverse events (proportion).
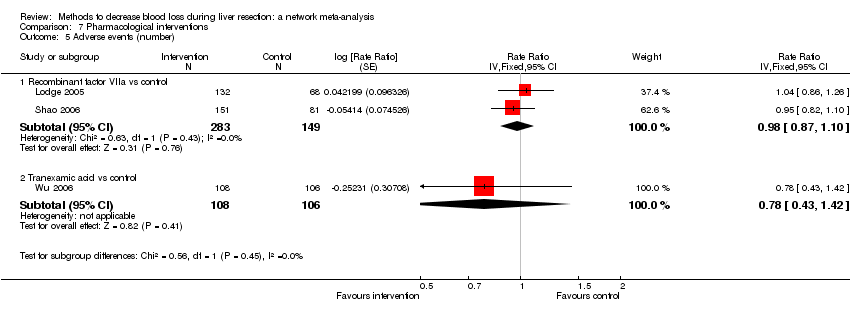
Comparison 7 Pharmacological interventions, Outcome 5 Adverse events (number).
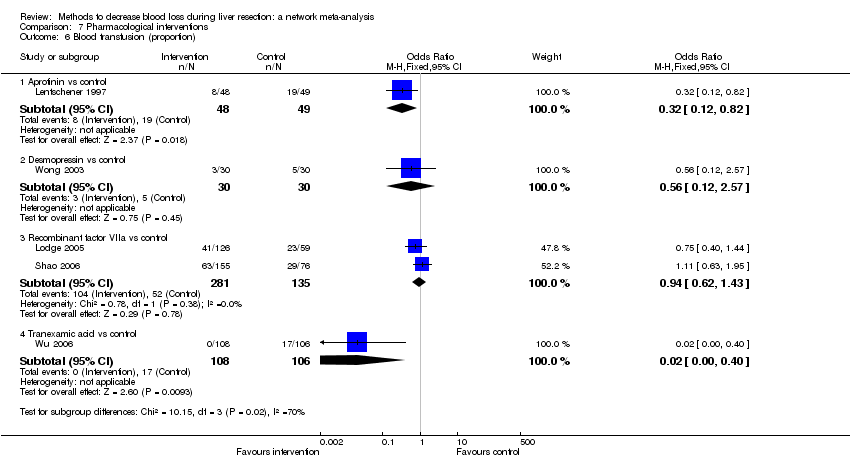
Comparison 7 Pharmacological interventions, Outcome 6 Blood transfusion (proportion).

Comparison 7 Pharmacological interventions, Outcome 7 Blood transfusion (fresh frozen plasma).

Comparison 7 Pharmacological interventions, Outcome 8 Blood loss.

Comparison 7 Pharmacological interventions, Outcome 9 Hospital stay.

Comparison 7 Pharmacological interventions, Outcome 10 Operating time.
| Methods to decrease blood loss during liver resection: a network meta‐analysis. Primary outcomes | |||||||
| Patient or population: people undergoing liver resection Settings: secondary or tertiary setting Intervention and control: various treatments Follow‐up: until discharge or 1 month (except for mortality (long‐term follow‐up) which was reported at 1 year | |||||||
| Outcomes | Anterior approach versus conventional approach | Autologous blood donation versus control | Cardiopulmonary interventions | Methods of parenchymal transection | Methods of dealing with cut surface | Methods of vascular occlusion | Pharmacological interventions |
| Treatments The first treatment listed is the control. The remaining are interventions. |
|
|
|
|
|
|
|
| Link for detailed 'Summary of Findings tables' | |||||||
| Mortality (perioperative) | There was no evidence of differences in perioperative mortality between the 2 groups. Quality of evidence = very low1,2,3. | There was no evidence of differences in perioperative mortality between the two groups. Quality of evidence = very low1,2,3. | There was no evidence of differences in perioperative mortality for any of the comparisons. Quality of evidence = very low1,2,3. | There was no evidence of differences in perioperative mortality for any of the comparisons. Quality of evidence = very low1,2,3. | There was no evidence of differences in perioperative mortality for any of the comparisons Quality of evidence = very low1,2,3. | There was no evidence of differences in perioperative mortality for any of the comparisons. Quality of evidence = very low1,2,3. | There was no evidence of differences in perioperative mortality for any of the comparisons. Quality of evidence = very low1,2,3. |
| Mortality (longest follow‐up) | None of the trials reported this outcome. | There was no evidence of differences in mortality at 1 year between the 2 groups. Quality of evidence = very low)1,2,3. | None of the trials reported this outcome. | None of the trials reported this outcome. | None of the trials reported this outcome. | None of the trials reported this outcome. | None of the trials reported this outcome. |
| Serious adverse events (proportion) | There was no evidence of differences in the proportion of participants experiencing serious adverse events between the 2 groups. Quality of evidence = very low1,2,3. | None of the trials reported this outcome. | There was no evidence of differences in the proportion of participants experiencing serious adverse events (for any of the comparisons Quality of evidence = very low1,2,3. | There was no evidence of differences in the proportion of participants experiencing serious adverse events for any of the comparisons Quality of evidence = very low1,2,3. | There was no evidence of differences in the proportion of participants experiencing serious adverse events for any of the comparisons Quality of evidence = very low1,2,3. | The proportion of participants experiencing serious adverse eventsa was lower in continuous selective portal triad clamping than continuous portal triad clamping
There was no evidence of differences in other comparisons. Quality of evidence = very low1,2,3 | There was no evidence of differences in the proportion of participants experiencing serious adverse events for any of the comparisons Quality of evidence = very low1,2,3. |
| Serious adverse events (number) | None of the trials reported this outcome. | None of the trials reported this outcome. | There was no evidence of differences in the number of serious adverse events for any of the comparisons Quality of evidence = very low1,2,3. | The number of serious adverse events was higher in radiofrequency dissecting sealer than clamp‐crush method.
There was no evidence of differences in other comparisons. Quality of evidence = very low1,2,3. | The number of serious adverse events was higher in fibrin sealant than argon beam.
There was no evidence of differences in other comparisons. Quality of evidence = very low1,2,3. | The number of serious adverse events was lower in intermittent portal triad clamping than continuous portal triad clamping.
There was no evidence of differences in other comparisons Quality of evidence = very low1,2,3. | There was no evidence of differences in the number of serious adverse events for any of the comparisons Quality of evidence = very low1,2,3. |
| Health‐related quality of life | None of the trials reported this outcome. | None of the trials reported this outcome. | None of the trials reported this outcome at any time point. | None of the trials reported this outcome at any time point. | None of the trials reported this outcome at any time point. | None of the trials reported this outcome at any time point. | None of the trials reported this outcome at any time point. |
| CrI: credible intervals; OR: odds ratio. | |||||||
| GRADE Working Group grades of evidence | |||||||
| 1 Risk of bias was unclear or high in the trial(s) (downgraded by 1 point). | |||||||
| Outcomes | Illustrative comparative risks* (95% CrI) | Relative effect (95% CrI) | No of participants | Quality of the evidence | |
| Assumed risk | Corresponding risk | ||||
| Control | Intervention | ||||
| Mortality (perioperative) | 76 per 1000 | 19 per 1000 | OR 0.23 | 185 | ⊕⊝⊝⊝ |
| Mortality (longest follow‐up) | None of the trials reported this outcome. | ||||
| Serious adverse events (proportion) | 125 per 1000 | 154 per 1000 | OR 1.27 | 65 | ⊕⊝⊝⊝ |
| Serious adverse events (number) | None of the trials reported this outcome. | ||||
| Health‐related quality of life (30 days, 3 months) | None of the trials reported this outcome. | ||||
| Health‐related quality of life (maximal follow‐up) | None of the trials reported this outcome. | ||||
| *The basis for the assumed risk is the mean control group proportion. The corresponding risk (and its 95% credible interval) is based on the assumed risk in the comparison group and the relative effect of the intervention (and its 95% CrI). Network meta‐analysis was not performed for any of the outcomes since there were only two treatments. CrI: credible intervals; OR: odds ratio. | |||||
| GRADE Working Group grades of evidence | |||||
| 1 Risk of bias was unclear or high in the trial(s) (downgraded by 1 point). | |||||
| Outcomes | Illustrative comparative risks* (95% CrI) | Relative effect (95% CrI) | No of participants | Quality of the evidence | |
| Assumed risk | Corresponding risk | ||||
| Control | Intervention | ||||
| Mortality (perioperative) | There was no mortality in either group. | 28 (1 study) | ⊕⊝⊝⊝ Very low1,2,3 | ||
| Mortality (longest follow‐up): reported at 1 year | There was no mortality in either group. | 28 (1 study) | ⊕⊝⊝⊝ Very low1,2,3 | ||
| Serious adverse events (proportion) | None of the trials reported this outcome. | ||||
| Serious adverse events (number) | None of the trials reported this outcome. | ||||
| Health‐related quality of life (30 days, 3 months) | None of the trials reported this outcome. | ||||
| Health‐related quality of life (longest follow‐up) | None of the trials reported this outcome. | ||||
| *The basis for the assumed risk is the mean control group proportion. The corresponding risk (and its 95% credible interval) is based on the assumed risk in the comparison group and the relative effect of the intervention (and its 95% CrI). Network meta‐analysis was not performed for any of the outcomes since there were only two treatments. CrI: credible intervals; OR: odds ratio | |||||
| GRADE Working Group grades of evidence | |||||
| 1 Risk of bias was unclear or high in the trial(s) (downgraded by 1 point). | |||||
| Outcomes | Illustrative comparative risks* (95% CrI) | Relative effect (95% CrI) | No of participants | Quality of the evidence | |
| Assumed risk | Corresponding risk | ||||
| Control | Intervention | ||||
| Mortality (perioperative) | |||||
| Hypoventilation vs control | There was no mortality in either group. | 79 (1 study) | ⊕⊝⊝⊝ Very low1,2,3 | ||
| Low central venous pressure vs control | There was no mortality in either group. | 85 (1 study) | ⊕⊝⊝⊝ Very low1,2,3 | ||
| Mortality (longest follow‐up) | None of the trials reported this outcome. | ||||
| Serious adverse events (proportion) | |||||
| Hypoventilation vs control | 26 per 1000 | 60 per 1000 (5 to 679) | OR 2.41 (0.18 to 80.4) | 79 (1 study) | ⊕⊝⊝⊝ Very low1,2,3 |
| Low central venous pressure vs acute normovolemic haemodilution plus low CVP | 302 per 1000 | 284 per 1000 (157 to 460) | OR 0.92 (0.43 to 1.97) | 63 (1 study) | ⊕⊝⊝⊝ Very low1,2,3 |
| Serious adverse events (number) | |||||
| Low central venous pressure vs control | 100 per 1000 | 0 per 1000 (0 to 2) | Rate ratio 0.00 (0 to 0.02) | 42 (1 study) | ⊕⊝⊝⊝ Very lowa,b,c |
| Low central venous pressure vs acute normovolemic haemodilution plus low central venous pressure | 103 per 1000 | 77 per 1000 (15 to 287) | Rate ratio 0.73 (0.13 to 3.53) | 78 (1 study) | ⊕⊝⊝⊝ Very lowa,b,c |
| Health‐related quality of life (30 days, 3 months) | None of the trials reported this outcome. | ||||
| Health‐related quality of life (longest follow‐up) | None of the trials reported this outcome. | ||||
| *The basis for the assumed risk is the mean control group proportion. The corresponding risk (and its 95% credible interval) is based on the assumed risk in the comparison group and the relative effect of the intervention (and its 95% CrI). Network meta‐analysis was not performed for any of the outcomes because of the lack of availability of direct and indirect comparisons in the network. CrI: credible intervals; OR: odds ratio. | |||||
| GRADE Working Group grades of evidence | |||||
| 1aRisk of bias was unclear or high in the trial(s) (downgraded by 1 point). | |||||
| Outcomes | Illustrative comparative risks* (95% CrI) | Relative effect (95% CrI) | No of participants | Quality of the evidence | |
| Assumed risk | Corresponding risk | ||||
| Control | Intervention | ||||
| Mortality (perioperative) | |||||
| CUSA vs clamp‐crush method | 23 per 1000 | 6 per 1000 (0 to 54) | OR 0.24 (0.01 to 2.41) | 172 (2 studies) | ⊕⊝⊝⊝ Very low1,2,3 |
| Radiofrequency dissecting sealer vs clamp‐crush method | 10 per 1000 | 16 per 1000 (4 to 65) | OR 1.60 (0.43 to 6.7) | 390 (5 studies) | ⊕⊝⊝⊝ Very low1,2,3 |
| Sharp transection method vs clamp‐crush method | There was no mortality in either group. | 82 (1 study) | ⊕⊝⊝⊝ Very low1,2,3 | ||
| Stapler vs clamp‐crush method | 31 per 1000 | 67 per 1000 (12 to 375) | OR 2.26 (0.39 to 18.93) | 130 (1 study) | ⊕⊝⊝⊝ Very low1,2,3 |
| Hydrojet vs CUSA | 55 per 1000 | 54 per 1000 (9 to 258) | OR 0.98 (0.16 to 6.04) | 111 (2 studies) | ⊕⊝⊝⊝ Very low1,2,3 |
| Radiofrequency dissecting sealer vs CUSA | 44 per 1000 | 28 per 1000 (3 to 166) | OR 0.61 (0.07 to 4.28) | 90 (2 studies) | ⊕⊝⊝⊝ Very low1,2,3 |
| Stapler vs CUSA | There was no mortality in either group. | 79 (1 study) | ⊕⊝⊝⊝ Very low1,2,3 | ||
| Radiofrequency dissecting sealer vs hydrojet | 80 per 1000 | 9 per 1000 (0 to 145) | OR 0.10 (0 to 1.95) | 50 (1 study) | ⊕⊝⊝⊝ Very low1,2,3 |
| Mortality (longest follow‐up) | None of the trials reported this outcome. | ||||
| Serious adverse events (proportion) | |||||
| CUSA vs clamp‐crush method | 93 per 1000 | 31 per 1000 (6 to 110) | OR 0.31 (0.06 to 1.2) | 172 (2 studies) | ⊕⊝⊝⊝ Very low1,2,3 |
| Radiofrequency dissecting sealer vs clamp‐crush method | 58 per 1000 | 49 per 1000 (15 to 145) | OR 0.83 (0.24 to 2.74) | 240 (3 studies) | ⊕⊝⊝⊝ Very low1,2,3 |
| Sharp transection method vs clamp‐crush method | 49 per 1000 | 106 per 1000 (20 to 502) | OR 2.31 (0.39 to 19.69) | 82 (1 study) | ⊕⊝⊝⊝ Very low1,2,3 |
| Hydrojet vs CUSA | 100 per 1000 | 124 per 1000 (61 to 238) | OR 1.27 (0.58 to 2.81) | 61 (1 study) | ⊕⊝⊝⊝ Very low1,2,3 |
| Radiofrequency dissecting sealer vs CUSA | 50 per 1000 | 30 per 1000 (3 to 180) | OR 0.58 (0.06 to 4.16) | 40 (1 study) | ⊕⊝⊝⊝ Very low1,2,3 |
| Stapler vs CUSA | 246 per 1000 | 246 per 1000 (6 to 931) | OR 1.00 (0.02 to 41.22) | 130 (1 study) | ⊕⊝⊝⊝ Very low1,2,3 |
| Serious adverse events (number) | |||||
| CUSA vs clamp‐crush method | 45 per 1000 | 29 per 1000 (3 to 166) | Rate ratio 0.63 (0.07 to 4.17) | 132 (1 study) | ⊕⊝⊝⊝ Very low1,2,3 |
| Radiofrequency dissecting sealer vs clamp‐crush method | 61 per 1000 | 190 per 1000 (75 to 474) | Rate ratio 3.64 (1.25 to 13.97) | 130 (2 studies) | ⊕⊕⊝⊝ Low1,2 |
| Hydrojet vs CUSA | 80 per 1000 | 121 per 1000 (20 to 546) | Rate ratio 1.59 (0.24 to 13.83) | 50 (1 study) | ⊕⊝⊝⊝ Very low1,2,3 |
| Radiofrequency dissecting sealer vs CUSA | 80 per 1000 | 121 per 1000 (20 to 546) | Rate ratio 1.59 (0.24 to 13.83) | 50 (1 study) | ⊕⊝⊝⊝ Very low1,2,3 |
| Stapler vs CUSA | 180 per 1000 | 230 per 1000 (109 to 424) | Rate ratio 1.36 (0.56 to 3.36) | 100 (1 study) | ⊕⊝⊝⊝ Very low1,2,3 |
| Radiofrequency dissecting sealer vs hydrojet | 120 per 1000 | 120 per 1000 (23 to 445) | Rate ratio 1.00 (0.17 to 5.88) | 50 (1 study) | ⊕⊝⊝⊝ Very low1,2,3 |
| Health‐related quality of life (30 days, 3 months) | None of the trials reported this outcome. | ||||
| Health‐related quality of life (maximal follow‐up) | None of the trials reported this outcome. | ||||
| *The basis for the assumed risk is the mean control group proportion. The corresponding risk (and its 95% credible interval) is based on the assumed risk in the comparison group and the relative effect of the intervention (and its 95% CrI). Network meta‐analysis was not performed for any of the outcomes because of the lack of availability of direct and indirect comparisons in the network. CrI: credible intervals; CUSA: cavitron ultrasonic surgical aspirator; OR: odds ratio | |||||
| GRADE Working Group grades of evidence | |||||
| 1 Risk of bias was unclear or high in the trial(s) (downgraded by 1 point). | |||||
| Outcomes | Illustrative comparative risks* (95% CrI) | Relative effect (95% CrI) | No of participants | Quality of the evidence | |
| Assumed risk | Corresponding risk | ||||
| Control | Intervention | ||||
| Mortality (perioperative) | |||||
| Fibrin sealant vs control | 11 per 1000 | 41 per 1000 (10 to 253) | OR 4.03 (0.9 to 31.72) | 380 (2 studies) | ⊕⊝⊝⊝ Very low1,2,3 |
| Fibrin sealant and collagen vs control | 13 per 1000 | 45 per 1000 (10 to 268) | OR 3.48 (0.74 to 27.03) | 300 (1 study) | ⊕⊝⊝⊝ Very low1,2,3 |
| Fibrin sealant vs argon beam | 53 per 1000 | 72 per 1000 (25 to 198) | OR 1.39 (0.46 to 4.45) | 227 (2 studies) | ⊕⊝⊝⊝ Very low1,2,3 |
| Fibrin sealant vs collagen | 33 per 1000 | 30 per 1000 (7 to 123) | OR 0.91 (0.2 to 4.14) | 256 (3 studies) | ⊕⊝⊝⊝ Very low1,2,3 |
| Oxidised cellulose vs fibrin sealant | 56 per 1000 | 31 per 1000 (1 to 565) | OR 0.54 (0.01 to 22.09) | 50 (1 study) | ⊕⊝⊝⊝ Very low1,2,3 |
| Plasmajet vs fibrin sealant | 103 per 1000 | 65 per 1000 (7 to 332) | OR 0.60 (0.06 to 4.31) | 58 (1 study) | ⊕⊝⊝⊝ Very low1,2,3 |
| Mortality (longest follow‐up) | None of the trials reported this outcome. | ||||
| Serious adverse events (proportion) | |||||
| Fibrin sealant vs control | 186 per 1000 | 191 per 1000 (128 to 275) | OR 1.03 (0.64 to 1.66) | 457 (3 studies) | ⊕⊝⊝⊝ Very low1,2,3 |
| Fibrin sealant vs argon beam | 269 per 1000 | 183 per 1000 (78 to 360) | OR 0.61 (0.23 to 1.53) | 106 (1 study) | ⊕⊝⊝⊝ Very low1,2,3 |
| Fibrin sealant vs collagen | 258 per 1000 | 356 per 1000 (205 to 547) | OR 1.59 (0.74 to 3.47) | 127 (1 study) | ⊕⊝⊝⊝ Very low1,2,3 |
| Oxidised cellulose vs fibrin sealant | 444 per 1000 | 309 per 1000 (113 to 603) | OR 0.56 (0.16 to 1.9) | 50 (1 study) | ⊕⊝⊝⊝ Very low1,2,3 |
| Plasmajet vs fibrin sealant | 207 per 1000 | 25 per 1000 (0 to 165) | OR 0.10 (0 to 0.76) | 58 (1 study) | ⊕⊝⊝⊝ Very low1,2,3 |
| Serious adverse events (number) | |||||
| Fibrin sealant vs control | 486 per 1000 | 470 per 1000 (307 to 640) | Rate ratio 0.94 (0.47 to 1.88) | 70 (1 study) | ⊕⊝⊝⊝ Very low1,2,3 |
| Fibrin sealant & collagen vs control | 147 per 1000 | 186 per 1000 (116 to 286) | Rate ratio 1.33 (0.76 to 2.33) | 300 (1 study) | ⊕⊝⊝⊝ Very low1,2,3 |
| Fibrin sealant vs argon beam | 65 per 1000 | 249 per 1000 (107 to 547) | Rate ratio 4.81 (1.73 to 17.5) | 121 (1 study) | ⊕⊕⊝⊝ Low1,2 |
| Fibrin sealant vs collagen | 323 per 1000 | 369 per 1000 (266 to 488) | Rate ratio 1.23 (0.76 to 2) | 189 (2 studies) | ⊕⊝⊝⊝ Very low1,2,3 |
| Fibrin sealant vs cyanoacrylate | 67 per 1000 | 67 per 1000 (2 to 733) | Rate ratio 1.01 (0.03 to 38.36) | 30 (1 study) | ⊕⊝⊝⊝ Very low1,2,3 |
| Oxidised cellulose vs cyanoacrylate | 67 per 1000 | 277 per 1000 (46 to 921) | Rate ratio 5.37 (0.67 to 163.2) | 30 (1 study) | ⊕⊝⊝⊝ Very low1,2,3 |
| Oxidised cellulose vs fibrin sealant | 67 per 1000 | 278 per 1000 (46 to 926) | Rate ratio 5.40 (0.67 to 174.86) | 30 (1 study) | ⊕⊝⊝⊝ Very low1,2,3 |
| Health‐related quality of life (30 days, 3 months) | None of the trials reported this outcome. | ||||
| Health‐related quality of life (longest follow‐up) | None of the trials reported this outcome. | ||||
| *The basis for the assumed risk is the mean control group proportion. The corresponding risk (and its 95% credible interval) is based on the assumed risk in the comparison group and the relative effect of the intervention (and its 95% CrI). Network meta‐analysis was not performed for any of the outcomes because of the lack of availability of direct and indirect comparisons in the network. CrI: credible intervals; OR: odds ratio. | |||||
| GRADE Working Group grades of evidence | |||||
| 1 Risk of bias was unclear or high in the trial(s) (downgraded by 1 point). | |||||
| Outcomes | Illustrative comparative risks* (95% CrI) | Relative effect (95% CrI) | No of participants | Quality of the evidence | |
| Assumed risk | Corresponding risk | ||||
| Control | Intervention | ||||
| Mortality (perioperative) | |||||
| Continuous portal triad clamping vs control | There was no mortality in either group. | 15 (1 study) | ⊕⊝⊝⊝ Very low1,2,3 | ||
| Intermittent portal triad clamping vs control | 26 per 1000 | 15 per 1000 (3 to 60) | OR 0.60 (0.13 to 2.42) | 392 (4 studies) | ⊕⊝⊝⊝ Very low1,2,3 |
| Continuous portal triad clamping vs continuous hepatic vascular exclusion | 1 per 1000 | 5 per 1000 (4 to 15) | OR 4.91 (3.68 to 15.64) | 170 (2 studies) | ⊕⊝⊝⊝ Very low1,2,3 |
| Continuous selective hepatic vascular exclusion vs continuous portal triad clamping | There was no mortality in either group. | 160 (1 study) | ⊕⊝⊝⊝ Very low1,2,3 | ||
| Continuous selective portal triad clamping vs continuous portal triad clamping | There was no mortality in either group. | 120 (1 study) | ⊕⊝⊝⊝ Very low1,2,3 | ||
| Intermittent portal triad clamping vs continuous portal triad clamping | 67 per 1000 | 10 per 1000 (0 to 70) | OR 0.14 (0 to 1.05) | 121 (2 studies) | ⊕⊝⊝⊝ Very low1,2,3 |
| Intermittent portal triad clamping vs continuous selective portal triad clamping | There was no mortality in either group. | 80 (1 study) | ⊕⊝⊝⊝ Very low1,2,3 | ||
| Intermittent selective portal triad clamping vs intermittent portal triad clamping | 1 per 1000 | 2 per 1000 (0 to 69) | OR 2.27 (0.17 to 74) | 138 (2 studies) | ⊕⊝⊝⊝ Very low1,2,3 |
| Mortality (longest follow‐up) | None of the trials reported this outcome. | ||||
| Serious adverse events (proportion)* | |||||
| Continuous hepatic vascular exclusion vs control | 99 per 1000 | 200 per 1000 (19 to 785) | Rate ratio 2.27 (0.18 to 33.05) | 815 (6 studies) | ⊕⊝⊝⊝ Very low1,2,3 |
| Continuous portal triad clamping vs control | 99 per 1000 | 135 per 1000 (30 to 439) | Rate ratio 1.42 (0.28 to 7.09) | 815 (6 studies) | ⊕⊝⊝⊝ Very low1,2,3 |
| Continuous selective hepatic vascular exclusion vs control | 99 per 1000 | 15 per 1000 (0 to 325) | Rate ratio 0.14 (0 to 4.37) | 815 (6 studies) | ⊕⊝⊝⊝ Very low1,2,3 |
| Continuous selective portal triad clamping vs control | 99 per 1000 | 55 per 1000 (11 to 226) | Rate ratio 0.53 (0.1 to 2.65) | 815 (6 studies) | ⊕⊝⊝⊝ Very low1,2,3 |
| Intermittent portal triad clamping vs control | 99 per 1000 | 113 per 1000 (56 to 217) | Rate ratio 1.16 (0.54 to 2.51) | 815 (6 studies) | ⊕⊝⊝⊝ Very low1,2,3 |
| Continuous portal triad clamping vs continuous hepatic vascular exclusion | 50 per 1000 | 32 per 1000 (2 to 412) | Rate ratio 0.63 (0.03 to 13.31) | 815 (6 studies) | ⊕⊝⊝⊝ Very low1,2,3 |
| Continuous selective hepatic vascular exclusion vs continuous hepatic vascular exclusion | 50 per 1000 | 3 per 1000 (0 to 442) | Rate ratio 0.06 (0 to 15.06) | 815 (6 studies) | ⊕⊝⊝⊝ Very low1,2,3 |
| Continuous selective portal triad clamping vs continuous hepatic vascular exclusion | 50 per 1000 | 12 per 1000 (1 to 209) | Rate ratio 0.23 (0.01 to 5.02) | 815 (6 studies) | ⊕⊝⊝⊝ Very low1,2,3 |
| Intermittent portal triad clamping vs continuous hepatic vascular exclusion | 50 per 1000 | 26 per 1000 (2 to 288) | Rate ratio 0.51 (0.03 to 7.68) | 815 (6 studies) | ⊕⊝⊝⊝ Very low1,2,3 |
| Continuous selective hepatic vascular exclusion vs continuous portal triad clamping | 139 per 1000 | 16 per 1000 (0 to 724) | Rate ratio 0.10 (0 to 16.28) | 815 (6 studies) | ⊕⊝⊝⊝ Very low1,2,3 |
| Continuous selective portal triad clamping vs continuous portal triad clamping | 139 per 1000 | 56 per 1000 (6 to 374) | Rate ratio 0.37 (0.04 to 3.7) | 815 (6 studies) | ⊕⊝⊝⊝ Very low1,2,3 |
| Intermittent portal triad clamping vs continuous portal triad clamping | 139 per 1000 | 117 per 1000 (22 to 439) | Rate ratio 0.82 (0.14 to 4.86) | 815 (6 studies) | ⊕⊝⊝⊝ Very low1,2,3 |
| Continuous selective portal triad clamping vs continuous selective hepatic vascular exclusion | As there were no serious adverse events in either group, the credible intervals were extremely wide. This is equivalent to not estimable in direct comparisons. | 815 (6 studies) | ⊕⊝⊝⊝ Very low1,2,3 | ||
| Intermittent portal triad clamping vs continuous selective hepatic vascular exclusion | As there were no serious adverse events in either group, the credible intervals were extremely wide. This is equivalent to not estimable in direct comparisons. | 815 (6 studies) | ⊕⊝⊝⊝ Very low1,2,3 | ||
| Intermittent portal triad clamping vs continuous selective portal triad clamping | 130 per 1000 | 247 per 1000 (51 to 665) | Rate ratio 2.19 (0.36 to 13.26) | 815 (6 studies) | ⊕⊝⊝⊝ Very low1,2,3 |
| Serious adverse events (number) | |||||
| Intermittent portal triad clamping vs control | 80 per 1000 | 119 per 1000 (36 to 358) | Rate ratio 1.55 (0.43 to 6.4) | 100 (1 study) | ⊕⊝⊝⊝ Very lowa,b,c |
| Continuous portal triad clamping vs continuous hepatic vascular exclusion | 179 per 1000 | 36 per 1000 (2 to 218) | Rate ratio 0.17 (0.01 to 1.28) | 52 (1 study) | ⊕⊝⊝⊝ Very lowa,b,c |
| Intermittent portal triad clamping vs continuous portal triad clamping | 190 per 1000 | 21 per 1000 (0 to 116) | Rate ratio 0.09 (0 to 0.56) | 86 (1 study) | ⊕⊕⊝⊝ Lowa,b |
| Intermittent selective portal triad clamping vs intermittent portal triad clamping | 134 per 1000 | 165 per 1000 (76 to 328) | Rate ratio 1.27 (0.53 to 3.15) | 138 (2 studies) | ⊕⊝⊝⊝ Very lowa,b,c |
| Health‐related quality of life (30 days, 3 months) | None of the trials reported this outcome. | ||||
| Health‐related quality of life (longest follow‐up) | None of the trials reported this outcome. | ||||
| *The basis for the assumed risk is the mean control group proportion. The corresponding risk (and its 95% credible interval) is based on the assumed risk in the comparison group and the relative effect of the intervention (and its 95% CrI). Network meta‐analysis was not performed for any of the outcomes other than serious adverse events (proportion) because of the lack of availability of direct and indirect comparisons in the network. CrI: credible intervals; OR: odds ratio. | |||||
| GRADE Working Group grades of evidence | |||||
| 1 Risk of bias was unclear or high in the trial(s) (downgraded by 1 point). | |||||
| Outcomes | Illustrative comparative risks* (95% CrI) | Relative effect (95% CrI) | No of participants | Quality of the evidence | |
| Assumed risk | Corresponding risk | ||||
| Control | Intervention | ||||
| Mortality (perioperative) | |||||
| Recombinant factor VIIa vs control | 51 per 1000 | 33 per 1000 (7 to 158) | OR 0.63 (0.13 to 3.51) | 185 (1 study) | ⊕⊝⊝⊝ Very low1,2,3 |
| Tranexamic acid vs control | There was no mortality in either group. | 214 (1 study) | ⊕⊝⊝⊝ Very low1,2,3 | ||
| Mortality (longest follow‐up) | None of the trials reported this outcome. | ||||
| Serious adverse events (proportion) | |||||
| Anti‐thrombin III vs control | 273 per 1000 | 312 per 1000 (67 to 761) | OR 1.21 (0.19 to 8.49) | 24 (1 study) | ⊕⊝⊝⊝ Very low1,2,3 |
| Recombinant Factor VIIa vs control | 376 per 1000 | 396 per 1000 (256 to 555) | OR 1.09 (0.57 to 2.07) | 432 (2 studies) | ⊕⊝⊝⊝ Very low1,2,3 |
| Serious adverse events (number) | |||||
| Recombinant Factor VIIa vs control | 81 per 1000 | 120 per 1000 (68 to 217) | Rate ratio 1.55 (0.83 to 3.16) | 432 (2 studies) | ⊕⊝⊝⊝ Very low1,2,3 |
| Tranexamic acid vs control | 75 per 1000 | 65 per 1000 (23 to 164) | Rate ratio 0.85 (0.29 to 2.41) | 214 (1 study) | ⊕⊝⊝⊝ Very low1,2,3 |
| Health‐related quality of life (30 days, 3 months) | None of the trials reported this outcome. | ||||
| Health‐related quality of life (maximal follow‐up) | None of the trials reported this outcome. | ||||
| *The basis for the assumed risk is the mean control group proportion. The corresponding risk (and its 95% credible interval) is based on the assumed risk in the comparison group and the relative effect of the intervention (and its 95% CrI). Network meta‐analysis was not performed for any of the outcomes because of the lack of availability of direct and indirect comparisons in the network. CrI: credible intervals; OR: odds ratio | |||||
| GRADE Working Group grades of evidence | |||||
| 1 Risk of bias was unclear or high in the trial(s) (downgraded by 1 point). | |||||
| Acute normovolemic haemodilution (ANH) |
| Low central venous pressure (central venous pressure) |
| Hypoventilation |
| Combination of ANH with central venous pressure or hypotension |
| Finger‐fracture method |
| Clamp‐crush method |
| Cavitron ultrasonic surgical aspirator |
| Sharp dissection |
| Radiofrequency dissecting sealer |
| Ultrasonic shears |
| Stapler |
| Waterjet (Hydrojet) |
| Suturing for large and medium vessels and ducts and performing electrocauterisation of small vessels and ducts |
| Suturing for large vessels and performing ultrasonic shears for medium‐sized and small vessels and ducts |
| Suturing and argon beam coagulator |
| Suturing and fibrin sealant |
| Suturing and collagen |
| Suturing and oxidised cellulose |
| Suturing and cyanoacrylate |
| Suturing and combination of fibrin sealant with collagen or oxidised cellulose |
| No vascular occlusion |
| Portal triad clamping (continuous) (occlusion of inflow alone) |
| Portal triad clamping (intermittent) (occlusion of inflow alone) |
| Hepatic vascular exclusion (occlusion of inflow and outflow) (continuous or intermittent) |
| Selective portal trial clamping (occlusion of inflow to the hemi‐liver that is being resected) (continuous or intermittent) |
| Selective hepatic vascular exclusion (occlusion of inflow to the hemi‐liver and outflow from the hemi‐liver that is being resected) (continuous or intermittent) |
| Grades | Definitions | Examples |
| I | Any deviation from the normal postoperative course without the need for pharmacological treatment or surgical, endoscopic, or radiological interventions | Drugs such as antiemetics, antipyretics, analgesics, diuretics, and electrolytes; physiotherapy; wound infections opened at the bedside |
| II | Requiring pharmacological treatment with drugs other than those allowed for grade I complications | Blood transfusions, total parenteral nutrition |
| III | Requiring surgical, endoscopic, or radiological intervention | Bile leak requiring endoscopic stent; re‐operation for any cause; drainage of infected intra‐abdominal collection |
| IV | Life‐threatening complication requiring high dependency or intensive care management | Dialysis |
| V | Death of patient | — |
| Suffix d | If the patient suffers from a complication at the time of discharge and needs further follow‐up to evaluate the complication fully | — |
| Adapted from Dindo 2004; Clavien 2009. | ||
| Blood transfusion (red blood cell) (units) | |||
| Treatment number | Treatment name | ||
| 1 | Control | ||
| 2 | Acute normovolemic haemodilution | ||
| 3 | Acute normovolemic haemodilution plus hypotension | ||
| 4 | Acute normovolemic haemodilution plus low central venous pressure | ||
| 5 | Low central venous pressure | ||
| Fixed‐effect model | Random‐effects model | Inconsistency model | |
| Dbara | 2.68 | −8.90 | −9.80 |
| pDb | 10.05 | 12.67 | 11.96 |
| DICc | 12.73 | 3.77 | 2.17 |
| d[2]d | −1.23 (95% CrI −1.74 to −0.73) | −1.26 (95% CrI −4.92 to 2.39) | — |
| d[3]e | −1.65 (95% CrI −2.06 to −1.25) | −1.68 (95% CrI −5.33 to 1.98) | — |
| d[4]f | 0.15 (95% CrI −0.10 to 0.40) | −0.57 (95% CrI −3.35 to 1.88) | — |
| d[5]g | −0.81 (95% CrI −1.33 to −0.30) | −1.08 (95% CrI −3.43 to 1.13) | — |
| Between‐study standard deviation | — | 1.446 | |
| Model used | Random‐effects model | ||
| Evidence of inconsistency | There is no evidence of inconsistency since the difference in DIC between consistency and inconsistency models was not significant. | ||
| Blood loss (litres) | |||
| Treatment number | Treatment name | ||
| 1 | Control | ||
| 2 | Acute normovolemic haemodilution | ||
| 3 | Acute normovolemic haemodilution plus hypotension | ||
| 4 | Acute normovolemic haemodilution plus low central venous pressure | ||
| 5 | Hypoventilation | ||
| 6 | Low central venous pressure | ||
| Fixed‐effect model | Random‐effects model | Inconsistency model | |
| Dbara | −24.73 | −36.06 | −36.65 |
| pDb | 14.00 | 17.77 | 18.26 |
| DICc | −10.73 | −18.29 | −18.39 |
| d[2]d | 0.00 (95% CrI −0.10 to 0.10) | 0.00 (95% CrI −0.95 to 0.96) | — |
| d[3]e | −0.25 (95% CrI −0.37 to −0.13) | −0.25 (95% CrI −1.20 to 0.71) | — |
| d[4]f | 0.01 (95% CrI −0.04 to 0.07) | −0.10 (95% CrI −0.88 to 0.46) | — |
| d[5]g | 0.00 (95% CrI −1.12 to 1.12) | −0.01 (95% CrI −1.44 to 1.43) | — |
| d[6]h | −0.29 (95% CrI −0.40 to −0.18) | −0.32 (95% CrI −0.86 to 0.09) | — |
| Between‐study standard deviation | — | 0.3734 | — |
| Model used | Random‐effects model | ||
| Evidence of inconsistency | There is no evidence of inconsistency since the difference in DIC between consistency and inconsistency models was not significant. | ||
| aDbar = posterior mean of deviance. | |||
| Adverse events (proportion) | |||
| Treatment number | Treatment name | ||
| 1 | Clamp‐crush method | ||
| 2 | Cavitron ultrasonic surgical aspirator | ||
| 3 | Hydrojet | ||
| 4 | Radiofrequency dissecting sealer | ||
| 5 | Sharp transection method | ||
| 6 | Stapler | ||
| Fixed‐effect model | Random‐effects model | Inconsistency model* | |
| Dbara | 95.62 | 80.26 | 81.67 |
| pDb | 13.05 | 17.04 | 16.71 |
| DICc | 108.67 | 97.30 | 98.37 |
| d[2]d | 0.32 (95% CrI −0.28 to 0.92) | 0.76 (95% CrI −2.18 to 4.69) | — |
| d[3]e | −0.99 (95% CrI −2.76 to 0.54) | −0.56 (95% CrI −6.84 to 6.60) | — |
| d[4]f | 0.11 (95% CrI −0.46 to 0.68) | 0.19 (95% CrI −2.95 to 3.50) | — |
| d[5]g | 0.10 (95% CrI −0.79 to 1.00) | 0.1 (95% CrI −5.59 to 5.80) | — |
| d[6]h | 0.06 (95% CrI −0.63 to 0.76) | 0.06 (95% CrI −5.59 to 5.76) | — |
| Between‐study standard deviation | — | 2.436 | — |
| Model used | Random‐effects model | ||
| Evidence of inconsistency | There is no evidence of inconsistency since the difference in DIC between consistency and inconsistency models was not significant. | ||
| Adverse events (number) | |||
| Treatment number | Treatment name | ||
| 1 | Clamp‐crush method | ||
| 2 | Cavitron ultrasonic surgical aspirator | ||
| 3 | Hydrojet | ||
| 4 | Radiofrequency dissecting sealer | ||
| 5 | Sharp transection method | ||
| 6 | Stapler | ||
| Fixed‐effect model | Random‐effects model | Inconsistency model* | |
| Dbara | 80.99 | 80.94 | 79.59 |
| pDb | 11.93 | 11.88 | 14.76 |
| DICc | 92.92 | 92.83 | 94.35 |
| d[2]d | 0.47 (95% CrI −0.08 to 1.03) | 0.47 (95% CrI −0.08 to 1.03) | — |
| d[3]e | 0.34 (95% CrI −0.71 to 1.29) | 0.33 (95% CrI −0.71 to 1.28) | — |
| d[4]f | 0.61 (95% CrI 0.12 to 1.12) | 0.61 (95% CrI 0.12 to 1.11) | — |
| d[5]g | 0.12 (95% CrI −0.56 to 0.81) | 0.12 (95% CrI −0.56 to 0.81) | — |
| d[6]h | 0.62 (95% CrI −0.21 to 1.48) | 0.62 (95% CrI −0.20 to 1.45) | — |
| Between‐study standard deviation | — | 2.499 | — |
| Model used | Fixed‐effect model | — | |
| Evidence of inconsistency | There is no evidence of inconsistency since the difference in DIC between consistency and inconsistency models was not significant. | ||
| Blood transfusion (proportion) | |||
| Treatment number | Treatment name | ||
| 1 | Clamp‐crush method | ||
| 2 | Cavitron ultrasonic surgical aspirator | ||
| 3 | Hydrojet | ||
| 4 | Radiofrequency dissecting sealer | ||
| 5 | Sharp transection method | ||
| Fixed‐effect model | Random‐effects model | Inconsistency model* | |
| Dbara | 72.41 | 71.86 | 72.23 |
| pDb | 11.91 | 13.99 | 14.98 |
| DICc | 84.33 | 85.85 | 87.21 |
| d[2]d | 0.39 (95% CrI −0.62 to 1.42) | 0.42 (95% CrI −1.09 to 1.96) | — |
| d[3]e | 0.55 (95% CrI −0.75 to 1.83) | 0.60 (95% CrI −1.47 to 2.83) | — |
| d[4]f | 0.09 (95% CrI −0.50 to 0.68) | 0.14 (95% CrI −0.77 to 1.32) | — |
| d[5]g | −0.22 (95% CrI −1.16 to 0.71) | −0.22 (95% CrI −2.21 to 1.75) | — |
| Between‐study standard deviation | — | 0.6464 | — |
| Model used | Fixed‐effect model | — | |
| Evidence of inconsistency | There is no evidence of inconsistency since the difference in DIC between consistency and inconsistency models was not significant. | ||
| aDBar = posterior mean of deviance. | |||
| Serious adverse events (proportion) | |||
| Treatment number | Treatment name | ||
| 1 | Control | ||
| 2 | ConHVE | ||
| 3 | ConPTC | ||
| 4 | ConSelectiveHVE | ||
| 5 | ConSelectivePTC | ||
| 6 | IntPTC | ||
| Fixed‐effect model | Random‐effects model | Inconsistency model | |
| Dbara | 64.25 | 63.57 | 64.03 |
| pDb | 12.54 | 14.37 | 14.83 |
| DICc | 76.79 | 77.95 | 78.86 |
| d[2]d | 0.82 (95% CrI −1.70 to 3.50) | 0.62 (95% CrI −5.00 to 5.89) | — |
| d[3]e | 0.35 (95% CrI −1.26 to 1.96) | 0.16 (95% CrI −3.87 to 3.71) | — |
| d[4]f | −1.98 (95% CrI −8.24 to 1.48) | −2.25 (95% CrI −9.99 to 3.38) | — |
| d[5]g | −0.63 (95% CrI −2.29 to 0.97) | −1.01 (95% CrI −5.35 to 2.36) | — |
| d[6]h | 0.15 (95% CrI −0.61 to 0.92) | −0.07 (95% CrI −2.53 to 1.85) | — |
| Between‐study standard deviation | — | 1.216 | — |
| Model used | Fixed‐effect model | ||
| Evidence of inconsistency | There is no evidence of inconsistency since the difference in DIC between consistency and inconsistency models was not significant. | ||
| Adverse events (proportion) | |||
| Treatment number | Treatment name | ||
| 1 | Control | ||
| 2 | ConHVE | ||
| 3 | ConPTC | ||
| 4 | ConSelectiveHVE | ||
| 5 | ConSelectivePTC | ||
| 6 | IntPTC | ||
| 7 | IntSelectivePTC | ||
| Fixed‐effect model | Random‐effects model | Inconsistency model | |
| Dbara | 120.82 | 118.76 | 119.07 |
| pDb | 18.10 | 21.01 | 21.93 |
| DICc | 138.92 | 139.77 | 141.00 |
| d[2]d | 0.95 (95% CrI −0.21 to 2.12) | 0.90 (95% CrI −1.12 to 2.84) | — |
| d[3]e | 0.83 (95% CrI 0.00 to 1.69) | 0.78 (95% CrI −0.58 to 2.09) | — |
| d[4]f | 0.05 (95% CrI −1.19 to 1.27) | 0.00 (95% CrI −2.05 to 1.96) | — |
| d[5]g | 0.10 (95% CrI −0.81 to 1.01) | 0.07 (95% CrI −1.42 to 1.50) | — |
| d[6]h | 0.24 (95% CrI −0.19 to 0.68) | 0.18 (95% CrI −0.66 to 0.88) | — |
| d[7]i | 0.09 (95% CrI −0.75 to 0.93) | 0.04 (95% CrI −1.37 to 1.35) | — |
| Between‐study standard deviation | — | 0.4825 | — |
| Model used | Fixed‐effect model | ||
| Evidence of inconsistency | There is no evidence of inconsistency since the difference in DIC between consistency and inconsistency models was not significant. | ||
| Blood transfusion (proportion) | |||
| Treatment number | Treatment name | ||
| 1 | Control | ||
| 2 | ConHVE | ||
| 3 | ConPTC | ||
| 4 | ConSelectiveHVE | ||
| 5 | ConSelectivePTC | ||
| 6 | IntPTC | ||
| 7 | IntSelectivePTC | ||
| Fixed‐effect model | Random‐effects model | Inconsistency model | |
| Dbara | 139.87 | 120.00 | 120.10 |
| pDb | 19.04 | 25.25 | 25.72 |
| DICc | 158.91 | 145.25 | 145.82 |
| d[2]d | −2.55 (95% CrI −3.80 to −1.36) | −2.88 (95% CrI −7.47 to 1.47) | — |
| d[3]e | −0.77 (95% CrI −1.56 to 0.01) | −1.11 (95% CrI −3.72 to 1.28) | — |
| d[4]f | −1.46 (95% CrI −2.58 to −0.36) | −1.79 (95% CrI −6.38 to 2.53) | — |
| d[5]g | −0.26 (95% CrI −1.18 to 0.67) | −0.48 (95% CrI −3.83 to 2.72) | — |
| d[6]h | −0.34 (95% CrI −0.84 to 0.16) | −0.47 (95% CrI −2.32 to 1.28) | — |
| d[7]i | −0.92 (95% CrI −1.96 to 0.08) | −0.97 (95% CrI −4.24 to 2.24) | — |
| Between study standard deviation | — | 1.613 | — |
| Model used | Random‐effects model | ||
| Evidence of inconsistency | There is no evidence of inconsistency since the difference in DIC between consistency and inconsistency models was not significant. | ||
| Blood transfusion (red blood cell) (units) | |||
| Treatment number | Treatment name | ||
| 1 | Control | ||
| 2 | ConHVE | ||
| 3 | ConPTC | ||
| 4 | ConSelectiveHVE | ||
| 5 | ConSelectivePTC | ||
| 6 | IntPTC | ||
| 7 | IntSelectivePTC | ||
| Fixed‐effect model | Random‐effects model | Inconsistency model | |
| Dbara | −1.55 | −1.05 | 0.24 |
| pDb | 15.99 | 17.36 | 19.34 |
| DICc | 14.44 | 16.32 | 19.58 |
| d[2]d | −1.65 (95% CrI −3.96 to 0.67) | −1.56 (95% CrI −4.18 to 1.14) | — |
| d[3]e | −1.25 (95% CrI −2.39 to −0.10) | −1.18 (95% CrI −2.54 to 0.31) | — |
| d[4]f | −2.45 (95% CrI −4.08 to −0.82) | −2.37 (95% CrI −4.33 to −0.30) | — |
| d[5]g | −1.45 (95% CrI −2.59 to −0.31) | −1.41 (95% CrI −2.86 to 0.12) | — |
| d[6]h | −1.36 (95% CrI −2.48 to −0.23) | −1.35 (95% CrI −2.69 to 0.01) | — |
| d[7]i | −1.43 (95% CrI −2.61 to −0.24) | −1.43 (95% CrI −3.01 to 0.08) | — |
| Between‐study standard deviation | — | 0.3149 | — |
| Model used | Fixed‐effect model | ||
| Evidence of inconsistency | There is no evidence of inconsistency since the difference in DIC between consistency and inconsistency models was not significant. | ||
| Blood loss (litres) | |||
| Treatment number | Treatment name | ||
| 1 | Control | ||
| 2 | ConHVE | ||
| 3 | ConPTC | ||
| 4 | ConSelectiveHVE | ||
| 5 | ConSelectivePTC | ||
| 6 | IntPTC | ||
| 7 | IntSelectivePTC | ||
| Fixed‐effect model | Random‐effects model | Inconsistency model | |
| Dbara | −45.73 | −61.66 | −63.13 |
| pDb | 22.01 | 29.37 | 30.58 |
| DICc | −23.72 | −32.29 | −32.55 |
| d[2]d | −0.36 (95% CrI −0.50 to −0.23) | −0.37 (95% CrI −0.94 to 0.22) | — |
| d[3]e | −0.02 (95% CrI −0.12 to 0.07) | −0.14 (95% CrI −0.52 to 0.14) | — |
| d[4]f | −0.27 (95% CrI −0.54 to −0.01) | −0.39 (95% CrI −1.16 to 0.27) | — |
| d[5]g | 0.09 (95% CrI −0.04 to 0.21) | 0.00 (95% CrI −0.57 to 0.45) | — |
| d[6]h | 0.01 (95% CrI −0.05 to 0.07) | −0.06 (95% CrI −0.39 to 0.17) | — |
| d[7]i | 0.00 (95% CrI −0.21 to 0.2) | −0.18 (95% CrI −0.84 to 0.30) | — |
| Between‐study standard deviation | — | 0.2539 | — |
| Model used | Random‐effects model | ||
| Evidence of inconsistency | There is no evidence of inconsistency since the difference in DIC between consistency and inconsistency models was not significant. | ||
| Con: continuous; Int: intermittent; HVE: hepatic vascular exclusion; PTC: portal triad clamping. | |||
| aDBar = posterior mean of deviance. | |||
| Blood transfusion (red blood cell) (units) | ||||
| Acute normovolemic haemodilution | Acute normovolemic haemodilution plus hypotension | Acute normovolemic haemodilution plus low central venous pressure | Low central venous pressure | |
| Control | MD −1.26; 95% CrI −4.92 to 2.39 | MD −1.68; 95% CrI −5.33 to 1.98 | MD −0.57; 95% CrI −3.35 to 1.88 | MD −1.08; 95% CrI −3.43 to 1.13 |
| Acute normovolemic haemodilution | — | MD −0.42; 95% CrI −5.59 to 4.75 | MD 0.69; 95% CrI −3.80 to 5.18 | MD 0.18; 95% CrI −4.12 to 4.49 |
| Acute normovolemic haemodilution plus hypotension | — | — | MD 1.11; 95% CrI −3.39 to 5.60 | MD 0.60; 95% CrI −3.71 to 4.91 |
| Acute normovolemic haemodilution plus low central venous pressure | — | — | — | MD −0.51; 95% CrI −3.97 to 2.96 |
| Blood loss (litres) | ||||
| Acute normovolemic haemodilution | Acute normovolemic haemodilution plus hypotension | Acute normovolemic haemodilution plus low central venous pressure | Hypoventilation | |
| Control | MD 0.00; 95% CrI −0.95 to 0.96 | MD −0.25; 95% CrI −1.20 to 0.71 | MD −0.10; 95% CrI −0.88 to 0.46 | MD −0.01; 95% CrI −1.44 to 1.43 |
| Acute normovolemic haemodilution | — | MD −0.25; 95% CrI −1.60 to 1.10 | MD −0.11; 95% CrI −1.27 to 1.06 | MD −0.01; 95% CrI −1.73 to 1.71 |
| Acute normovolemic haemodilution plus hypotension | — | — | MD 0.14; 95% CrI −1.02 to 1.31 | MD 0.24; 95% CrI −1.48 to 1.96 |
| Acute normovolemic haemodilution plus low central venous pressure | — | — | — | MD 0.10; 95% CrI −1.49 to 1.68 |
| Hypoventilation | — | — | — | — |
| aThe table provides the effect estimate of each pair‐wise comparison. To identify the effect estimate of a comparison (e.g. A versus B), look at the cell that occupies the column corresponding to treatment A and the row corresponding to treatment B. This gives the information directly. If that cell is empty (indicated by a '—', you have to look at column corresponding to treatment B and row corresponding to treatment A. You will have to take the inverse of this number (i.e. 1/number) to get the treatment effect. | ||||
| Adverse events (proportion) | ||||
| Cavitron ultrasonic surgical aspirator | Hydrojet | Radiofrequency dissecting sealer | Sharp transection method | |
| Clamp‐crush method | OR 2.15; 95% CrI 0.11 to 108.74 | OR 0.57; 95% CrI 0.00 to 732.89 | OR 1.20; 95% CrI 0.05 to 33.05 | OR 1.11; 95% CrI 0.00 to 331.29 |
| Cavitron ultrasonic surgical aspirator | — | OR 0.27; 95% CrI 0.00 to 501.34 | OR 0.56; 95% CrI 0.01 to 62.38 | OR 0.52; 95% CrI 0.00 to 398.54 |
| Hydrojet | — | — | OR 2.12; 95% CrI 0.00 to 3638.36 | OR 1.94; 95% CrI 0.00 to 12959.09 |
| Radiofrequency dissecting sealer | — | — | — | OR 0.92; 95% CrI 0.00 to 638.06 |
| Sharp transection method | — | — | — | ‐ |
| Adverse events (number) | ||||
| Cavitron ultrasonic surgical aspirator | Hydrojet | Radiofrequency dissecting sealer | Sharp transection method | |
| Clamp‐crush method | rate ratio 1.60; 95% CrI 0.92 to 2.79 | rate ratio 1.40; 95% CrI 0.49 to 3.63 | rate ratio 1.84; 95% CrI 1.13 to 3.06 | rate ratio 1.13; 95% CrI 0.57 to 2.24 |
| Cavitron ultrasonic surgical aspirator | — | rate ratio 0.88; 95% CrI 0.28 to 2.75 | rate ratio 1.15; 95% CrI 0.54 to 2.42 | rate ratio 0.71; 95% CrI 0.29 to 1.71 |
| Hydrojet | — | — | rate ratio 1.31; 95% CrI 0.43 to 4.01 | rate ratio 0.81; 95% CrI 0.24 to 2.71 |
| Radiofrequency dissecting sealer | — | — | — | rate ratio 0.62; 95% CrI 0.26 to 1.44 |
| Sharp transection method | — | — | — | — |
| Blood transfusion (proportion) | ||||
| Cavitron ultrasonic surgical aspirator | Hydrojet | Radiofrequency dissecting sealer | Sharp transection method | |
| Clamp‐crush method | OR 1.48; 95% CrI 0.54 to 4.13 | OR 1.73; 95% CrI 0.47 to 6.25 | OR 1.09; 95% CrI 0.61 to 1.97 | OR 0.80; 95% CrI 0.31 to 2.03 |
| Cavitron ultrasonic surgical aspirator | — | OR 1.17; 95% CrI 0.23 to 6.05 | OR 0.74; 95% CrI 0.23 to 2.39 | OR 0.54; 95% CrI 0.14 to 2.15 |
| Hydrojet | — | — | OR 0.63; 95% CrI 0.15 to 2.61 | OR 0.46; 95% CrI 0.09 to 2.27 |
| Radiofrequency dissecting sealer | — | — | — | OR 0.73; 95% CrI 0.24 to 2.21 |
| aThe table provides the effect estimate of each pair‐wise comparison. To identify the effect estimate of a comparison (e.g. A versus B), look at the cell that occupies the column corresponding to treatment A and the row corresponding to treatment B. This gives the information directly. If that cell is empty (indicated by a '—', you have to look at column corresponding to treatment B and row corresponding to treatment A. You will have to take the inverse of this number (i.e. 1/number) to get the treatment effect. | ||||
| Serious adverse events (proportion) | |||||
| ConHVE | ConPTC | ConSelectiveHVE | ConSelectivePTC | IntPTC | |
| Control | OR 2.27; 95% CrI 0.18 to 33.05 | OR 1.42; 95% CrI 0.28 to 7.09 | OR 0.14; 95% CrI 0.00 to 4.37 | OR 0.53; 95% CrI 0.10 to 2.65 | OR 1.16; 95% CrI 0.54 to 2.51 |
| ConHVE | — | OR 0.63; 95% CrI 0.03 to 13.31 | OR 0.06; 95% CrI 0.00 to 15.06 | OR 0.23; 95% CrI 0.01 to 5.02 | OR 0.51; 95% CrI 0.03 to 7.68 |
| ConPTC | — | — | OR 0.10; 95% CrI 0.00 to 16.28 | OR 0.37; 95% CrI 0.04 to 3.70 | OR 0.82; 95% CrI 0.14 to 4.86 |
| ConSelectiveHVE | — | — | — | Not estimable | Not estimable |
| ConSelectivePTC | — | — | — | — | OR 2.19; 95% CrI 0.36 to 13.26 |
| Adverse events (proportion) | |||||
| ConHVE | ConPTC | ConSelectiveHVE | ConSelectivePTC | IntPTC | |
| Control | OR 2.58; 95% CrI 0.81 to 8.30 | OR 2.30; 95% CrI 1.00 to 5.41 | OR 1.06; 95% CrI 0.31 to 3.58 | OR 1.11; 95% CrI 0.45 to 2.75 | OR 1.28; 95% CrI 0.83 to 1.97 |
| ConHVE | — | OR 0.89; 95% CrI 0.21 to 3.75 | OR 0.41; 95% CrI 0.08 to 2.22 | OR 0.43; 95% CrI 0.10 to 1.88 | OR 0.49; 95% CrI 0.14 to 1.71 |
| ConPTC | — | — | OR 0.46; 95% CrI 0.10 to 2.04 | OR 0.48; 95% CrI 0.14 to 1.67 | OR 0.55; 95% CrI 0.21 to 1.43 |
| ConSelectiveHVE | — | — | — | OR 1.05; 95% CrI 0.23 to 4.84 | OR 1.21; 95% CrI 0.33 to 4.45 |
| ConSelectivePTC | — | — | — | — | OR 1.15; 95% CrI 0.42 to 3.16 |
| IntPTC | — | — | — | — | — |
| Blood transfusion (proportion) | |||||
| ConHVE | ConPTC | ConSelectiveHVE | ConSelectivePTC | IntPTC | |
| Control | OR 0.06; 95% CrI 0.00 to 4.33 | OR 0.33; 95% CrI 0.02 to 3.59 | OR 0.17; 95% CrI 0.00 to 12.59 | OR 0.62; 95% CrI 0.02 to 15.18 | OR 0.63; 95% CrI 0.10 to 3.59 |
| ConHVE | — | Not estimable | Not estimable | Not estimable | Not estimable |
| ConPTC | — | — | OR 0.51; 95% CrI 0.00 to 83.52 | Not estimable | OR 1.89; 95% CrI 0.09 to 41.17 |
| ConSelectiveHVE | — | — | — | Not estimable | Not estimable |
| ConSelectivePTC | — | — | — | — | OR 1.01; 95% CrI 0.02 to 42.32 |
| IntPTC | — | — | — | — | — |
| Blood transfusion (red blood cell) | |||||
| ConHVE | ConPTC | ConSelectiveHVE | ConSelectivePTC | IntPTC | |
| Control | MD −1.65; 95% CrI −3.96 to 0.67 | MD −1.25; 95% CrI −2.39 to −0.10 | MD −2.45; 95% CrI −4.08 to −0.82 | MD −1.45; 95% CrI −2.59 to −0.31 | MD −1.36; 95% CrI −2.48 to −0.23 |
| ConHVE | — | MD 0.40; 95% CrI −2.18 to 2.98 | MD −0.80; 95% CrI −3.64 to 2.03 | MD 0.20; 95% CrI −2.39 to 2.78 | MD 0.29; 95% CrI −2.29 to 2.86 |
| ConPTC | — | — | MD −1.20; 95% CrI −3.20 to 0.79 | MD −0.20; 95% CrI −1.82 to 1.42 | MD −0.11; 95% CrI −1.72 to 1.50 |
| ConSelectiveHVE | — | — | — | MD 1.00; 95% CrI −0.99 to 2.99 | MD 1.09; 95% CrI −0.89 to 3.07 |
| ConSelectivePTC | — | — | — | — | MD 0.09; 95% CrI −1.51 to 1.70 |
| IntPTC | — | — | — | — | — |
| Blood loss | |||||
| ‐ | ConHVE | ConPTC | ConSelectiveHVE | ConSelectivePTC | IntPTC |
| Control | MD −0.37; 95% CrI −0.94 to 0.22 | MD −0.14; 95% CrI −0.52 to 0.14 | MD −0.39; 95% CrI −1.16 to 0.27 | MD 0.00; 95% CrI −0.57 to 0.45 | MD −0.06; 95% CrI −0.39 to 0.17 |
| ConHVE | — | MD 0.23; 95% CrI −0.44 to 0.90 | MD −0.02; 95% CrI −0.94 to 0.90 | MD 0.37; 95% CrI −0.41 to 1.14 | MD 0.31; 95% CrI −0.34 to 0.95 |
| ConPTC | — | — | MD −0.25; 95% CrI −1.04 to 0.54 | MD 0.14; 95% CrI −0.47 to 0.74 | MD 0.08; 95% CrI −0.35 to 0.52 |
| ConSelectiveHVE | — | — | — | MD 0.39; 95% CrI −0.49 to 1.26 | MD 0.33; 95% CrI −0.44 to 1.10 |
| ConSelectivePTC | — | — | — | — | MD −0.06; 95% CrI −0.64 to 0.52 |
| IntPTC | — | — | — | — | — |
| Con: continuous; Int: intermittent; HVE: hepatic vascular exclusion; PTC: portal triad clamping. | |||||
| aThe table provides the effect estimate of each pair‐wise comparison. To identify the effect estimate of a comparison (e.g. A versus B), look at the cell that occupies the column corresponding to treatment A and the row corresponding to treatment B. This gives the information directly. If that cell is empty (indicated by a ' —', you have to look at column corresponding to treatment B and row corresponding to treatment A. You will have to take the inverse of this number (i.e. 1/number) to get the treatment effect. | |||||
| Study | Intervention | Co‐interventions | ||||||||
| Intervention | Control | Other information | Type of intervention | Vascular occlusion | Parenchymal transection method | Raw surface | Pharmacological methods | Cardiopulmonary methods | Autologous transfusion | |
| Anterior approach | Control | — | Anterior approach | Not stated | Clamp‐crush, bipolar dissecting sealer | Not stated | Not stated | Not stated | Not stated | |
| Anterior approach | Control | — | Anterior approach | Not stated | Cavitron ultrasonic surgical aspirator | Not stated | Not stated | Not stated | Not stated | |
| Autologous blood donation | Control | Note: autologous blood donation group was further randomised to recombinant erythropoietin and no erythropoietin | Autologous transfusion | Not stated | Not stated | Not stated | Not stated | Not stated | Factor being randomised | |
| Autologous blood donation | Control | Autologous blood donation: 2 units of blood were withdrawn before surgery | Autologous transfusion | Hepatic vascular exclusion | Not stated | Not stated | Not stated | Not stated | Factor being randomised | |
| Acute normovolemic haemodilution plus low central venous pressure | Control | Acute normovolemic dilution plus low central venous pressure: blood withdrawn to a target of 28% haematocrit and replaced with fluid. Target for central venous pressure was not reported | Cardiopulmonary methods | Not stated | Not stated | Not stated | Not stated | Factor being randomised | Not stated | |
| Acute normovolemic haemodilution plus low central venous pressure | Low central venous pressure | Acute normovolemic haemodilution: blood was withdrawn and replaced by colloids and crystalloids to reach a haematocrit target of 8 gm/dL. | Cardiopulmonary methods | Intermittent portal triad clamping | Not stated | Not stated | Not stated | Factor being randomised | Not stated | |
| Acute normovolemic haemodilution plus low central venous pressure | Low central venous pressure | Acute normovolemic haemodilution: blood was withdrawn and replaced by colloids to reach a haematocrit target of 24%. | Cardiopulmonary methods | Not stated | Not stated | Not stated | Not stated | Factor being randomised | Not stated | |
| Acute normovolemic haemodilution | Acute normovolemic haemodilution with hypotension | Acute normovolemic haemodilution: withdrawal of blood and replacement with fluids to maintain a target haematocrit of 30%. | Cardiopulmonary methods | Not stated | Not stated | Not stated | Not stated | Factor being randomised | Not stated | |
| Hypoventilation | Control | — | Cardiopulmonary methods | Intermittent portal triad clamping or selective occlusion | Clamp crush or cavitron ultrasonic surgical aspirator | Not stated | Not stated | Factor being randomised | None | |
| Low central venous pressure | Control | Low central venous pressure: by restricting flow from legs | Cardiopulmonary methods | Not stated | Not stated | Not stated | Not stated | Factor being randomised | Not stated | |
| Low central venous pressure | Control | Low central venous pressure: nitroglycerine | Cardiopulmonary intervention | Intermittent portal triad clamping | Not stated | Not stated | Not stated | Factor being randomised | Not stated | |
| Low central venous pressure | Control | Low central venous pressure: by inferior IVC clamping | Cardiopulmonary methods | Intermittent portal triad clamping | Cavitron ultrasonic surgical aspirator | Fibrin glue used | Not stated | Factor being randomised | Not stated | |
| Low central venous pressure | Control | Low central venous pressure: by limiting fluid, nitroglycerine, and furosemide | Cardiopulmonary methods | Varied | Clamp‐crush | Not stated | Not stated | Factor being randomised | Not stated | |
| Low central venous pressure | Low central venous pressure + acute normovolemic haemodilution. | Low central venous pressure: fluid restriction and nitroglycerine. | Cardiopulmonary methods | Not stated | Not stated | Not stated | Not stated | Factor being randomised | Not stated | |
| Stapler | Clamp‐crush method | Stapler: Autosuture EndoGIA stapler (Covidien) | Parenchumal transection | Variable | Factor being randomised | Variable | Not stated | Low central venous pressure | Not stated | |
| Cavitron ultrasonic surgical aspirator | Clamp‐crush method | — | Parenchymal transection | No vascular occlusion | Factor being randomised | Not stated | Not stated | Not stated | Not stated | |
| Cavitron ultrasonic surgical aspirator | Clamp‐crush method | — | Parenchymal transection | Intermittent total or selective portal triad clamping | Factor being randomised | Fibrin glue used | Not stated | Not stated | Not stated | |
| Cavitron ultrasonic surgical aspirator | Clamp‐crush method | Ultrasonic dissector: cavitron ultrasonic surgical aspirator. | Parenchymal transection | Intermittent portal triad clamping | Factor being randomised | Not stated | Not stated | Low central venous pressure | Not stated | |
| Cavitron ultrasonic surgical aspirator | Hydrojet | Hydrojet: Jet Cutter | Parenchymal transection | Portal triad clamping | Factor being randomised | Variable | Not stated | Not stated | Not stated | |
| Cavitron ultrasonic surgical aspirator | Stapler | Stapler: Endostapler (Covidien) | Parenchymal transection | Variable | Factor being randomised | Not stated | Not stated | Not stated | Not stated | |
| Cavitron ultrasonic surgical aspirator | Radiofrequency dissecting sealer. | Radiofrequency dissecting sealer: Tissue Link | Parenchymal transection | No vascular occlusion | Factor being randomised | Not stated | Not stated | Not stated | Not stated | |
| Radiofrequency dissecting sealer | Clamp‐crush method | Radiofrequency dissecting sealer: Ligasure | Parenchymal transection | Intermittent portal triad clamping or hemihepatic occlusion | Factor being randomised | Not stated | Not stated | Not stated | No | |
| Radiofrequency dissecting sealer | Clamp‐crush method | Radiofrequency dissecting sealer: Radionics needles | Parenchymal transection | No vascular occlusion | Factor being randomised | Not stated | Not stated | Not stated | Not stated | |
| Radiofrequency dissecting sealer | Clamp‐crush method | Radiofrequency dissecting sealer: Ligasure (Covidien) | Parenchymal transection | Not stated | Factor being randomised | No fibrin glue used | Not stated | Low central venous pressure | Not stated | |
| Radio‐frequency dissecting sealer | Clamp‐crush method | Radio‐frequency dissecting sealer: Tissue Link (Valley Lab) | Parenchymal transection | Variable | Factor being randomised | Not stated | Not stated | Not stated | Not stated | |
| Sharp transection | Clamp‐crush method | Sharp transection: using scalpel | Parenchymal transection | Selective hepatic vascular exclusion | Factor being randomised | Not stated | Not stated | Low central venous pressure | Not stated | |
| Anti‐thrombin III concentrate | Control | Anti‐thrombin concentrate: 1500 IU IV over 30 min: immediately before the operation, just before hepatic division, and immediately after operation | Pharmacological methods | Not stated | Not stated | Not stated | Factor being randomised | Not stated | Not stated | |
| Aprotinin | Control | Aprotinin: | Pharmacological methods | Intermittent portal triad clamping | Kelly clamp | Fibrin glue used | Factor being randomised | None | Not stated | |
| Desmopressin | Control | Desmopressin: 30 mcg/kg shortly after induction | Pharmacological methods | Varied | Cavitron ultrasonic surgical aspirator | Not stated | Factor being randomised | Not stated | Not stated | |
| Recombinant factor VIIa | Control | Recombinant factor VIIa: | Pharmacological methods | Mixture of methods | Not stated | No fibrin glue used | Factor being randomised | Not stated | No | |
| Recombinant factor VIIa | Control | Recombinant factor VIIa: brand not stated | Pharmacological methods | Not stated | Not stated | Not stated | Factor being randomised | Not stated | Not stated | |
| Tranexamic acid | Control | Tranexamic acid: 500 mg just before the surgery followed by 250 mg 4x/day for 3 days | Pharmacological methods | Varied | Clamp‐crush method | Not stated | Factor being randomised | Not stated | Not stated | |
| Collagen | Fibrin sealant | Collagen: Instat (Johnson & Johnson) | Raw surface | Not stated | Not stated | Factor being randomised | Not stated | Not stated | Not stated | |
| Collagen | Fibrin sealant | Collagen: Instat (Ethicon) | Raw surface | Not stated | Not stated | Factor being randomised | Not stated | Not stated | Not stated | |
| Collagen | Fibrin sealant | Collagen: Avitene (Alcon Inc). | Raw surface | Not stated | Not stated | Factor being randomised | Not stated | Not stated | Not stated | |
| Collagen | Fibrin sealant | Collagen: Sangustop fleece (Aesculap AG). | Raw surface | Not stated | A number of parenchymal transection techniques | Factor being randomised | None | Not stated | Not stated | |
| Fibrin sealant | Argon beam coagulator | Fibrin sealant: Tacchosil (Nycomed) | Raw surface | A mixture of approaches | A mixture of approaches | Factor being randomised | Not stated | Not stated | Not stated | |
| Fibrin sealant | Argon beam coagulator | Fibrin sealant: Tacchosil | Raw surface | Not stated | A mixture of approaches | Factor being randomised | Not stated | Not stated | Not stated | |
| Fibrin sealant | Control | Fibrin sealant: TISSEEL (Baxter Health Corporation) Spray; 5 mL of fibrinogen with synthetic aprotinin and 5 mL of thrombin (500 IU/mL) | Raw surface | Intermittent portal triad clamping | Different types of liver resection | Factor being randomised | Not stated | Not stated | Not stated | |
| Fibrin sealant | Control | Fibrin sealant: Quixil (Johnson & Johnson Medical) spray; 5 mL of fibrinogen and tranexamic acid and 5 mL of thrombin | Raw surface | With and without inflow occlusion | Clamp‐crush, cavitron ultrasonic surgical aspirator, electric coagulation based, combined | Factor being randomised | Not stated | Not stated | Not stated | |
| Fibrin sealant | Control | Fibrin sealant: name not available | Raw surface | Not stated | Not stated | Factor being randomised | Not stated | Not stated | Not stated | |
| Fibrin sealant | Control | Fibrin sealant: Biocol | Raw surface | Varied | Clamp‐crush method or cavitron ultrasonic surgical aspirator | Factor being randomised | Not stated | Not stated | Not stated | |
| Fibrin sealant | Gelatin | Fibrin sealant: Fibrocaps (ProFibrix) | Raw surface | Not stated | Not stated | Factor being randomised | Not stated | Not stated | Not stated | |
| Fibrin sealant | Oxidised cellulose | Fibrin sealant: Tacchosil | Raw surface | Not stated | Not stated | Factor being randomised | Not stated | Not stated | Not stated | |
| Fibrin sealant | Oxidised cellulose | Fibrin sealant: Fibrin Pad | Raw surface | Not stated | Not stated | Factor being randomised | Not stated | Not stated | Not stated | |
| Fibrin sealant | Oxidised cellulose | Fibrin sealant: Tachosil (Nycomed) | Raw surface | Varied | Not stated | Factor being randomised | Not stated | Not stated | Not stated | |
| Fibrin sealant | Oxidised cellulose | Oxidised cellulose: Surgicel (Ethicon Inc) | Raw surface | Not stated | Clamp‐crush method | Factor being randomised | Not stated | Not stated | Not stated | |
| Fibrin sealant | PlasmaJet coagulator | Fibrin sealant: fibrin glue (no further details) | Raw surface | Not stated | Cavitron ultrasonic surgical aspirator | Factor being randomised | Not stated | Not stated | Not stated | |
| Fibrin sealant plus collagen | Control | Fibrin sealant spray: Tissucol | Raw surface | Intermittent portal triad or selective clamping | Cavitron ultrasonic surgical aspirator | Factor being randomised | Not stated | Not stated | Not stated | |
| Continuous portal triad clamping | Continuous hepatic vascular exclusion | Hepatic vascular exclusion by encircling the entire retrohepatic inferior vena cava | Vascular occlusion | Factor being randomised | Clamp‐crush or cavitron ultrasonic surgical aspirator | Fibrin glue used | Not stated | Not stated | Not stated | |
| Continuous portal triad clamping | Continuous hepatic vascular exclusion | Hepatic vascular exclusion by encircling the entire infrahepatic inferior vena cava | Vascular occlusion | Factor being randomised | Clamp‐crush method | Not stated | Not stated | Not stated | Not stated | |
| Continuous portal triad clamping | Continuous selective hepatic vascular exclusion | — | Vascular occlusion | Factor being randomised | Not stated | Not stated | Not stated | Low central venous pressure | Not stated | |
| Continuous portal triad clamping | Continuous selective portal triad clamping | — | Vascular occlusion | Factor being randomised | Clamp‐crush method | Not stated | Not stated | Low central venous pressure | Not stated | |
| Continuous portal triad clamping | Control | — | Vascular occlusion | Factor being randomised | Not stated | Not stated | Not stated | Not stated | Not stated | |
| Continuous portal triad clamping | Control | Note: After every 1 hour of continuous portal triad clamping (or 30 minutes for cirrhotic patients), the clamp was released for 10 minutes before reclamping | Vascular occlusion | Factor being randomised | Not stated | Not stated | Not stated | Not stated | Not stated | |
| Continuous portal triad clamping | Control | — | Vascular occlusion | Factor being randomised | Not stated | Not stated | Not stated | Not stated | Not stated | |
| Continuous portal triad clamping | Control | — | Vascular occlusion | Factor being randomised | Not stated | Not stated | Not stated | Not stated | Not stated | |
| Continuous portal triad clamping | Intermittent portal triad clamping | Continuous portal triad clamping: until end of transection | Vascular occlusion | Factor being randomised | Cavitron ultrasonic surgical aspirator | Not stated | Not stated | Low central venous pressure | Not stated | |
| Continuous portal triad clamping | Intermittent portal triad clamping | Intermittent portal triad clamping: 15 minutes on and 5 minutes off | Vascular occlusion | Factor being randomised | Clamp‐crush | Fibrin glue used | Not stated | Not stated | Not stated | |
| Continuous selective portal triad clamping | Intermittent portal triad clamping | Intermittent portal triad clamping: 20 minutes on and 5 minutes off | Vascular occlusion | Factor being randomised | Clamp crush | Not stated | None | Not stated | Not stated | |
| Intermittent portal triad clamping | Control | Intermittent portal triad clamping: 15 minutes on and 5 minutes off | Vascular occlusion | Factor being randomised | Clamp‐crush or bipolar dissecting sealer | Not stated | Not stated | Low central venous pressure | Not stated | |
| Intermittent portal triad clamping | Control | Intermittent portal triad clamping: 15 minutes on and 5 minutes off | Vascular occlusion | Factor being randomised | Cavitron ultrasonic surgical aspirator | Fibrin glue used | Not stated | Low central venous pressure | Not stated | |
| Intermittent portal triad clamping | Control | Intermittent portal triad clamping: 20 minutes on and 5 minutes off | Vascular occlusion | Factor being randomised | Cavitron ultrasonic surgical aspirator | Not stated | Not stated | Not stated | Not stated | |
| Intermittent portal triad clamping | Control | Intermittent portal triad clamping: 20 minutes on and 5 minutes off (until resection is completed or a maximum of 6 cycles) | Vascular occlusion | Factor being randomised | Not stated | Not stated | Not stated | Not stated | Not stated | |
| Intermittent portal triad clamping | Control | Intermittent portal triad clamping: 15 minutes on and 5 minutes off | Vascular occlusion | Factor being randomised | Not stated | Not stated | Not stated | Not stated | Not stated | |
| Intermittent portal triad clamping | Intermittent selective portal triad clamping | Intermittent clamping: 15 minutes on and 5 minutes off | Vascular occlusion | Factor being randomised | Not stated | Not stated | Not stated | Not stated | Not stated | |
| Intermittent portal triad clamping | Intermittent selective portal triad clamping | Intermittent portal triad clamping: 15 minutes on and 5 minutes off | Vascular occlusion | Factor being randomised | Clamp‐crush method | Not stated | Not stated | Not stated | Not stated | |
| Study | Intervention | Control | Sequence generation | Allocation concealment | Blinding of participants and healthcare providers | Blinding of outcome assessors | Missing outcome bias | Selective reporting bias | Source of funding bias | Other bias | Overall risk of bias |
| Anterior approach | Control | Low | Unclear | Unclear | Unclear | High | Low | Low | Low | Unclear or high | |
| Anterior approach | Control | Unclear | Unclear | High | High | High | High | Low | Low | Unclear or high | |
| Autologous blood donation | Control | Unclear | Unclear | Unclear | Unclear | Unclear | High | Unclear | Low | Unclear or high | |
| Autologous blood donation | Control | Unclear | Unclear | Unclear | Unclear | High | High | Unclear | Low | Unclear or high | |
| Acute normovolemic haemodilution plus low central venous pressure | Control | Unclear | Unclear | Unclear | Unclear | Unclear | High | Low | Low | Unclear or high | |
| Acute normovolemic haemodilution plus low central venous pressure | Low central venous pressure | Unclear | Unclear | Unclear | Unclear | High | Low | Unclear | Low | Unclear or high | |
| Acute normovolemic haemodilution plus low central venous pressure | Low central venous pressure | Low | Unclear | High | Unclear | Low | High | Low | Low | Unclear or high | |
| Acute normovolemic haemodilution | Acute normovolemic haemodilution with hypotension | Unclear | Unclear | Unclear | Unclear | Unclear | High | Unclear | Low | Unclear or high | |
| Hypoventilation | Control | Low | Low | Low | High | Low | High | Low | Low | Unclear or high | |
| Low central venous pressure | Control | Unclear | Unclear | Unclear | Unclear | Unclear | High | Unclear | Low | Unclear or high | |
| Low central venous pressure | Control | Unclear | Unclear | Unclear | Unclear | Unclear | High | Unclear | Low | Unclear or high | |
| Low central venous pressure | Control | Low | Low | Unclear | Unclear | Low | High | Unclear | Low | Unclear or high | |
| Low central venous pressure | Control | Unclear | Unclear | Unclear | Unclear | High | High | Unclear | Low | Unclear or high | |
| Low central venous pressure | Low central venous pressure + acute normovolemic haemodilution. | Unclear | Unclear | Unclear | Unclear | Unclear | High | Low | Low | Unclear or high | |
| Stapler | Clamp‐crush method | Low | Low | High | Low | Low | Low | High | Low | Unclear or high | |
| Cavitron ultrasonic surgical aspirator | Clamp‐crush method | Unclear | Unclear | Unclear | Unclear | Unclear | High | Unclear | Low | Unclear or high | |
| Cavitron ultrasonic surgical aspirator | Clamp‐crush method | Unclear | Unclear | Unclear | Unclear | Low | Low | Unclear | Low | Unclear or high | |
| Cavitron ultrasonic surgical aspirator | Clamp‐crush method. | Unclear | Unclear | Unclear | Unclear | Unclear | Low | Low | Low | Unclear or high | |
| Cavitron ultrasonic surgical aspirator | Hydrojet | Unclear | Unclear | Unclear | Unclear | Unclear | High | Unclear | Low | Unclear or high | |
| Cavitron ultrasonic surgical aspirator | Stapler | Low | Low | Unclear | Unclear | Low | Low | High | Low | Unclear or high | |
| Cavitron ultrasonic surgical aspirator | Radiofrequency dissecting sealer. | Unclear | Unclear | Unclear | Unclear | Low | Low | High | Low | Unclear or high | |
| Radiofrequency dissecting sealer | Clamp‐crush method | Low | Unclear | High | High | Low | Low | Low | Low | Unclear or high | |
| Radiofrequency dissecting sealer | Clamp‐crush method | Low | Unclear | Unclear | Unclear | Low | High | Low | Low | Unclear or high | |
| Radiofrequency dissecting sealer | Clamp‐crush method | Low | Low | Unclear | High | Low | Low | Low | Low | Unclear or high | |
| Radio‐frequency dissecting sealer | Clamp‐crush method | Low | Low | High | High | Low | Low | Low | Low | Unclear or high | |
| Sharp transection | Clamp‐crush method | Unclear | Unclear | Unclear | Unclear | Low | High | Unclear | Low | Unclear or high | |
| Anti‐thrombin III concentrate | Control | Unclear | Unclear | Unclear | Unclear | Unclear | High | Unclear | Low | Unclear or high | |
| Aprotinin | Control | Low | Unclear | Unclear | Low | High | High | High | Low | Unclear or high | |
| Desmopressin | Control | Unclear | Unclear | Low | Low | High | High | Low | Low | Unclear or high | |
| Recombinant factor VIIa | Control | Low | Low | Low | Low | High | Low | High | Low | Unclear or high | |
| Recombinant factor VIIa | Control | Unclear | Unclear | Unclear | Unclear | High | High | High | Low | Unclear or high | |
| Tranexamic acid | Control | Unclear | Unclear | Low | Low | Low | High | Unclear | Low | Unclear or high | |
| Collagen | Fibrin sealant | Low | Unclear | Unclear | Unclear | High | High | High | Low | Unclear or high | |
| Collagen | Fibrin sealant | Unclear | Unclear | Unclear | Unclear | Unclear | High | Unclear | Low | Unclear or high | |
| Collagen | Fibrin sealant | Unclear | Unclear | Unclear | Unclear | Low | Low | Unclear | Low | Unclear or high | |
| Collagen | Fibrin sealant | Low | Low | High | High | High | Low | High | Low | Unclear or high | |
| Fibrin sealant | Argon beam coagulator | Unclear | Low | High | High | High | Low | High | Low | Unclear or high | |
| Fibrin sealant | Argon beam coagulator | Unclear | Unclear | High | High | Low | Low | Unclear | Low | Unclear or high | |
| Fibrin sealant | Control | Low | Low | High | High | Low | Low | High | Low | Unclear or high | |
| Fibrin sealant | Control | Low | Low | High | High | Low | Low | High | Low | Unclear or high | |
| Fibrin sealant | Control | Unclear | Unclear | Unclear | Unclear | Low | High | Unclear | Low | Unclear or high | |
| Fibrin sealant | Control | Unclear | Unclear | Unclear | Unclear | High | High | Unclear | Low | Unclear or high | |
| Fibrin sealant | Gelatin | Unclear | Unclear | Unclear | Unclear | Unclear | High | Unclear | Low | Unclear or high | |
| Fibrin sealant | Oxidised cellulose | Unclear | Unclear | Unclear | Unclear | Unclear | High | Unclear | Low | Unclear or high | |
| Fibrin sealant | Oxidised cellulose | Low | Low | High | High | High | High | High | Low | Unclear or high | |
| Fibrin sealant | Oxidised cellulose | Unclear | Unclear | High | High | Low | Low | High | Low | Unclear or high | |
| Fibrin sealant | Oxidised cellulose | Low | Unclear | High | Unclear | Unclear | High | Low | Low | Unclear or high | |
| Fibrin sealant | PlasmaJet coagulator | Unclear | Unclear | Unclear | Unclear | Low | High | Unclear | Low | Unclear or high | |
| Fibrin sealant plus collagen | Control | Low | Low | Unclear | Unclear | Low | Low | Low | Low | Unclear or high | |
| Continuous portal triad clamping | Continuous hepatic vascular exclusion | Unclear | Unclear | Unclear | Unclear | High | High | Unclear | Low | Unclear or high | |
| Continuous portal triad clamping | Continuous hepatic vascular exclusion | Unclear | Unclear | Unclear | Unclear | Unclear | Low | Low | Low | Unclear or high | |
| Continuous portal triad clamping | Continuous selective hepatic vascular exclusion | Unclear | Low | Unclear | Unclear | Low | High | Unclear | Low | Unclear or high | |
| Continuous portal triad clamping | Continuous selective portal triad clamping | Unclear | Low | Unclear | Unclear | Low | Low | Low | Low | Unclear or high | |
| Continuous portal triad clamping | Control | Unclear | Unclear | High | Unclear | High | High | Unclear | Low | Unclear or high | |
| Continuous portal triad clamping | Control | Unclear | Unclear | Unclear | Unclear | High | High | Low | Low | Unclear or high | |
| Continuous portal triad clamping | Control | Low | Low | High | Low | Low | High | Low | Low | Unclear or high | |
| Continuous portal triad clamping | Control | Unclear | Unclear | Unclear | Unclear | Unclear | High | Unclear | Low | Unclear or high | |
| Continuous portal triad clamping | Intermittent portal triad clamping | Unclear | Unclear | Unclear | Unclear | Low | High | Unclear | Low | Unclear or high | |
| Continuous portal triad clamping | Intermittent portal triad clamping | Low | Unclear | Unclear | Unclear | Low | Low | Unclear | Low | Unclear or high | |
| Continuous selective portal triad clamping | Intermittent portal triad clamping | Unclear | Unclear | Unclear | Unclear | Low | Low | Low | Low | Unclear or high | |
| Intermittent portal triad clamping | Control | Low | Unclear | Unclear | Unclear | Low | High | Unclear | Low | Unclear or high | |
| Intermittent portal triad clamping | Control | Low | Low | High | High | Low | Low | Low | Low | Unclear or high | |
| Intermittent portal triad clamping | Control | Unclear | Unclear | Unclear | Unclear | Low | High | Low | Low | Unclear or high | |
| Intermittent portal triad clamping | Control | Unclear | Unclear | Unclear | Unclear | Low | High | Unclear | Low | Unclear or high | |
| Intermittent portal triad clamping | Control | Low | Low | Unclear | Unclear | High | High | Low | Low | Unclear or high | |
| Intermittent portal triad clamping | Intermittent selective portal triad clamping | Unclear | Unclear | Unclear | Unclear | Low | High | Low | Low | Unclear or high | |
| Intermittent portal triad clamping | Intermittent selective portal triad clamping | Unclear | Unclear | Unclear | Unclear | Low | Low | Low | Low | Unclear or high |
| Outcome or subgroup title | No. of studies | No. of participants | Statistical method | Effect size |
| 1 Mortality (perioperative) Show forest plot | 2 | Odds Ratio (M‐H, Fixed, 95% CI) | Subtotals only | |
| 1.1 Anterior approach vs conventional approach | 2 | 185 | Odds Ratio (M‐H, Fixed, 95% CI) | 0.27 [0.05, 1.32] |
| 2 Serious adverse events (proportion) Show forest plot | 1 | Odds Ratio (M‐H, Fixed, 95% CI) | Totals not selected | |
| 2.1 Anterior approach vs conventional approach | 1 | Odds Ratio (M‐H, Fixed, 95% CI) | 0.0 [0.0, 0.0] | |
| 3 Adverse events (proportion) Show forest plot | 2 | Odds Ratio (M‐H, Fixed, 95% CI) | Subtotals only | |
| 3.1 Anterior approach vs conventional approach | 2 | 185 | Odds Ratio (M‐H, Fixed, 95% CI) | 0.89 [0.48, 1.64] |
| 4 Adverse events (number) Show forest plot | 1 | Rate Ratio (Fixed, 95% CI) | Totals not selected | |
| 4.1 Anterior approach vs conventional approach | 1 | Rate Ratio (Fixed, 95% CI) | 0.0 [0.0, 0.0] | |
| 5 Blood transfusion (proportion) Show forest plot | 2 | Odds Ratio (M‐H, Random, 95% CI) | Subtotals only | |
| 5.1 Anterior approach vs conventional approach | 2 | 185 | Odds Ratio (M‐H, Random, 95% CI) | 0.60 [0.05, 6.74] |
| 6 Major blood loss (proportion) Show forest plot | 2 | Odds Ratio (M‐H, Random, 95% CI) | Subtotals only | |
| 6.1 Anterior approach vs conventional approach | 2 | 185 | Odds Ratio (M‐H, Random, 95% CI) | 0.56 [0.09, 3.41] |
| Outcome or subgroup title | No. of studies | No. of participants | Statistical method | Effect size |
| 1 Adverse events (proportion) Show forest plot | 1 | Odds Ratio (M‐H, Fixed, 95% CI) | Totals not selected | |
| 1.1 Autologous blood donation vs control | 1 | Odds Ratio (M‐H, Fixed, 95% CI) | 0.0 [0.0, 0.0] | |
| 2 Blood transfusion (proportion) Show forest plot | 1 | Odds Ratio (M‐H, Fixed, 95% CI) | Totals not selected | |
| 2.1 Autologous blood donation vs control | 1 | Odds Ratio (M‐H, Fixed, 95% CI) | 0.0 [0.0, 0.0] | |
| 3 Blood transfusion (red blood cell) Show forest plot | 1 | Mean Difference (IV, Fixed, 95% CI) | Totals not selected | |
| 3.1 Autologous blood donation vs control | 1 | Mean Difference (IV, Fixed, 95% CI) | 0.0 [0.0, 0.0] | |
| 4 Blood loss Show forest plot | 2 | Mean Difference (IV, Fixed, 95% CI) | Subtotals only | |
| 4.1 Autologous blood donation vs control | 2 | 70 | Mean Difference (IV, Fixed, 95% CI) | ‐0.02 [‐0.37, 0.34] |
| 5 Major blood loss (proportion) Show forest plot | 1 | Odds Ratio (M‐H, Fixed, 95% CI) | Totals not selected | |
| 5.1 Autologous blood donation vs control | 1 | Odds Ratio (M‐H, Fixed, 95% CI) | 0.0 [0.0, 0.0] | |
| 6 Total hospital stay Show forest plot | 1 | Mean Difference (IV, Fixed, 95% CI) | Totals not selected | |
| 6.1 Autologous blood donation vs control | 1 | Mean Difference (IV, Fixed, 95% CI) | 0.0 [0.0, 0.0] | |
| 7 Operating time Show forest plot | 2 | Mean Difference (IV, Fixed, 95% CI) | Subtotals only | |
| 7.1 Autologous blood donation vs control | 2 | 70 | Mean Difference (IV, Fixed, 95% CI) | ‐3.79 [‐34.28, 26.70] |
| Outcome or subgroup title | No. of studies | No. of participants | Statistical method | Effect size |
| 1 Mortality (perioperative) Show forest plot | 4 | Odds Ratio (M‐H, Fixed, 95% CI) | Subtotals only | |
| 1.1 Hypoventilation vs control | 1 | 79 | Odds Ratio (M‐H, Fixed, 95% CI) | 0.0 [0.0, 0.0] |
| 1.2 Low central venous pressure vs control | 1 | 85 | Odds Ratio (M‐H, Fixed, 95% CI) | 0.0 [0.0, 0.0] |
| 1.3 Low central venous pressure vs acute normovolemic haemodilution plus low central venous pressure | 2 | 208 | Odds Ratio (M‐H, Fixed, 95% CI) | 2.91 [0.29, 28.70] |
| 2 Serious adverse events (proportion) Show forest plot | 2 | Odds Ratio (M‐H, Fixed, 95% CI) | Totals not selected | |
| 2.1 Hypoventilation vs control | 1 | Odds Ratio (M‐H, Fixed, 95% CI) | 0.0 [0.0, 0.0] | |
| 2.2 Low central venous pressure vs acute normovolemic haemodilution plus low central venous pressure | 1 | Odds Ratio (M‐H, Fixed, 95% CI) | 0.0 [0.0, 0.0] | |
| 3 Serious adverse events (number) Show forest plot | 2 | Rate Ratio (Fixed, 95% CI) | Totals not selected | |
| 3.1 Low central venous pressure vs control | 1 | Rate Ratio (Fixed, 95% CI) | 0.0 [0.0, 0.0] | |
| 3.2 Low central venous pressure vs acute normovolemic haemodilution plus low central venous pressure | 1 | Rate Ratio (Fixed, 95% CI) | 0.0 [0.0, 0.0] | |
| 4 Adverse events (proportion) Show forest plot | 4 | Odds Ratio (M‐H, Fixed, 95% CI) | Subtotals only | |
| 4.1 Hypoventilation vs control | 1 | 79 | Odds Ratio (M‐H, Fixed, 95% CI) | 1.33 [0.53, 3.34] |
| 4.2 Low central venous pressure vs control | 1 | 50 | Odds Ratio (M‐H, Fixed, 95% CI) | 0.79 [0.21, 3.03] |
| 4.3 Low central venous pressure vs acute normovolemic haemodilution plus low central venous pressure | 2 | 208 | Odds Ratio (M‐H, Fixed, 95% CI) | 0.68 [0.37, 1.23] |
| 5 Adverse events (number) Show forest plot | 2 | Rate Ratio (Fixed, 95% CI) | Totals not selected | |
| 5.1 Low central venous pressure vs control | 1 | Rate Ratio (Fixed, 95% CI) | 0.0 [0.0, 0.0] | |
| 5.2 Low central venous pressure vs acute normovolemic haemodilution plus low central venous pressure | 1 | Rate Ratio (Fixed, 95% CI) | 0.0 [0.0, 0.0] | |
| 6 Blood transfusion (proportion) Show forest plot | 6 | Odds Ratio (M‐H, Fixed, 95% CI) | Subtotals only | |
| 6.1 Hypoventilation vs control | 1 | 79 | Odds Ratio (M‐H, Fixed, 95% CI) | 0.71 [0.15, 3.40] |
| 6.2 Low central venous pressure vs control | 3 | 175 | Odds Ratio (M‐H, Fixed, 95% CI) | 0.49 [0.21, 1.13] |
| 6.3 Low central venous pressure vs acute normovolemic haemodilution plus low central venous pressure | 2 | 208 | Odds Ratio (M‐H, Fixed, 95% CI) | 3.09 [1.49, 6.42] |
| 7 Blood transfusion (red blood cell) Show forest plot | 6 | Mean Difference (IV, Fixed, 95% CI) | Subtotals only | |
| 7.1 Acute normovolemic haemodilution vs control | 1 | 20 | Mean Difference (IV, Fixed, 95% CI) | ‐1.25 [‐1.74, ‐0.75] |
| 7.2 Acute normovolemic haemodilution plus hypotension vs control | 1 | 20 | Mean Difference (IV, Fixed, 95% CI) | ‐1.66 [‐2.05, ‐1.28] |
| 7.3 Acute normovolemic haemodilution plus low central venous pressure vs control | 1 | 30 | Mean Difference (IV, Fixed, 95% CI) | 0.27 [0.02, 0.51] |
| 7.4 Low central venous pressure vs control | 2 | 90 | Mean Difference (IV, Fixed, 95% CI) | ‐1.60 [‐2.26, ‐0.93] |
| 7.5 Acute normovolemic haemodilution plus hypotension vs acute normovolemic haemodilution | 1 | 20 | Mean Difference (IV, Fixed, 95% CI) | ‐0.42 [‐0.74, ‐0.10] |
| 7.6 Low central venous pressure vs acute normovolemic haemodilution plus low central venous pressure | 2 | 208 | Mean Difference (IV, Fixed, 95% CI) | 0.16 [‐0.63, 0.95] |
| 8 Blood transfusion (fresh frozen plasma) Show forest plot | 2 | Mean Difference (IV, Fixed, 95% CI) | Totals not selected | |
| 8.1 Low central venous pressure vs control | 1 | Mean Difference (IV, Fixed, 95% CI) | 0.0 [0.0, 0.0] | |
| 8.2 Low central venous pressure vs acute normovolemic haemodilution plus low central venous pressure | 1 | Mean Difference (IV, Fixed, 95% CI) | 0.0 [0.0, 0.0] | |
| 9 Blood transfusion (cryoprecipitate) Show forest plot | 1 | Mean Difference (IV, Fixed, 95% CI) | Totals not selected | |
| 9.1 Hypoventilation vs control | 1 | Mean Difference (IV, Fixed, 95% CI) | 0.0 [0.0, 0.0] | |
| 10 Blood loss Show forest plot | 9 | Mean Difference (IV, Fixed, 95% CI) | Subtotals only | |
| 10.1 Acute normovolemic haemodilution vs control | 1 | 20 | Mean Difference (IV, Fixed, 95% CI) | 0.00 [‐0.10, 0.11] |
| 10.2 Acute normovolemic haemodilution plus hypotension vs control | 1 | 20 | Mean Difference (IV, Fixed, 95% CI) | ‐0.25 [‐0.36, ‐0.14] |
| 10.3 Acute normovolemic haemodilution plus low central venous pressure vs control | 1 | 30 | Mean Difference (IV, Fixed, 95% CI) | 0.02 [‐0.03, 0.08] |
| 10.4 Hypoventilation vs control | 1 | 79 | Mean Difference (IV, Fixed, 95% CI) | 0.0 [‐1.12, 1.12] |
| 10.5 Low central venous pressure vs control | 4 | 237 | Mean Difference (IV, Fixed, 95% CI) | ‐0.34 [‐0.47, ‐0.22] |
| 10.6 Acute normovolemic haemodilution plus hypotension vs acute normovolemic haemodilution | 1 | 20 | Mean Difference (IV, Fixed, 95% CI) | ‐0.25 [‐0.39, ‐0.11] |
| 10.7 Low central venous pressure vs acute normovolemic haemodilution plus low central venous pressure | 2 | 208 | Mean Difference (IV, Fixed, 95% CI) | ‐0.09 [‐0.32, 0.15] |
| 11 Major blood loss (proportion) Show forest plot | 1 | Odds Ratio (M‐H, Fixed, 95% CI) | Totals not selected | |
| 11.1 Low central venous pressure vs acute normovolemic haemodilution plus low central venous pressure | 1 | Odds Ratio (M‐H, Fixed, 95% CI) | 0.0 [0.0, 0.0] | |
| 12 Hospital stay Show forest plot | 5 | Mean Difference (IV, Fixed, 95% CI) | Subtotals only | |
| 12.1 Hypoventilation vs control | 1 | 79 | Mean Difference (IV, Fixed, 95% CI) | 0.0 [‐3.79, 3.79] |
| 12.2 Low central venous pressure vs control | 3 | 197 | Mean Difference (IV, Fixed, 95% CI) | ‐2.43 [‐3.93, ‐0.94] |
| 12.3 Low central venous pressure vs acute normovolemic haemodilution plus low central venous pressure | 1 | 130 | Mean Difference (IV, Fixed, 95% CI) | 0.0 [‐2.96, 2.96] |
| 13 Operating time Show forest plot | 7 | Mean Difference (IV, Fixed, 95% CI) | Subtotals only | |
| 13.1 Acute normovolemic haemodilution plus low central venous pressure vs control | 1 | 40 | Mean Difference (IV, Fixed, 95% CI) | ‐17.0 [‐42.78, 8.78] |
| 13.2 Hypoventilation vs control | 1 | 79 | Mean Difference (IV, Fixed, 95% CI) | 0.0 [‐88.21, 88.21] |
| 13.3 Low central venous pressure vs control | 4 | 192 | Mean Difference (IV, Fixed, 95% CI) | ‐17.41 [‐31.14, ‐3.67] |
| 13.4 Low central venous pressure vs acute normovolemic haemodilution plus low central venous pressure | 3 | 248 | Mean Difference (IV, Fixed, 95% CI) | 13.63 [‐4.11, 31.38] |
| Outcome or subgroup title | No. of studies | No. of participants | Statistical method | Effect size |
| 1 Mortality (perioperative) Show forest plot | 11 | Odds Ratio (M‐H, Fixed, 95% CI) | Subtotals only | |
| 1.1 Cavitron ultrasonic surgical aspirator vs clamp‐crush method | 2 | 172 | Odds Ratio (M‐H, Fixed, 95% CI) | 0.18 [0.01, 4.01] |
| 1.2 Radiofrequency dissecting sealer vs clamp‐crush method | 5 | 390 | Odds Ratio (M‐H, Fixed, 95% CI) | 1.85 [0.38, 8.97] |
| 1.3 Sharp transection method vs clamp‐crush method | 1 | 82 | Odds Ratio (M‐H, Fixed, 95% CI) | 0.0 [0.0, 0.0] |
| 1.4 Stapler vs clamp‐crush method | 1 | 130 | Odds Ratio (M‐H, Fixed, 95% CI) | 2.07 [0.36, 11.69] |
| 1.5 Hydrojet vs cavitron ultrasonic surgical aspirator | 2 | 111 | Odds Ratio (M‐H, Fixed, 95% CI) | 0.99 [0.19, 5.17] |
| 1.6 Radiofrequency dissecting sealer vs cavitron ultrasonic surgical aspirator | 2 | 90 | Odds Ratio (M‐H, Fixed, 95% CI) | 0.66 [0.11, 4.05] |
| 1.7 Stapler vs cavitron ultrasonic surgical aspirator | 1 | 100 | Odds Ratio (M‐H, Fixed, 95% CI) | 0.0 [0.0, 0.0] |
| 1.8 Radiofrequency dissecting sealer vs hydrojet | 1 | 50 | Odds Ratio (M‐H, Fixed, 95% CI) | 0.18 [0.01, 4.04] |
| 2 Serious adverse events (proportion) Show forest plot | 7 | Odds Ratio (M‐H, Fixed, 95% CI) | Subtotals only | |
| 2.1 Cavitron ultrasonic surgical aspirator vs clamp‐crush method | 2 | 172 | Odds Ratio (M‐H, Fixed, 95% CI) | 0.35 [0.09, 1.35] |
| 2.2 Radiofrequency dissecting sealer vs clamp‐crush method | 3 | 240 | Odds Ratio (M‐H, Fixed, 95% CI) | 0.85 [0.27, 2.63] |
| 2.3 Sharp transection method vs clamp‐crush method | 1 | 82 | Odds Ratio (M‐H, Fixed, 95% CI) | 2.11 [0.36, 12.20] |
| 2.4 Stapler vs clamp‐crush method | 1 | 130 | Odds Ratio (M‐H, Fixed, 95% CI) | 1.26 [0.58, 2.75] |
| 2.5 Hydrojet vs cavitron ultrasonic surgical aspirator | 1 | 61 | Odds Ratio (M‐H, Fixed, 95% CI) | 0.62 [0.10, 4.00] |
| 2.6 Radiofrequency dissecting sealer vs cavitron ultrasonic surgical aspirator | 1 | 40 | Odds Ratio (M‐H, Fixed, 95% CI) | 1.0 [0.06, 17.18] |
| 3 Serious adverse events (number) Show forest plot | 5 | Rate Ratio (Fixed, 95% CI) | Subtotals only | |
| 3.1 Cavitron ultrasonic surgical aspirator vs clamp‐crush method | 1 | 132 | Rate Ratio (Fixed, 95% CI) | 0.67 [0.11, 3.99] |
| 3.2 Radiofrequency dissecting sealer vs clamp‐crush method | 2 | 130 | Rate Ratio (Fixed, 95% CI) | 3.34 [1.08, 10.31] |
| 3.3 Hydrojet vs cavitron ultrasonic surgical aspirator | 1 | 50 | Rate Ratio (Fixed, 95% CI) | 1.50 [0.25, 8.98] |
| 3.4 Radiofrequency dissecting sealer vs cavitron ultrasonic surgical aspirator | 1 | 50 | Rate Ratio (Fixed, 95% CI) | 1.50 [0.25, 8.98] |
| 3.5 Stapler vs cavitron ultrasonic surgical aspirator | 1 | 100 | Rate Ratio (Fixed, 95% CI) | 1.33 [0.56, 3.16] |
| 3.6 Radiofrequency dissecting sealer vs hydrojet | 1 | 50 | Rate Ratio (Fixed, 95% CI) | 1.0 [0.20, 4.95] |
| 4 Adverse events (proportion) Show forest plot | 8 | Odds Ratio (M‐H, Fixed, 95% CI) | Subtotals only | |
| 4.1 Cavitron ultrasonic surgical aspirator vs clamp‐crush method | 3 | 222 | Odds Ratio (M‐H, Fixed, 95% CI) | 1.30 [0.73, 2.34] |
| 4.2 Radiofrequency dissecting sealer vs clamp‐crush method | 3 | 220 | Odds Ratio (M‐H, Fixed, 95% CI) | 0.92 [0.51, 1.64] |
| 4.3 Sharp transection method vs clamp‐crush method | 1 | 82 | Odds Ratio (M‐H, Fixed, 95% CI) | 1.11 [0.46, 2.68] |
| 4.4 Stapler vs clamp‐crush method | 1 | 130 | Odds Ratio (M‐H, Fixed, 95% CI) | 1.06 [0.53, 2.12] |
| 4.5 Hydrojet vs cavitron ultrasonic surgical aspirator | 1 | 61 | Odds Ratio (M‐H, Fixed, 95% CI) | 0.29 [0.07, 1.24] |
| 4.6 Radiofrequency dissecting sealer vs cavitron ultrasonic surgical aspirator | 1 | 40 | Odds Ratio (M‐H, Fixed, 95% CI) | 1.86 [0.52, 6.61] |
| 5 Adverse events (number) Show forest plot | 7 | Rate Ratio (Fixed, 95% CI) | Subtotals only | |
| 5.1 Cavitron ultrasonic surgical aspirator vs clamp‐crush method | 1 | 132 | Rate Ratio (Fixed, 95% CI) | 1.56 [0.83, 2.93] |
| 5.2 Radiofrequency dissecting sealer vs clamp‐crush method | 3 | 250 | Rate Ratio (Fixed, 95% CI) | 1.67 [0.95, 2.94] |
| 5.3 Sharp transection method vs clamp‐crush method | 1 | 82 | Rate Ratio (Fixed, 95% CI) | 1.12 [0.57, 2.21] |
| 5.4 Hydrojet vs cavitron ultrasonic surgical aspirator | 1 | 50 | Rate Ratio (Fixed, 95% CI) | 0.88 [0.32, 2.41] |
| 5.5 Radiofrequency dissecting sealer vs cavitron ultrasonic surgical aspirator | 1 | 50 | Rate Ratio (Fixed, 95% CI) | 1.12 [0.43, 2.92] |
| 5.6 Stapler vs cavitron ultrasonic surgical aspirator | 1 | 100 | Rate Ratio (Fixed, 95% CI) | 1.16 [0.63, 2.14] |
| 5.7 Radiofrequency dissecting sealer vs hydrojet | 1 | 50 | Rate Ratio (Fixed, 95% CI) | 1.29 [0.48, 3.45] |
| 6 Blood transfusion (proportion) Show forest plot | 8 | Odds Ratio (M‐H, Fixed, 95% CI) | Subtotals only | |
| 6.1 Cavitron ultrasonic surgical aspirator vs clamp‐crush method | 2 | 172 | Odds Ratio (M‐H, Fixed, 95% CI) | 1.37 [0.29, 6.59] |
| 6.2 Radiofrequency dissecting sealer vs clamp‐crush method | 5 | 390 | Odds Ratio (M‐H, Fixed, 95% CI) | 1.13 [0.63, 2.03] |
| 6.3 Sharp transection method vs clamp‐crush method | 1 | 82 | Odds Ratio (M‐H, Fixed, 95% CI) | 0.80 [0.32, 2.01] |
| 6.4 Hydrojet vs cavitron ultrasonic surgical aspirator | 1 | 50 | Odds Ratio (M‐H, Fixed, 95% CI) | 1.0 [0.30, 3.28] |
| 6.5 Radiofrequency dissecting sealer vs cavitron ultrasonic surgical aspirator | 2 | 90 | Odds Ratio (M‐H, Fixed, 95% CI) | 0.77 [0.29, 2.09] |
| 6.6 Radiofrequency dissecting sealer vs hydrojet | 1 | 50 | Odds Ratio (M‐H, Fixed, 95% CI) | 0.53 [0.15, 1.93] |
| 7 Blood transfusion (red blood cell) Show forest plot | 4 | Mean Difference (IV, Fixed, 95% CI) | Totals not selected | |
| 7.1 Sharp transection method vs clamp‐crush method | 1 | Mean Difference (IV, Fixed, 95% CI) | 0.0 [0.0, 0.0] | |
| 7.2 Stapler vs clamp‐crush method | 1 | Mean Difference (IV, Fixed, 95% CI) | 0.0 [0.0, 0.0] | |
| 7.3 Hydrojet vs cavitron ultrasonic surgical aspirator | 1 | Mean Difference (IV, Fixed, 95% CI) | 0.0 [0.0, 0.0] | |
| 7.4 Stapler vs cavitron ultrasonic surgical aspirator | 1 | Mean Difference (IV, Fixed, 95% CI) | 0.0 [0.0, 0.0] | |
| 8 Blood transfusion (fresh frozen plasma) Show forest plot | 1 | Mean Difference (IV, Fixed, 95% CI) | Totals not selected | |
| 8.1 Stapler vs clamp‐crush method | 1 | Mean Difference (IV, Fixed, 95% CI) | 0.0 [0.0, 0.0] | |
| 9 Blood loss Show forest plot | 2 | Mean Difference (IV, Fixed, 95% CI) | Totals not selected | |
| 9.1 Cavitron ultrasonic surgical aspirator vs clamp‐crush method | 1 | Mean Difference (IV, Fixed, 95% CI) | 0.0 [0.0, 0.0] | |
| 9.2 Hydrojet vs cavitron ultrasonic surgical aspirator | 1 | Mean Difference (IV, Fixed, 95% CI) | 0.0 [0.0, 0.0] | |
| 10 Operating time Show forest plot | 6 | Mean Difference (IV, Fixed, 95% CI) | Subtotals only | |
| 10.1 Cavitron ultrasonic surgical aspirator vs clamp‐crush method | 2 | 90 | Mean Difference (IV, Fixed, 95% CI) | 27.47 [‐2.87, 57.81] |
| 10.2 Radiofrequency dissecting sealer vs clamp‐crush method | 2 | 90 | Mean Difference (IV, Fixed, 95% CI) | 16.11 [‐11.45, 43.67] |
| 10.3 Sharp transection method vs clamp‐crush method | 1 | 82 | Mean Difference (IV, Fixed, 95% CI) | ‐6.0 [‐90.85, 78.85] |
| 10.4 Stapler vs clamp‐crush method | 1 | 130 | Mean Difference (IV, Fixed, 95% CI) | ‐31.0 [‐60.40, ‐1.60] |
| 10.5 Radiofrequency dissecting sealer vs cavitron ultrasonic surgical aspirator | 1 | 40 | Mean Difference (IV, Fixed, 95% CI) | 25.0 [‐96.48, 146.48] |
| 10.6 Stapler vs cavitron ultrasonic surgical aspirator | 1 | 100 | Mean Difference (IV, Fixed, 95% CI) | ‐26.0 [‐87.12, 35.12] |
| Outcome or subgroup title | No. of studies | No. of participants | Statistical method | Effect size |
| 1 Mortality (perioperative) Show forest plot | 10 | Odds Ratio (M‐H, Fixed, 95% CI) | Subtotals only | |
| 1.1 Fibrin sealant vs control | 2 | 380 | Odds Ratio (M‐H, Fixed, 95% CI) | 3.56 [0.73, 17.35] |
| 1.2 Fibrin sealant and collagen vs control | 1 | 300 | Odds Ratio (M‐H, Fixed, 95% CI) | 3.08 [0.61, 15.53] |
| 1.3 Fibrin sealant vs argon beam | 2 | 227 | Odds Ratio (M‐H, Fixed, 95% CI) | 1.37 [0.46, 4.03] |
| 1.4 Fibrin sealant vs collagen | 3 | 256 | Odds Ratio (M‐H, Fixed, 95% CI) | 0.90 [0.24, 3.32] |
| 1.5 Oxidised cellulose vs fibrin sealant | 1 | 50 | Odds Ratio (M‐H, Fixed, 95% CI) | 0.55 [0.03, 9.33] |
| 1.6 Plasmajet vs fibrin sealant | 1 | 58 | Odds Ratio (M‐H, Fixed, 95% CI) | 0.64 [0.10, 4.16] |
| 2 Serious adverse events (proportion) Show forest plot | 7 | Odds Ratio (M‐H, Fixed, 95% CI) | Subtotals only | |
| 2.1 Fibrin sealant vs control | 3 | 457 | Odds Ratio (M‐H, Fixed, 95% CI) | 1.03 [0.64, 1.65] |
| 2.2 Fibrin sealant vs argon beam | 1 | 106 | Odds Ratio (M‐H, Fixed, 95% CI) | 0.62 [0.25, 1.55] |
| 2.3 Fibrin sealant vs collagen | 1 | 127 | Odds Ratio (M‐H, Fixed, 95% CI) | 1.57 [0.73, 3.38] |
| 2.4 Oxidised cellulose vs fibrin sealant | 1 | 50 | Odds Ratio (M‐H, Fixed, 95% CI) | 0.57 [0.17, 1.87] |
| 2.5 Plasmajet vs fibrin sealant | 1 | 58 | Odds Ratio (M‐H, Fixed, 95% CI) | 0.14 [0.02, 1.22] |
| 3 Serious adverse events (number) Show forest plot | 6 | Rate Ratio (Fixed, 95% CI) | Subtotals only | |
| 3.1 Fibrin sealant vs control | 1 | 70 | Rate Ratio (Fixed, 95% CI) | 0.94 [0.48, 1.86] |
| 3.2 Fibrin sealant and collagen vs control | 1 | 300 | Rate Ratio (Fixed, 95% CI) | 1.32 [0.76, 2.29] |
| 3.3 Fibrin sealant vs argon beam | 1 | 121 | Rate Ratio (Fixed, 95% CI) | 4.47 [1.50, 13.27] |
| 3.4 Fibrin sealant vs collagen | 2 | 189 | Rate Ratio (Fixed, 95% CI) | 1.22 [0.76, 1.98] |
| 3.5 Fibrin sealant vs cyanoacrylate | 1 | 30 | Rate Ratio (Fixed, 95% CI) | 1.0 [0.06, 15.99] |
| 3.6 Oxidised cellulose vs cyanoacrylate | 1 | 30 | Rate Ratio (Fixed, 95% CI) | 4.00 [0.45, 35.79] |
| 3.7 Oxidised cellulose vs fibrin sealant | 1 | 30 | Rate Ratio (Fixed, 95% CI) | 4.00 [0.45, 35.79] |
| 4 Adverse events (proportion) Show forest plot | 9 | Odds Ratio (M‐H, Fixed, 95% CI) | Subtotals only | |
| 4.1 Fibrin sealant versus control | 3 | 457 | Odds Ratio (M‐H, Fixed, 95% CI) | 0.80 [0.55, 1.17] |
| 4.2 Fibrin sealant and collagen vs control | 1 | 300 | Odds Ratio (M‐H, Fixed, 95% CI) | 1.0 [0.59, 1.71] |
| 4.3 Fibrin sealant vs argon beam | 2 | 227 | Odds Ratio (M‐H, Fixed, 95% CI) | 0.97 [0.58, 1.64] |
| 4.4 Fibrin sealant vs collagen | 1 | 127 | Odds Ratio (M‐H, Fixed, 95% CI) | 0.95 [0.46, 1.93] |
| 4.5 Oxidised cellulose vs fibrin sealant | 2 | 274 | Odds Ratio (M‐H, Fixed, 95% CI) | 0.77 [0.30, 2.01] |
| 5 Adverse events (number) Show forest plot | 5 | Rate Ratio (Fixed, 95% CI) | Subtotals only | |
| 5.1 Fibrin sealant vs control | 1 | 70 | Rate Ratio (Fixed, 95% CI) | 1.01 [0.75, 1.36] |
| 5.2 Fibrin sealant vs argon beam | 1 | 121 | Rate Ratio (Fixed, 95% CI) | 1.12 [0.75, 1.66] |
| 5.3 Fibrin sealant vs collagen | 2 | 189 | Rate Ratio (Fixed, 95% CI) | 1.13 [0.90, 1.42] |
| 5.4 Fibrin sealant vs cyanoacrylate | 1 | 30 | Rate Ratio (Fixed, 95% CI) | 1.50 [0.25, 8.98] |
| 5.5 Oxidised cellulose vs cyanoacrylate | 1 | 30 | Rate Ratio (Fixed, 95% CI) | 3.50 [0.73, 16.85] |
| 5.6 Oxidised cellulose vs fibrin sealant | 1 | 30 | Rate Ratio (Fixed, 95% CI) | 2.33 [0.60, 9.02] |
| 6 Blood transfusion (proportion) Show forest plot | 4 | Odds Ratio (M‐H, Fixed, 95% CI) | Subtotals only | |
| 6.1 Fibrin sealant vs control | 2 | 392 | Odds Ratio (M‐H, Fixed, 95% CI) | 1.04 [0.61, 1.76] |
| 6.2 Fibrin sealant and collagen vs control | 1 | 300 | Odds Ratio (M‐H, Fixed, 95% CI) | 1.52 [0.88, 2.61] |
| 6.3 Fibrin sealant vs cyanoacrylate | 1 | 30 | Odds Ratio (M‐H, Fixed, 95% CI) | 3.25 [0.52, 20.37] |
| 6.4 Oxidised cellulose vs cyanoacrylate | 1 | 30 | Odds Ratio (M‐H, Fixed, 95% CI) | 2.36 [0.36, 15.45] |
| 6.5 Oxidised cellulose vs fibrin sealant | 1 | 30 | Odds Ratio (M‐H, Fixed, 95% CI) | 0.73 [0.15, 3.49] |
| 7 Blood transfusion (red blood cell) Show forest plot | 5 | Mean Difference (IV, Random, 95% CI) | Subtotals only | |
| 7.1 Fibrin sealant vs control | 2 | 122 | Mean Difference (IV, Random, 95% CI) | ‐0.53 [‐1.00, ‐0.06] |
| 7.2 Fibrin sealant and collagen vs control | 1 | 300 | Mean Difference (IV, Random, 95% CI) | ‐0.01 [‐0.16, 0.14] |
| 7.3 Fibrin sealant vs collagen | 0 | 0 | Mean Difference (IV, Random, 95% CI) | 0.0 [0.0, 0.0] |
| 7.4 Fibrin sealant vs cyanoacrylate | 1 | 30 | Mean Difference (IV, Random, 95% CI) | 2.2 [1.59, 2.81] |
| 7.5 Oxidised cellulose vs cyanoacrylate | 1 | 30 | Mean Difference (IV, Random, 95% CI) | ‐0.27 [‐0.81, 0.27] |
| 7.6 Oxidised cellulose vs fibrin sealant | 2 | 80 | Mean Difference (IV, Random, 95% CI) | ‐1.76 [‐2.00, 0.47] |
| 8 Blood transfusion (fresh frozen plasma) Show forest plot | 2 | Mean Difference (IV, Fixed, 95% CI) | Subtotals only | |
| 8.1 Fibrin sealant vs cyanoacrylate | 1 | 30 | Mean Difference (IV, Fixed, 95% CI) | ‐0.8 [‐1.01, ‐0.59] |
| 8.2 Oxidised cellulose vs cyanoacrylate | 1 | 30 | Mean Difference (IV, Fixed, 95% CI) | ‐0.27 [‐0.55, 0.01] |
| 8.3 Oxidised cellulose vs fibrin sealant | 2 | 80 | Mean Difference (IV, Fixed, 95% CI) | 0.53 [0.35, 0.71] |
| 9 Blood loss Show forest plot | 5 | Mean Difference (IV, Fixed, 95% CI) | Subtotals only | |
| 9.1 Fibrin sealant vs control | 2 | 350 | Mean Difference (IV, Fixed, 95% CI) | 0.10 [‐0.13, 0.33] |
| 9.2 Fibrin sealant and collagen vs control | 1 | 300 | Mean Difference (IV, Fixed, 95% CI) | 0.06 [‐0.06, 0.19] |
| 9.3 Fibrin sealant vs collagen | 1 | 62 | Mean Difference (IV, Fixed, 95% CI) | 0.07 [‐0.54, 0.68] |
| 9.4 Fibrin sealant vs cyanoacrylate | 1 | 30 | Mean Difference (IV, Fixed, 95% CI) | 0.11 [‐0.20, 0.43] |
| 9.5 Oxidised cellulose vs cyanoacrylate | 1 | 30 | Mean Difference (IV, Fixed, 95% CI) | ‐0.08 [‐0.35, 0.19] |
| 9.6 Oxidised cellulose vs fibrin sealant | 1 | 30 | Mean Difference (IV, Fixed, 95% CI) | ‐0.19 [‐0.45, 0.06] |
| 10 Total hospital stay Show forest plot | 4 | Mean Difference (IV, Fixed, 95% CI) | Subtotals only | |
| 10.1 Fibrin sealant vs control | 1 | 82 | Mean Difference (IV, Fixed, 95% CI) | ‐0.5 [‐2.45, 1.45] |
| 10.2 Fibrin sealant and collagen vs control | 1 | 300 | Mean Difference (IV, Fixed, 95% CI) | 0.70 [‐1.83, 3.23] |
| 10.3 Fibrin sealant vs cyanoacrylate | 1 | 30 | Mean Difference (IV, Fixed, 95% CI) | ‐1.34 [‐3.61, 0.93] |
| 10.4 Oxidised cellulose vs cyanoacrylate | 1 | 30 | Mean Difference (IV, Fixed, 95% CI) | ‐0.67 [‐3.12, 1.78] |
| 10.5 Oxidised cellulose vs fibrin sealant | 2 | 80 | Mean Difference (IV, Fixed, 95% CI) | 0.25 [‐1.84, 2.33] |
| 11 ITU stay Show forest plot | 1 | Mean Difference (IV, Fixed, 95% CI) | Totals not selected | |
| 11.1 Oxidised cellulose vs fibrin sealant | 1 | Mean Difference (IV, Fixed, 95% CI) | 0.0 [0.0, 0.0] | |
| 12 Operating time Show forest plot | 5 | Mean Difference (IV, Fixed, 95% CI) | Subtotals only | |
| 12.1 Fibrin sealant vs control | 2 | 122 | Mean Difference (IV, Fixed, 95% CI) | ‐14.55 [‐52.86, 23.76] |
| 12.2 Fibrin sealant and collagen vs control | 1 | 300 | Mean Difference (IV, Fixed, 95% CI) | 19.0 [2.09, 35.91] |
| 12.3 Fibrin sealant vs collagen | 1 | 62 | Mean Difference (IV, Fixed, 95% CI) | ‐4.0 [‐44.33, 36.33] |
| 12.4 Oxidised cellulose vs fibrin sealant | 1 | 50 | Mean Difference (IV, Fixed, 95% CI) | 5.40 [‐70.13, 80.93] |
| Outcome or subgroup title | No. of studies | No. of participants | Statistical method | Effect size |
| 1 Mortality (perioperative) Show forest plot | 14 | Odds Ratio (M‐H, Fixed, 95% CI) | Subtotals only | |
| 1.1 Continuous portal triad clamping vs control | 1 | 15 | Odds Ratio (M‐H, Fixed, 95% CI) | 0.0 [0.0, 0.0] |
| 1.2 Intermittent portal triad clamping vs control | 4 | 392 | Odds Ratio (M‐H, Fixed, 95% CI) | 0.63 [0.16, 2.44] |
| 1.3 Continuous portal triad clamping vs continuous hepatic vascular exclusion | 2 | 170 | Odds Ratio (M‐H, Fixed, 95% CI) | 3.39 [0.34, 33.33] |
| 1.4 Continuous selective hepatic vascular exclusion vs continuous portal triad clamping | 1 | 160 | Odds Ratio (M‐H, Fixed, 95% CI) | 0.0 [0.0, 0.0] |
| 1.5 Continuous selective portal triad clamping vs continuous portal triad clamping | 1 | 120 | Odds Ratio (M‐H, Fixed, 95% CI) | 0.0 [0.0, 0.0] |
| 1.6 Intermittent portal triad clamping vs continuous portal triad clamping | 2 | 121 | Odds Ratio (M‐H, Fixed, 95% CI) | 0.19 [0.02, 1.64] |
| 1.7 Intermittent portal triad clamping vs continuous selective portal triad clamping | 1 | 80 | Odds Ratio (M‐H, Fixed, 95% CI) | 0.0 [0.0, 0.0] |
| 1.8 Intermittent selective portal triad clamping vs intermittent portal triad clamping | 2 | 138 | Odds Ratio (M‐H, Fixed, 95% CI) | 2.93 [0.12, 74.00] |
| 2 Serious adverse events (proportion) Show forest plot | 8 | Odds Ratio (M‐H, Fixed, 95% CI) | Subtotals only | |
| 2.1 Intermittent portal triad clamping vs control | 3 | 302 | Odds Ratio (M‐H, Fixed, 95% CI) | 1.16 [0.55, 2.44] |
| 2.2 Continuous portal triad clamping vs continuous hepatic vascular exclusion | 1 | 118 | Odds Ratio (M‐H, Fixed, 95% CI) | 0.68 [0.11, 4.22] |
| 2.3 Continuous selective hepatic vascular exclusion vs continuous portal triad clamping | 1 | 160 | Odds Ratio (M‐H, Fixed, 95% CI) | 0.20 [0.01, 4.13] |
| 2.4 Continuous selective portal triad clamping vs continuous portal triad clamping | 1 | 120 | Odds Ratio (M‐H, Fixed, 95% CI) | 0.43 [0.19, 0.98] |
| 2.5 Intermittent portal triad clamping vs continuous portal triad clamping | 1 | 35 | Odds Ratio (M‐H, Fixed, 95% CI) | 0.47 [0.07, 2.96] |
| 2.6 Intermittent portal triad clamping vs continuous selective portal triad clamping | 1 | 80 | Odds Ratio (M‐H, Fixed, 95% CI) | 4.33 [0.46, 40.61] |
| 3 Serious adverse events (number) Show forest plot | 5 | Rate Ratio (Fixed, 95% CI) | Subtotals only | |
| 3.1 Intermittent portal triad clamping vs control | 1 | 100 | Rate Ratio (Fixed, 95% CI) | 1.50 [0.42, 5.32] |
| 3.2 Continuous portal triad clamping vs continuous hepatic vascular exclusion | 1 | 52 | Rate Ratio (Fixed, 95% CI) | 0.23 [0.03, 2.00] |
| 3.3 Intermittent portal triad clamping vs continuous portal triad clamping | 1 | 86 | Rate Ratio (Fixed, 95% CI) | 0.12 [0.01, 0.95] |
| 3.4 Intermittent selective portal triad clamping vs intermittent portal triad clamping | 2 | 138 | Rate Ratio (Fixed, 95% CI) | 1.26 [0.53, 2.99] |
| 4 Adverse events (proportion) Show forest plot | 12 | Odds Ratio (M‐H, Fixed, 95% CI) | Subtotals only | |
| 4.1 Intermittent portal triad clamping vs control | 4 | 392 | Odds Ratio (M‐H, Fixed, 95% CI) | 1.27 [0.83, 1.94] |
| 4.2 Continuous portal triad clamping vs continuous hepatic vascular exclusion | 1 | 118 | Odds Ratio (M‐H, Fixed, 95% CI) | 0.89 [0.41, 1.96] |
| 4.3 Continuous selective hepatic vascular exclusion vs continuous portal triad clamping | 1 | 160 | Odds Ratio (M‐H, Fixed, 95% CI) | 0.47 [0.20, 1.13] |
| 4.4 Continuous selective portal triad clamping vs continuous portal triad clamping | 1 | 120 | Odds Ratio (M‐H, Fixed, 95% CI) | 0.41 [0.19, 0.93] |
| 4.5 Intermittent portal triad clamping vs continuous portal triad clamping | 2 | 121 | Odds Ratio (M‐H, Fixed, 95% CI) | 0.67 [0.29, 1.56] |
| 4.6 Intermittent portal triad clamping vs continuous selective portal triad clamping | 1 | 80 | Odds Ratio (M‐H, Fixed, 95% CI) | 0.86 [0.29, 2.52] |
| 4.7 Intermittent selective portal triad clamping vs intermittent portal triad clamping | 2 | 138 | Odds Ratio (M‐H, Fixed, 95% CI) | 0.86 [0.42, 1.75] |
| 5 Adverse events (number) Show forest plot | 6 | Rate Ratio (Fixed, 95% CI) | Subtotals only | |
| 5.1 Intermittent portal triad clamping vs control | 2 | 226 | Rate Ratio (Fixed, 95% CI) | 1.19 [0.80, 1.76] |
| 5.2 Continuous portal triad clamping vs continuous hepatic vascular exclusion | 1 | 52 | Rate Ratio (Fixed, 95% CI) | 0.61 [0.29, 1.32] |
| 5.3 Intermittent portal triad clamping vs continuous portal triad clamping | 1 | 86 | Rate Ratio (Fixed, 95% CI) | 0.64 [0.31, 1.32] |
| 5.4 Intermittent selective portal triad clamping vs intermittent portal triad clamping | 2 | 138 | Rate Ratio (Fixed, 95% CI) | 1.17 [0.72, 1.91] |
| 6 Blood transfusion (proportion) Show forest plot | 13 | Odds Ratio (M‐H, Fixed, 95% CI) | Subtotals only | |
| 6.1 Continuous portal triad clamping vs control | 1 | 34 | Odds Ratio (M‐H, Fixed, 95% CI) | 0.08 [0.01, 0.80] |
| 6.2 Intermittent portal triad clamping vs control | 4 | 392 | Odds Ratio (M‐H, Fixed, 95% CI) | 0.82 [0.50, 1.35] |
| 6.3 Continuous portal triad clamping vs continuous hepatic vascular exclusion | 1 | 118 | Odds Ratio (M‐H, Fixed, 95% CI) | 5.66 [2.29, 14.00] |
| 6.4 Continuous selective hepatic vascular exclusion vs continuous portal triad clamping | 1 | 160 | Odds Ratio (M‐H, Fixed, 95% CI) | 0.51 [0.24, 1.11] |
| 6.5 Continuous selective portal triad clamping vs continuous portal triad clamping | 1 | 120 | Odds Ratio (M‐H, Fixed, 95% CI) | 1.56 [0.42, 5.82] |
| 6.6 Intermittent portal triad clamping vs continuous portal triad clamping | 2 | 121 | Odds Ratio (M‐H, Fixed, 95% CI) | 1.14 [0.52, 2.49] |
| 6.7 Intermittent portal triad clamping vs continuous selective portal triad clamping | 1 | 80 | Odds Ratio (M‐H, Fixed, 95% CI) | 0.90 [0.36, 2.23] |
| 6.8 Intermittent selective portal triad clamping vs intermittent portal triad clamping | 2 | 138 | Odds Ratio (M‐H, Fixed, 95% CI) | 0.58 [0.25, 1.36] |
| 7 Blood transfusion (red blood cell) Show forest plot | 10 | Mean Difference (IV, Fixed, 95% CI) | Subtotals only | |
| 7.1 Continuous portal triad clamping vs control | 1 | 15 | Mean Difference (IV, Fixed, 95% CI) | ‐0.60 [‐3.20, 2.00] |
| 7.2 Intermittent portal triad clamping vs control | 1 | 100 | Mean Difference (IV, Fixed, 95% CI) | ‐1.5 [‐2.75, ‐0.25] |
| 7.3 Continuous portal triad clamping vs continuous hepatic vascular exclusion | 1 | 52 | Mean Difference (IV, Fixed, 95% CI) | 0.40 [‐1.61, 2.41] |
| 7.4 Continuous selective hepatic vascular exclusion vs continuous portal triad clamping | 1 | 160 | Mean Difference (IV, Fixed, 95% CI) | ‐1.20 [‐2.38, ‐0.02] |
| 7.5 Continuous selective portal triad clamping vs continuous portal triad clamping | 1 | 120 | Mean Difference (IV, Fixed, 95% CI) | ‐0.20 [‐0.31, ‐0.09] |
| 7.6 Intermittent portal triad clamping vs continuous portal triad clamping | 2 | 121 | Mean Difference (IV, Fixed, 95% CI) | ‐0.13 [‐0.60, 0.34] |
| 7.7 Intermittent portal triad clamping vs continuous selective portal triad clamping | 1 | 80 | Mean Difference (IV, Fixed, 95% CI) | 0.11 [‐0.23, 0.46] |
| 7.8 Intermittent selective portal triad clamping vs intermittent portal triad clamping | 2 | 138 | Mean Difference (IV, Fixed, 95% CI) | ‐0.07 [‐0.45, 0.32] |
| 8 Blood loss Show forest plot | 16 | Mean Difference (IV, Random, 95% CI) | Subtotals only | |
| 8.1 Continuous portal triad clamping vs control | 3 | 131 | Mean Difference (IV, Random, 95% CI) | ‐0.24 [‐0.76, 0.27] |
| 8.2 Intermittent portal triad clamping vs control | 4 | 402 | Mean Difference (IV, Random, 95% CI) | ‐0.02 [‐0.19, 0.15] |
| 8.3 Continuous portal triad clamping vs continuous hepatic vascular exclusion | 2 | 170 | Mean Difference (IV, Random, 95% CI) | 0.17 [‐0.35, 0.68] |
| 8.4 Continuous selective hepatic vascular exclusion vs continuous portal triad clamping | 1 | 160 | Mean Difference (IV, Random, 95% CI) | ‐0.25 [‐0.49, ‐0.00] |
| 8.5 Continuous selective portal triad clamping vs continuous portal triad clamping | 1 | 120 | Mean Difference (IV, Random, 95% CI) | 0.10 [‐0.19, 0.39] |
| 8.6 Intermittent portal triad clamping vs continuous portal triad clamping | 2 | 121 | Mean Difference (IV, Random, 95% CI) | 0.06 [‐0.20, 0.32] |
| 8.7 Intermittent portal triad clamping vs continuous selective portal triad clamping | 1 | 80 | Mean Difference (IV, Random, 95% CI) | ‐0.08 [‐0.20, 0.05] |
| 8.8 Intermittent selective portal triad clamping vs intermittent portal triad clamping | 2 | 138 | Mean Difference (IV, Random, 95% CI) | ‐0.17 [‐0.74, 0.39] |
| 9 Major blood loss (proportion) Show forest plot | 3 | Odds Ratio (M‐H, Fixed, 95% CI) | Totals not selected | |
| 9.1 Intermittent portal triad clamping vs control | 1 | Odds Ratio (M‐H, Fixed, 95% CI) | 0.0 [0.0, 0.0] | |
| 9.2 Continuous selective hepatic vascular exclusion vs continuous portal triad clamping | 1 | Odds Ratio (M‐H, Fixed, 95% CI) | 0.0 [0.0, 0.0] | |
| 9.3 Continuous selective portal triad clamping vs continuous portal triad clamping | 1 | Odds Ratio (M‐H, Fixed, 95% CI) | 0.0 [0.0, 0.0] | |
| 10 Total hospital stay Show forest plot | 10 | Mean Difference (IV, Fixed, 95% CI) | Subtotals only | |
| 10.1 Intermittent portal triad clamping vs control | 4 | 402 | Mean Difference (IV, Fixed, 95% CI) | 0.32 [‐0.64, 1.28] |
| 10.2 Continuous portal triad clamping vs continuous hepatic vascular exclusion | 1 | 52 | Mean Difference (IV, Fixed, 95% CI) | ‐8.0 [‐13.05, ‐2.95] |
| 10.3 Continuous selective hepatic vascular exclusion vs continuous portal triad clamping | 1 | 160 | Mean Difference (IV, Fixed, 95% CI) | ‐2.80 [‐4.13, ‐1.47] |
| 10.4 Intermittent portal triad clamping vs continuous portal triad clamping | 1 | 86 | Mean Difference (IV, Fixed, 95% CI) | 1.0 [‐2.82, 4.82] |
| 10.5 Intermittent portal triad clamping vs continuous selective portal triad clamping | 1 | 80 | Mean Difference (IV, Fixed, 95% CI) | ‐0.27 [‐1.60, 1.06] |
| 10.6 Intermittent selective portal triad clamping vs intermittent portal triad clamping | 2 | 138 | Mean Difference (IV, Fixed, 95% CI) | ‐0.67 [‐2.40, 1.06] |
| 11 ITU stay Show forest plot | 1 | Mean Difference (IV, Fixed, 95% CI) | Totals not selected | |
| 11.1 Continuous selective hepatic vascular exclusion vs continuous portal triad clamping | 1 | Mean Difference (IV, Fixed, 95% CI) | 0.0 [0.0, 0.0] | |
| 12 Operating time Show forest plot | 12 | Mean Difference (IV, Random, 95% CI) | Subtotals only | |
| 12.1 Continuous portal triad clamping vs control | 2 | 40 | Mean Difference (IV, Random, 95% CI) | ‐45.87 [‐95.61, 3.87] |
| 12.2 Intermittent portal triad clamping vs control | 2 | 176 | Mean Difference (IV, Random, 95% CI) | 25.66 [‐31.57, 82.89] |
| 12.3 Continuous portal triad clamping vs continuous hepatic vascular exclusion | 2 | 170 | Mean Difference (IV, Random, 95% CI) | ‐29.32 [‐82.75, 24.10] |
| 12.4 Continuous selective hepatic vascular exclusion vs continuous portal triad clamping | 1 | 160 | Mean Difference (IV, Random, 95% CI) | ‐7.20 [‐63.42, 49.02] |
| 12.5 Continuous selective portal triad clamping vs continuous portal triad clamping | 1 | 120 | Mean Difference (IV, Random, 95% CI) | 20.0 [‐0.00, 40.00] |
| 12.6 Intermittent portal triad clamping vs continuous portal triad clamping | 1 | 35 | Mean Difference (IV, Random, 95% CI) | 13.40 [‐41.28, 68.08] |
| 12.7 Intermittent portal triad clamping vs continuous selective portal triad clamping | 1 | 80 | Mean Difference (IV, Random, 95% CI) | ‐32.17 [‐51.50, ‐12.84] |
| 12.8 Intermittent selective portal triad clamping vs intermittent portal triad clamping | 2 | 138 | Mean Difference (IV, Random, 95% CI) | 8.64 [‐10.16, 27.45] |
| Outcome or subgroup title | No. of studies | No. of participants | Statistical method | Effect size |
| 1 Mortality (perioperative) Show forest plot | 2 | Odds Ratio (M‐H, Fixed, 95% CI) | Subtotals only | |
| 1.1 Recombinant factor VIIa vs control | 1 | 185 | Odds Ratio (M‐H, Fixed, 95% CI) | 0.61 [0.13, 2.83] |
| 1.2 Tranexamic acid vs control | 1 | 214 | Odds Ratio (M‐H, Fixed, 95% CI) | 0.0 [0.0, 0.0] |
| 2 Serious adverse events (proportion) Show forest plot | 3 | Odds Ratio (M‐H, Fixed, 95% CI) | Subtotals only | |
| 2.1 Anti‐thrombin III vs control | 1 | 24 | Odds Ratio (M‐H, Fixed, 95% CI) | 1.19 [0.20, 6.99] |
| 2.2 Recombinant factor VIIa vs control | 2 | 432 | Odds Ratio (M‐H, Fixed, 95% CI) | 1.10 [0.58, 2.09] |
| 3 Serious adverse events (number) Show forest plot | 3 | Rate Ratio (Fixed, 95% CI) | Subtotals only | |
| 3.1 Recombinant factor VIIa vs control | 2 | 432 | Rate Ratio (Fixed, 95% CI) | 1.46 [0.75, 2.84] |
| 3.2 Tranexamic acid vs control | 1 | 214 | Rate Ratio (Fixed, 95% CI) | 0.86 [0.31, 2.37] |
| 4 Adverse events (proportion) Show forest plot | 3 | Odds Ratio (M‐H, Fixed, 95% CI) | Subtotals only | |
| 4.1 Anti‐thrombin III vs control | 1 | 24 | Odds Ratio (M‐H, Fixed, 95% CI) | 0.53 [0.10, 2.84] |
| 4.2 Recombinant factor VIIa vs control | 1 | 232 | Odds Ratio (M‐H, Fixed, 95% CI) | 1.04 [0.34, 3.21] |
| 4.3 Tranexamic acid vs control | 1 | 214 | Odds Ratio (M‐H, Fixed, 95% CI) | 0.78 [0.36, 1.67] |
| 5 Adverse events (number) Show forest plot | 3 | Rate Ratio (Fixed, 95% CI) | Subtotals only | |
| 5.1 Recombinant factor VIIa vs control | 2 | 432 | Rate Ratio (Fixed, 95% CI) | 0.98 [0.87, 1.10] |
| 5.2 Tranexamic acid vs control | 1 | 214 | Rate Ratio (Fixed, 95% CI) | 0.78 [0.43, 1.42] |
| 6 Blood transfusion (proportion) Show forest plot | 5 | Odds Ratio (M‐H, Fixed, 95% CI) | Subtotals only | |
| 6.1 Aprotinin vs control | 1 | 97 | Odds Ratio (M‐H, Fixed, 95% CI) | 0.32 [0.12, 0.82] |
| 6.2 Desmopressin vs control | 1 | 60 | Odds Ratio (M‐H, Fixed, 95% CI) | 0.56 [0.12, 2.57] |
| 6.3 Recombinant factor VIIa vs control | 2 | 416 | Odds Ratio (M‐H, Fixed, 95% CI) | 0.94 [0.62, 1.43] |
| 6.4 Tranexamic acid vs control | 1 | 214 | Odds Ratio (M‐H, Fixed, 95% CI) | 0.02 [0.00, 0.40] |
| 7 Blood transfusion (fresh frozen plasma) Show forest plot | 1 | Mean Difference (IV, Fixed, 95% CI) | Subtotals only | |
| 7.1 Desmopressin vs control | 1 | 60 | Mean Difference (IV, Fixed, 95% CI) | ‐0.60 [‐1.39, 0.19] |
| 8 Blood loss Show forest plot | 1 | Mean Difference (IV, Fixed, 95% CI) | Subtotals only | |
| 8.1 Aprotinin vs control | 1 | 97 | Mean Difference (IV, Fixed, 95% CI) | ‐0.44 [‐0.87, 0.00] |
| 9 Hospital stay Show forest plot | 1 | Mean Difference (IV, Fixed, 95% CI) | Subtotals only | |
| 9.1 Tranexamic acid vs control | 1 | 214 | Mean Difference (IV, Fixed, 95% CI) | ‐1.0 [‐3.06, 1.06] |
| 10 Operating time Show forest plot | 1 | Mean Difference (IV, Fixed, 95% CI) | Subtotals only | |
| 10.1 Aprotinin vs control | 1 | 97 | Mean Difference (IV, Fixed, 95% CI) | ‐1.0 [‐30.08, 28.08] |