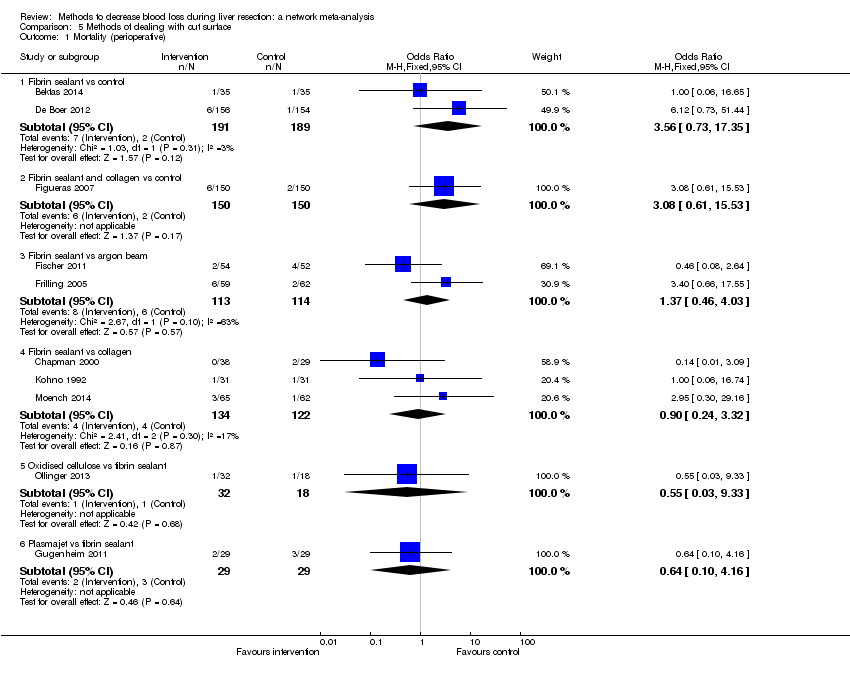
| 1 Mortality (perioperative) Show forest plot | 14 | | Odds Ratio (M‐H, Fixed, 95% CI) | Subtotals only |
|
| 1.1 Continuous portal triad clamping vs control | 1 | 15 | Odds Ratio (M‐H, Fixed, 95% CI) | 0.0 [0.0, 0.0] |
| 1.2 Intermittent portal triad clamping vs control | 4 | 392 | Odds Ratio (M‐H, Fixed, 95% CI) | 0.63 [0.16, 2.44] |
| 1.3 Continuous portal triad clamping vs continuous hepatic vascular exclusion | 2 | 170 | Odds Ratio (M‐H, Fixed, 95% CI) | 3.39 [0.34, 33.33] |
| 1.4 Continuous selective hepatic vascular exclusion vs continuous portal triad clamping | 1 | 160 | Odds Ratio (M‐H, Fixed, 95% CI) | 0.0 [0.0, 0.0] |
| 1.5 Continuous selective portal triad clamping vs continuous portal triad clamping | 1 | 120 | Odds Ratio (M‐H, Fixed, 95% CI) | 0.0 [0.0, 0.0] |
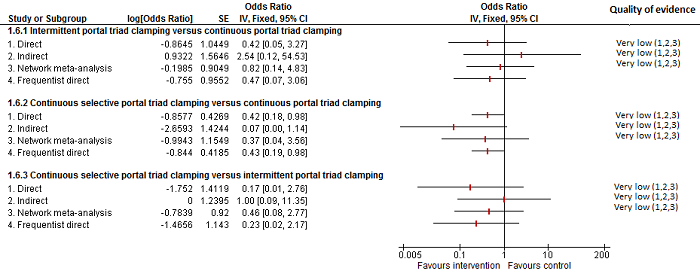
| 1.6 Intermittent portal triad clamping vs continuous portal triad clamping | 2 | 121 | Odds Ratio (M‐H, Fixed, 95% CI) | 0.19 [0.02, 1.64] |
| 1.7 Intermittent portal triad clamping vs continuous selective portal triad clamping | 1 | 80 | Odds Ratio (M‐H, Fixed, 95% CI) | 0.0 [0.0, 0.0] |
| 1.8 Intermittent selective portal triad clamping vs intermittent portal triad clamping | 2 | 138 | Odds Ratio (M‐H, Fixed, 95% CI) | 2.93 [0.12, 74.00] |
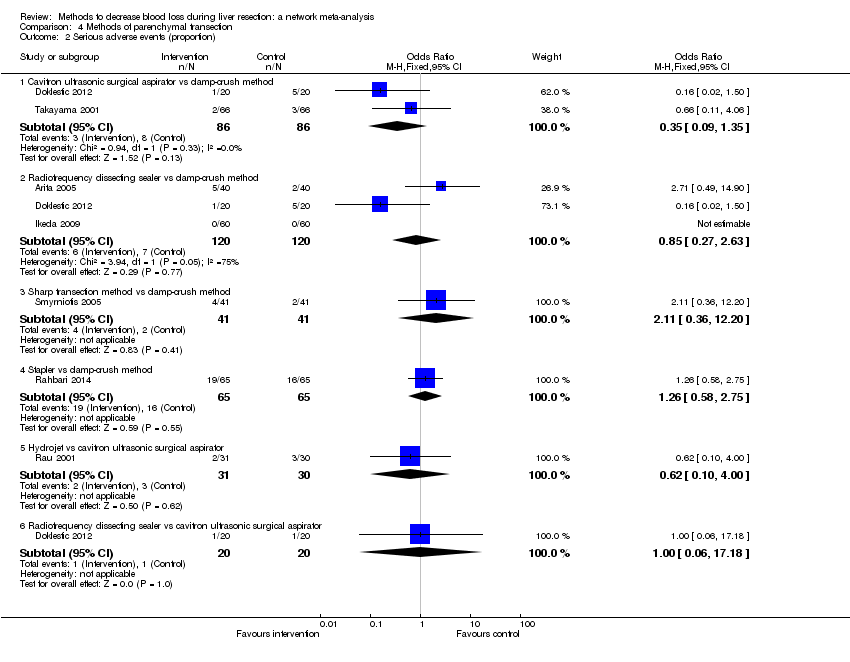
| 2 Serious adverse events (proportion) Show forest plot | 8 | | Odds Ratio (M‐H, Fixed, 95% CI) | Subtotals only |
|
| 2.1 Intermittent portal triad clamping vs control | 3 | 302 | Odds Ratio (M‐H, Fixed, 95% CI) | 1.16 [0.55, 2.44] |
| 2.2 Continuous portal triad clamping vs continuous hepatic vascular exclusion | 1 | 118 | Odds Ratio (M‐H, Fixed, 95% CI) | 0.68 [0.11, 4.22] |
| 2.3 Continuous selective hepatic vascular exclusion vs continuous portal triad clamping | 1 | 160 | Odds Ratio (M‐H, Fixed, 95% CI) | 0.20 [0.01, 4.13] |
| 2.4 Continuous selective portal triad clamping vs continuous portal triad clamping | 1 | 120 | Odds Ratio (M‐H, Fixed, 95% CI) | 0.43 [0.19, 0.98] |
| 2.5 Intermittent portal triad clamping vs continuous portal triad clamping | 1 | 35 | Odds Ratio (M‐H, Fixed, 95% CI) | 0.47 [0.07, 2.96] |
| 2.6 Intermittent portal triad clamping vs continuous selective portal triad clamping | 1 | 80 | Odds Ratio (M‐H, Fixed, 95% CI) | 4.33 [0.46, 40.61] |
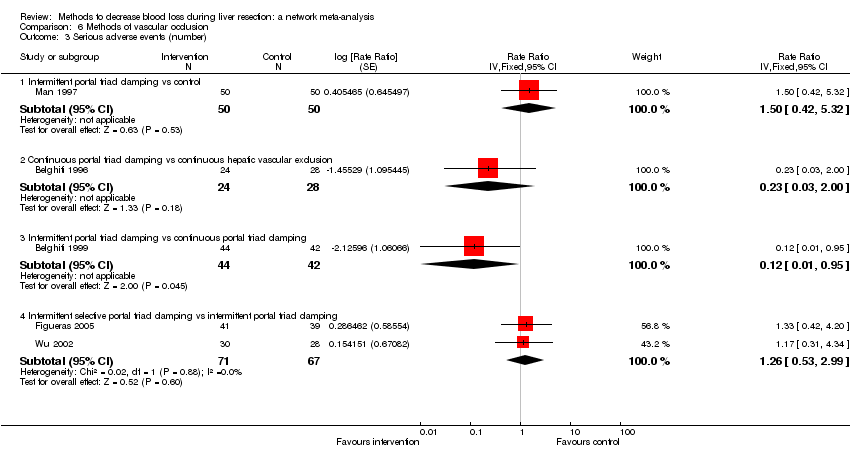
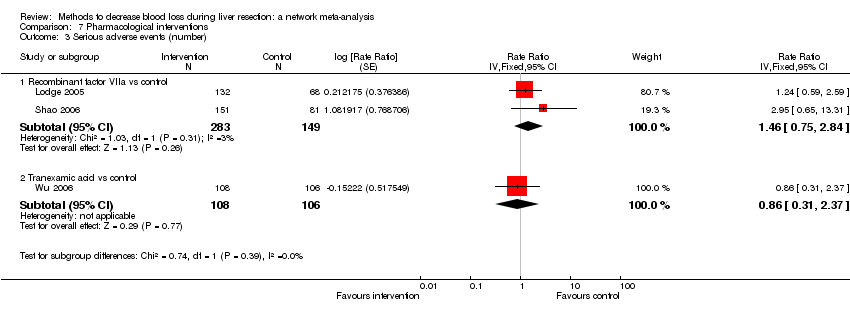
| 3 Serious adverse events (number) Show forest plot | 5 | | Rate Ratio (Fixed, 95% CI) | Subtotals only |
|
| 3.1 Intermittent portal triad clamping vs control | 1 | 100 | Rate Ratio (Fixed, 95% CI) | 1.50 [0.42, 5.32] |
| 3.2 Continuous portal triad clamping vs continuous hepatic vascular exclusion | 1 | 52 | Rate Ratio (Fixed, 95% CI) | 0.23 [0.03, 2.00] |
| 3.3 Intermittent portal triad clamping vs continuous portal triad clamping | 1 | 86 | Rate Ratio (Fixed, 95% CI) | 0.12 [0.01, 0.95] |
| 3.4 Intermittent selective portal triad clamping vs intermittent portal triad clamping | 2 | 138 | Rate Ratio (Fixed, 95% CI) | 1.26 [0.53, 2.99] |
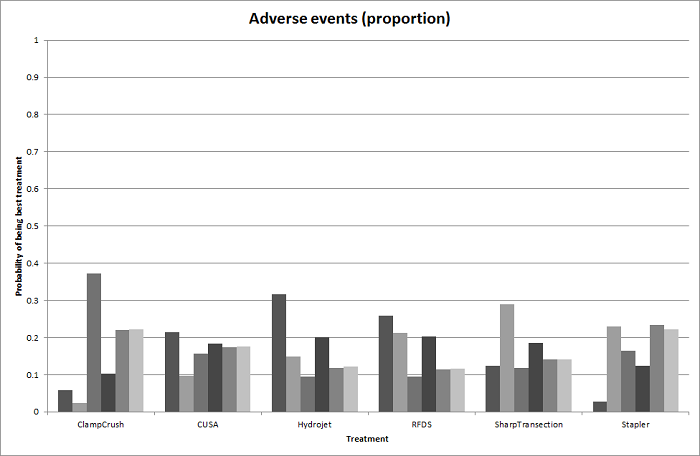
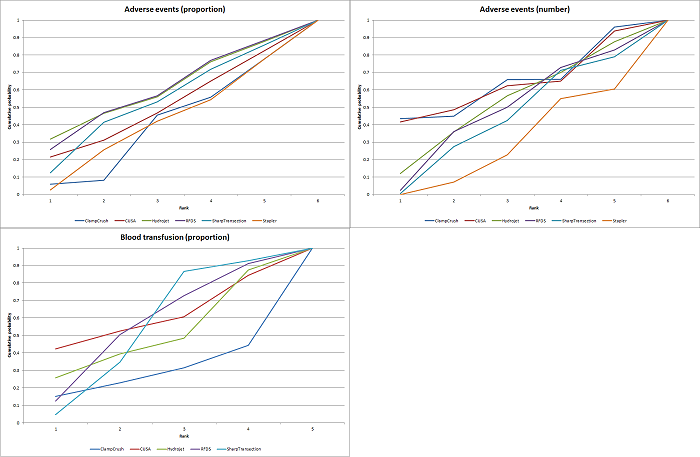
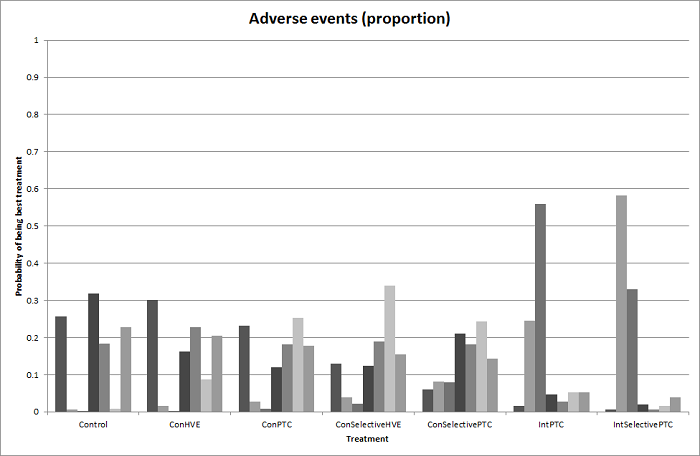
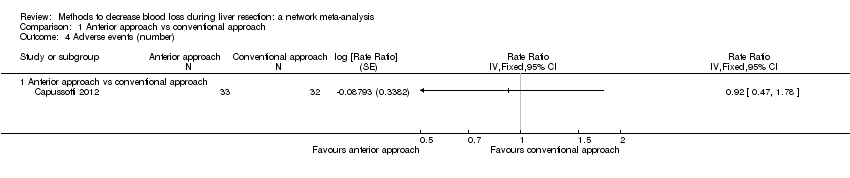
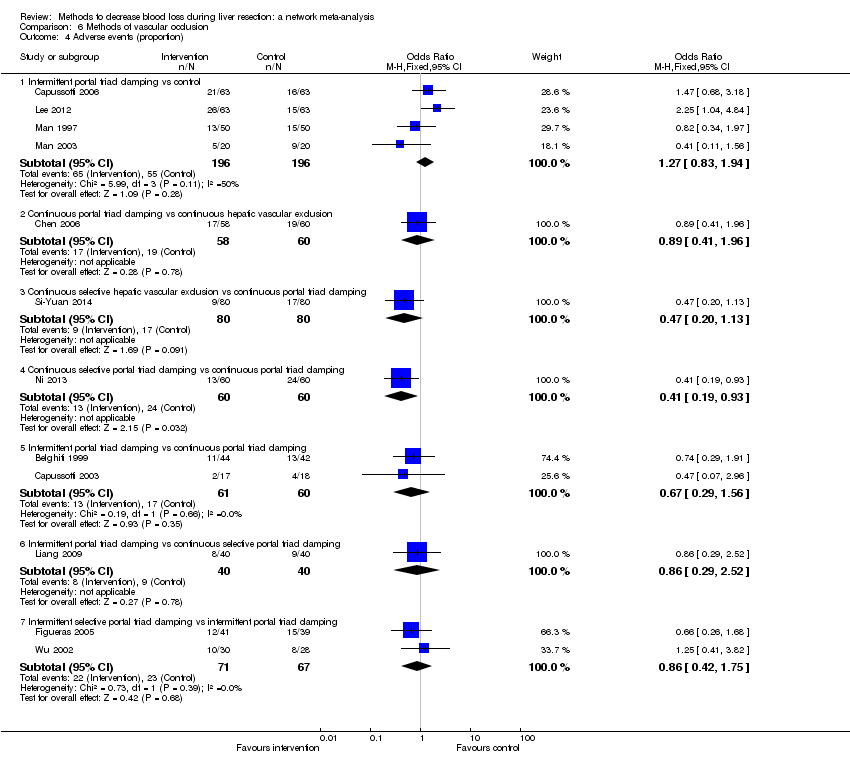
| 4 Adverse events (proportion) Show forest plot | 12 | | Odds Ratio (M‐H, Fixed, 95% CI) | Subtotals only |
|
| 4.1 Intermittent portal triad clamping vs control | 4 | 392 | Odds Ratio (M‐H, Fixed, 95% CI) | 1.27 [0.83, 1.94] |
| 4.2 Continuous portal triad clamping vs continuous hepatic vascular exclusion | 1 | 118 | Odds Ratio (M‐H, Fixed, 95% CI) | 0.89 [0.41, 1.96] |
| 4.3 Continuous selective hepatic vascular exclusion vs continuous portal triad clamping | 1 | 160 | Odds Ratio (M‐H, Fixed, 95% CI) | 0.47 [0.20, 1.13] |
| 4.4 Continuous selective portal triad clamping vs continuous portal triad clamping | 1 | 120 | Odds Ratio (M‐H, Fixed, 95% CI) | 0.41 [0.19, 0.93] |
| 4.5 Intermittent portal triad clamping vs continuous portal triad clamping | 2 | 121 | Odds Ratio (M‐H, Fixed, 95% CI) | 0.67 [0.29, 1.56] |
| 4.6 Intermittent portal triad clamping vs continuous selective portal triad clamping | 1 | 80 | Odds Ratio (M‐H, Fixed, 95% CI) | 0.86 [0.29, 2.52] |
| 4.7 Intermittent selective portal triad clamping vs intermittent portal triad clamping | 2 | 138 | Odds Ratio (M‐H, Fixed, 95% CI) | 0.86 [0.42, 1.75] |
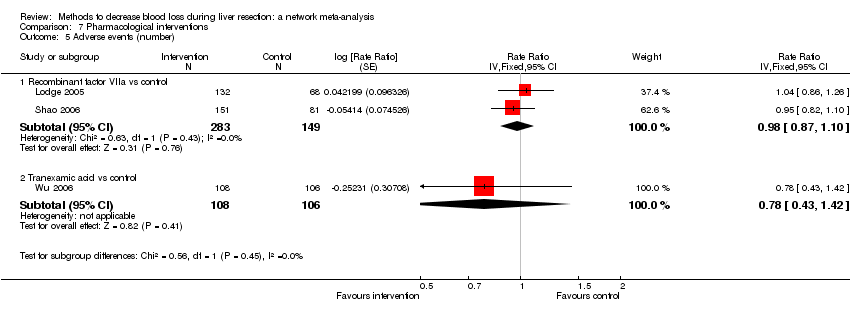
| 5 Adverse events (number) Show forest plot | 6 | | Rate Ratio (Fixed, 95% CI) | Subtotals only |
|
| 5.1 Intermittent portal triad clamping vs control | 2 | 226 | Rate Ratio (Fixed, 95% CI) | 1.19 [0.80, 1.76] |
| 5.2 Continuous portal triad clamping vs continuous hepatic vascular exclusion | 1 | 52 | Rate Ratio (Fixed, 95% CI) | 0.61 [0.29, 1.32] |
| 5.3 Intermittent portal triad clamping vs continuous portal triad clamping | 1 | 86 | Rate Ratio (Fixed, 95% CI) | 0.64 [0.31, 1.32] |
| 5.4 Intermittent selective portal triad clamping vs intermittent portal triad clamping | 2 | 138 | Rate Ratio (Fixed, 95% CI) | 1.17 [0.72, 1.91] |
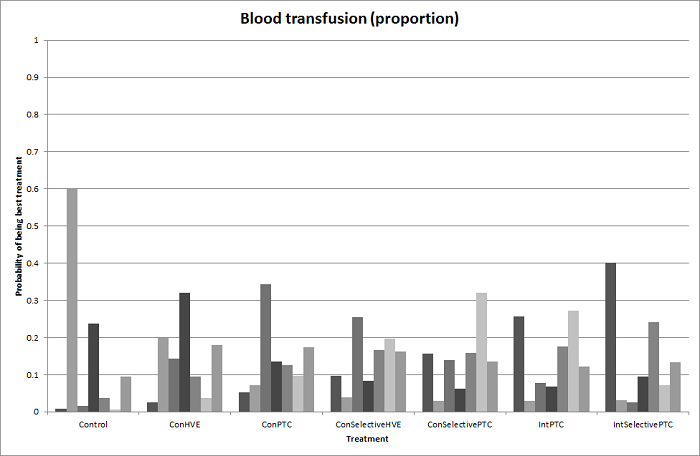
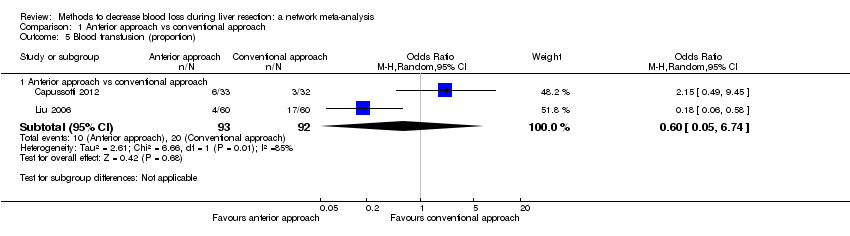
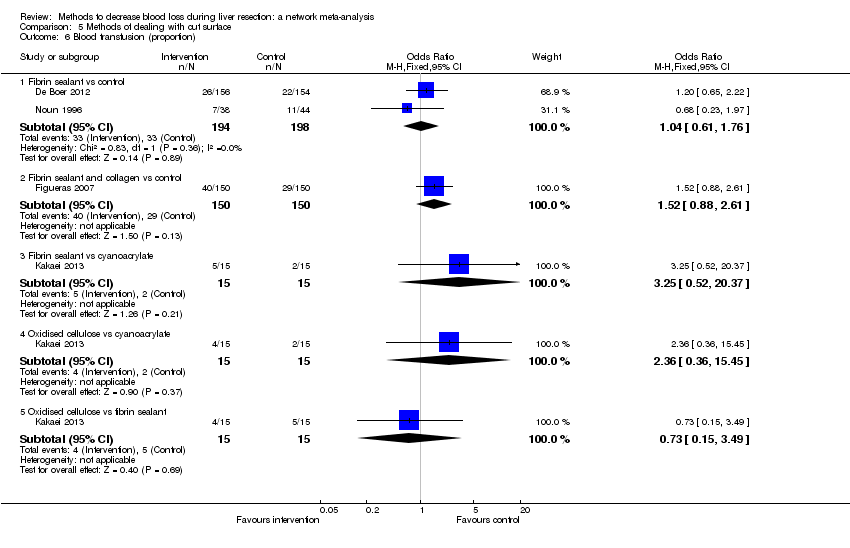
| 6 Blood transfusion (proportion) Show forest plot | 13 | | Odds Ratio (M‐H, Fixed, 95% CI) | Subtotals only |
|
| 6.1 Continuous portal triad clamping vs control | 1 | 34 | Odds Ratio (M‐H, Fixed, 95% CI) | 0.08 [0.01, 0.80] |
| 6.2 Intermittent portal triad clamping vs control | 4 | 392 | Odds Ratio (M‐H, Fixed, 95% CI) | 0.82 [0.50, 1.35] |
| 6.3 Continuous portal triad clamping vs continuous hepatic vascular exclusion | 1 | 118 | Odds Ratio (M‐H, Fixed, 95% CI) | 5.66 [2.29, 14.00] |
| 6.4 Continuous selective hepatic vascular exclusion vs continuous portal triad clamping | 1 | 160 | Odds Ratio (M‐H, Fixed, 95% CI) | 0.51 [0.24, 1.11] |
| 6.5 Continuous selective portal triad clamping vs continuous portal triad clamping | 1 | 120 | Odds Ratio (M‐H, Fixed, 95% CI) | 1.56 [0.42, 5.82] |
| 6.6 Intermittent portal triad clamping vs continuous portal triad clamping | 2 | 121 | Odds Ratio (M‐H, Fixed, 95% CI) | 1.14 [0.52, 2.49] |
| 6.7 Intermittent portal triad clamping vs continuous selective portal triad clamping | 1 | 80 | Odds Ratio (M‐H, Fixed, 95% CI) | 0.90 [0.36, 2.23] |
| 6.8 Intermittent selective portal triad clamping vs intermittent portal triad clamping | 2 | 138 | Odds Ratio (M‐H, Fixed, 95% CI) | 0.58 [0.25, 1.36] |
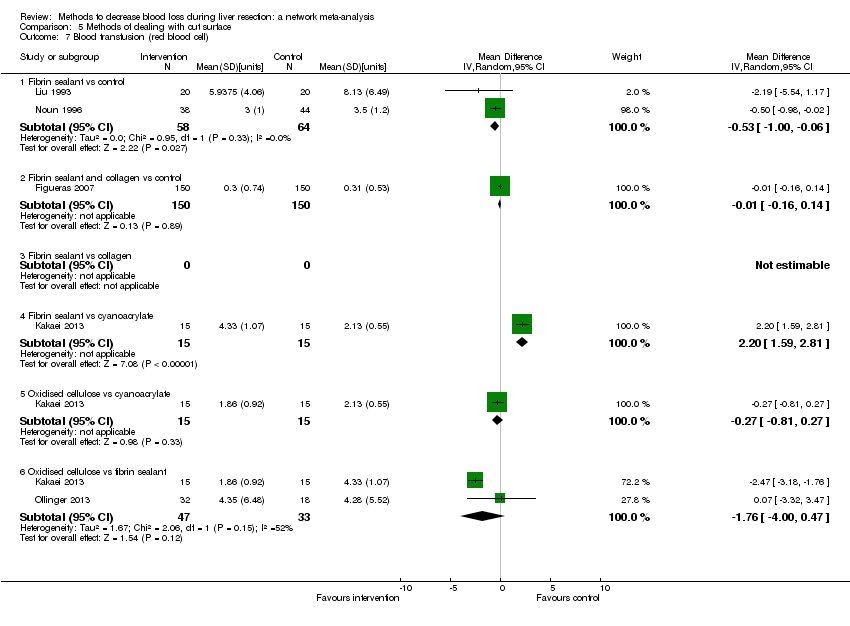
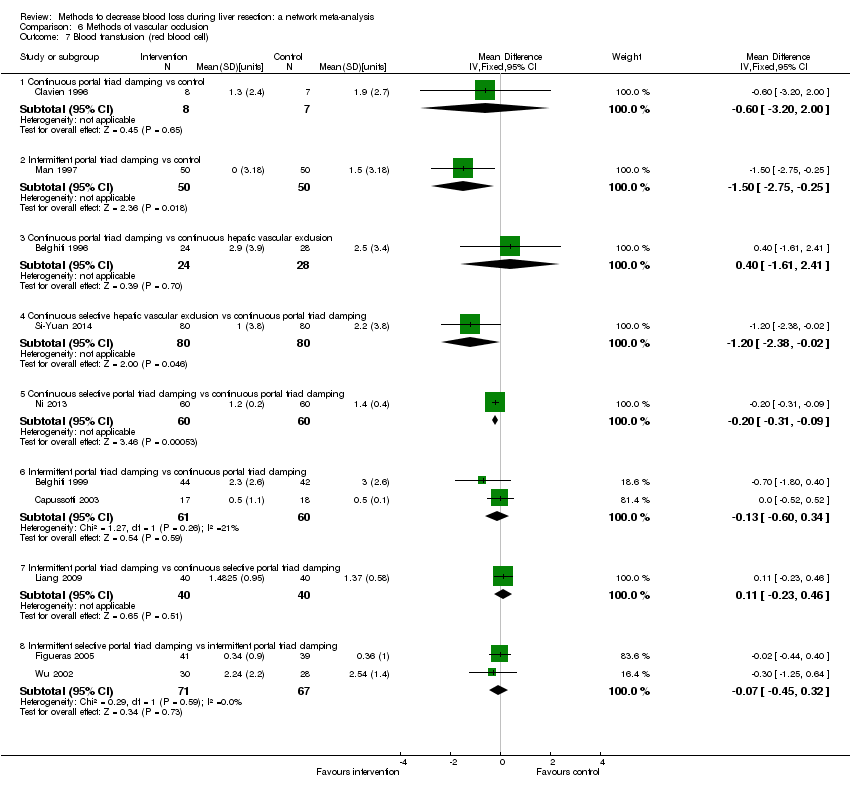
| 7 Blood transfusion (red blood cell) Show forest plot | 10 | | Mean Difference (IV, Fixed, 95% CI) | Subtotals only |
|
| 7.1 Continuous portal triad clamping vs control | 1 | 15 | Mean Difference (IV, Fixed, 95% CI) | ‐0.60 [‐3.20, 2.00] |
| 7.2 Intermittent portal triad clamping vs control | 1 | 100 | Mean Difference (IV, Fixed, 95% CI) | ‐1.5 [‐2.75, ‐0.25] |
| 7.3 Continuous portal triad clamping vs continuous hepatic vascular exclusion | 1 | 52 | Mean Difference (IV, Fixed, 95% CI) | 0.40 [‐1.61, 2.41] |
| 7.4 Continuous selective hepatic vascular exclusion vs continuous portal triad clamping | 1 | 160 | Mean Difference (IV, Fixed, 95% CI) | ‐1.20 [‐2.38, ‐0.02] |
| 7.5 Continuous selective portal triad clamping vs continuous portal triad clamping | 1 | 120 | Mean Difference (IV, Fixed, 95% CI) | ‐0.20 [‐0.31, ‐0.09] |
| 7.6 Intermittent portal triad clamping vs continuous portal triad clamping | 2 | 121 | Mean Difference (IV, Fixed, 95% CI) | ‐0.13 [‐0.60, 0.34] |
| 7.7 Intermittent portal triad clamping vs continuous selective portal triad clamping | 1 | 80 | Mean Difference (IV, Fixed, 95% CI) | 0.11 [‐0.23, 0.46] |
| 7.8 Intermittent selective portal triad clamping vs intermittent portal triad clamping | 2 | 138 | Mean Difference (IV, Fixed, 95% CI) | ‐0.07 [‐0.45, 0.32] |
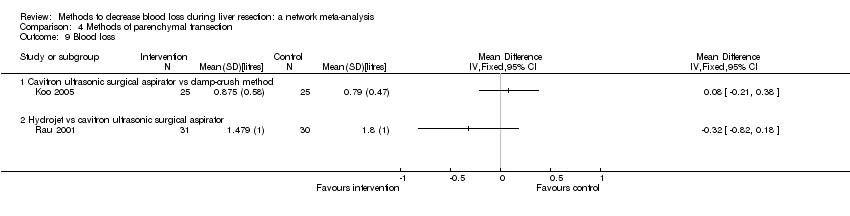
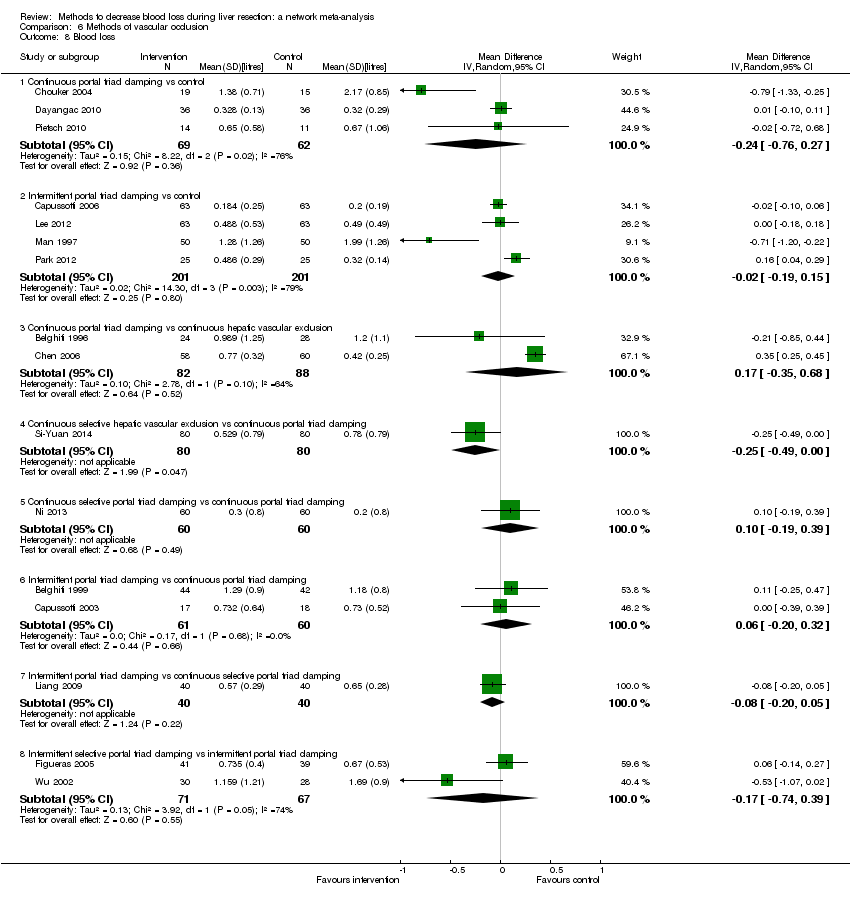
| 8 Blood loss Show forest plot | 16 | | Mean Difference (IV, Random, 95% CI) | Subtotals only |
|
| 8.1 Continuous portal triad clamping vs control | 3 | 131 | Mean Difference (IV, Random, 95% CI) | ‐0.24 [‐0.76, 0.27] |
| 8.2 Intermittent portal triad clamping vs control | 4 | 402 | Mean Difference (IV, Random, 95% CI) | ‐0.02 [‐0.19, 0.15] |
| 8.3 Continuous portal triad clamping vs continuous hepatic vascular exclusion | 2 | 170 | Mean Difference (IV, Random, 95% CI) | 0.17 [‐0.35, 0.68] |
| 8.4 Continuous selective hepatic vascular exclusion vs continuous portal triad clamping | 1 | 160 | Mean Difference (IV, Random, 95% CI) | ‐0.25 [‐0.49, ‐0.00] |
| 8.5 Continuous selective portal triad clamping vs continuous portal triad clamping | 1 | 120 | Mean Difference (IV, Random, 95% CI) | 0.10 [‐0.19, 0.39] |
| 8.6 Intermittent portal triad clamping vs continuous portal triad clamping | 2 | 121 | Mean Difference (IV, Random, 95% CI) | 0.06 [‐0.20, 0.32] |
| 8.7 Intermittent portal triad clamping vs continuous selective portal triad clamping | 1 | 80 | Mean Difference (IV, Random, 95% CI) | ‐0.08 [‐0.20, 0.05] |
| 8.8 Intermittent selective portal triad clamping vs intermittent portal triad clamping | 2 | 138 | Mean Difference (IV, Random, 95% CI) | ‐0.17 [‐0.74, 0.39] |
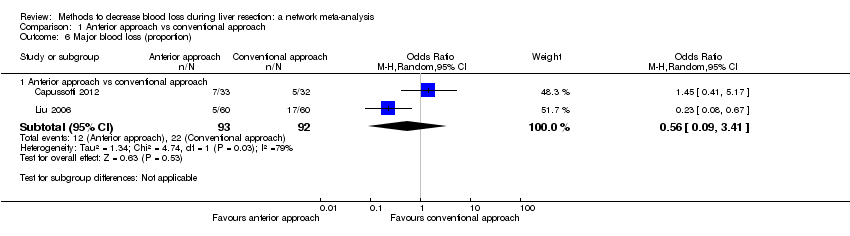
| 9 Major blood loss (proportion) Show forest plot | 3 | | Odds Ratio (M‐H, Fixed, 95% CI) | Totals not selected |
|
| 9.1 Intermittent portal triad clamping vs control | 1 | | Odds Ratio (M‐H, Fixed, 95% CI) | 0.0 [0.0, 0.0] |
| 9.2 Continuous selective hepatic vascular exclusion vs continuous portal triad clamping | 1 | | Odds Ratio (M‐H, Fixed, 95% CI) | 0.0 [0.0, 0.0] |
| 9.3 Continuous selective portal triad clamping vs continuous portal triad clamping | 1 | | Odds Ratio (M‐H, Fixed, 95% CI) | 0.0 [0.0, 0.0] |
| 10 Total hospital stay Show forest plot | 10 | | Mean Difference (IV, Fixed, 95% CI) | Subtotals only |
|
| 10.1 Intermittent portal triad clamping vs control | 4 | 402 | Mean Difference (IV, Fixed, 95% CI) | 0.32 [‐0.64, 1.28] |
| 10.2 Continuous portal triad clamping vs continuous hepatic vascular exclusion | 1 | 52 | Mean Difference (IV, Fixed, 95% CI) | ‐8.0 [‐13.05, ‐2.95] |
| 10.3 Continuous selective hepatic vascular exclusion vs continuous portal triad clamping | 1 | 160 | Mean Difference (IV, Fixed, 95% CI) | ‐2.80 [‐4.13, ‐1.47] |
| 10.4 Intermittent portal triad clamping vs continuous portal triad clamping | 1 | 86 | Mean Difference (IV, Fixed, 95% CI) | 1.0 [‐2.82, 4.82] |
| 10.5 Intermittent portal triad clamping vs continuous selective portal triad clamping | 1 | 80 | Mean Difference (IV, Fixed, 95% CI) | ‐0.27 [‐1.60, 1.06] |
| 10.6 Intermittent selective portal triad clamping vs intermittent portal triad clamping | 2 | 138 | Mean Difference (IV, Fixed, 95% CI) | ‐0.67 [‐2.40, 1.06] |
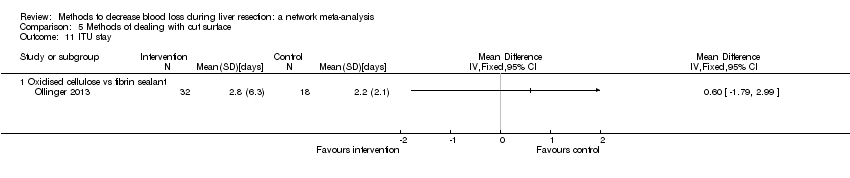
| 11 ITU stay Show forest plot | 1 | | Mean Difference (IV, Fixed, 95% CI) | Totals not selected |
|
| 11.1 Continuous selective hepatic vascular exclusion vs continuous portal triad clamping | 1 | | Mean Difference (IV, Fixed, 95% CI) | 0.0 [0.0, 0.0] |
| 12 Operating time Show forest plot | 12 | | Mean Difference (IV, Random, 95% CI) | Subtotals only |
|
| 12.1 Continuous portal triad clamping vs control | 2 | 40 | Mean Difference (IV, Random, 95% CI) | ‐45.87 [‐95.61, 3.87] |
| 12.2 Intermittent portal triad clamping vs control | 2 | 176 | Mean Difference (IV, Random, 95% CI) | 25.66 [‐31.57, 82.89] |
| 12.3 Continuous portal triad clamping vs continuous hepatic vascular exclusion | 2 | 170 | Mean Difference (IV, Random, 95% CI) | ‐29.32 [‐82.75, 24.10] |
| 12.4 Continuous selective hepatic vascular exclusion vs continuous portal triad clamping | 1 | 160 | Mean Difference (IV, Random, 95% CI) | ‐7.20 [‐63.42, 49.02] |
| 12.5 Continuous selective portal triad clamping vs continuous portal triad clamping | 1 | 120 | Mean Difference (IV, Random, 95% CI) | 20.0 [‐0.00, 40.00] |
| 12.6 Intermittent portal triad clamping vs continuous portal triad clamping | 1 | 35 | Mean Difference (IV, Random, 95% CI) | 13.40 [‐41.28, 68.08] |
| 12.7 Intermittent portal triad clamping vs continuous selective portal triad clamping | 1 | 80 | Mean Difference (IV, Random, 95% CI) | ‐32.17 [‐51.50, ‐12.84] |
| 12.8 Intermittent selective portal triad clamping vs intermittent portal triad clamping | 2 | 138 | Mean Difference (IV, Random, 95% CI) | 8.64 [‐10.16, 27.45] |