Desmopresina para disminuir la transfusión de sangre perioperatoria
Resumen
Antecedentes
La transfusión de sangre se administra durante muchos tipos de cirugías, pero cada vez se cuestiona más su eficacia y seguridad. Es necesario evaluar la eficacia de agentes como la desmopresina (DDAVP; 1‐deamino‐8‐D‐arginina‐vasopresina), que pueden reducir la pérdida de sangre perioperatoria.
Objetivos
Examinar la evidencia de la eficacia de la DDAVP para reducir la pérdida sanguínea perioperatoria y la necesidad de transfusión de eritrocitos en pacientes que no presentan trastornos hemorrágicos hereditarios.
Métodos de búsqueda
Se hicieron búsquedas de ensayos controlados aleatorizados (ECA) en el Registro Cochrane Central de Ensayos Controlados (Cochrane Central Register of Controlled Trials) (2017, número 3) en la Cochrane Library, MEDLINE (desde 1946), Embase (desde 1974), Cumulative Index to Nursing and Allied Health Literature (CINAHL) (desde 1937), la Transfusion Evidence Library (desde 1980), y en bases de datos de ensayos en curso (todas las búsquedas hasta 3 abril 2017).
Criterios de selección
Se incluyeron los ensayos controlados aleatorios que compararon DDAVP con placebo o un comparador activo (p.ej. ácido tranexámico, aprotinina) antes, durante o inmediatamente después de la cirugía o después de procedimientos invasivos en pacientes adultos o en niños.
Obtención y análisis de los datos
Se utilizaron los procedimientos metodológicos estándar previstos por Cochrane.
Resultados principales
Se identificaron 65 ensayos finalizados (3874 participantes) y un ensayo en curso. De los 65 ensayos completados, 39 se centraron en la cirugía cardíaca de adultos, tres en la cirugía cardíaca pediátrica, 12 en la cirugía ortopédica, dos en la cirugía plástica y dos en la cirugía vascular; siete estudios se realizaron en la cirugía para otras afecciones. Estos ensayos se realizaron entre 1986 y 2016 y 11 fueron financiados por compañías farmacéuticas o por un grupo con interés comercial en el resultado del ensayo.
La calidad de la evidencia según GRADE fue muy baja a moderada en los diferentes resultados. Ningún ensayo informó sobre la calidad de vida.
DDAVP versus placebo o ningún tratamiento
Los resultados del ensayo mostraron una heterogeneidad considerable entre los contextos quirúrgicos en el volumen total de eritrocitos transfundidos (evidencia de calidad baja) y en la pérdida sanguínea total (evidencia de calidad muy baja) debido a diferencias grandes en la pérdida sanguínea inicial. Por lo tanto, estos resultados no se agruparon y se informaron en subgrupos.
En comparación con el placebo, la DDAVP puede disminuir ligeramente el volumen total de glóbulos rojos transfundidos en la cirugía cardíaca en adultos (diferencia de medias (DM) ‐0,52 unidades, intervalo de confianza (IC) del 95%: ‐0,96 a ‐0,08 unidades; 14 ensayos, 957 participantes), pero puede dar lugar a poca o ninguna diferencia en la cirugía ortopédica (DM ‐0,02, IC del 95%: ‐0,67 a 0,64 unidades; seis ensayos, 303 participantes), la cirugía vascular (DM 0,06, IC del 95%: ‐0,60 a 0,73 unidades; dos ensayos, 135 participantes), o la cirugía hepática (DM ‐0,47, IC del 95%: ‐1,27 a 0,33 unidades; un ensayo, 59 participantes).
La DDAVP probablemente da lugar a poca o ninguna diferencia en el número total de participantes transfundidos con sangre (riesgos relativos (RR) 0,96; IC del 95%: 0,86 a 1,06; 25 ensayos; 1806 participantes) (evidencia de calidad moderada).
Si la DDAVP disminuye la pérdida total de sangre en la cirugía cardíaca en adultos (DM ‐135,24 ml, IC del 95%: ‐210,80 ml a ‐59,68 ml; 22 ensayos, 1358 participantes), la cirugía ortopédica (DM ‐285,76 ml, IC del 95%: ‐514.99 mL a ‐56,53 mL; cinco ensayos, 241 participantes), o la cirugía vascular (MD ‐582,00 mL, IC del 95%: ‐1264,07 mL a 100,07 mL; un ensayo, 44 participantes) es incierto porque la calidad de la evidencia es muy baja.
La DDAVP probablemente produce poca o ninguna diferencia en la mortalidad por todas las causas (odds‐ratio de Peto (pOR) 1,09, IC del 95%: 0,51 a 2,34; 22 ensayos, 1631 participantes) o en los eventos trombóticos (pOR 1,36, IC del 95%: 0,85 a 2,16; 29 ensayos, 1984 participantes) (ambos evidencia de baja calidad).
DDAVP versus placebo o ningún tratamiento en pacientes con disfunción plaquetaria
En comparación con el placebo, la DDAVP puede provocar una reducción del volumen total de glóbulos rojos transfundidos (DM ‐0,65 unidades, IC del 95%: ‐1,16 a ‐0,13 unidades; seis ensayos, 388 participantes) (evidencia de baja calidad) y de la pérdida total de sangre (DM ‐253,93 ml, IC del 95%: ‐408,01 ml a ‐99,85 ml; siete ensayos, 422 participantes) (evidencia de baja calidad).
La DDAVP probablemente da lugar a poca o ninguna diferencia en el número total de participantes que reciben una transfusión de glóbulos rojos (RR 0,83; IC del 95%: 0,66 a 1,04; cinco ensayos, 258 participantes) (evidencia de calidad moderada).
No se sabe si la DDAVP produce una diferencia en la mortalidad por todas las causas (pOR 0,72; IC del 95%: 0,12 a 4,22; siete ensayos; 422 participantes) o en los eventos trombóticos (pOR 1,58; IC del 95%: 0,60 a 4,17; siete ensayos, 422 participantes) porque la calidad de la evidencia es muy baja.
DDAVP versus ácido tranexámico
En comparación con el ácido tranexámico, la DDAVP puede aumentar el volumen de sangre transfundida (DM 0,6 unidades, IC del 95%: 0,09 a 1,11 unidades; un ensayo, 40 participantes) y la pérdida total de sangre (DM 142,81 ml, IC del 95%: 79,78 ml a 205,84 ml; dos ensayos, 115 participantes) (ambos evidencia de baja calidad).
No está claro si la DDAVP aumenta o reduce el número total de participantes a los que se les realiza una transfusión de sangre porque la calidad de la evidencia es muy baja (RR 2,42; IC del 95%: 1,04 a 5,64; tres ensayos, 135 participantes).
Ningún ensayo informó la mortalidad por todas las causas.
No se sabe con certeza si la DDAVP produce una diferencia en los eventos trombóticos porque la calidad de la evidencia es muy baja (pOR 2,92; IC del 95%: 0,32 a 26,83; dos ensayos, 115 participantes).
DDAVP versus aprotinina
Comparada con aprotinina, la DDAVP probablemente aumenta el número total de participantes a los que se les realiza una transfusión de sangre (RR 2,41; IC del 95%: 1,45 a 4,02; un ensayo, 99 participantes) (evidencia de calidad moderada).
Ningún ensayo informó el volumen de sangre transfundido ni la pérdida sanguínea total y el único ensayo que incluyó la mortalidad como resultado no informó muertes.
No se sabe con certeza si la DDAVP produce una diferencia en los eventos trombóticos porque la calidad de la evidencia es muy baja (pOR 0,98, IC del 95%: 0,06 a 15,89; dos ensayos, 152 participantes).
Conclusiones de los autores
La mayoría de la evidencia derivada de la comparación DDAVP versus placebo se obtuvo en la cirugía cardíaca, en la que la DDAVP se administró después de la revascularización cardiopulmonar. En los pacientes adultos sometidos a cirugía cardíaca, la reducción en el volumen de eritrocitos transfundidos y la pérdida sanguínea total fue pequeña y es poco probable que sea clínicamente importante. Está menos claro si la DDAVP puede tener efectos beneficiosos en los niños y en los pacientes sometidos a cirugía no cardíaca. Un área clave para los investigadores es examinar los efectos de la DDAVP en los pacientes con disfunción plaquetaria. Pocos ensayos han comparado la DDAVP con el ácido tranexámico o la aprotinina; por consiguiente, no se sabe a ciencia cierta la eficacia relativa de estas intervenciones.
PICO
Resumen en términos sencillos
Administración de desmopresina para la reducción de la necesidad de transfusión de sangre en pacientes sometidos a una operación
Pregunta de la revisión
¿La desmopresina (un fármaco que puede ser utilizado para prevenir la hemorragia) podría reducir la necesidad de transfusión de sangre cuando los pacientes son sometidos a una cirugía?
Antecedentes
La pérdida sanguínea es frecuente durante la cirugía mayor. Las transfusiones de sangre pueden reemplazar la sangre que se ha perdido. Los riesgos asociados con la transfusión de sangre incluyen reacciones contra la sangre e infección (en particular en los países de ingresos bajos y medios).
La desmopresina es un fármaco conocido habitualmente como DDAVP (una abreviatura de su nombre químico: 1‐deamino‐8‐D‐arginina vasopresina). Se utiliza en los pacientes que nacen con problemas que los ponen en riesgo de hemorragia y puede ayudar a los pacientes que no presentan trastornos hemorrágicos. La DDAVP puede tener efectos secundarios; por ejemplo, puede aumentar el riesgo de ataque cardíaco o accidente cerebrovascular, o causar baja presión arterial cuando se administra.
Características de los estudios
Se investigó si la DDAVP redujo la necesidad de transfusión de sangre en los pacientes sometidos a cirugía.
Se realizaron búsquedas en la literatura médica al 3 de abril de 2017. Se identificaron 65 ensayos relevantes con 3874 participantes (adultos y niños). Todos los ensayos evaluaron los efectos de administrar DDAVP antes, durante o inmediatamente después de la cirugía o de otros procedimientos menores como las biopsias. La mayoría de los ensayos se centraron en la cirugía del corazón en pacientes adultos, o en la cirugía de los huesos y las articulaciones. Menos ensayos se centraron en la cirugía del corazón en niños, la cirugía plástica, la cirugía en los vasos sanguíneos o la cirugía hepática. Los ensayos se realizaron entre 1986 y 2016. Once fueron financiados por compañías farmacéuticas o por un grupo con interés comercial en el resultado del ensayo.
Resultados clave
En comparación con el placebo (una sustancia inactiva que tiene el mismo aspecto que la sustancia que se está probando, es decir, DDAVP) o con la ausencia de tratamiento, la DDAVP puede reducir ligeramente la cantidad de sangre transfundida en la cirugía cardíaca de adultos. La DDAVP puede dar lugar a poca o ninguna diferencia en la cantidad de sangre transfundida en la cirugía del corazón en los niños, la cirugía de los huesos y las articulaciones, la cirugía en los vasos sanguíneos principales o la cirugía hepática. La DDAVP probablemente da lugar a poca o ninguna diferencia en el número total de pacientes que reciben una transfusión de sangre. No está claro si la DDAVP aumenta o reduce la pérdida total de sangre porque la calidad de la evidencia es muy baja. La DDAVP puede dar lugar a poca o ninguna diferencia en el riesgo de muerte, ataque cardíaco o accidente cerebrovascular.
En los pacientes que son más proclives a hemorragia porque toman algún fármaco antiplaquetario que impide que la sangre coagule normalmente, la DDAVP puede dar lugar a una reducción del volumen total de glóbulos rojos transfundidos y de la pérdida sanguínea total. Probablemente da lugar a poca o ninguna diferencia en el número de pacientes que reciben una transfusión de glóbulos rojos. No está claro si la DDAVP aumenta o reduce el riesgo de muerte, ataque cardíaco o accidente cerebrovascular porque la calidad de la evidencia es muy baja.
Comparada con ácido tranexámico (un fármaco utilizado para tratar o prevenir la pérdida excesiva de sangre) la DDAVP puede ser menos efectiva para reducir el volumen de sangre transfundida y la pérdida sanguínea total. No está claro si la DDAVP aumenta o reduce el número de pacientes que reciben una transfusión de sangre, ni el riesgo de muerte, ataque cardíaco o accidente cerebrovascular, porque la calidad de la evidencia es muy baja.
Comparada con aprotinina (otro fármaco utilizado para reducir la hemorragia), la DDAVP probablemente aumenta el número de pacientes que reciben una transfusión de sangre. No está claro si aumenta o reduce el riesgo de ataque cardíaco o accidente cerebrovascular porque la calidad de la evidencia es muy baja. Ningún ensayo que comparó DDAVP contra aprotinina informó el volumen de sangre transfundida, la pérdida sanguínea total ni el riesgo de muerte.
Ninguno de los 65 ensayos evaluó la calidad de vida.
Calidad de la evidencia
La calidad de la evidencia se consideró de muy baja a moderada para los resultados anteriores. Se consideró que muchos ensayos tuvieron alto riesgo de sesgo y se señaló la inconsistencia y la imprecisión en sus resultados.
Conclusión
En general, las diferencias en la transfusión y la pérdida sanguínea cuando los pacientes fueron tratados con DDAVP o placebo fueron pequeñas y es poco probable que sean clínicamente importantes. Es posible que los pacientes que son más proclives a hemorragia, como los que toman agentes antiplaquetarios, puedan tener más efectos beneficiosos con la DDAVP. Pocos ensayos compararon la DDAVP con el ácido tranexámico o la aprotinina; por consiguiente, no se sabe con certeza si la DDAVP es mejor o peor que estos agentes.
Authors' conclusions
Summary of findings
| Participant or population: participants undergoing surgery | ||||||
| Outcomes | Anticipated absolute effects* (95% CI) | Relative effect | No. of participants | Quality of the evidence | Comments | |
| Risk with placebo | Risk with desmopressin | |||||
| Red cell volume transfused (total) | Adult cardiac surgery: red cell volume transfused in the desmopressin group was 0.52 units less (0.96 fewer to 0.08 fewer units, 14 RCTs, 957 participants) | 1454 | ⊕⊕⊝⊝ | Data not pooled due to clinical heterogeneity and reported as subgroups | ||
| Orthopaedic surgery: red cell volume transfused in the desmopressin group was 0.02 units less (0.67 less to 0.64 more units, 6 RCTs, 303 participants) | ||||||
| Vascular surgery: red cell volume transfused in the desmopressin group was 0.06 units more (0.60 less to 0.73 more units, 2 RCTs, 135 participants) | ||||||
| Hepatic surgery: red cell volume transfused in the desmopressin group was 0.47 units less (1.27 less to 0.33 more units, 1 RCT, 59 participants) | ||||||
| Number of participants receiving a red cell transfusion (total) | 450 per 1000 | 436 per 1000 | RR 0.96 | 1806 | ⊕⊕⊕⊝ | |
| Blood loss (total) | Cardiac surgery: total blood loss in the desmopressin group was 135.24 mL less (210.8 mL to 59.68 mL less, 22 RCTs, 1358 participants). | 1643 | ⊕⊝⊝⊝ | Data not pooled owing to clinical heterogeneity and reported as subgroups | ||
| Orthopaedic surgery: total blood loss in the desmopressin group was 285.76 mL less (514.99 mL to 56.53 mL less, 5 RCTs, 241 participants) | ||||||
| Vascular surgery: total blood loss in the desmopressin group was 582 mL less (1264.07 mL less to 100.07 mL more, 1 RCT, 44 participants) | ||||||
| All‐cause mortality | 16 per 1000 | 17 per 1000 | pOR 1.09 (0.51 to 2.34) | 1631 | ⊕⊕⊝⊝ | |
| All thrombotic events (including myocardial infarction, ischaemic stroke, other arterial thromboembolism, and venous thromboembolism) | 34 per 1000 | 44 per 1000 | pOR 1.36 (0.85 to 2.16) | 1984 | ⊕⊕⊝⊝ | |
| Quality of life | Not reported | ‐ | (No studies) | ‐ | ||
| *The risk in the intervention group (and its 95% confidence interval) is based on the assumed risk in the comparison group and the relative effect of the intervention (and its 95% CI) | ||||||
| GRADE Working Group grades of evidence | ||||||
| aDowngraded one level due to risk of bias: inadequate reporting of blinding and incomplete outcome data bDowngraged one level for inconsistency: I2 = 66% cDowngraded one level for inconsistency: I2 = 73% and sensitivity analysis unable to determine cause of heterogeneity dDowngraded one level for suspected publication bias eDowngraded one level due to imprecision, as confidence intervals include both clinically important benefit and clinically important harm | ||||||
| Participant or population: participants with platelet dysfunction undergoing surgery | ||||||
| Outcomes | Anticipated absolute effects* (95% CI) | Relative effect | No. of participants | Quality of the evidence | Comments | |
| Risk with placebo | Risk with desmopressin | |||||
| Red cell volume transfused (total) | Red cell volume transfused was 2.6 units | Red cell volume transfused in the desmopressin group was 0.65 units less (1.16 less to 0.13 less) | ‐ | 388 | ⊕⊕⊝⊝ | |
| Number of participants receiving a red cell transfusion (total) | 541 per 1000 | 449 per 1000 | RR 0.83 | 258 | ⊕⊕⊝⊝ | |
| Blood loss (total) | Mean total blood loss was 1098 mL | Total blood loss in the desmopressin group was 253.93 mL less (408.01 mL less to 99.85 mL less) | ‐ | 422 | ⊕⊕⊝⊝ | |
| All‐cause mortality | 14 per 1000 | 10 per 1000 (2 to 59) | pOR 0.72 (0.12 to 4.22) | 422 | ⊕⊝⊝⊝ | |
| All thrombotic events (including myocardial infarction, ischaemic stroke, other arterial thromboembolism, and venous thromboembolism) | 32 per 1000 | 51 per 1000 | pOR 1.58 | 422 | ⊕⊝⊝⊝ | |
| Quality of life | Not reported | ‐ | (No studies) | ‐ | ||
| *The risk in the intervention group (and its 95% confidence interval) is based on the assumed risk in the comparison group and the relative effect of the intervention (and its 95% CI) | ||||||
| GRADE Working Group grades of evidence | ||||||
| aDowngraded one level for risk of bias bDowngraded one level for inconsistency due to variation in baseline level of transfusion and blood loss cDowngraded two levels for imprecision, as confidence intervals include clinically important benefit and clinically important harm with low background event rate dDowngraded one level for imprecision | ||||||
| Participant or population: participants undergoing surgery | ||||||
| Outcomes | Anticipated absolute effects* (95% CI) | Relative effect | No. of participants | Quality of the evidence | Comments | |
| Risk with tranexamic acid | Risk with desmopressin | |||||
| Red cell volume transfused (total) | Mean red cell volume transfused was 0.2 units | Red cell volume transfused in the desmopressin group was 0.6 units more (0.09 more to 1.11 more) | ‐ | 40 | ⊕⊕⊝⊝ | |
| Number of participants receiving a red cell transfusion (total) | 239 per 1000 | 578 per 1000 | RR 2.42 | 135 | ⊕⊝⊝⊝ | |
| Blood loss (total) | Mean blood loss was 270 mL | Total blood loss in the desmopressin group was 142.81 mL more (79.78 mL more to 205.84 mL more) | ‐ | 115 | ⊕⊕⊝⊝ | |
| All‐cause mortality | Not reported | ‐ | (No studies) | ‐ | ||
| All thrombotic events (including myocardial infarction, ischaemic stroke, other arterial thromboembolism, and venous thromboembolism) | 18 per 1000 | 51 per 1000 | RR 2.92 | 115 | ⊕⊝⊝⊝ | |
| Quality of life | Not reported | ‐ | (No studies) | ‐ | ||
| *The risk in the intervention group (and its 95% confidence interval) is based on the assumed risk in the comparison group and the relative effect of the intervention (and its 95% CI) | ||||||
| GRADE Working Group grades of evidence | ||||||
| aDowngraded one level for risk of bias bDowngraded one level for indirectness because most types of surgery or procedures were not represented by the included trials cDowngraded one level for imprecision owing to wide confidence intervals dDowngraded two levels for imprecision owing to very wide confidence intervals eOutcome not downgraded for indirectness because already downgraded three levels for other reasons | ||||||
| Participant or population: participants undergoing surgery | ||||||
| Outcomes | Anticipated absolute effects* (95% CI) | Relative effect | No. of participants | Quality of the evidence | Comments | |
| Risk with aprotinin | Risk with desmopressin | |||||
| Red cell volume transfused (total) | Not reported | ‐ | (No studies) | ‐ | ||
| Number of participants receiving a red cell transfusion (total) | 265 per 1000 | 639 per 1000 | RR 2.41 | 99 | ⊕⊕⊝⊝ | |
| Blood loss (total) | Not reported | ‐ | (No studies) | ‐ | ||
| All‐cause mortality | No deaths in either arm of the trial | Not estimable | 53 | ⊕⊝⊝⊝ | ||
| All thrombotic events (including myocardial infarction, ischaemic stroke, other arterial thromboembolism, and venous thromboembolism) | 14 per 1000 | 13 per 1000 | pOR 0.98 | 152 | ⊕⊝⊝⊝ | |
| Quality of life | Not reported | ‐ | (No studies) | ‐ | ||
| *The risk in the intervention group (and its 95% confidence interval) is based on the assumed risk in the comparison group and the relative effect of the intervention (and its 95% CI) | ||||||
| GRADE Working Group grades of evidence | ||||||
| aDowngraded one level for risk of bias bDowngraded one level for indirectness because most types of surgery or procedures were not represented by the included trials cDowngraded two levels for imprecision (no deaths in either arm) dNot downgraded for indirectness because already downgraded three levels for other reasons eDowngraded two levels for imprecision (very wide confidence intervals) | ||||||
Background
Red cell transfusion is common in the perioperative period for major surgery. Anaemia is known to be an independent predictor of poor outcomes following surgery (Carson 2002), but studies examining restrictive or liberal use of red cells in this setting have not found a clear beneficial effect for red cell transfusion (Holst 2015). Red cell transfusions are a biological product associated with risks such as infectious transmission and transfusion reactions (Delaney 2016). Consequently, agents that could reduce blood loss and the need for red cell transfusion are needed. Recent work has demonstrated the importance of alternative agents such as tranexamic acid, which reduces red cell transfusion requirements and mortality without increasing the risk of thrombotic events when administered perioperatively (Ker 2012). Desmopressin (also known as DDAVP, or 1‐deamino‐8‐D‐arginine vasopressin) has a potential role in this setting.
Description of the condition
Surgery
In 2014, people undergoing surgical procedures received 26.7% of the red cell units (12,318 units) transfused in the UK. The largest volumes of blood were transfused in cardiac surgery (6%; 2756 units), trauma (4.8%; 2193 units), orthopaedic surgery (3.9%; 1811 units), gastrointestinal surgery (3.8%; 1764 units), and vascular surgery (2.4%; 1091 units) (Tinegate 2016), with the remaining 5.8% transfused in surgery for other conditions. Blood loss is associated with increased mortality among people undergoing surgery and is associated with surgical complexity. The mortality risk of routine elective surgery is approximately 0.1%, rising to 1% to 2% for cardiac surgery and to 5% to 8% for vascular surgery (NICE 2014). Between 5% and 7% of people undergoing cardiac surgery lose more than two litres of blood, and 3.6% to 4.2% of people require a second operation (reoperation) to arrest the bleeding (NICE 2014). The need for reoperation is associated with a 4.5‐fold increase in risk of mortality (Mehta 2009), and blood loss of more than two litres is associated with an eight‐fold increase in risk of death (NICE 2014). Several key points apply in surgical operations for which an intervention such as DDAVP can be administered to prevent bleeding.
-
Anaesthetic induction: this involves the administration of a general anaesthetic or regional anaesthesia such as a spinal or epidural block and occurs before the operation.
-
First incision in the skin: the start of the operation.
-
Important time points during different types of operations.
-
Cardiac surgery: once the chest has been opened and the mediastinum accessed, cardiopulmonary bypass (CPB) is initiated. This diverts blood from the heart and lungs, allowing them to be operated on. Patients are given heparin (an anticoagulant drug), which reduces the risk of blood clot formation while patients are on the bypass machine but renders them vulnerable to bleeding. When the procedure is finished, heparin is reversed with protamine, and normal circulation is restored.
-
Vascular surgery: for some procedures, large vessels such as the aorta are cross‐clamped to allow visualisation of the operative field. When the clamps are removed and normal circulation restored, patients are at risk of blood loss from the newly perfused vessel and tributaries.
-
Orthopaedic surgery and plastic surgery: the blood supply to the limbs can be reduced temporarily by a tourniquet applied proximal to the area being operated on. Once the tourniquet is removed, normal blood flow returns, and this may lead to bleeding at the operative site.
-
-
Closure of the skin.
-
Postoperative recovery in an intensive care unit or a postoperative recovery ward depending on the type of surgery and any complications that may have arisen.
Interventional procedures
Risk of bleeding is much lower for interventional procedures such as liver or kidney biopsy than for surgical operations. For example, risk of bleeding following a transjugular liver biopsy is approximately 0.07% and risk of death is 0.09% (Kalambokis 2007). For these procedures, bleeding is not expected, and the aim of treatment with a drug such as DDAVP is to prevent bleeding, rather than to reduce the volume of blood loss. These procedures may be performed with imaging (such as ultrasound) used to guide the procedure or with the use of anatomical landmarks. Bleeding may be difficult to detect, or it may occur at a site where it cannot be easily arrested, and where mechanical compression cannot be applied. The short duration of these procedures means that drugs such as DDAVP are administered before the procedure is started.
Characteristics of people undergoing surgery that may make them vulnerable to bleeding
Particular challenges in preventing blood loss are associated with people with platelet dysfunction (e.g. those taking antiplatelet drugs such as aspirin, which inhibits the function of platelets and so makes these individuals more vulnerable to bleeding). Often antiplatelet agents cannot be stopped before an operation is performed because the procedure is urgent, or the risk of stopping the drug is considered too high (e.g. for those with a recent drug‐eluting coronary artery stent). Other patients who are vulnerable to bleeding include those with low platelet counts or abnormal blood clotting, and those taking anticoagulant drugs such as warfarin.
Description of the intervention
Desmopressin is a synthetic version of the naturally occurring hormone vasopressin. It is used most commonly for treatment of people with inherited bleeding disorders such as haemophilia A or von Willebrand disease, for whom it is administered at a dose of 0.3 μg/kg subcutaneously or intravenously. Desmopressin has been in use for more than 40 years and is a relatively inexpensive drug to administer. Increases in von Willebrand factor (vWF) and in factor VIII have the potential to increase the risk of arterial or venous thrombotic events; this is an important safety consideration (Franchini 2007). DDAVP also results in release of nitric oxide from endothelial cells, which can cause vasodilation with symptoms of facial flushing, tachycardia, and hypotension (Kaufmann 2003). In rare cases, DDAVP administration may be associated with hyponatraemia and seizures, particularly when it is administered to young children (Smith 1989).
DDAVP in clinical guidelines
DDAVP is commonly used for treatment of people with mild to moderate haemophilia A and von Willebrand disease and is recommended for treatment of some individuals with inherited platelet disorders (Estcourt 2017; Keeling 2008; Laffan 2014).
Outside the setting of inherited bleeding disorders, DDAVP is recommended by the following guidelines.
-
European guideline on management of major bleeding and coagulopathy following trauma: "We suggest that desmopressin (0.3 μg/kg) be administered in patients treated with platelet‐inhibiting drugs or with von Willebrand disease. We do not suggest that desmopressin be used routinely in the bleeding trauma patient" (Rossaint 2016).
-
American Society of Anesthesiologists (ASA): "Both the consultants and ASA members agree that, in patients with excessive bleeding and platelet dysfunction, consider the use of desmopressin" (American Society of Anesthesiologists 2015).
-
European Society of Anaethesiology: "Following discontinuation of CPB, patients with severe aortic stenosis or drug‐ or CPB‐induced platelet dysfunction may benefit from desmopressin" (Kozek‐Langenecker 2013).
-
Society of Thoracic Surgeons and Society of Cardiovascular Anesthesiologists Blood Conservation Clinical Practice Guidelines: "Use of 1‐deamino‐8‐D‐arginine vasopressin (DDAVP) may be reasonable to attenuate excessive bleeding and transfusion in certain patients with demonstrable and specific platelet dysfunction known to respond to this agent (e.g. uraemic or CPB‐induced platelet dysfunction, type I von Willebrand’s disease)" (Society of Thoracic Surgeons 2011).
How the intervention might work
Desmopressin stimulates the release of vWF from endothelial cells (Kaufmann 2003). vWF is essential for forming normal blood clots through platelet adhesion and aggregation following endothelial injury (Mannucci 2004). Increasing vWF levels for people undergoing surgery or invasive procedures may reduce the volume of blood that they lose (or may prevent them from losing blood), and consequently may reduce the need for red cell transfusion. vWF levels often rise naturally in response to stressful stimuli such as surgery, and the benefits of increasing vWF levels with DDAVP may vary according to baseline vWF levels. DDAVP takes approximately 30 minutes to reach peak effectiveness, and this effect lasts up to six to eight hours (Franchini 2007). Consequently, the timing of its administration in clinical trials assessing its efficacy is of key significance. Release of vWF also results in an increase in procoagulant factor VIII levels, as vWF prolongs the half‐life of factor VIII (Svensson 2014), which may promote haemostasis or thrombosis. Tissue plasminogen activator, a key promotor of fibrinolysis, is released from Weibel‐Palade bodies at the same time as vWF (Kaufmann 2003), and co‐administration of an antifibrinolytic agent may increase the efficacy of DDAVP.
Why it is important to do this review
The need to identify effective agents for reduction of blood loss and improvement of surgical outcomes is ongoing. This review is an update of a previous review (Carless 2004), and builds on the results of previous systematic reviews (Cattaneo 1995; Crescenzi 2008; Fremes 1994; Henry 1998; Laupacis 1997; Levi 1999). Desmopressin is a cheap drug that may provide particular benefit in countries where risk of infection or other adverse events from blood transfusion is high (Desborough 2016a). Currently, blood is not screened for transfusion‐transmitted infection in 39 countries, and only 47% of transfusions from low‐income countries are tested in laboratories with quality assurance. The risk of infection following transfusion in low‐income countries is higher than in high‐income countries: Recent figures show risk of 0.85% for HIV infection in low‐income countries compared with 0.002% in high‐income countries; similarly, 3.59% versus 0.02% for hepatitis B, and 1.07% versus 0.02% for hepatitis C (World Health Organization 2015). Other agents such as tranexamic acid are used increasingly to reduce surgical blood loss (Padhi 2015). Therefore, we will also examine trials that compared these agents directly with DDAVP to assess their relative efficacy.
See Published notes for prespecified changes to this review that were made prior to this update.
Objectives
To examine the evidence for the efficacy of DDAVP in reducing perioperative blood loss and the need for red cell transfusion in people who do not have inherited bleeding disorders.
Methods
Criteria for considering studies for this review
Types of studies
We included randomised controlled trials (RCTs) with no restriction on language or publication status.
Types of participants
We included adults or children undergoing any type of surgery or interventional procedure. We excluded trials that included participants with inherited bleeding disorders such as haemophilia A or von Willebrand disease. However we identified no randomised controlled trials that met our inclusion criteria in people with inherited bleeding disorders.
Types of interventions
We included trials that investigated subcutaneous or intravenous DDAVP. We did not include studies on intranasal DDAVP because this route of administration has much lower bioavailability and produces a reduced effect (Köhler 1988).
We considered:
-
trials that compared subcutaneous or intravenous DDAVP versus placebo or no active comparator; and
-
trials that compared subcutaneous or intravenous DDAVP versus an active comparator (such as tranexamic acid or aprotinin).
Types of outcome measures
Primary outcomes
-
Numbers of participants transfused with blood (during the procedure and within 30 days of the procedure)
-
Volume of blood transfused (expressed as total units of blood, or millilitres per kilogram for children) (during the procedure and within 30 days of the procedure)
-
Blood loss in millilitres per adult participant, or blood loss in millilitres per kilogram for children (during the procedure and within 30 days of the procedure)
Justification for timing of assessment
We anticipated that the timing of DDAVP administration would vary between trials, with some administering it preoperatively and others administering it during or after the operation. DDAVP has a relatively short duration of action and may provide greatest benefit during times when blood loss is greatest (e.g. intraoperatively). Consequently, we considered this to be a key time point. We anticipated that most trials would not specify the timing of their assessments for each of the primary outcomes, so we allowed a broad period for reporting. We reported the timing of this outcome assessment in the results section and in Table 1; assessment was performed most commonly up to 48 hours, and up to 72 hours in all but one case.
| Trial (country) | Number of participants | Surgery type | Cases | Antiplatelet agents | Anticoagulants (%) | Coagulopathy (%) | Thrombocytopenia (%) | Antifibrinolytics (%) | Transfusion protocol | Timing of blood loss or transfusion assessment (hours) |
| (Japan) | 9 | Cardiac | ‐ | ‐ | ‐ | ‐ | ‐ | ‐ | ‐ | 24 |
| (Japan) | 11 | Cardiac | ‐ | ‐ | ‐ | ‐ | ‐ | ‐ | ‐ | 24 |
| (Turkey) | 40 | Orthopaedic | Elective | ‐ | ‐ | ‐ | ‐ | ‐ | ‐ | 24 |
| (Sweden) | 19 | Cardiac | Elective | 0 | 0 | ‐ | ‐ | ‐ | ‐ | ‐ |
| (USA) | 83 | Cardiac | Elective | ‐ | ‐ | ‐ | ‐ | DDAVP: 2‐4a Placebo: 0 | ‐ | 24 |
| (Italy) | 135 | Cardiac | Elective | DDAVP: 38b Placebo: 43b | ‐ | DDAVP: 1‐5 Placebo: 1‐5 | ‐ | 100c | Yes | 24 |
| (USA) | 39 | Cardiac | Elective | DDAVP: 60b Placebo: 50b | ‐ | 0 | ‐ | ‐ | ‐ | 24 |
| (Spain) | 149 | Cardiac | Elective | DDAVP: 14b Placebo: 9‐8b Aprotinin: 14‐6b | 0 | 0 | ‐ | DDAVP: 0 Placebo: 0 Aprotinin: 100d | Yes | 24 |
| (China) | 96 | Cardiac | ‐ | ‐ | ‐ | ‐ | ‐ | ‐ | ‐ | 24 |
| (USA) | 91 | Vascular | Elective | 0 | ‐ | ‐ | ‐ | ‐ | ‐ | 72 |
| (France) | 92 | Cardiac | ‐ | 100e | ‐ | ‐ | 0 | DDAVP: 4‐3d Placebo: 13‐3d | Yes | 24 |
| (USA) | 101 | Cardiac | Elective | DDAVP: 52b Placebo: 66b 100f | DDAVP: 6 Placebo: 0 | ‐ | ‐ | DDAVP 50a Placebo 61a | No | 24 |
| (Germany) | 39 | Cardiac | Elective | 100b | 0 | 0 | ‐ | 0 | Yes | 24 |
| (Israel) | 30 | Orthopaedic | Elective | ‐ | ‐ | ‐ | ‐ | DDAVP: 0 TXA: 100c | Yes | 72 |
| (Sweden) | 12 | Orthopaedic | Elective | ‐ | ‐ | ‐ | ‐ | ‐ | ‐ | 24 |
| (Sweden) | 50 | Orthopaedic | Elective | ‐ | ‐ | ‐ | ‐ | ‐ | ‐ | ‐ |
| (USA) | 40 | Cardiac | Elective | 0 | 0 | 0 | 0 | ‐ | ‐ | 24 |
| (USA) | 59 | Cardiac | Elective | 100b | ‐ | ‐ | 0 | ‐ | ‐ | 24 |
| (Canada) | 30 | Orthopaedic | Elective | 0 | 0 | 0 | 0 | ‐ | Yes | 24 |
| (USA) | 20 | Maxillofacial | Elective | ‐ | ‐ | 0 | ‐ | ‐ | ‐ | 24 |
| (Canada) | 150 | Cardiac | Elective | DDAVP: 21‐6b Placebo: 14‐5b | ‐ | 0 | 0 | ‐ | ‐ | 24 |
| (Brazil) | 150 | Cardiac | ‐ | ‐ | ‐ | ‐ | ‐ | ‐ | ‐ | 72 |
| (Canada) | 62 | Cardiac | Elective | DDAVP: 38‐7b Placebo: 41.9b | ‐ | ‐ | ‐ | ‐ | ‐ | 18 blood loss 48 transfusion |
| (Turkey) | 20 | Cardiac | Emergency | 100b | ‐ | ‐ | ‐ | 0 | ‐ | 30 |
| (Turkey) | 34 | Cardiac | Emergency | 100b | ‐ | ‐ | ‐ | 100c | ‐ | 30 |
| (Turkey) | 28 | Cardiac | Emergency | 100b | ‐ | ‐ | ‐ | DDAVP: 0 TXA: 100c | ‐ | 30 |
| (USA) | 82 | Cardiac | Elective | ‐ | 0 | ‐ | ‐ | 0 | Yes | 12 |
| (USA) | 77 | Cardiac | Elective | ‐ | 0 | ‐ | ‐ | 100c | Yes | 12 |
| (USA) | 75 | Cardiac | Elective | ‐ | 0 | ‐ | ‐ | DDAVP: 0 TXA: 100c | Yes | 12 |
| (China) | 102 | Cardiac | Elective | ‐ | 0 | 0 | 0 | 100c | ‐ | 6 |
| (USA) | 36 | Orthopaedic | Elective | ‐ | 0 | ‐ | ‐ | ‐ | Yes | 24 |
| (USA) | 56 | Orthopaedic | Elective | ‐ | 0 | ‐ | ‐ | ‐ | Yes | 24 |
| (USA) | 35 | Cardiac | Elective | 0 | ‐ | ‐ | ‐ | ‐ | ‐ | 34 |
| (Finland) | 30 | Cardiac | Elective | 0 | 0 | ‐ | ‐ | ‐ | Yes | 16 |
| (USA) | 23 | Not reported | ‐ | ‐ | ‐ | ‐ | ‐ | ‐ | ‐ | ‐ |
| (South Korea) | 48 | Dialysis catheter | Elective | 100g | ‐ | ‐ | 0 | ‐ | ‐ | ‐ |
| (Finland) | 71 | Orthopaedic | Elective | 0 | 0 | 0 | ‐ | ‐ | Yes | 96 |
| (Sweden) | 50 | Vascular | Elective | 0 | 0 | 0 | ‐ | ‐ | Yes | ‐ |
| (Canada) | 30 | Orthopaedic | Elective | ‐ | ‐ | ‐ | ‐ | ‐ | ‐ | Intraoperative only |
| (Italy) | 162 | Kidney biopsy | Elective | 0 | 0 | ‐ | ‐ | ‐ | ‐ | 72 |
| (USA) | 65 | Cardiac | Elective | 0 | 0 | ‐ | ‐ | ‐ | Yes | 24 |
| (Netherlands) | 28 | Orthopaedic/Breast/Abdominal | Elective | 0 | 0 | 0 | 0 | ‐ | ‐ | 48 |
| (USA) | 86 | Cardiac | Elective | 0 | 0 | ‐ | ‐ | ‐ | Yes | 24 |
| (USA) | 29 | Cardiac | Elective | 100h | 0 | ‐ | ‐ | ‐ | Yes | 24 |
| (USA) | 60 | Paediatric cardiac | Elective | DDAVP: 9.7b Placebo: 3.4b | DDAVP: 6.5 Placebo: 6.9 | ‐ | ‐ | ‐ | No | 24 |
| (Turkey) | 66 | Cardiac | Elective | 0 | ‐ | 0 | ‐ | ‐ | Yes | 24 |
| (Norway) | 92 | Cardiac | Elective | 100b | 0 | 0 | 0 | DDAVP: 6.5c Placebo: 17.4c | Yes | 16 |
| (USA) | 27 | Cardiac | Elective | DDAVP: 28.6b Placebo: 38.5b | ‐ | 0 | 0 | ‐ | ‐ | 24 |
| (USA) | 95 | Paediatric cardiac | ‐ | ‐ | ‐ | ‐ | ‐ | ‐ | ‐ | 24 |
| (Spain) | 100 | Cardiac | Elective | ‐ | ‐ | 0 | 0 | ‐ | ‐ | 72 |
| (Spain) | 109 | Cardiac | Elective | ‐ | ‐ | 0 | 0 | DDAVP (1): 0 DDAVP (2): 0 Control: 0 Aprotinin: 100d | ‐ | 72 |
| (Finland) | 30 | Cardiac | Elective | 0 | 0 | 0 | ‐ | ‐ | Yes | 16 |
| (USA) | 70 | Cardiac | Elective | ‐ | ‐ | ‐ | ‐ | ‐ | ‐ | 24 |
| (Sweden) | 79 | Orthopaedic | Elective | 0 | 0 | 0 | 0 | ‐ | Yes | 24 |
| (Canada) | 60 | Paediatric cardiac | ‐ | ‐ | ‐ | ‐ | ‐ | ‐ | ‐ | 24 |
| (China) | 90 | Sinus | Elective | 0 | 0 | 0 | 0 | ‐ | ‐ | Intraoperative only |
| (Canada) | 44 | Cardiac | Elective | 100b | 0 | 0 | 0 | ‐ | ‐ | 24 |
| (UK) | 98 | Cardiac | Elective | DDAVP: 14.3b Placebo: 10.2b | 0 | ‐ | ‐ | ‐ | Yes | ˜24 |
| (Austria) | 43 | Cardiac | Elective | 100g | 0 | ‐ | ‐ | ‐ | Yes | 24 |
| (USA) | 83 | Cardiac | Elective | ‐ | ‐ | ‐ | ‐ | DDAVP: 20a Placebo: 30.2a | ‐ | 24 |
| (USA) | 21 | Orthopaedic | Elective | 0 | 0 | 0 | 0 | ‐ | Yes | 24 |
| (USA) | 23 | Plastic | Elective | ‐ | ‐ | ‐ | ‐ | ‐ | ‐ | 24 |
| (USA) | 21 | Plastic | Elective | ‐ | ‐ | ‐ | ‐ | ‐ | ‐ | 24 |
| (Hong Kong) | 59 | Hepatic | Elective | 0 | 0 | 0 | ‐ | ‐ | Yes | Intraoperative only |
| (Israel) | 40 | Orthopaedic | Elective | ‐ | 0 | ‐ | ‐ | DDAVP: 0 TXA: 100c | Yes | 12 |
Blank cells indicate that information was not reported in the original papers
aEpsilon‐aminocaproic acid
bAntiplatelet agents
cTranexamic acid
dAprotinin
eDefined as bleeding time greater than 10 seconds
fDefined as hemoSTATUS < 60%
gDefined as prolonged platelet function analyser‐100 closure time
hDefined as thromboelastography maximum clot amplitude < 50 mm
Secondary outcomes
-
Reoperation due to bleeding
-
Numbers of participants with any bleeding during the procedure and with any blood loss within 30 days of the procedure (low‐risk procedures only, such as drain insertions or biopsies). These data are reported separately from the other bleeding analyses because blood loss is not expected from these procedures, and consequently the outcome is dichotomous
-
All‐cause mortality within 30 days of the procedure
-
Risk of thrombotic events (arterial or venous):
-
myocardial infarction up to 30 days post infusion
-
stroke up to 30 days post infusion
-
venous thromboembolism up to 30 days post infusion
-
-
Serious adverse events (clinically important hypotension) within 30 days of the procedure
-
Quality of life
Search methods for identification of studies
The Systematic Review Initiative Information Specialist (CD) formulated new search strategies in collaboration with the Cochrane Injuries Review Group. We created a new search strategy (Appendix 1), rather than updating the search strategy used in the previous review (Carless 2004).
Electronic searches
We searched for RCTs in the following databases:
-
Cochrane Central Register of Controlled Trials (CENTRAL) (2017, Issue 3) in the Cochrane Library;
-
MEDLINE (OvidSP, 1946 to 3 April 2017);
-
PubMed (epublications only, to 3 April 2017);
-
Embase (OvidSP, 1974 to 3 April 2017);
-
Cumulative Index to Nursing and Allied Health Literature (CINAHL) (EBSCOhost, 1937 to 3 April 2017);
-
UK Blood Transfusion Services/Systematic Review Initiative (UKBTS/SRI) Transfusion Evidence Library (www.transfusionevidencelibrary.com) (1950 to 3 April 2017);
-
Web of Science: Conference Proceedings Citation Index‐Science (CPCI‐S) (Thomson Reuters, 1990 to 3 April 2017);
-
Latin American Caribbean Health Sciences Literature (LILACS) (BIREME/PAHO/WHO, 1982 to 3 April 2017);
-
IndMed (ICMR‐NIC, 1985 to 3 April 2017);
-
KoreaMed (KAMJE, 1997 to 3 April 2017);
-
PakMediNet (2001 to 3 April 2017).
We combined searches in MEDLINE, Embase, and CINAHL with adaptations of the Cochrane RCT search filters, as detailed in the Cochrane Handbook for Systematic Reviews of Interventions (Lefebvre 2011). We also searched ClinicalTrials.gov (clinicaltrials.gov), the World Health Organization (WHO) International Clinical Trials Registry (ICTRP ‐ apps.who.int/trialsearch), and the Hong Kong University Clinical Trials Register (www.hkuctr.com), to identify ongoing trials. We included the new search strategy in Appendix 1.
Searching other resources
We searched the bibliographies of eligible trials, review articles, and reports for further potentially relevant studies.
Data collection and analysis
Two review authors screened all electronically derived citations and abstracts of papers identified by the review search strategy. Two review authors assessed risk of bias in the included studies and extracted data independently.
Selection of studies
Two independent review authors (MD, LE) initially screened all electronically derived citations and abstracts of papers identified by the review search strategy for relevance. At this stage, we excluded studies that were clearly irrelevant. Two independent review authors (MD, LE) then formally assessed the full texts of all potentially relevant trials for eligibility against the criteria outlined above. We resolved all disagreements by discussion without the need to consult a third review author (SS). We used an article abstraction form to extract information regarding randomisation criteria, study methods, presence of a transfusion protocol, type of surgery, treatment outcomes, and general comments. We recorded the reasons why potentially relevant studies failed to meet the eligibility criteria.
Data extraction and management
We performed a new data extraction for all trials in this update of the review. Any two of the five review authors (MD, KO, CB, SB, LE) extracted data according to Cochrane guidelines (Higgins 2011a). Review authors resolved disagreements by consensus and were not blinded to names of study authors, institutions, journals, or trial outcomes. Papers not published in English were translated in their entirety, then data extracted in the usual way (Aida 1991a; Aida 1991b; Marczinski 2007). We discussed unclear data or entries directly with the translators. We extracted data from studies in duplicate using an online systematic review management tool (Covidence; www.covidence.org), then entered the data into Review Manager 5 (RevMan 2014). We collected the following data:
-
type of study (study design, number of arms, single centre or multicentre);
-
inclusion and exclusion criteria;
-
participants (number of participants randomised, number of participants analysed, age, gender, antiplatelet agents, anticoagulants, coagulopathy, thrombocytopenia, use of tranexamic acid);
-
details of surgery (type of surgery, duration of surgery, duration of cardiopulmonary bypass (if applicable), emergency or elective, use of cell salvage, use of a transfusion protocol);
-
interventions (DDAVP dose, route of administration, diluent, speed of administration, timing of administration);
-
comparators (type of comparator, route of administration, speed of administration, timing of administration);
-
outcomes (number of participants exposed to blood transfusion (expressed as whole blood or packed red cells), blood loss, reoperation for bleeding, number of participants experiencing postoperative complications (thrombosis, myocardial infarction, stroke), mortality, number of participants requiring reoperation due to bleeding, quality of life);
-
risk of bias (see Assessment of risk of bias in included studies).
When the standard error of the mean was reported, we derived the standard deviation.
Assessment of risk of bias in included studies
We performed an assessment of all RCTs using the Cochrane 'Risk of bias' tool according to Chapter 8 of the Cochrane Handbook for Systematic Reviews of Interventions (Higgins 2011b). Any two of the five review authors (MD, KO, CB, SB, LE) worked independently to assess each element of potential bias listed below as 'high', 'low', or 'unclear risk of bias'. We considered a trial to be at low risk of bias overall if we judged it to have no high‐risk domains, and if we judged at least half of the domains to be at low risk of bias. In the Characteristics of included studies table we provided a brief description of the judgement statements upon which review authors assessed potential bias. We ensured that we reached consensus on the degree of risk of bias by comparing review authors' statements and, when necessary, by consulting with a third review author. The Cochrane tool for assessing risk of bias includes the following domains:
-
selection bias: random sequence generation and allocation concealment;
-
performance bias: blinding of participants and personnel;
-
detection bias: blinding of outcome assessment;
-
attrition bias: incomplete outcome data;
-
reporting bias: selective reporting;
-
other bias.
Measures of treatment effect
-
For continuous outcomes, we recorded the mean, standard deviation, and total numbers of participants in both treatment and control groups. For dichotomous outcomes, we recorded numbers of events and total numbers of participants in both treatment and control groups.
-
For continuous outcomes, using the same scale, we performed analyses based on the mean difference (MD) with 95% confidence intervals (CIs).
-
For dichotomous outcomes, we reported the pooled risk ratio (RR) with 95% CI. When the number of observed events was small (< 5% of sample per group), and when trials included balanced treatment groups, we reported Peto's odds ratio (pOR) with 95% CI (Deeks 2011).
-
When data allowed, we undertook quantitative assessments using Review Manager 5 (RevMan 2014).
-
When we could not report available data in any of the formats described above, we provided a narrative report and, when appropriate, presented the data in tables.
Unit of analysis issues
We treated trials with three or more arms in accordance with advice given in Chapter 16 of the Cochrane Handbook for Systematic Reviews of Interventions (Higgins 2011c). For studies with multiple treatment groups, two review authors excluded subgroups that were considered irrelevant to the analysis. We tabulated all subgroups in the Characteristics of included studies section. When appropriate, we combined groups to create a single pair‐wise comparison. When this was not possible, we selected the most appropriate pair of interventions and excluded the others (Higgins 2011c). We identified no cross‐over trials, but for future updates, if we identify them, we plan to establish whether assessment of outcome measures occurred before the cross‐over, and we will include outcomes assessed after the cross‐over if they are not biased by treatment provided before the cross‐over. We will examine each trial individually to determine this eventuality. We did not find any relevant cluster‐randomised trials, but for future updates of this review, we plan to analyse cluster‐randomised trials at the individual participant level, accounting for the cluster design, and to seek statistical advice.
Dealing with missing data
When data were identified as missing or unclear in published literature, we contacted study authors directly. This practice was limited to contacting authors of studies published in the past ten years. We recorded the number of participants lost to follow‐up for each study and analysed data on an intention‐to‐treat (ITT) basis (Higgins 2011c).
Assessment of heterogeneity
When we considered studies to be sufficiently homogenous in study design, we conducted meta‐analysis and assessed statistical heterogeneity of treatment effects between trials by using a Chi2 test with a significance level at P < 0.1 (Deeks 2011). We used the I2 statistic to quantify possible heterogeneity (I2 > 50% moderate heterogeneity, I2 > 80% considerable heterogeneity). When necessary, we explored potential causes of heterogeneity by conducting sensitivity and subgroup analyses.
Assessment of reporting biases
We explored potential publication bias (small‐trial bias) by generating a funnel plot and by using a modified Harbord test for dichotomous outcomes (Harbord 2006), and an Egger's test for continuous outcomes (Egger 1997). We considered a P value < 0.1 as statistically significant for this test (Sterne 2011).
Data synthesis
We performed analyses according to recommendations provided in Chapter 9 of the Cochrane Handbook for Systematic Reviews of Interventions, using aggregated data for analysis (Deeks 2011). For statistical analysis, we entered data into Review Manager 5 software (RevMan 2014). One review author (MD) entered the data, and a second (KO) checked the data for accuracy. When meta‐analysis was feasible, we used the random‐effects model for pooling data. We used the Mantel‐Haenszel method for dichotomous outcomes, and the inverse variance method (or standardised mean difference as necessary) for continuous outcomes. In cases for which events were rare and appropriate conditions were satisfied, we used Peto's odds method. We converted transfused blood volume expressed in millilitres (mL) to units by assuming 300 mL to be equivalent to one unit of blood (Walters 2016), as was done in the previous review (Carless 2004).
Trial sequential analysis (TSA)
We provided a sample size estimate showing how many participants needed to be included in a meta‐analysis for it to produce reliable results. We used trial sequential methods to explore all treatment effects attained before the required sample size was reached, by using TSA v0.9 software (TSA 2011). We sequenced trials by first publication date of the full articles. This provided the required information size (the total number of participants) necessary to detect a statistically significant underlying effect. We applied trial sequential analysis to the following outcomes:
-
total volume of blood transfused (analysed in subgroups only);
-
number of participants transfused with blood;
-
total blood loss (analysed in subgroups only).
We estimated total volume of blood transfused and total blood lost by calculating the mean across the control arms of the trials. We calculated transfusion requirements in this population using the proportion of participants in the control group who were transfused. We calculated the information size necessary for a relative risk reduction of 15%, equivalent to the minimum clinically relevant effect size described for prophylactic use of tranexamic acid before surgery (Henry 2011; Ker 2012). When calculated cumulative Z‐curves crossed trial sequential monitoring boundaries, we determined that statistical significance had been reached and the overall type I error rate had been maintained. We produced futility boundaries such that if the cumulative Z‐curve crossed the futility threshold, evidence showed that the two treatments did not differ more than the anticipated effect size. We used the O'Brien Fleming alpha‐spending function with an overall type I error rate of 5% and with 80% statistical power to derive two‐sided sequential monitoring and futility boundaries. We adjusted estimates according to calculated diversity (D2). We calculated variance empirically and used a model variance‐based heterogeneity correction. We performed TSA only for outcomes reported by two or more trials.
Subgroup analysis and investigation of heterogeneity
When clinical and methodological characteristics of individual studies were sufficiently homogeneous, we combined the data to perform a meta‐analysis. We assessed statistical heterogeneity of treatment effects between studies using a Chi2 test with a statistical significance level at P < 0.1. We used the I2 statistic to quantify the degree of potential heterogeneity and classified heterogeneity as moderate if I2 was greater than 50%, and as considerable if I2 exceeded 80%. We assessed potential causes of heterogeneity by conducting sensitivity and subgroup analyses (Deeks 2011). We performed subgroup analyses for each of the following categories to assess effects on heterogeneity:
-
type of surgery or procedure;
-
age of participant (paediatric cardiac surgery defined as a separate subgroup);
-
preoperative administration of DDAVP;
-
inclusion of 75% or more participants with platelet dysfunction (measured by bleeding time or platelet function analyser 100) or taking antiplatelet agents, or both;
-
inclusion of 75% or more participants taking an antifibrinolytic agent.
We intended to investigate subgroups of participants with liver disease or kidney disease with uraemia, but the trials included in this review did not report these subgroups.
Sensitivity analysis
We assessed the robustness of our findings by performing the following sensitivity analyses when data were sufficient. We included only those trials:
-
with a ‘low risk of bias’ (defined as trials with no high risk of bias domains and at least half of the remaining domains considered to be at low risk of bias);
-
that used autologous cell salvage (red cell transfusion and bleeding outcomes only);
-
with a transfusion protocol;
-
published as full‐text papers;
-
with less than 20% dropout; and
-
that had been prospectively registered in a trial database, if the study was published during 2010 or more recently.
Summary of findings
We used the GRADE approach to create a 'Summary of findings' table, as suggested in Chapters 11 and 12 of the Cochrane Handbook for Systematic Reviews of Interventions (Schünemann 2011a; Schünemann 2011b). We used the GRADE approach to rate the quality of evidence as 'high', 'moderate', 'low', or 'very low', according to the following five GRADE considerations:
-
risk of bias: serious or very serious;
-
inconsistency: serious or very serious;
-
indirectness: serious or very serious;
-
imprecision: serious or very serious; and
-
publication bias: likely or very likely.
Outcomes included were:
-
total volume of blood transfused;
-
total number of participants transfused with blood;
-
total blood loss;
-
overall mortality up to 30 days post infusion;
-
risk of thrombotic events (arterial or venous); and
-
quality of life.
Results
Description of studies
See Characteristics of included studies; Characteristics of excluded studies; and Characteristics of ongoing studies.
Results of the search
Database searches for the 2017 update identified 2578 records, and searching the references of other records revealed one additional record. We reduced these to 1877 after removing duplicates. Two review authors (MD, LE) screened these records according to the criteria defined above and excluded 1760 records that were not RCTs or were clearly outside the scope of this review (see PRISMA diagram; Figure 1). We obtained the full text of the remaining 117 records and excluded 33 of them. We divided multi‐arm trials into separate trials, which yielded 70 studies with 84 records: 65 completed trials (Aida 1991a; Aida 1991b; Alanay 1999; Andersson 1990; Ansell 1992; Bignami 2016; Brown 1989; Casas 1995; Chuang 1993; Clagett 1995; de Prost 1992; Despotis 1999; Dilthey 1993; Ellis 2001; Flordal 1991; Flordal 1992; Frankville 1991; Gratz 1992; Guay 1992; Guyuron 1996; Hackmann 1989; Hajjar 2007; Hedderich 1990; Hemșinli 2012a; Hemșinli 2012b; Hemșinli 2012c; Horrow 1991a; Horrow 1991b; Horrow 1991c; Jin 2015; Karnezis 1994a; Karnezis 1994b; Kobrinsky 1987; Kuitunen 1992; Lazarchick 1995; Lee 2010; Leino 2010; Lethagen 1991; Letts 1998; Manno 2011; Marczinski 2007; Marquez 1992; Mongan 1992a; Mongan 1992b; Oliver 2000; Ozkisacik 2001; Pleym 2004; Reich 1991; Reynolds 1993; Rocha 1988; Rocha 1994; Salmenpera 1991; Salzman 1986; Schott 1995; Seear 1989; Shao 2015; Sheridan 1994; Spyt 1990; Steinlechner 2011; Temeck 1994; Theroux 1997; Wingate 1992a; Wingate 1992b; Wong 2003; Zohar 2001); four ongoing trials (ISRCTN12845429; NCT00885924; NCT01982760; NCT02084342); and one trial awaiting classification (Jahangirifard 2017).
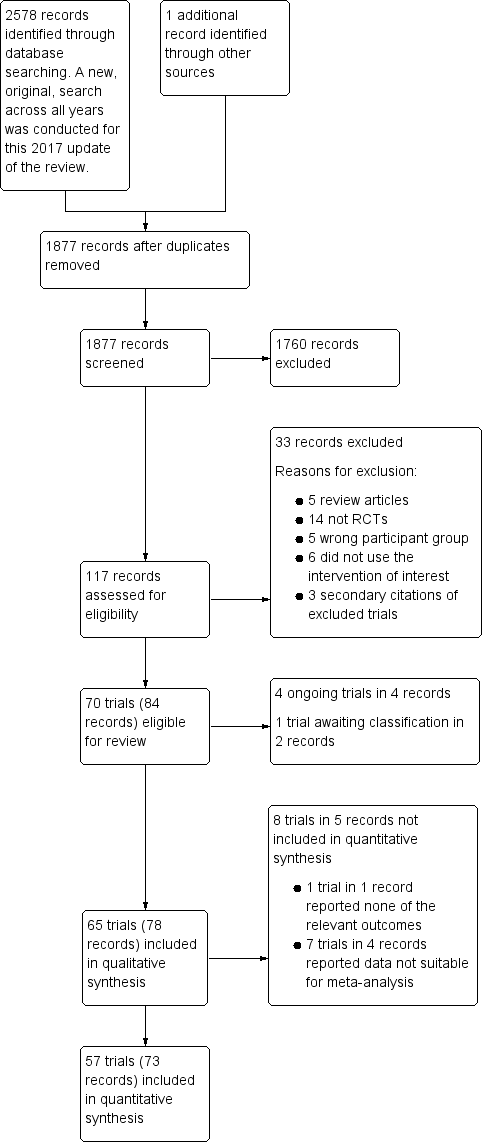
Study flow diagram.
Included studies
See Characteristics of included studies for full details of each study.
Design
We included 65 completed trials in the qualitative synthesis.
-
Sixty trials were published as full‐text articles, four were reported in abstract form only (Hajjar 2007; Hemșinli 2012a; Hemșinli 2012b; Hemșinli 2012c), and one was published as full text but, despite a worldwide search, the original text could not be found, so we extracted data from the abstract (Chuang 1993).
-
Trials were published between 1986 and 2016.
-
Two trials were published in Japanese (Aida 1991a; Aida 1991b), one in Chinese (Chuang 1993), and one in Dutch (Marczinski 2007). The remaining 61 trials were published in English.
-
One three‐arm trial compared DDAVP versus placebo and aprotinin (Casas 1995), and another compared DDAVP versus placebo and tranexamic acid (Ellis 2001): DDAVP was compared with each comparator in separate analyses. Two trials compared two different doses of DDAVP versus placebo (Leino 2010; Marquez 1992): for these trials, the dose closest to a single intravenous dose of 0.3 μg/kg was used for DDAVP versus placebo analyses. One four‐arm trial compared two doses of DDAVP versus placebo and aprotinin (Rocha 1994): the dose closest to a single intravenous dose of 0.3 μg/kg was used for DDAVP versus placebo and DDAVP versus aprotinin analyses. Four four‐arm trials were split into two, two‐arm trials, each comparing DDAVP versus placebo (Aida 1991a; Aida 1991b; Karnezis 1994a; Karnezis 1994b; Mongan 1992a; Mongan 1992b; Wingate 1992a; Wingate 1992b). Two four‐arm trials compared DDAVP versus placebo, tranexamic acid, and a combination of tranexamic acid and DDAVP. These were split into the following comparisons:
-
DDAVP versus placebo (Hemșinli 2012a; Horrow 1991a), and DDAVP plus tranexamic acid versus tranexamic acid (Hemșinli 2012b; Horrow 1991b); all analysed in the DDAVP versus placebo comparison, as the only difference between arms was the presence, or absence, of DDAVP).
-
DDAVP versus tranexamic acid (Hemșinli 2012c; Horrow 1991c).
-
-
The remaining 46 trials were parallel‐group two‐arm trials.
-
Two trials were multi‐centre trials (Ansell 1992; Bignami 2016), and whether four other trials were single‐centred or multi‐centred remains unclear (Hajjar 2007; Hedderich 1990; Letts 1998; Pleym 2004). The remaining 59 trials were single‐centre studies.
Sample sizes
The trials included 3874 participants, with numbers ranging from nine participants in Aida 1991a to 162 in Manno 2011.
Setting
In Table 1 we summarised full details of the countries where the trials were performed: 24 trials were conducted in the USA; six in Canada; five in Sweden; five in Turkey; three in China; three in Finland; three in Spain; two in Israel; two in Japan; two in Italy; and one each in Austria, Brazil, France, Germany, Hong Kong, the Netherlands, Norway, South Korea, and the UK.
Participants
We outlined characteristics of trial participants in Table 1.
-
Settings: 39 trials were in cardiac surgery; 12 in orthopaedic surgery; three in paediatric cardiac surgery; two in plastic surgery; two in vascular surgery; and one each in dialysis catheter insertion, hepatic surgery, kidney biopsy, maxillofacial surgery, and sinus surgery. One trial included a combination of participants undergoing orthopaedic, breast, and abdominal surgery, and one trial did not report the types of surgery included.
-
Fifty‐four trials reported elective surgery or procedures; three trials reported emergency surgery; and eight trials provided insufficient information to reveal whether surgery was elective or emergency in nature.
-
We had access to unpublished data from one trial and were able to extract data for a subgroup with platelet dysfunction (Bignami 2016). Seventeen trials did not include participants with platelet dysfunction; four trials included 0.1% to 25% of participants with platelet dysfunction; three trials included 25.1% to 50% with platelet dysfunction; one trial included 50.1% to 75% with platelet dysfunction; and 12 trials included 75.1% to 100% with platelet dysfunction. Twenty‐eight trials provided no information on the number of participants with platelet dysfunction.
-
Thirty trials did not include participants taking an anticoagulant drug; two trials included up to 10% of participants taking anticoagulants; no trials included more than 10% of participants taking an anticoagulant drug. Thirty‐three trials provided no information about the number of participants taking anticoagulant drugs.
-
Twenty‐two trials did not include participants with a coagulopathy, and one trial reported a single participant with a coagulopathy in each arm. Forty‐two trials provided no information about the number of participants with coagulopathies.
-
Sixteen trials did not include participants with thrombocytopenia, and 49 trials provided no information on the number of participants with thrombocytopenia.
-
Three trials included no participants who received an antifibrinolytic agent; three included 0.1% to 25% of participants taking antifibrinolytic agents; one included 25.1% to 50% taking antifibrinolytic agents; one included 50.1% to 75% taking antifibrinolytic agents; and four included more than 75% of participants taking antifibrinolytic agents. Six trials compared DDAVP directly with an antifibrinolytic agent, and in these trials, no participants in the DDAVP arm received an antifibrinolytic agent. Forty‐seven trials provided no information about whether participants received an antifibrinolytic agent.
-
Two trials did not use autologous cell salvage; 13 trials used autologous cell salvage for all participants; and 50 trials did not report whether autologous cell salvage was used.
-
Two trials did not use a transfusion protocol, and transfusion decisions were made at the discretion of the treating physician; 26 used a transfusion protocol to guide transfusion decisions; and 37 trials did not report whether a transfusion protocol was used to guide transfusion decisions.
-
Seven trials included only children (Guay 1992; Kobrinsky 1987; Letts 1998; Oliver 2000; Reynolds 1993; Seear 1989; Theroux 1997); and in six trials it was unclear whether participants were children or adults (Guyuron 1996; Hajjar 2007; Lazarchick 1995; Temeck 1994; Wingate 1992a; Wingate 1992b). The remaining 52 trials included only adults.
Interventions
We reported full details of interventions for each trial in Characteristics of included studies and summarised these details in Table 2.
| Trial | DDAVP dose(s) (μg/kg) | Timing of dose | Timing summary | Comparator(s) |
| Preoperative DDAVP | ||||
| 0.3 | Induction of anaesthesia | Preoperative | Placebo | |
| 0.3 (× 2) | At start of surgery and again after 6 hours | Preoperative | Placebo | |
| 0.3 (× 2) | At start of surgery and again after 6 hours | Preoperative | Placebo | |
| 10 μg/m2 | At time of first skin incision | Preoperative | Placebo | |
| 20 μg | 30 minutes preoperatively | Preoperative | Placebo | |
| 10 μg/m2 | Immediately after induction of anaesthesia | Preoperative | Placebo | |
| 0.3 | After anaesthetic induction | Preoperative | Placebo | |
| 0.3 | Not reported | Preoperative | Placebo | |
| 0.4 | At start of surgery | Preoperative | Placebo | |
| DDAVP 0.2 μg/kg | ||||
| 0.3 | Immediately before start of operation | Preoperative | Placebo | |
| 10 μg/m2 | Immediately after induction of anaesthesia | Preoperative | Placebo | |
| 0.3 | 1 hour before biopsy | Preoperative | Placebo | |
| 15 μg to 45 μg depending on weight | Not reported | Preoperative | Placebo | |
| 0.3 (× 2) | Post induction of anaesthesia and again after 6 hours | Preoperative | Placebo | |
| 0.3 | After induction of anaesthesia | Preoperative | Placebo | |
| 0.3 | After induction of anaesthesia | Preoperative | Placebo | |
| 0.3 | Not reported | Preoperative | Placebo | |
| 0.3 | After induction of anaesthesia | Preoperative | Placebo | |
| 0.3 | After induction of anaesthesia | Preoperative | Placebo | |
| 0.3 | After induction of anaesthesia | Preoperative | Placebo | |
| DDAVP administered at end of operation | ||||
| 0.3 | 15 minutes after reversal of heparin | End of operation | Placebo | |
| 0.3 | 15 minutes after reversal of heparin | End of operation | Placebo | |
| 0.3 | 15 minutes after reversal of heparin | End of operation | Placebo | |
| 0.3 | Immediately after reversal of heparin | End of operation | Placebo | |
| 0.3 | In event of excessive bleeding, after reversal of heparin | End of operation/postoperative | Placebo | |
| 0.3 | Immediately after reversal of heparin | End of operation | Placebo | |
| 0.3 | Immediately after reversal of heparin | End of operation | Placebo | |
| Aprotinina | ||||
| 0.3 | 60 minutes after reversal of heparin | End of operation | Placebo | |
| 20 μg | 15 minutes after heparinisation and before aortic cross‐clamp application | End of operation | Placebo | |
| 0.4 | Unclear | End of operation | Placebo | |
| 0.3 | 5 minutes after reversal of heparin | End of operation | Placebo | |
| 0.3 | Before removal of tourniquet | End of operation | Placebo | |
| Tranexamic acidb | ||||
| 0.3 | 5 minutes after reversal of heparin | End of operation | Placebo | |
| 0.3 | Immediately after reversal of heparin | End of operation | Placebo | |
| 0.3 | Immediately after reversal of heparin | End of operation | Placebo | |
| 0.3 | Immediately after surgery | End of operation | Placebo | |
| 0.3 | Immediately after reversal of heparin | End of operation | Placebo | |
| 0.3 | Immediately after reversal of heparin | End of operation | Placebo | |
| 0.3 | Immediately after reversal of heparin | End of operation | Placebo | |
| 0.3 | Immediately after reversal of heparin | End of operation | Tranexamic acidc | |
| 0.3 | Before cardiac rewarming | End of operation | Placebo | |
| 0.3 | 30 minutes before closure of wound | End of operation | Placebo | |
| 0.3 | 30 minutes before closure of wound | End of operation | Placebo | |
| 0.3 | Immediately after reversal of heparin | End of operation | Placebo | |
| DDAVP 0.3 μg/kg × 2 | ||||
| 0.3 | After reversal of heparin and before chest closure | End of operation | Placebo | |
| 0.3 | After reversal of heparin and before chest closure | End of operation | Placebo | |
| 0.3 | 10 minutes after reversal of heparin | End of operation | Placebo | |
| 0.3 | After reversal of heparin (timing unclear) | End of operation | Placebo | |
| 0.3 | Immediately after reversal of heparin | End of operation | Placebo | |
| 0.3 | 15 minutes after reversal of heparin | End of operation | Placebo | |
| 0.3 | 5 minutes after reversal of heparin | End of operation | Placebo | |
| 0.3 | Immediately after reversal of heparin | End of operation | Placebo | |
| 0.3 | Immediately after reversal of heparin | End of operation | Standard care | |
| Aprotinind | ||||
| DDAVP 0.3 μg/kg × 2 | ||||
| 0.3 | Via pulmonary artery catheter immediately after sternal closure | End of operation | Placebo | |
| 0.3 | Immediately after reversal of heparin | End of operation | Placebo | |
| 0.3 | After reversal of heparin (timing unclear) | End of operation | Placebo | |
| 10 μg/m2 | After reversal of heparin (timing unclear) | End of operation | Placebo | |
| 0.3 | After reversal of heparin (timing unclear) | End of operation | Placebo | |
| 0.3 | After reversal of heparin (timing unclear) | End of operation | Placebo | |
| 0.3 | 30 minutes before deflation of tourniquet | End of operation | Tranexamic acidb | |
| DDAVP administered postoperatively | ||||
| 0.3 | Between end of operation and 6 hours postoperatively | Postoperative | Placebo | |
| 0.3 | Immediately after sternal closure | Postoperative | Placebo | |
| Timing of DDAVP administration unclear | ||||
| 0.3 | Not reported | Not clear | Standard care | |
| 0.3 | Not reported | Not clear | Standard care | |
| 0.3 | Not reported | Not clear | Tranexamic acidc | |
aAprotinin 2 million KIU in 200 mL preoperatively, 2 million KIU in 200 mL in fluid prime, 500,000 KIU in 50 mL/h from skin incision to skin closure
bTranexamic acid 15 mg/kg 30 minutes before tourniquet removed over 30 minutes, then 10 mg/kg/h until 12 hours after tourniquet deflated
cTranexamic acid 10 mg/kg loading dose after induction of anaesthesia and before first skin incision over 30 minutes, then 1 mg/kg/h for 10 hours
dAprotinin 2 million KIU within 30 minutes after induction of anaesthesia followed by a continuous infusion of 500,000 KIU/h until the patient left the operating room, plus an additional bolus of 2 million KIU aprotinin in the pump prime by replacement of crystalloid solution
Abbreviation
KIU: kilounits
-
Fifty‐two trials used a single dose of 0.3 μg/kg DDAVP intravenously; one trial used a single dose of 0.4 μg/kg DDAVP intravenously; four trials administered two doses of 0.3 μg/kg DDAVP intravenously six hours apart; one trial included two different doses of intravenous DDAVP (0.2 μg/kg and 0.4 μg/kg); four trials administered one dose of 10 μg/m2 body surface area DDAVP intravenously; two trials administered 20 μg DDAVP intravenously to all participants; and one trial administered a single dose of 15 μg to 45 μg DDAVP intravenously (depending on body weight).
-
Timing of administration varied between trials, with 20 trials administering DDAVP preoperatively; 39 trials administered DDAVP shortly before the end of the operation; two administered DDAVP postoperatively; and one administered it shortly before the end of the operation, or postoperatively in the event of excessive bleeding. Three trials did not report when DDAVP was administered.
Comparators
We reported full details of comparators for each trial in Characteristics of included studies and summarised these details in Table 2.
-
Fifty‐four two‐arm trials used a matching placebo as a comparator, most commonly 0.9% saline.
-
One trial compared DDAVP versus tranexamic acid.
-
One three‐arm trial compared two different doses of DDAVP versus placebo.
-
One three‐arm trial compared DDAVP versus tranexamic acid and placebo.
-
One three‐arm trial compared DDAVP versus aprotinin and placebo.
-
One four‐arm trial compared two different doses of DDAVP versus aprotinin or standard care.
-
Two four‐arm trials (each split into three two‐arm trials) compared DDAVP versus tranexamic acid, placebo, and a combination of DDAVP and tranexamic acid.
Outcomes
We included full details of trial outcomes in Characteristics of included studies. No trial reported all outcomes of interest. One trial did not report any outcomes of interest for this review (Lazarchick 1995).
-
Eleven trials reported volume of blood transfused intraoperatively.
-
Forty‐one trials reported total volume of blood transfused.
-
Six trials reported the number of participants transfused with blood intraoperatively.
-
Twenty‐eight trials reported the total number of participants transfused with blood.
-
Seventeen trials reported intraoperative blood loss.
-
Fifty‐two trials reported total blood loss.
-
One trial reported the number of participants undergoing interventional procedures with intraoperative bleeding.
-
One trial reported the number of participants undergoing interventional procedures with any bleeding.
-
Twenty‐four trials reported the number of participants undergoing reoperation due to bleeding.
-
Twenty‐two trials reported overall mortality.
-
Thirty‐one trials reported thrombotic disease (arterial or venous).
-
Eighteen trials reported clinically important hypotension.
-
No trials reported quality of life.
Baseline level of bleeding and red cell transfusion
The baseline total volume of red cell transfusion varied between trials, with a range in the placebo arms of 0.7 units in Wong 2003, to 6.6 units in Chuang 1993. Likewise, the proportion of participants who received a red cell transfusion ranged from 0% in Manno 2011, to 100% in Gratz 1992, and volume of total blood loss varied between 310 mL in Horrow 1991a, and 3130 mL in Guay 1992.
Timing of outcome assessments for total volume of blood transfused and total blood loss
We reported full details of the timing of outcome assessments in Table 1. Fifty trials reported total volume of blood transfused and total blood loss within 48 hours of drug administration; seven trials reported these outcomes over a longer time; three reported these outcomes only intraoperatively; and five did not report sufficient detail to reveal the timing of this assessment.
Excluded studies
We excluded 33 records from the review (see Characteristics of excluded studies for details).
-
Five records were review articles (Gandhi 2014; Hansen 1980; Mannucci 1994; Myrvang 2011; Zotz 2009).
-
Fourteen studies were not RCTs (EudraCT Number: 2009‐017265‐33; Flordal 1993; Forero 2003; Hooghiemstra 2012; Johnson 1990; Karger 2012; Keyl 2011; Kim 2015; Lozano 1999; NCT01606072; NCT01623206; Palaia 2001; Spiro 1982; Weinberg 2015).
-
Five were trials that included an ineligible participant group (Haith 1993; NCT00835211; NCT01382134; Nilsen 1984; Zielske 2003).
-
Six did not use the intervention of interest (IRCT2013092114728N1; IRCT201409304345N3; Mirmansoori 2016; NCT01218074; Ozal 2002; Stanca 2010).
-
Three records were secondary citations of excluded trials.
Ongoing studies
We identified four ongoing studies (see Characteristics of ongoing studies) (ISRCTN12845429; NCT00885924; NCT01982760; NCT02084342). Three of these trials have been completed but have not yet been published (NCT00885924; NCT01982760; NCT02084342). We will monitor the progress of these trials, and on publication (assuming eligibility), we will include them in future updates of this review. All four of the ongoing studies compare DDAVP versus placebo. One is assessing DDAVP before interventional procedures for thrombocytopenic patients (ISRCTN12845429), one involves cardiac surgery (NCT00885924), one orthopaedic surgery (NCT02084342), and one rhinoplasty (NCT01982760). These trials are planning to include approximately 147 participants in total.
Risk of bias in included studies
See the ’Risk of bias’ tables within Characteristics of included studies for details of our assessment for each study, and Figure 2 for a tabular summary.
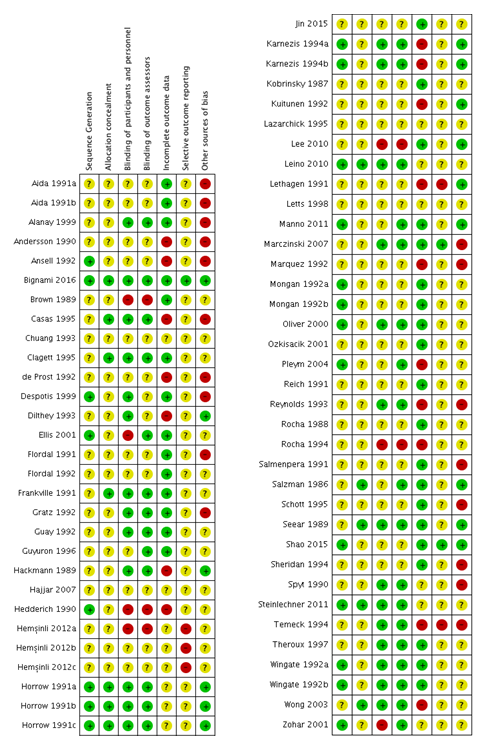
Risk of bias summary: review authors' judgements about each risk of bias item for each included study.
Allocation
Sequence generation
-
Twenty‐one trials were at low risk of bias for sequence generation because they used either:
-
a table of random numbers (Horrow 1991a; Horrow 1991b; Horrow 1991c; Karnezis 1994a; Karnezis 1994b; Leino 2010; Manno 2011; Oliver 2000; Wingate 1992a; Wingate 1992b); or
-
computer‐generated random numbers (Ansell 1992; Bignami 2016; Despotis 1999; Ellis 2001; Hedderich 1990; Mongan 1992a; Mongan 1992b; Pleym 2004; Shao 2015; Steinlechner 2011; Zohar 2001).
-
-
The remaining 44 trials were at unclear risk of bias because they did not report details of the randomisation sequence.
Concealment of treatment allocation
-
Eleven trials were at low risk for concealment of treatment allocation because they used sealed envelopes (Bignami 2016; Clagett 1995; Frankville 1991; Horrow 1991a; Horrow 1991b; Horrow 1991c; Leino 2010; Salzman 1986; Seear 1989; Steinlechner 2011; Wong 2003).
-
The remaining 54 trials were at unclear risk of bias because they did not report details of treatment allocation.
Blinding
-
Twenty‐five trials were at low risk of bias with adequate blinding of participants, personnel, and analysts because:
-
they used identical vials of DDAVP and placebo (Frankville 1991; Spyt 1990; Temeck 1994; Theroux 1997);
-
a pharmacist who was not otherwise involved in the trial prepared the DDAVP or matching placebo (Casas 1995; Clagett 1995; Gratz 1992; Horrow 1991a; Horrow 1991b; Horrow 1991c; Karnezis 1994a; Karnezis 1994b; Leino 2010; Marczinski 2007; Oliver 2000; Reynolds 1993; Seear 1989; Wingate 1992a; Wingate 1992b); or
-
a member of the study team who was not involved in determining outcomes prepared the DDAVP or matching placebo, while all other members of the study team and outcome assessors were blinded (Alanay 1999; Bignami 2016; Guay 1992; Hackmann 1989; Steinlechner 2011; Wong 2003).
-
-
Two trials were at low risk of bias for blinding of participants and personnel but were at unclear risk for blinding analysts (Despotis 1999; Dilthey 1993).
-
Four trials were at unclear risk for blinding of participants and personnel and at low risk for blinding of analysts (Guyuron 1996; Manno 2011; Pleym 2004; Salzman 1986).
-
Two trials were at high risk for blinding of participants and personnel but at low risk of bias for blinding of analysts (Ellis 2001; Zohar 2001).
-
Five trials were at high risk of bias for blinding of participants, personnel, and study analysts because:
-
they were open label (Hedderich 1990; Hemșinli 2012a; Lee 2010; Rocha 1994); or
-
the rapid rate of desmopressin infusion induced clinically important hypotension which is likely to have resulted in unblinding (Brown 1989).
-
-
The remaining 27 trials did not report sufficient information to permit us to determine risk of bias from blinding.
Incomplete outcome data
-
We considered 35 trials to be at low risk of bias for incomplete outcome data because participants were analysed on an ITT basis (Aida 1991a; Aida 1991b; Alanay 1999; Ansell 1992; Bignami 2016; Brown 1989; Clagett 1995; Despotis 1999; Ellis 2001; Flordal 1991; Flordal 1992; Frankville 1991; Gratz 1992; Guay 1992; Guyuron 1996; Jin 2015; Kobrinsky 1987; Lee 2010; Manno 2011; Marczinski 2007; Mongan 1992a; Mongan 1992b; Oliver 2000; Ozkisacik 2001; Reich 1991; Rocha 1988; Salmenpera 1991; Salzman 1986; Schott 1995; Seear 1989; Shao 2015; Sheridan 1994; Theroux 1997; Wingate 1992a; Wingate 1992b).
-
We considered 16 trials to be at high risk of bias because of:
-
exclusion of participants with severe bleeding or complications post randomisation (Casas 1995; de Prost 1992; Dilthey 1993; Hackmann 1989; Hedderich 1990; Kuitunen 1992; Lethagen 1991; Marquez 1992; Pleym 2004; Reynolds 1993; Wong 2003); or
-
high or unbalanced participant dropout (Andersson 1990; Karnezis 1994a; Karnezis 1994b; Rocha 1994; Temeck 1994).
-
-
We considered the remaining 14 trials to be at unclear risk of bias, as investigators reported insufficient information to allow us to make a judgement about this domain.
Selective reporting
-
We considered three trials to be at low risk of bias because they were prospectively registered and reported all prespecified outcomes (Bignami 2016; Marczinski 2007; Shao 2015).
-
We considered five trials to be at high risk of bias because they did not report a prespecified outcome (Hemșinli 2012a; Hemșinli 2012b; Hemșinli 2012c; Lethagen 1991; Temeck 1994).
-
We considered the remaining 57 trials to be at unclear risk of bias because they published no protocol or prospective trial registration.
Other potential sources of bias
-
We considered 18 trials to be at high risk of bias because they:
-
were funded by a drug manufacturer or other party with a commercial interest in the outcome of the trial (Andersson 1990; Ansell 1992; Casas 1995; de Prost 1992; Despotis 1999; Flordal 1991; Gratz 1992; Reynolds 1993; Schott 1995; Sheridan 1994; Spyt 1990);
-
had an imbalance in baseline characteristics (Aida 1991a; Aida 1991b);
-
had an imbalance in co‐interventions (Temeck 1994);
-
included re‐randomised participants (Alanay 1999);
-
were discontinued prematurely without appropriate rationale (Marquez 1992; Marczinski 2007); or
-
were a subgroup of a larger trial, and the larger trial was never published (Salmenpera 1991).
-
-
We considered 14 trials to be at low risk of other bias (Bignami 2016; Hackmann 1989; Horrow 1991a; Horrow 1991b; Horrow 1991c; Karnezis 1994a; Karnezis 1994b; Kuitunen 1992; Lee 2010; Lethagen 1991; Manno 2011; Salzman 1986; Seear 1989; Shao 2015).
-
We considered the remaining 33 trials to be at unclear risk of other bias.
Publication bias
Total volume of red cells transfused
We performed Egger’s test: bias coefficient 0.93 (P = 0.38). Trials were spread equally around the regression line and did not favour one treatment. Egger’s test is known to be sensitive to small‐study effects. Consequently, we consider this result to be indicative, but not conclusive, of a lack of publication bias for this outcome (Figure 3).

Funnel plot of comparison: desmopressin vs placebo: total red cell volume transfused. CI: confidence interval; MD: mean difference; SE: standard error.
Total number of participants transfused with red cells
We performed a modified Harbord test: bias coefficient ‐0.26 (P = 0.67). Trials were spread equally around the regression line and did not favour one treatment. Consequently, we consider this result to be indicative, but not conclusive, of a lack of publication bias for this outcome (Figure 4).
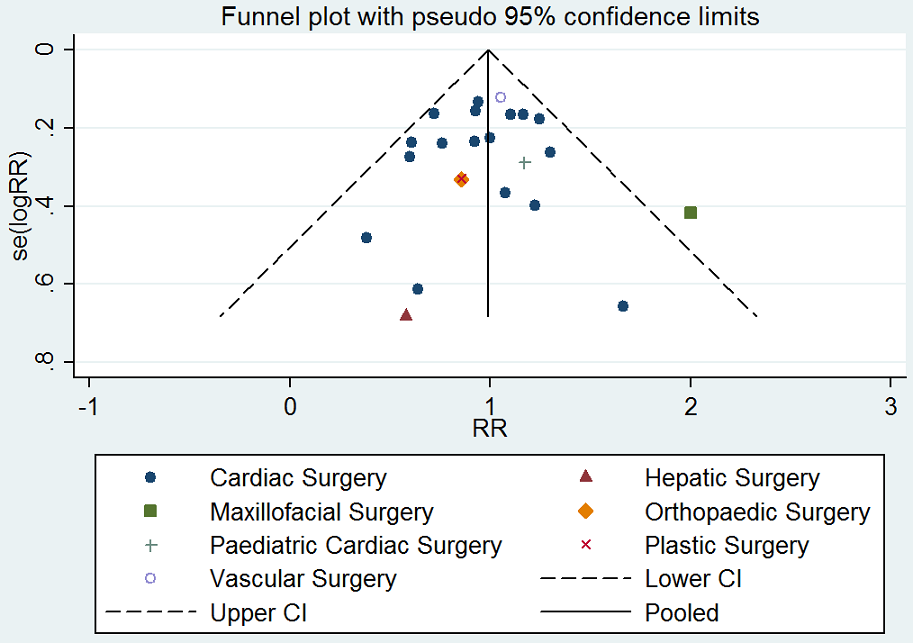
Funnel plot of comparison: desmopressin vs placebo: number of participants receiving a red cell transfusion. CI: confidence interval; RR: relative risk.
Total blood loss
We performed Egger’s test: bias coefficient 1.49 (P = 0.01). Trials were spread unequally around the regression line with bias favouring DDAVP. Consequently, we consider this result to demonstrate publication bias for this domain. Egger’s test is known to be sensitive to small‐study effects, but for this domain the small P value suggests publication bias (Figure 5).
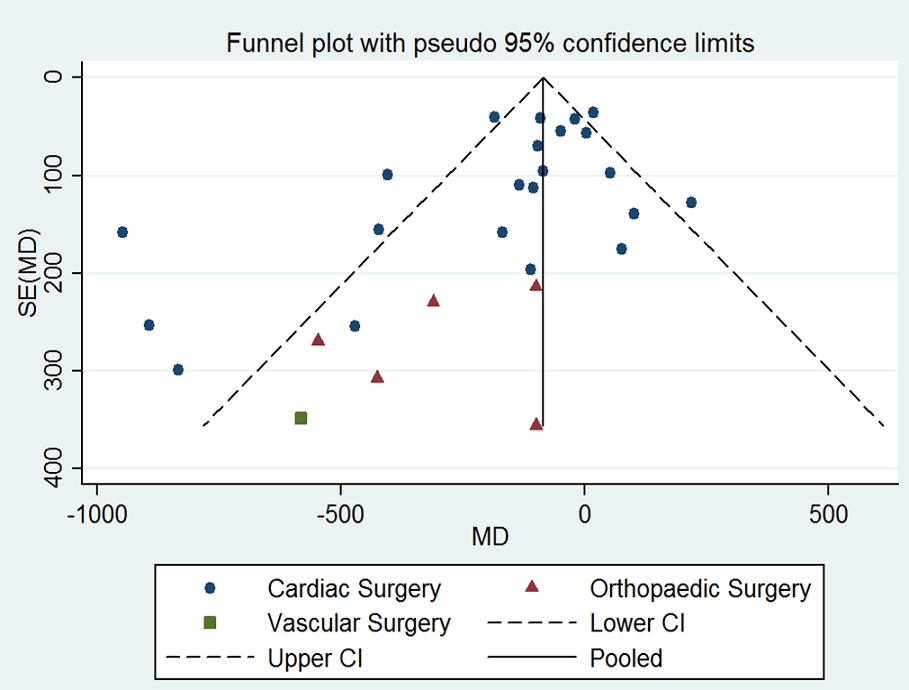
Funnel plot of comparison: desmopressin vs placebo: total blood loss. CI: confidence interval; MD: mean difference; SE: standard error.
Effects of interventions
See: Summary of findings for the main comparison DDAVP vs placebo or standard care; Summary of findings 2 DDAVP vs placebo or standard care: platelet dysfunction subgroup; Summary of findings 3 DDAVP vs tranexamic acid; Summary of findings 4 DDAVP vs aprotinin
-
Sixty‐two trials with 3672 participants compared DDAVP versus placebo or standard care (see summary of findings Table for the main comparison).
-
Eleven trials with 606 participants compared DDAVP versus placebo in the platelet dysfunction subgroup (see summary of findings Table 2)
-
Four trials with 163 participants compared DDAVP versus tranexamic acid (see summary of findings Table 3)
-
Two trials with 154 participants compared DDAVP versus aprotinin (see summary of findings Table 4)
-
Multi‐arm trials were not combined and the separate arms were compared in pair‐wise analyses (Casas 1995; Ellis 2001; Leino 2010; Marquez 1992; Rocha 1994). For trials including arms with different doses of DDAVP, we selected the regimen closest to a single intravenous dose of 0.3 µg/kg for inclusion in the analysis of DDAVP versus placebo or standard care (Marquez 1992; Rocha 1994). We included trials that compared tranexamic acid versus tranexamic acid and DDAVP in the DDAVP versus placebo or standard care analysis, as the characteristics of groups were matched, with the exception of administration of DDAVP or placebo (Hemșinli 2012b; Horrow 1991b).
DDAVP versus placebo or standard care
Primary outcomes
Volume of blood transfused intraoperatively
Ten trials (388 participants) reported the volume of blood transfused intraoperatively (Brown 1989; Guay 1992; Kobrinsky 1987; Leino 2010; Letts 1998; Lethagen 1991; Oliver 2000; Schott 1995; Theroux 1997; Wingate 1992a). Results showed considerable variation in volume of transfusion between types of surgery, so this outcome is reported in subgroups only (Analysis 1.1). Analysis revealed no evidence of a difference between subgroups (Chi2 = 4.39, degrees of freedom (df) = 4 (P = 0.36); I2 = 8.8%).
Adult cardiac surgery
Owing to the small number of participants, we are uncertain whether results showed a difference in the volume of blood transfused (intraoperatively) for participants treated with DDAVP compared with placebo (MD ‐0.1 units, 95% CI ‐1.22 to 1.02 units; 1 trial, 19 participants; Analysis 1.1).
Paediatric cardiac surgery
Owing to the small number of participants, we are uncertain whether results showed a difference in the volume of blood transfused (intraoperatively) for participants treated with DDAVP compared with placebo (MD 0.40 units, 95% CI ‐0.87 to 1.67 units; 1 trial, 60 participants; Analysis 1.1).
Orthopaedic surgery
Six trials (242 participants) reported intraoperative blood loss for orthopaedic surgery (Guay 1992; Kobrinsky 1987; Leino 2010; Letts 1998; Schott 1995; Theroux 1997), but three of these trials did not report this outcome in a way that could be incorporated into meta‐analysis and so are reported narratively in Table 3. Results show a reduction in the volume of red cells transfused intraoperatively in those treated with DDAVP compared with placebo (MD ‐0.50 units, 95% CI ‐0.89 to ‐0.11; I2 = 0%; 3 trials, 144 participants; Analysis 1.1). Restricting the analysis to trials at low risk of bias reduced the effect size (MD ‐0.20 units, 95% CI ‐1.74 to 1.34 units; 1 trial, 30 participants; analysis not shown) (Guay 1992). Restricting the analysis to studies with a transfusion protocol did not change the effect estimate (MD ‐0.38 units, 95% CI ‐0.84 to 0.07 units; I2 = 0%; 2 trials, 109 participants; analysis not shown) (Guay 1992; Schott 1995).
| Trial | Reason not included in meta‐analysis | DDAVP arm | Placebo arm |
| Orthopaedic surgery | |||
| Reported as mean (no standard deviation) | 0.3 units (n = 23) | 0.5 units (n = 24) | |
| Reported as mean (no standard deviation) | 4.6 units (n = 16) | 5.0 units (n = 14) | |
| Reported as median and range | 51.5 (24 to 98.6) mL/kg (n = 10) | 48.3 (24.5 to 96) mL/kg (n = 11) | |
Vascular surgery
Owing to the small number of participants, we are uncertain whether results showed a difference in the volume of blood transfused (intraoperatively) for participants treated with DDAVP compared with placebo (MD ‐1.2 units, 95% CI ‐2.55 to 0.15 units; 1 trial, 44 participants; Analysis 1.1).
Plastic surgery
Results showed a reduction in the volume of red cells transfused intraoperatively for those treated with DDAVP compared with placebo (MD ‐0.75 units, 95% CI ‐1.23 to ‐0.27 units; 2 trials, 44 participants; Analysis 1.1).
Total volume of blood transfused
Thirty‐nine trials (2324 participants) reported the total volume of blood transfused (Aida 1991a; Aida 1991b; Alanay 1999; Ansell 1992; Bignami 2016; Brown 1989; Chuang 1993; Clagett 1995; de Prost 1992; Despotis 1999; Dilthey 1993; Ellis 2001; Flordal 1992; Frankville 1991; Gratz 1992; Guyuron 1996; Hackmann 1989; Hajjar 2007; Hedderich 1990; Karnezis 1994a; Karnezis 1994b; Kobrinsky 1987; Kuitunen 1992; Leino 2010; Lethagen 1991; Marquez 1992; Mongan 1992a; Mongan 1992b; Ozkisacik 2001; Reich 1991; Reynolds 1993; Rocha 1988; Rocha 1994; Salzman 1986; Schott 1995; Spyt 1990; Steinlechner 2011; Theroux 1997; Wong 2003). Results showed considerable variation in the volume of transfusion between types of surgery, so we reported this outcome in subgroups only (Analysis 1.2). Analysis revealed no evidence of a difference between subgroups (Chi2 = 2.97, df = 3 (P = 0.40); I2 = 0%).
Adult cardiac surgery
Twenty‐six trials (1674 participants) reported total volume of red cells transfused for adult cardiac surgery; 12 trials did not report this outcome in a way that allowed inclusion in meta‐analysis, and so we reported these results narratively in Table 4. The total volume of blood transfused was less for those treated with DDAVP compared with placebo (MD ‐0.52 units, 95% CI ‐0.96 to ‐0.08 units; I2 = 70%; 14 trials, 957 participants; Analysis 1.2).
| Trial | Reason not included in meta‐analysis | DDAVP arm | Placebo arm |
| Adult cardiac surgery | |||
| Reported as mL/kg (mean ± standard deviation) | 8.3 ± 5.6 mL/kg (n = 5) | 10.8 ± 6.3 mL/kg (n = 4) | |
| Reported as mL/kg (mean ± standard deviation) | 10.2 ± 6.4 mL/kg (n = 5) | 13.2 ± 6.6 mL/kg (n = 6) | |
| Reported as median (interquartile range) | 1.7 (2.3) units (n = 18) | 0.6 (1.3) units (n = 22) | |
| Reported as median (interquartile range) | 2 (1 to 4) units (n = 68) | 2 (1 to 3) units (n = 67) | |
| Reported as mean (no standard deviation) | 2.4 units (n = 15) | 2 units (n = 15) | |
| Reported as median (90% confidence interval) | 2 (1 to 8.5) units (n = 74) | 2 (1 to 9.8) units (n = 76) | |
| Reported as mean (range) | 1.3 (0 to 2) units (n = 15) | 1.1 (0 to 3) units (n = 15) | |
| Reported as median only | 2 units (n = 21) | 2 units (n = 22) | |
| Reported as mean only | 0.86 units (n = 44) | 1.79 units n = 42) | |
| Reported as mean only | 2.4 units (n = 13) | 2.2 units (n = 16) | |
| Reported as mL/m2 (mean ± standard deviation) | 740.4 ± 416.3 mL/m2 (n = 25) | 662.8 ± 380.7 mL/m2 (n = 28) | |
| Reported as mean only | 1.38 units (n = 49) | 1.30 units (n = 49) | |
| Orthopaedic surgery | |||
| Reported as mean only | 0.7 units (n = 10) | 1.1 units (n = 10) | |
| Reported as median and range | 64.8 (30.3 to 123.6) mL/kg (n = 10) | 64.9 (33.8 to 110) mL/kg (n = 11) | |
| Maxillofacial surgery | |||
| Reported as mean (no standard deviation) | 0.6 units (n = 10) | 0.9 units (n = 10) | |
We noted no change to the effect estimate or to heterogeneity when we restricted the analysis to:
-
trials with a low risk of bias (MD ‐0.54 units, 95% CI ‐1.40 to 0.31 units; I2 = 16%; 2 trials, 113 participants; analysis not shown) (Salzman 1986; Steinlechner 2011);
-
trials that used autologous cell salvage (MD ‐0.62 units; 95% CI ‐1.26 to 0.01 units; I2 = 52%; 5 trials, 243 participants; analysis not shown) (Brown 1989; Despotis 1999; Dilthey 1993; Gratz 1992; Reich 1991); or
-
trials with a transfusion protocol (MD ‐0.52 units; 95% CI ‐1.12 to 0.08 units; I2 = 51%; 4 trials, 240 participants; analysis not shown) (de Prost 1992; Dilthey 1993; Ozkisacik 2001; Steinlechner 2011).
Restricting the analysis to trials published as full‐text papers resulted in reduced effect estimate and heterogeneity (MD ‐0.30 units; 95 % CI ‐0.63 to 0.04 units; I2 = 49%; 12 trials, 759 participants; analysis not shown) (Ansell 1992; Brown 1989; de Prost 1992; Despotis 1999; Dilthey 1993; Gratz 1992; Hedderich 1990; Ozkisacik 2001; Reich 1991; Rocha 1988; Salzman 1986; Steinlechner 2011).
TSA showed accrual of 68.5% of the information size so far to detect or reject a 15% (0.52 unit) relative risk reduction based on an estimated mean transfusion volume of 3.45 units in study control arms (D2 = 75%). When we restricted TSA to trials at low risk of bias, results showed that 18.0% of the information size had been accrued so far.
Orthopaedic surgery
Eight trials (344 participants) reported total volume of red cells transfused for orthopaedic surgery, but two trials (41 participants) did not report this outcome in a way that allowed inclusion in meta‐analysis, and so we reported these results narratively in Table 4. Results showed no difference in the total volume of blood transfused for those treated with DDAVP compared with placebo (MD ‐0.02 units, 95% CI ‐0.67 to 0.64 units; I2 = 71%; 6 trials, 303 participants; Analysis 1.2).
Restricting the analysis to trials with:
-
a low risk of bias increased the effect size but not to clinical significance (MD ‐0.90 units, 95% CI ‐1.93 to 0.13 units; 1 trial, 47 participants; analysis not shown) (Leino 2010);
-
a transfusion protocol did not alter the effect estimate or heterogeneity (MD 0.33 units, 95% CI ‐0.63 to 1.28 units; I2 = 72%; 4 trials, 218 participants; analysis not shown) (Karnezis 1994a; Karnezis 1994b; Leino 2010; Schott 1995).
TSA showed accrual of 30.8% of the information size so far to detect or reject a 15% (0.52 unit) relative risk reduction based on an estimated mean transfusion volume of 3.48 units in study control arms (D2 = 73%). When we restricted TSA to trials at low risk of bias, results showed that 16.6% of the information size had been accrued so far.
Vascular surgery
Owing to the small number of participants, we are uncertain whether results showed a difference in the total volume of blood transfused for participants treated with DDAVP compared with placebo (MD 0.06 units, 95% CI ‐0.60 to 0.73 units; 2 trials, 135 participants; Analysis 1.2). TSA showed accrual of 9.3% of the information size so far to detect or reject a 15% (0.29 unit) relative risk reduction based on an estimated mean transfusion volume of 1.94 units in the study control arms (D2 = 0%). When we restricted TSA to trials at low risk of bias, results showed that 7.7% of the information size had been accrued so far.
Hepatic surgery
Owing to the small number of participants, we are uncertain whether results showed a difference in total volume of blood transfused for participants treated with DDAVP compared with placebo (MD ‐0.47 units, 95% CI ‐1.27 to 0.33 units; 1 trial, 59 participants; Analysis 1.2).
Maxillofacial surgery
One trial (20 participants) reported total volume of red cells transfused in maxillofacial surgery but did not report this outcome in a way that allowed inclusion in meta‐analysis; so we reported these findings narratively in Table 4.
Paediatric cardiac surgery
Owing to the small number of participants, we are uncertain whether results showed a difference in the total volume of blood transfused for participants treated with DDAVP compared with placebo (MD 1 mL/kg, 95% CI ‐17.10 to 19.10 mL/kg; 1 trial, 95 participants; Analysis 1.3).
Number of participants transfused with blood intraoperatively
Six trials (349 participants) reported the number of participants transfused with blood intraoperatively, and all six contributed data towards the final pooled estimate (Manno 2011; Marczinski 2007; Mongan 1992a; Mongan 1992b; Wingate 1992a; Wingate 1992b). Results showed no difference in the number of participants transfused with blood intraoperatively between those treated with DDAVP and those not treated with DDAVP (RR 0.74 units, 95% CI 0.50 to 1.09 units; I2 = 0%; 6 trials, 349 participants; Analysis 1.4). Analysis revealed no evidence of a difference between subgroups (Chi2 = 0.30, df = 1 (P = 0.58); I2 = 0%).
Results showed no change in the effect estimate when analysis was restricted to trials:
-
at low risk of bias (RR 0.86, 95% CI 0.45 to 1.64; 3 trials, 206 participants; analysis not shown) (Manno 2011; Wingate 1992a; Wingate 1992b); or
-
with a transfusion protocol (RR 0.68, 95% CI 0.43 to 1.10; 2 trials, 115 participants; analysis not shown) (Mongan 1992a; Mongan 1992b).
Cardiac surgery
Owing to the small number of participants, we are uncertain whether results showed a difference in the number of participants transfused with blood intraoperatively between those treated with DDAVP and those given placebo (RR 0.68, 95% CI 0.43 to 1.10 units; 2 trials, 45 participants; Analysis 1.4).
Plastic surgery
Owing to the small number of participants, we are uncertain whether results showed a difference in the number of participants transfused with blood intraoperatively between those treated with DDAVP and those given placebo (RR 0.86, 95% CI 0.45 to 1.64 units; 2 trials, 44 participants; Analysis 1.4).
Kidney biopsy
One trial in this subgroup reported the number of participants transfused with blood intraoperatively. However, researchers reported no events in either arm of the trial (Manno 2011).
Other types of surgery
One trial in this subgroup reported the number of participants transfused with blood intraoperatively. However, researchers reported no events in either arm of the trial (Marczinski 2007).
Total number of participants transfused with blood
Twenty‐six trials (1866 participants) reported the total number of participants transfused with blood (Ansell 1992; Bignami 2016; Casas 1995; Clagett 1995; Dilthey 1993; Ellis 2001; Frankville 1991; Gratz 1992; Guyuron 1996; Hackmann 1989; Horrow 1991a; Horrow 1991b; Jin 2015; Manno 2011; Marquez 1992; Mongan 1992a; Mongan 1992b; Oliver 2000; Ozkisacik 2001; Pleym 2004; Sheridan 1994; Spyt 1990; Temeck 1994; Wingate 1992a; Wingate 1992b; Wong 2003). We excluded one trial from the final analysis because every participant in both arms of the trial received a red cell transfusion (Gratz 1992). We found no evidence showing a difference in the total number of participants transfused with blood between those treated with DDAVP and those given placebo (RR 0.96, 95% CI 0.86 to 1.06; I2 = 17%; 25 trials, 1806 participants; moderate‐quality evidence; Analysis 1.5). Analysis revealed no evidence of a difference between subgroups (Chi2 = 3.02, df = 2 (P = 0.22), I2 = 33.7%). The effect estimate was similar to results of the main analysis when we restricted the analysis to trials:
-
at low risk of bias (RR 1.06, 95% CI 0.90 to 1.25; I2 = 2%; 9 trials, 691 participants; analysis not shown) (Bignami 2016; Clagett 1995; Frankville 1991; Horrow 1991a; Horrow 1991b; Manno 2011; Oliver 2000; Wingate 1992a; Wingate 1992b);
-
that used a transfusion protocol (RR 0.91, 95% CI 0.79 to 1.05; 13 trials, 928 participants; analysis not shown) (Bignami 2016; Casas 1995; Dilthey 1993; Ellis 2001; Horrow 1991a; Horrow 1991b; Marquez 1992; Mongan 1992a; Mongan 1992b; Ozkisacik 2001; Pleym 2004; Spyt 1990; Wong 2003);
-
that used autologous cell salvage (RR 1.02, 95% CI 0.82 to 1.26; I2 = 20%; 6 trials, 532 participants; analysis not shown) (Clagett 1995; Frankville 1991; Hackmann 1989; Horrow 1991a; Horrow 1991b; Pleym 2004); or
-
published before 2010 plus those registered prospectively and published after 2010 (RR 0.96, 95% CI 0.86 to 1.07; I2 = 19%; 23 trials, 1543 participants; analysis not shown) (Ansell 1992; Bignami 2016; Casas 1995; Clagett 1995; Dilthey 1993; Ellis 2001; Frankville 1991; Guyuron 1996; Hackmann 1989; Horrow 1991a; Horrow 1991b; Marquez 1992; Mongan 1992a; Mongan 1992b; Oliver 2000; Ozkisacik 2001; Pleym 2004; Sheridan 1994; Spyt 1990; Temeck 1994; Wingate 1992a; Wingate 1992b; Wong 2003).
TSA showed accrual of 70% of the information size so far to detect or reject a 15% relative risk reduction based on 43.1% of participants in the study control arms receiving a transfusion (D2 = 18%). This estimate crossed the futility boundary, suggesting that no evidence shows a difference between desmopressin and placebo for this outcome, and that further trial data are unlikely to alter this estimate. When we restricted TSA to trials at low risk of bias, results showed that 19.4% of the information size had been accrued so far.
Cardiac surgery
We found no evidence showing a difference in the total number of participants transfused with blood between those treated with DDAVP and those given placebo (RR 0.93, 95% CI 0.82 to 1.06; I2 = 25%; 17 trials, 1350 participants; Analysis 1.5). The effect estimate was similar to results of the main analysis when we restricted the analysis to trials:
-
at low risk of bias (RR 1.03, 95% CI 0.66 to 1.59; I2 = 47%; 4 trials, 334 participants; analysis not shown) (Bignami 2016; Frankville 1991; Horrow 1991a; Horrow 1991b);
-
that used a transfusion protocol (RR 0.90, 95% CI 0.77 to 1.05; 11 trials, 848 participants; analysis not shown) (Bignami 2016; Casas 1995; Dilthey 1993; Horrow 1991a; Horrow 1991b; Marquez 1992; Mongan 1992a; Mongan 1992b; Ozkisacik 2001; Pleym 2004; Spyt 1990);
-
that used autologous cell salvage (RR 0.99, 95% CI 0.70 to 1.41; I2 = 34%; 5 trials, 441 participants; analysis not shown) (Frankville 1991; Hackmann 1989; Horrow 1991a; Horrow 1991b; Pleym 2004); or
-
published before 2010 plus those registered prospectively and published after 2010 (RR 0.94, 95% CI 0.82 to 1.06; I2 = 29%; 16 trials, 1248 participants; analysis not shown) (Ansell 1992; Bignami 2016; Casas 1995; Dilthey 1993; Frankville 1991; Hackmann 1989; Horrow 1991a; Horrow 1991b; Marquez 1992; Mongan 1992a; Mongan 1992b; Ozkisacik 2001; Pleym 2004; Sheridan 1994; Spyt 1990; Temeck 1994).
Orthopaedic surgery
Owing to the small number of participants, we are uncertain whether results showed a difference in the total number of participants transfused with blood when treated with DDAVP versus placebo (RR 0.86, 95% CI 0.45 to 1.64; 1 trial, 13 participants; Analysis 1.5).
Vascular surgery
Owing to the small number of participants, we are uncertain whether results showed a difference in the total number of participants transfused with blood when treated with DDAVP versus placebo (RR 1.05, 95% CI 0.83 to 1.34; 1 trial, 68 participants; Analysis 1.5).
Paediatric cardiac surgery
Owing to the small number of participants, we are uncertain whether results showed a difference in the number of participants transfused with blood when treated with DDAVP versus placebo (RR 1.17, 95% CI 0.66 to 2.06; 1 trial, 27 participants; Analysis 1.5).
Plastic surgery
Owing to the small number of participants, we are uncertain whether results showed a difference in the number of participants transfused with blood when treated with DDAVP versus placebo (RR 0.86, 95% CI 0.45 to 1.64; 2 trials, 44 participants; Analysis 1.5).
Hepatic surgery
Owing to the small number of participants, we are uncertain whether results showed a difference in the number of participants transfused with blood when treated with DDAVP versus placebo (RR 0.58, 95% CI 0.15 to 2.21; 1 trial, 59 participants; Analysis 1.5).
Kidney biopsy
One trial in this subgroup reported the total number of participants transfused with blood. However, researchers reported no events in either arm of the trial (Analysis 1.5).
Maxillofacial surgery
Owing to the small number of participants, we are uncertain whether results showed a difference in the number of participants transfused with blood when treated with DDAVP versus placebo (RR 2.00, 95% CI 0.88 to 4.54; 1 trial, 20 participants; Analysis 1.5).
Intraoperative blood loss
Seventeen trials (933 participants) reported intraoperative blood loss (Brown 1989; Flordal 1992; Guay 1992; Hackmann 1989; Kobrinsky 1987; Leino 2010; Lethagen 1991; Letts 1998; Marczinski 2007; Oliver 2000; Rocha 1988; Salzman 1986; Schott 1995; Shao 2015; Wingate 1992a; Wingate 1992b; Wong 2003). Clinical heterogeneity due to differences in baseline blood loss meant that it was not possible to calculate a pooled estimate for the whole population, and we performed analyses in subgroups according to type of surgery (Analysis 1.6). We found no evidence of a difference between subgroups (Chi2 = 4.10, df = 4 (P = 0.39), I2 = 2.5%).
Adult cardiac surgery
Four trials (337 participants) reported intraoperative blood loss for adult cardiac surgery (Brown 1989; Hackmann 1989; Rocha 1988; Salzman 1986), but two trials (250 participants) did not report this outcome in a way that allowed inclusion in meta‐analysis, and so we reported this information narratively in Table 5. We found no evidence of a difference in intraoperative blood loss for participants treated with DDAVP versus placebo (MD ‐138.2 mL, 95% CI ‐623.4 mL to 347.01 mL; I2 = 85%; 2 trials, 87 participants; Analysis 1.6).
| Trial | Reason not included in meta‐analysis | DDAVP arm | Placebo arm |
| Adult cardiac surgery | |||
| Reported as median (90% confidence interval) | 200 (0 to 1150) mL (n = 74) | 200 (0 to 1013) mL (n = 76) | |
| Reported as mL/m2 body surface area | 131 ± 106 mL/m2 (n = 50) | 193 ± 137 mL/m2 (n = 50) | |
| Paediatric cardiac surgery | |||
| Reported as mL/m2 | 49.3 ± 43.7 mL/m2 (n = 31) | 73.6 ± 71.1 mL/m2 (n = 29) | |
| Orthopaedic surgery | |||
| Reported as mean (no standard deviation) | 1200 mL (n = 23) | 1463 mL (n = 24) | |
| Hepatic surgery | |||
| Reported as median (range) | 832.5 (350 to 2955) mL (n = 30) | 800 mL (250 to 7128) mL (n = 29) | |
| Other surgery | |||
| Reported as mean and range | 251 (2 to 1330) mL (n = 14) | 504 (50 to 2100) mL (n = 14) | |
Paediatric cardiac surgery
One trial reported intraoperative blood loss for paediatric cardiac surgery, but did not report this outcome in a way that allowed inclusion in meta‐analysis, and so we reported this information narratively in Table 5.
Orthopaedic surgery
Six trials (271 participants) reported intraoperative blood loss for orthopaedic surgery (Flordal 1992; Guay 1992; Kobrinsky 1987; Leino 2010; Letts 1998; Schott 1995), but one trial (47 participants) did not report this outcome in a way that allowed inclusion in meta‐analysis, and so we reported this information narratively in Table 5. We found no evidence of a difference in intraoperative blood loss for participants treated with DDAVP versus placebo (MD ‐118.24 mL, 95% CI ‐278.43 mL to 41.95 mL; I2 = 6%; 5 trials, 224 participants; Analysis 1.6). The mean difference was similar when we restricted the analysis to trials:
-
at low risk of bias (MD ‐126 mL, 95% CI ‐766.22 to 514.22 mL; 1 trial, 30 participants; analysis not shown) (Guay 1992); or
-
with a transfusion protocol (MD ‐103.87 mL, 95% CI ‐350.88 to 143.14 mL; I2 = 0%; 2 trials, 109 participants; analysis not shown) (Guay 1992; Schott 1995).
Vascular surgery
Owing to the small number of participants, we are uncertain whether results showed a difference in intraoperative blood loss for participants treated with DDAVP versus placebo (MD ‐525.00 mL, 95% CI ‐1177.34 to 127.34 mL; 1 trial, 44 participants; Analysis 1.6).
Sinus surgery
Intraoperative blood loss was less for those treated with DDAVP than placebo (MD ‐28 mL, 95% CI ‐31.70 to ‐24.30 mL; 1 trial, 90 participants; Analysis 1.6).
Plastic surgery
Owing to the small number of participants, we are uncertain whether results showed a difference in total blood loss for participants treated with DDAVP versus placebo (MD ‐146.02 mL, 95% CI ‐487.86 to 195.83 mL; I2 = 83%; 2 trials, 44 participants; Analysis 1.6).
Hepatic surgery
One trial (59 participants) reported intraoperative blood loss for hepatic surgery but did not report this outcome in a format that allowed inclusion in meta‐analysis, and so we reported this information narratively in Table 5.
Other types of surgery
One trial (28 participants) reported intraoperative blood loss for other types of surgery but did not report this outcome in a format that allowed inclusion in meta‐analysis, and so we reported this information narratively in Table 5.
Total blood loss
Forty‐eight trials (2808 participants) reported total blood loss (Aida 1991a; Aida 1991b; Alanay 1999; Andersson 1990; Ansell 1992; Bignami 2016; Brown 1989; Casas 1995; Chuang 1993; de Prost 1992; Despotis 1999; Dilthey 1993; Flordal 1991; Flordal 1992; Frankville 1991; Gratz 1992; Guay 1992; Guyuron 1996; Hackmann 1989; Hajjar 2007; Hedderich 1990; Hemșinli 2012a; Hemșinli 2012b; Horrow 1991a; Horrow 1991b; Jin 2015; Kobrinsky 1987; Kuitunen 1992; Leino 2010; Lethagen 1991; Marquez 1992; Mongan 1992a; Mongan 1992b; Ozkisacik 2001; Pleym 2004; Reich 1991; Reynolds 1993; Rocha 1988; Rocha 1994; Salmenpera 1991; Salzman 1986; Schott 1995; Seear 1989; Sheridan 1994; Spyt 1990; Steinlechner 2011; Temeck 1994; Theroux 1997). Clinical heterogeneity due to differences in baseline blood loss meant that it was not possible to obtain a pooled estimate for the whole population, and so we performed analyses in subgroups according to type of surgery (Analysis 1.7; Analysis 1.8). We found no evidence of a difference between subgroups (Chi2 = 3.02, df = 2 (P = 0.22); I2 = 33.7%).
Adult cardiac surgery
Thirty‐seven trials (2354 participants) reported total blood loss for adult cardiac surgery (Aida 1991a; Aida 1991b; Alanay 1999; Andersson 1990; Ansell 1992; Bignami 2016; Brown 1989; Casas 1995; Chuang 1993; de Prost 1992; Despotis 1999; Dilthey 1993; Frankville 1991; Gratz 1992; Hackmann 1989; Hajjar 2007; Hedderich 1990; Hemșinli 2012a; Hemșinli 2012b; Horrow 1991a; Horrow 1991b; Jin 2015; Kuitunen 1992; Marquez 1992; Mongan 1992a; Mongan 1992b; Ozkisacik 2001; Pleym 2004; Reich 1991; Rocha 1988; Rocha 1994; Salmenpera 1991; Salzman 1986; Sheridan 1994; Spyt 1990; Steinlechner 2011; Temeck 1994), but 15 trials (996 participants) did not report this outcome in a way that allowed inclusion in meta‐analysis, and so we reported this information narratively in Table 6.
| Trial | Reason not included in meta‐analysis | DDAVP arm | Placebo arm |
| Adult cardiac surgery | |||
| Reported as mL/kg (mean ± standard deviation) | 8.0 ± 1.4 mL/kg (n = 5) | 5.9 ± 1.5 mL/kg (n = 4) | |
| Reported as mL/kg (mean ± standard deviation) | 11.3 ± 10 mL/kg (n = 5) | 7.5 ± 4 mL/kg (n = 6) | |
| Reported as median (interquartile range) | 950 (950) mL (n = 18) | 975 (811) mL (n = 22) | |
| Reported as median (interquartile range) | 575 (422.5 to 770) mL (n = 68) | 590 (476.25 to 1013.75) mL (n = 67) | |
| Reported as mL/m2 body surface area (mean ± standard deviation) | 400 ± 192 mL/m2 (n = 50) | 489 ± 361 mL/m2 (n = 51) | |
| Reported as mL/m2 body surface area (mean ± standard deviation) | 582 ± 410 mL/m2 (n = 44) | 465 ± 303 mL/m2 (n = 37) | |
| Reported as median (range) | 1000 (600 to 1800) mL (n = 19) | 1075 (400 to 1740) mL (n = 20) | |
| Reported as median (90% confidence interval) | 865 (358 to 2495) mL (n = 74) | 783 (300 to 2219) mL (n = 76) | |
| Reported as mL/m2 (mean ± standard deviation) | 258 ± 106 mL/m2 (n = 75) | 526 ± 314 mL/m2 (n = 75) | |
| Reported as mean (no standard deviation) | 1430 mL (n = 10) | 1767 mL (n = 10) | |
| Reported as mean (no standard deviation) | 574 mL (n = 16) | 535 mL (n = 18) | |
| Reported as median only | 1157 mL (n = 21) | 1180 mL (n = 22) | |
| Reported as mL/m2 body surface area (mean ± standard deviation) | 458 ± 206 mL/m2 (n = 50) | 536 ± 304 mL/m2 (n = 50) | |
| Reported as mL/m2 body surface area (mean ± standard deviation) | 551.8 ± 324.1 mL/m2 (n = 28) | 438.7 ± 228.1 mL/m2 (n = 25) | |
| Reported as median (range) | 1020 (530 to 1155) mL (n = 15) | 1100 (425 to 1720) mL (n = 15) | |
| Orthopaedic surgery | |||
| Reported as mean (no standard deviation) | 1320 mL (n = 6) | 1380 mL (n = 6) | |
| Reported as estimated percentage blood loss: median (range) | 147.8% (57% to 428.8%) (n = 10) | 111.2% (65% to 239.5%) (n = 11) | |
| Maxillofacial surgery | |||
| Reported as mean (range) | 675 (380 to 1330) mL (n = 10) | 819 (200 to 1600) mL (n = 10) | |
Total blood loss for participants undergoing cardiac surgery was less for participants treated with DDAVP than placebo (MD ‐135.24 mL, 95% CI ‐210.8 to ‐59.68 mL; I2 = 78%; 22 trials, 1358 participants; Analysis 1.7). Sensitivity analyses could not account for the level of heterogeneity observed. Heterogenity was not improved by restricting the analysis to trials:
-
at low risk of bias (MD ‐89.77 mL, 95% CI ‐227.72 to 48.19 mL; I2 = 85%; 5 trials, 312 participants; analysis not shown) (Frankville 1991; Horrow 1991a; Horrow 1991b; Salzman 1986; Steinlechner 2011); or
-
published as full‐text papers (MD ‐98.96 mL, 95% CI ‐163.75 to ‐34.17 mL; I2 = 68%; 21 trials, 1310 participants; analysis not shown) (Andersson 1990; Ansell 1992; Brown 1989; Despotis 1999; Frankville 1991; Gratz 1992; Hedderich 1990; Horrow 1991a; Horrow 1991b; Jin 2015; Kuitunen 1992; Mongan 1992a; Mongan 1992b; Ozkisacik 2001; Pleym 2004; Reich 1991; Salzman 1986; Sheridan 1994; Spyt 1990; Steinlechner 2011; Temeck 1994).
Restricting the analysis to trials:
-
with a transfusion protocol did not reduce the effect estimate and heterogeneity (MD ‐17.12 mL, 95% CI ‐84.61 to 50.36 mL; I2 = 35%; 7 trials, 394 participants; analysis not shown) (Brown 1989; Frankville 1991; Gratz 1992; Horrow 1991a; Horrow 1991b; Pleym 2004; Reich 1991);
-
published before 2010 plus those registered prospectively and published after 2010 did not alter the effect estimate and heterogeneity (MD ‐143.99 mL, 95% CI ‐225.09 to ‐62.90 mL; I2 = 78%; 21 trials, 1256 participants; analysis not shown) (Andersson 1990; Ansell 1992; Brown 1989; Chuang 1993; Despotis 1999; Frankville 1991; Gratz 1992; Hedderich 1990; Horrow 1991a; Horrow 1991b; Kuitunen 1992; Mongan 1992a; Mongan 1992b; Ozkisacik 2001; Pleym 2004; Reich 1991; Salzman 1986; Sheridan 1994; Spyt 1990; Steinlechner 2011; Temeck 1994).
TSA showed accrual of 157% of the information size so far to detect or reject a 15% (150.5 mL) reduction in blood loss based on an estimated mean blood loss of 1003.3 mL in study control arms (D2 = 84%). This crossed the 5% O'Brien‐Fleming boundary, suggesting that DDAVP results in a statistically significant reduction in blood loss and that further trial data are unlikely to change this estimate. However, this result included many trials that we assessed as being at high risk of bias, and results show risk of systematic error. When we restricted TSA to trials at low risk of bias, results showed that 23.6% of the information size had been accrued so far.
Orthopaedic surgery
Seven trials (274 participants) reported total blood loss for orthopaedic surgery (Flordal 1991; Flordal 1992; Guay 1992; Kobrinsky 1987; Leino 2010; Schott 1995; Theroux 1997), but two trials (33 participants) did not report this outcome in a way that allowed inclusion in meta‐analysis, and so we reported this information narratively in Table 6. Among participants undergoing orthopaedic surgery, total blood loss was less for those treated with DDAVP than placebo (MD ‐285.76 mL, 95% CI ‐514.99 mL to ‐56.53 mL; I2 = 0%; 5 trials, 241 participants; Analysis 1.7). Restricting the analysis to trials:
-
at low risk of bias did not alter the estimate (MD ‐285.63 mL, 95% CI ‐741.88 to 170.63 mL; I2 = 0%; 2 trials, 77 participants; analysis not shown) (Guay 1992; Leino 2010);
-
with a transfusion protocol did not affect the effect estimate (MD ‐277.23 mL, 95% CI ‐543.75 to ‐10.71 mL; I2 = 0%; 4 trials, 191 participants; analysis not shown) (Guay 1992; Kobrinsky 1987; Leino 2010; Schott 1995);
-
published before 2010 plus those registered prospectively and published after 2010 did not alter the effect estimate (MD ‐262.24, 95% CI ‐510.07 to ‐14.40; I2 = 0%; 4 trials, 194 participants; analysis not shown) (Flordal 1992; Guay 1992; Kobrinsky 1987; Schott 1995).
TSA showed that 99.2% of the information size required to detect or reject a 15% (326.8 mL) reduction in blood loss based on an estimated mean blood loss of 2178.7 mL in study control arms (D2 = 0%) had been accrued so far. This crossed the 5% O'Brien‐Fleming boundary, suggesting that DDAVP results in a statistically significant reduction in blood loss and that further trial data are unlikely to change this estimate. However, this result included many trials that we assessed as being at high risk of bias, and so results show risk of systematic error. When we restricted TSA to trials at low risk of bias, results showed that 14.4% of the information size had been accrued so far.
Vascular surgery
Total blood loss for participants undergoing vascular surgery was less for participants treated with DDAVP than placebo (MD ‐582.00 mL, 95% CI ‐1264.07 to 100.07 mL; 1 study, 44 participants; Analysis 1.7). TSA showed that 8.3% of the information size required to detect or reject a 15% (281.6 mL) reduction in blood loss based on an estimated mean blood loss of 1877 mL in study control arms (D2 = 0%) had been accrued so far.
Paediatric cardiac surgery
Owing to the small number of participants, we are uncertain whether results showed a difference in total blood loss for paediatric participants undergoing cardiac surgery among those treated with DDAVP versus placebo (MD 1.11 mL/kg, 95% CI ‐12.92 mL/kg to 15.15 mL/kg; I2 = 35%; 2 studies, 155 participants; Analysis 1.8). TSA showed that 6.0% of the information size had been accrued so far to detect or reject a 15% (4.9 mL/m2) reduction in blood loss based on an estimated mean blood loss of 33.1 mL/m2 in study control arms (D2 = 38%). When we restricted TSA to trials at low risk of bias, results showed that 1.3% of the information size had been accrued so far.
Secondary outcomes
Number of participants with intraoperative bleeding (interventional procedures only)
One trial (48 participants) reported the number of participants undergoing interventional procedures with intraoperative bleeding (Lee 2010). Owing to the small number of participants, we are uncertain whether results showed a difference in the number of participants who had an intraoperative bleed in the DDAVP arm versus the placebo arm (RR 0.29, 95% CI 0.07 to 1.24; 1 trial, 48 participants; Analysis 1.9).
Number of participants with any bleeding (interventional procedures only)
One trial (162 participants) reported the number of participants undergoing interventional procedures with any bleeding (Manno 2011). Fewer participants had an intraoperative bleed in the DDAVP arm compared to the placebo arm (RR 0.45, 95% CI 0.24 to 0.85; 1 trial, 162 participants; Analysis 1.10).
Reoperation due to bleeding
Twenty‐three trials (1783 participants) reported the number of participants undergoing reoperation due to bleeding, and all 23 contributed data towards the final pooled estimate (Ansell 1992; Bignami 2016; Brown 1989; Casas 1995; de Prost 1992; Despotis 1999; Frankville 1991; Guay 1992; Hackmann 1989; Hedderich 1990; Horrow 1991a; Horrow 1991b; Lee 2010; Manno 2011; Mongan 1992a; Mongan 1992b; Oliver 2000; Ozkisacik 2001; Pleym 2004; Rocha 1988; Rocha 1994; Salzman 1986; Steinlechner 2011). Results showed no difference in the number of participants who required reoperation due to bleeding between those treated with DDAVP versus placebo (pOR 0.66, 95% CI 0.40 to 1.09l; I2 = 33%; 23 trials, 1783 participants; Analysis 1.11). We found no evidence of a difference between subgroups (Chi2 = 1.40, df = 1 (P = 0.24), I2 = 28.6%). When we restricted analysis to trials:
-
at low risk of bias, the effect estimate was similar (pOR 0.75, 95% CI 0.35 to 1.59; I2 = 14%; 9 trials, 699 participants; analysis not shown) (Bignami 2016; Frankville 1991; Guay 1992; Horrow 1991a; Horrow 1991b; Manno 2011; Oliver 2000; Salzman 1986; Steinlechner 2011);
-
published before 2010 plus those registered prospectively and published after 2010, the effect estimate was unchanged (pOR 0.66, 95% CI 0.40 to 1.09; I2 = 33%; 22 trials, 1599 participants; analysis not shown) (Ansell 1992; Bignami 2016; Brown 1989; Casas 1995; de Prost 1992; Despotis 1999; Frankville 1991; Guay 1992; Hackmann 1989; Hedderich 1990; Horrow 1991a; Horrow 1991b; Lee 2010; Mongan 1992a; Mongan 1992b; Oliver 2000; Ozkisacik 2001; Pleym 2004; Rocha 1988; Rocha 1994; Salzman 1986; Steinlechner 2011).
Cardiac surgery
We found no evidence of a difference in reoperation due to bleeding (pOR 0.64, 95% CI 0.38 to 1.05; I2 = 33%; 19 trials, 1483 participants; Analysis 1.11). When we restricted analysis to trials:
-
at low risk of bias, the effect estimate was similar (RR 0.69, 95% CI 0.32 to 1.48; I2 = 12%; 6 trials, 447 participants; analysis not shown) (Bignami 2016; Frankville 1991; Horrow 1991a; Horrow 1991b; Salzman 1986; Steinlechner 2011);
-
using autologous cell salvage, the direction of effect was reversed, although this finding did not reach statistical significance (RR 1.36, 95% CI 0.50 to 3.68; I2 = 34%; 5 trials, 424 participants; analysis not shown) (Brown 1989; Hackmann 1989; Horrow 1991a; Horrow 1991b; Pleym 2004).
Orthopaedic surgery
One trial in this subgroup reported reoperation due to bleeding. However, no participants in either arm of the trial returned to theatre with bleeding (Guay 1992).
Paediatric cardiac surgery
Owing to the small number of participants, we are uncertain if results showed a difference in the number of participants undergoing reoperation due to bleeding after treatment with DDAVP versus placebo (pOR 6.93, 95% CI 0.14 to 349.88; 1 trial, 60 participants; Analysis 1.11) (Oliver 2000).
Dialysis catheter insertion
One trial in this subgroup reported reoperation due to bleeding. However, no participants in either arm of the trial returned to theatre with bleeding (Lee 2010).
Kidney biopsy
One trial in this subgroup reported reoperation due to bleeding. However, no participants in either arm of the trial returned to theatre with bleeding (Manno 2011).
All‐cause mortality
Twenty‐two trials (1631 participants) reported all‐cause mortality, and all 22 contributed data towards the final pooled estimate (Ansell 1992; Bignami 2016; Clagett 1995; Despotis 1999; Gratz 1992; Hackmann 1989; Hedderich 1990; Jin 2015; Karnezis 1994a; Karnezis 1994b; Kuitunen 1992; Mongan 1992a; Mongan 1992b; Oliver 2000; Pleym 2004; Rocha 1988; Rocha 1994; Salzman 1986; Schott 1995; Seear 1989; Sheridan 1994; Steinlechner 2011). We found no evidence of a difference in all‐cause mortality between participants treated with DDAVP versus placebo (pOR 1.09, 95% CI 0.51 to 2.34; I2 = 3%; 22 trials, 1631 participants; Analysis 1.12). We found no evidence of a difference between subgroups (Chi2 = 4.29, df = 2 (P = 0.12); I2 = 53.4%). When we restricted the analysis to:
-
trials at low risk of bias, the effect estimate was similar (pOR 1.16, 95% CI 0.41 to 3.25; I2 = 31%; 6 trials, 469 participants; analysis not shown) (Bignami 2016; Clagett 1995; Oliver 2000; Salzman 1986; Seear 1989; Steinlechner 2011);
-
trials published before 2010 plus those registered prospectively and published after 2010, the effect estimate was not altered (pOR 1.09, 95% CI 0.51 to 2.34; I2 = 3%; 21 trials, 1529 participants; analysis not shown) (Ansell 1992; Bignami 2016; Clagett 1995; Despotis 1999; Gratz 1992; Hackmann 1989; Hedderich 1990; Karnezis 1994a; Karnezis 1994b; Kuitunen 1992; Mongan 1992a; Mongan 1992b; Oliver 2000; Pleym 2004; Rocha 1988; Rocha 1994; Salzman 1986; Schott 1995; Seear 1989; Sheridan 1994; Steinlechner 2011).
Cardiac surgery
We found no evidence of a difference in all‐cause mortality for participants treated with DDAVP versus placebo (pOR 1.09, 95% CI 0.48 to 2.51; I2 = 0%; 16 trials, 1239 participants; Analysis 1.12). When we restricted the analysis to:
-
trials at low risk of bias, the effect estimate was similar (pOR 1.20, 95% CI 0.36 to 4.02; I2 = 0%; 3 trials, 248 participants; analysis not shown) (Bignami 2016; Salzman 1986; Steinlechner 2011);
-
trials published before 2010 plus those registered prospectively and published after 2010, the effect estimate was not altered (pOR 1.09, 95% CI 0.48 to 2.51; I2 = 0%; 15 trials, 1137 participants; analysis not shown) (Ansell 1992; Bignami 2016; Despotis 1999; Gratz 1992; Hackmann 1989; Hedderich 1990; Kuitunen 1992; Mongan 1992a; Mongan 1992b; Pleym 2004; Rocha 1988; Rocha 1994; Salzman 1986; Sheridan 1994; Steinlechner 2011).
Orthopaedic surgery
Three trials in this subgroup reported all‐cause mortality as an outcome, however, no deaths occurred during these trials (Karnezis 1994a; Karnezis 1994b; Schott 1995).
Vascular surgery
Owing to the small number of participants, we are uncertain if results showed a difference in all‐cause mortality between participants treated with DDAVP versus placebo (pOR 8.50, 95% CI 0.52 to 138.60; 1 trial, 91 participants; Analysis 1.12).
Paediatric cardiac surgery
Owing to the small number of participants, we are uncertain if results showed a difference in all‐cause mortality between participants treated with DDAVP versus placebo (pOR 0.13, 95% CI 0.01 to 2.14; 2 trials, 130 participants; Analysis 1.12).
All thrombotic events (including myocardial infarction, ischaemic stroke, other arterial thromboembolism, and venous thromboembolism)
Twenty‐nine trials (1984 participants) reported thrombotic events, and all 29 contributed data towards the final pooled estimate (Ansell 1992; Bignami 2016; Brown 1989; Casas 1995; Clagett 1995; Despotis 1999; Flordal 1991; Flordal 1992; Gratz 1992; Hedderich 1990; Horrow 1991a; Horrow 1991b; Jin 2015; Karnezis 1994a; Karnezis 1994b; Leino 2010; Lethagen 1991; Manno 2011; Marquez 1992; Mongan 1992a; Mongan 1992b; Pleym 2004; Rocha 1994; Salmenpera 1991; Salzman 1986; Schott 1995; Shao 2015; Sheridan 1994; Steinlechner 2011). We found no evidence of a difference in thrombotic events between participants treated with DDAVP versus placebo (pOR 1.36, 95% CI 0.85 to 2.16; I2 = 0%; 29 trials, 1984 participants; Analysis 1.13). We found no evidence of a difference between subgroups (Chi2 = 1.60, df = 2 (P = 0.45); I2 = 0%). When we restricted the analysis to:
-
trials at low risk of bias, the effect estimate was similar (pOR 1.14, 95% CI 0.51 to 2.58; I2 = 0%; 9 trials, 497 participants; analysis not shown) (Bignami 2016; Clagett 1995; Horrow 1991a; Horrow 1991b; Leino 2010; Manno 2011; Salzman 1986; Shao 2015; Steinlechner 2011);
-
trials published before 2010 plus those registered prospectively and published after 2010, the effect estimate was not altered (pOR 1.36, 95% CI 0.85 to 2.16; I2 = 0%; 26 trials, 1528 participants; analysis not shown) (Ansell 1992; Bignami 2016; Brown 1989; Casas 1995; Clagett 1995; Despotis 1999; Flordal 1991; Flordal 1992; Gratz 1992; Hedderich 1990; Horrow 1991a; Horrow 1991b; Karnezis 1994a; Karnezis 1994b; Leino 2010; Lethagen 1991; Marquez 1992; Mongan 1992a; Mongan 1992b; Pleym 2004; Rocha 1994; Salmenpera 1991; Salzman 1986; Schott 1995; Sheridan 1994; Steinlechner 2011).
Cardiac surgery
We found no evidence of a difference in thrombotic events for cardiac surgery between participants treated with DDAVP versus placebo (pOR 1.46, 95% CI 0.88 to 2.42; I2 = 0%; 19 trials, 1311 participants; Analysis 1.13). When we restricted the analysis to:
-
trials at low risk of bias, the effect estimate was similar (pOR 1.58, 95% CI 0.52 to 4.77; I2 = 0%; 5 trials, 407 participants; analysis not shown) (Bignami 2016; Horrow 1991a; Horrow 1991b; Salzman 1986; Steinlechner 2011);
-
trials published before 2010 plus those registered prospectively and published after 2010, the effect estimate was not altered (pOR 1.46, 95% CI 0.88 to 2.42; I2 = 0%; 18 trials, 1209 participants; analysis not shown) (Ansell 1992; Bignami 2016; Brown 1989; Casas 1995; Despotis 1999; Gratz 1992; Hedderich 1990; Horrow 1991a; Horrow 1991b; Marquez 1992; Mongan 1992a; Mongan 1992b; Pleym 2004; Rocha 1994; Salmenpera 1991; Salzman 1986; Sheridan 1994; Steinlechner 2011).
Orthopaedic surgery
Six trials in the orthopaedic surgery subgroup reported thrombotic events as an outcome, however, these trials reported only a single thrombotic event between them (Analysis 1.13).
Vascular surgery
Owing to the small number of participants, we are uncertain whether results showed a difference in thrombotic events for vascular surgery between participants treated with DDAVP versus placebo (pOR 0.77, 95% CI 0.23 to 2.60; 2 trials, 141 participants; Analysis 1.13) (Clagett 1995; Lethagen 1991).
Sinus surgery
One trial in this subgroup reported thrombotic events as an outcome, however, neither arm of this trial reported any thrombotic events (Shao 2015).
Renal biopsy
One trial in this subgroup reported thrombotic events as an outcome, however, neither arm of this trial reported any thrombotic events (Manno 2011).
Myocardial infarction
Twenty‐six trials (1704 participants) reported myocardial infarction, and all 26 contributed data towards the final pooled estimate (Ansell 1992; Brown 1989; Casas 1995; Clagett 1995; Flordal 1991; Flordal 1992; Gratz 1992; Hedderich 1990; Horrow 1991a; Horrow 1991b; Jin 2015; Karnezis 1994a; Karnezis 1994b; Leino 2010; Lethagen 1991; Manno 2011; Marquez 1992; Mongan 1992a; Mongan 1992b; Pleym 2004; Rocha 1994; Salmenpera 1991; Salzman 1986; Schott 1995; Shao 2015; Steinlechner 2011). We found no evidence of a difference in myocardial infarction between participants treated with DDAVP versus placebo (pOR 1.32, 95% CI 0.70 to 2.46; I2 = 0%; 26 trials, 1704 participants; Analysis 1.14). We found no evidence of a difference between subgroups (Chi2 = 1.24, df = 1 (P = 0.27); I2 = 19.3%). When we restricted the analysis to:
-
trials at low risk of bias, the effect estimate was similar (pOR 0.65, 95% CI 0.16 to 2.67; I2 = 0%; 8 trials, 662 participants; analysis not shown) (Clagett 1995; Horrow 1991a; Horrow 1991b; Leino 2010; Manno 2011; Salzman 1986; Shao 2015; Steinlechner 2011);
-
trials published before 2010 plus those registered prospectively and published after 2010, the effect estimate was not altered (pOR 1.32, 95% CI 0.70 to 2.46; I2 = 0%; 24 trials, 1512 participants; analysis not shown) (Ansell 1992; Brown 1989; Casas 1995; Clagett 1995; Flordal 1991; Flordal 1992; Gratz 1992; Hedderich 1990; Horrow 1991a; Horrow 1991b; Karnezis 1994a; Karnezis 1994b; Leino 2010; Lethagen 1991; Marquez 1992; Mongan 1992a; Mongan 1992b; Pleym 2004; Rocha 1994; Salmenpera 1991; Salzman 1986; Schott 1995; Shao 2015; Steinlechner 2011).
Cardiac surgery
We found no evidence of a difference in myocardial infarction between participants treated with DDAVP versus placebo (pOR 1.52, 95% CI 0.77 to 3.00; I2 = 0%; 16 trials, 1031 participants; Analysis 1.14). When we restricted the analysis to:
-
trials at low risk of bias, the effect estimate was similar (pOR 1.00, 95% CI 0.06 to 16.32; I2 = 0%; 4 trials, 272 participants; analysis not shown) (Horrow 1991a; Horrow 1991b; Salzman 1986; Steinlechner 2011);
-
trials published before 2010 plus those registered prospectively and published after 2010, the effect estimate was not altered (pOR 1.52, 95% CI 0.77 to 3.00; I2 = 0%; 15 trials, 929 participants; analysis not shown) (Ansell 1992; Brown 1989; Casas 1995; Gratz 1992; Hedderich 1990; Horrow 1991a; Horrow 1991b; Marquez 1992; Mongan 1992a; Mongan 1992b; Pleym 2004; Rocha 1994; Salmenpera 1991; Salzman 1986; Steinlechner 2011).
Orthopaedic surgery
Six trials in this subgroup reported myocardial infarction as an outcome, however, no myocardial infarctions occurred during these trials (Flordal 1991; Flordal 1992; Karnezis 1994a; Karnezis 1994b; Leino 2010; Schott 1995).
Vascular surgery
Owing to the small number of participants, we are uncertain whether results showed a difference in myocardial infarction between participants treated with DDAVP versus placebo (pOR 0.55, 95% CI 0.11 to 2.88; 2 trials, 141 participants; Analysis 1.14).
Sinus surgery
One trial in this subgroup reported myocardial infarction as an outcome, however, no myocardial infarctions occurred in either arm of this trial (Shao 2015).
Renal biopsy
One trial in this subgroup reported myocardial infarction as an outcome, however, no myocardial infarctions occurred in either arm of this trial (Manno 2011).
Stroke
Nineteen trials (1277 participants) reported stroke, and all 19 contributed data towards the final pooled estimate (Ansell 1992; Brown 1989; Casas 1995; Clagett 1995; Flordal 1991; Flordal 1992; Gratz 1992; Horrow 1991a; Horrow 1991b; Jin 2015; Karnezis 1994a; Karnezis 1994b; Leino 2010; Manno 2011; Marquez 1992; Rocha 1994; Salzman 1986; Shao 2015; Sheridan 1994). We found no evidence of a difference in stroke for participants treated with DDAVP versus placebo (pOR 2.95, 95% CI 0.94 to 9.24; I2 = 0%; 19 trials, 1277 participants; Analysis 1.15). When we restricted the analysis to:
-
trials at low risk of bias, the effect estimate was similar (pOR 4.09, 95% CI 0.81 to 20.59; I2 = 0%; 7 trials, 619 participants; analysis not shown) (Clagett 1995; Horrow 1991a; Horrow 1991b; Leino 2010; Manno 2011; Salzman 1986; Shao 2015);
-
trials published before 2010 plus those registered prospectively and published after 2010, the effect estimate was not altered (RR 2.07, 95% CI 0.69 to 6.25; I2 = 0%; 16 trials, 923 participants; analysis not shown) (Ansell 1992; Brown 1989; Casas 1995; Clagett 1995; Flordal 1991; Flordal 1992; Gratz 1992; Horrow 1991a; Horrow 1991b; Karnezis 1994a; Karnezis 1994b; Leino 2010; Marquez 1992; Rocha 1994; Salzman 1986; Sheridan 1994).
Cardiac surgery
We found no evidence of a difference in stroke between participants treated with DDAVP versus placebo (pOR 2.95, 95% CI 0.94 to 9.24; I2 = 0%; 11 trials, 733 participants; Analysis 1.15). When we restricted the analysis to:
-
trials at low risk of bias, the effect estimate was similar (pOR 4.09, 95% CI 0.81 to 20.59; I2 = 0%; 3 trials, 229 participants; analysis not shown) (Horrow 1991a; Horrow 1991b; Salzman 1986);
-
trials published before 2010 plus those registered prospectively and published after 2010, the effect estimate was not altered (pOR 2.95, 95% CI 0.94 to 9.24; I2 = 0%; 10 trials, 631 participants; analysis not shown) (Ansell 1992; Brown 1989; Casas 1995; Gratz 1992; Horrow 1991a; Horrow 1991b; Marquez 1992; Rocha 1994; Salzman 1986; Sheridan 1994).
Orthopaedic surgery
Five trials in this subgroup reported stroke as an outcome, however, no strokes occurred during these trials (Flordal 1991; Flordal 1992; Karnezis 1994a; Karnezis 1994b; Leino 2010).
Vascular surgery
One trial in this subgroup reported stroke as an outcome, however, no strokes occurred in either arm of this trial (Clagett 1995).
Sinus surgery
One trial in this subgroup reported stroke as an outcome, however, no strokes occurred in either arm of this trial (Shao 2015).
Renal biopsy
One trial in this subgroup reported stroke as an outcome, however, no strokes occurred in either arm of this trial (Manno 2011).
Venous thromboembolism
Twenty trials (1377 participants) reported venous thromboembolism, and all 20 contributed data towards the final pooled estimate (Ansell 1992; Brown 1989; Casas 1995; Clagett 1995; Flordal 1991; Flordal 1992; Gratz 1992; Horrow 1991a; Horrow 1991b; Jin 2015; Karnezis 1994a; Karnezis 1994b; Leino 2010; Manno 2011; Marquez 1992; Pleym 2004; Rocha 1994; Schott 1995; Shao 2015; Steinlechner 2011). We found no evidence of a difference in venous thromboembolism between participants treated with DDAVP versus placebo (pOR 0.77, 95% CI 0.17 to 3.38; I2 = 0%; 20 trials, 1377 participants; Analysis 1.16). We found no evidence of a difference between subgroups (Chi2 = 1.47, df = 1 (P = 0.23); I2 = 31.8%). When we restricted the analysis to:
-
trials at low risk of bias, the effect estimate was similar (pOR 0.14, 95% CI 0.01 to 2.23: I2 = 0%; 7 trials, 592 participants; analysis not shown) (Clagett 1995; Horrow 1991a; Horrow 1991b; Leino 2010; Manno 2011; Shao 2015; Steinlechner 2011);
-
trials published before 2010 plus those registered prospectively and published after 2010, the effect estimate was not altered (pOR 0.77, 95% CI 0.17 to 3.38; I2 = 0%; 17 trials, 1023 participants; analysis not shown) (Ansell 1992; Brown 1989; Casas 1995; Clagett 1995; Flordal 1991; Flordal 1992; Gratz 1992; Horrow 1991a; Horrow 1991b; Karnezis 1994a; Karnezis 1994b; Leino 2010; Marquez 1992; Pleym 2004; Rocha 1994; Schott 1995; Steinlechner 2011).
Cardiac surgery
We found no evidence of a difference in venous thromboembolism for participants treated with DDAVP versus placebo (pOR 0.53, 95% CI 0.11 to 2.62; I2 = 0%; 11 trials, 754 participants; Analysis 1.16). When we restricted the analysis to:
-
trials at low risk of bias, the effect estimate was similar (pOR 0.14, 95% CI 0.01 to 2.23; I2 = 0%; 3 trials, 202 participants; analysis not shown) (Horrow 1991a; Horrow 1991b; Steinlechner 2011);
-
trials published before 2010 plus those registered prospectively and published after 2010, the effect estimate was not altered (pOR 0.53, 95% CI 0.11 to 2.62; I2 = 0%; 10 trials, 652 participants; analysis not shown) (Ansell 1992; Brown 1989; Casas 1995; Gratz 1992; Horrow 1991a; Horrow 1991b; Marquez 1992; Pleym 2004; Rocha 1994; Steinlechner 2011).
Orthopaedic surgery
Six trials in this subgroup reported venous thromboembolism as an outcome, however, no venous thromboembolic events occurred during these trials (Flordal 1991; Flordal 1992; Karnezis 1994a; Karnezis 1994b; Leino 2010; Schott 1995).
Vascular surgery
One trial in this subgroup reported venous thromboembolism as an outcome, however, no venous thromboembolic events occurred in either arm of this trial (Clagett 1995).
Sinus surgery
One trial in this subgroup reported venous thromboembolism as an outcome, however, no venous thromboembolic events occurred in either arm of this trial (Shao 2015).
Renal biopsy
One trial in this subgroup reported venous thromboembolism as an outcome, however, no venous thromboembolic events occurred in either arm of this trial (Manno 2011).
Clinically important hypotension
Eighteen trials (1183 participants) reported clinically important hypotension, and all 18 contributed data towards the final pooled estimate (Bignami 2016; Brown 1989; Despotis 1999; Dilthey 1993; Frankville 1991; Letts 1998; Manno 2011; Marquez 1992; Mongan 1992a; Mongan 1992b; Oliver 2000; Pleym 2004; Reich 1991; Rocha 1994; Salmenpera 1991; Salzman 1986; Schott 1995; Shao 2015). Clinically important hypotension was more frequent for participants treated with DDAVP than for those given placebo (RR 2.32, 95% CI 1.37 to 3.91; I2 = 0%; 18 trials, 1183 participants; Analysis 1.17). We found no evidence of a difference between subgroups (Chi2 = 0.83, df = 2 (P = 0.66); I2 = 0%). When we restricted the analysis to:
-
trials at low risk of bias, the effect estimate was similar (RR 2.34, 95% CI 0.71 to 7.69; I2 = 0%; 7 trials, 587 participants; analysis not shown) (Bignami 2016; Despotis 1999; Frankville 1991; Manno 2011; Oliver 2000; Salzman 1986; Shao 2015);
-
trials published before 2010 plus those registered prospectively and published after 2010, the effect estimate was altered (RR 2.32, 95% CI 1.37 to 3.91; I2 = 0%; 16 trials, 931 participants; analysis not shown) (Brown 1989; Despotis 1999; Dilthey 1993; Frankville 1991; Letts 1998; Manno 2011; Marquez 1992; Mongan 1992a; Mongan 1992b; Oliver 2000; Pleym 2004; Reich 1991; Rocha 1994; Salmenpera 1991; Salzman 1986; Schott 1995).
Cardiac surgery
Clinically important hypotension was more frequent for participants treated with DDAVP than for those given placebo (RR 2.88, 95% CI 1.32 to 6.30; I2 = 0%; 13 trials, 762 participants; Analysis 1.17).
When we restricted the analysis to trials at low risk of bias, the effect estimate was similar (RR 2.98, 95% CI 0.64 to 13.90; I2 = 0%; 3 trials, 245 participants; analysis not shown) (Bignami 2016; Frankville 1991; Salzman 1986).
Orthopaedic surgery
Clinically important hypotension was more frequent for participants treated with DDAVP than for those given placebo (RR 2.05, 95% CI 0.99 to 4.24; I2 = 0%; 2 trials, 109 participants; Analysis 1.17).
Paediatric cardiac surgery
Owing to the small number of participants, we are uncertain whether results showed a difference between participants treated with DDAVP versus placebo (RR 0.94, 95% CI 0.06 to 14.27; 1 trial, 60 participants; Analysis 1.17).
Sinus surgery
One trial in this subgroup reported clinically important hypotension as an outcome (Shao 2015), however, no clinically important episodes of hypotension occurred in either arm of this trial.
Kidney biopsy
One trial in this subgroup reported clinically important hypotension as an outcome (Manno 2011), however, no clinically important episodes of hypotension occurred in either arm of this trial.
Quality of life
No trials reported quality of life as an outcome.
DDAVP versus placebo: platelet dysfunction subgroup
In 11 of the trials (606 participants) that compared DDAVP versus placebo, at least 75% of participants had platelet dysfunction.
Primary outcomes
Volume of blood transfused intraoperatively
None of the trials that reported this outcome included participants with platelet dysfunction.
Total volume of blood transfused
The total volume of red cells transfused was less for those treated with DDAVP than for controls (MD ‐0.65 units, 95% CI ‐1.16 to ‐0.13 units; I2 = 36%; 6 trials, 388 participants; Analysis 2.1).
Number of participants transfused with blood intraoperatively
Owing to the small number of participants, we are uncertain whether results showed a difference in the number of participants transfused with blood intraoperatively between participants treated with DDAVP and those given placebo (RR 0.55, 95% CI 0.22 to 1.38 units; 1 trial, 29 participants; Analysis 2.2).
Total number of participants transfused with blood
We found no difference in the number of participants transfused with blood when treated with DDAVP versus placebo (RR 0.83, 95% CI 0.66 to 1.04; I2 = 14%; 5 trials, 258 participants; Analysis 2.3).
Intraoperative blood loss
No trials reported intraoperative blood loss for this subgroup.
Total blood loss
Ten trials (547 participants) in the platelet dysfunction subgroup reported total blood loss. Four trials reported this outcome in a way that did not allow inclusion in meta‐analysis, and so we reported this information narratively in Table 6 (de Prost 1992; Dilthey 1993; Hemșinli 2012a; Hemșinli 2012b). We are very uncertain whether total blood loss is less for participants treated with DDAVP versus placebo owing to high levels of heterogeneity (MD ‐253.93 mL, 95% CI ‐408.01 to ‐99.85 mL; I2 = 75%; 6 trials, 422 participants; Analysis 2.4).
Secondary outcomes
Reoperation due to bleeding
The number of participants returning to theatre with bleeding was lower for participants treated with DDAVP than for those given placebo (pOR 0.39, 95% CI 0.18 to 0.84; I2 = 0%; 6 trials, 413 participants; Analysis 2.5).
All‐cause mortality
Owing to the small number of events, we are uncertain whether results showed a difference in all‐cause mortality between participants treated with DDAVP versus placebo (pOR 0.72, 95% CI 0.12 to 4.22; I2 = 24%; 6 trials, 422 participants; Analysis 2.6).
All thrombotic events (including myocardial infarction, ischaemic stroke, other arterial thromboembolism, and venous thromboembolism)
Owing to the small number of events, we are uncertain whether results showed a difference in thrombotic events between participants treated with DDAVP versus placebo (pOR 1.58, 95% CI 0.60 to 4.17; I2 = 0%; 7 trials, 422 participants; Analysis 2.7).
Myocardial infarction
Owing to the small number of events, we are uncertain whether results showed a difference in myocardial infarction between participants treated with DDAVP versus placebo (pOR 2.72, 95% CI 0.60 to 12.37; I2 = 0%; 4 trials, 277 participants; Analysis 2.8).
Stroke
Owing to the small number of events, we are uncertain whether results showed a difference in stroke between participants treated with DDAVP versus placebo (pOR 1.21, 95% CI 0.07 to 20.17; I2 = 0%; 3 trials, 157 participants; Analysis 2.9).
Venous thromboembolism
Owing to the small number of events, we are uncertain whether results showed a difference in venous thromboembolism between participants treated with DDAVP versus placebo (pOR 0.56, 95% CI 0.06 to 5.50; I2 = 60%; 3 trials, 157 participants; Analysis 2.10).
Clinically important hypotension
Clinically important hypotension was more frequent among participants treated with DDAVP than in those given placebo (RR 6.58, 95% CI 1.18 to 36.76; I2 = 0%; 5 trials, 315 participants; Analysis 2.11).
DDAVP versus tranexamic acid
Three trials compared DDAVP versus tranexamic acid (Ellis 2001; Horrow 1991c; Zohar 2001).
Primary outcomes
Volume of blood transfused intraoperatively
No trial reported volume of blood transfused intraoperatively as an outcome.
Total volume of blood transfused
Two orthopaedic surgery trials (60 participants) reported total volume of blood transfused (Ellis 2001; Zohar 2001). One trial (20 participants) reported this outcome in a way that did not allow inclusion in meta‐analysis; we reported this information in Table 7. Investigators transfused more red cells for participants treated with DDAVP than for those given tranexamic acid (MD 0.60 units, 95% CI 0.09 to 1.11 units; 1 trial, 40 participants; Analysis 3.1).
| Trial | Reason not included in meta‐analysis | DDAVP arm | Tranexamic acid arm |
| Orthopaedic surgery | |||
| Reported as mean only | 0.7 units (n = 10) | 0.1 units (n = 10) | |
Number of participants transfused with blood intraoperatively
No trial reported the number of participants transfused with blood intraoperatively.
Total number of participants transfused with blood
Three trials (135 participants) reported the total number of participants transfused with blood (Ellis 2001; Horrow 1991c; Zohar 2001). More participants were transfused with blood when given DDAVP than tranexamic acid (RR 2.42, 95% CI 1.04 to 5.64; I2 = 0%; 3 trials, 135 participants; Analysis 3.2).
Cardiac surgery
One trial (75 participants) reported the total number of participants transfused with blood (Horrow 1991c). Owing to the small number of participants, we are uncertain whether results showed a difference in the number transfused with blood when treated with DDAVP versus tranexamic acid (RR 1.46, 95% CI 0.82 to 2.59; 1 trial, 75 participants).
Orthopaedic surgery
Two trials (105 participants) reported the total number of participants transfused with blood (Ellis 2001; Zohar 2001). More participants were transfused with blood when given DDAVP than tranexamic acid (RR 4.15, 95% CI 1.58 to 10.90; I2 = 0%; 2 trials, 60 participants).
Intraoperative blood loss
No trial reported intraoperative blood loss.
Total blood loss
Three trials (133 participants) reported total blood loss (Hemșinli 2012c; Horrow 1991c; Zohar 2001). One trial (28 participants) reported this outcome in a way that did not allow inclusion in meta‐analysis, and so we reported this information in Table 8. We pooled the results of the remaining trials for meta‐analysis because baseline blood loss was similar between trials. Results showed a greater volume of blood loss among participants treated with DDAVP than tranexamic acid (MD 142.81 mL, 95% CI 79.78 to 205.84 mL; I2 = 0%; 2 trials, 115 participants; Analysis 3.3).
| Trial | Reason not included in meta‐analysis | DDAVP arm | Tranexamic acid arm |
| Adult cardiac surgery | |||
| Reported as mean (no standard deviation) | 1430 mL (n = 10) | 535 mL (n = 18) | |
Cardiac surgery
One trial (75 participants) reported total blood loss (Horrow 1991c). Results showed a greater volume of blood loss among participants treated with DDAVP than tranexamic acid (MD 115.00 mL, 95% CI 35.38 to 194.62 mL; 1 trial, 75 participants).
Orthopaedic surgery
One trial (75 participants) reported total blood loss (Zohar 2001). Results showed a greater volume of blood loss among participants treated with DDAVP than tranexamic acid (MD 180.00 mL, 95% CI 86.82 to 273.18 mL; 1 trial, 40 participants).
Secondary outcomes
Reoperation due to bleeding
One cardiac surgery trial reported reoperation due to bleeding, but only a single event occurred (Analysis 3.4).
Number of participants with any bleeding (interventional procedures only, e.g. kidney biopsy)
No trial reported the number of participants with any bleeding.
All‐cause mortality
No trial reported all‐cause mortality.
All thrombotic events (including myocardial infarction, ischaemic stroke, other arterial thromboembolism, and venous thromboembolism)
Two trials (115 participants) reported thrombotic events, and both contributed to the final pooled estimate (Horrow 1991c; Zohar 2001). Owing to the small number of events, we are uncertain whether results showed a difference in the number of participants treated with DDAVP with thrombotic events versus those treated with tranexamic acid (RR 2.92, 95% CI 0.32 to 26.83; I2 = 0%; 2 trials, 115 participants; Analysis 3.5).
Cardiac surgery
Owing to the small number of participants, we are uncertain whether results showed a difference between the number of participants who had thrombotic events treated with DDAVP versus tranexamic acid (RR 2.92, 95% CI 0.32 to 26.83; 1 trial, 75 participants) (Horrow 1991c).
Orthopaedic surgery
One trial reported thrombotic events, but no events occurred in either arm of the trial (Zohar 2001).
Myocardial infarction
Two trials (115 participants) reported myocardial infarction, but no events occurred in either trial (Analysis 3.6).
Stroke
Two trials (115 participants) reported stroke, and both contributed to the final pooled estimate (Horrow 1991c; Zohar 2001). Owing to the small number of events, we are uncertain whether results showed a difference between the number of participants who had a stroke treated with DDAVP versus tranexamic acid (RR 2.92, 95% CI 0.32 to 26.83; I2 = 0%; 2 trials, 115 participants; Analysis 3.7).
Cardiac surgery
Owing to the small number of events, we are uncertain whether results showed a difference in the number of participants who had a stroke treated with DDAVP versus tranexamic acid (RR 2.92, 95% CI 0.32 to 26.83; 1 trial, 75 participants; Analysis 3.7).
Orthopaedic surgery
One trial reported stroke, but no events occurred in either arm of the trial (Analysis 3.7).
Venous thromboembolism
Two trials (115 participants) reported venous thromboembolism, but no events occurred in either trial (Analysis 3.8).
Clinically important hypotension
No trial reported clinically important hypotension as an outcome.
Quality of life
No trial reported quality of life as an outcome.
DDAVP versus aprotinin
Two trials compared DDAVP versus aprotinin (Casas 1995; Rocha 1994).
Primary outcomes
Volume of blood transfused intraoperatively
No trial reported volume of blood transfused intraoperatively as an outcome.
Total volume of blood transfused
One cardiac surgery trial (53 participants) reported total volume of blood transfused. Results of this trial are reported in Table 9.
| Trial | Reason not included in meta‐analysis | DDAVP arm | Aprotinin arm |
| Adult cardiac surgery | |||
| Reported as mL/m2 body surface area (mean ± standard deviation) | 740.4 ± 416.3 mL/m2 (n = 25) | 366.1 ± 331.9 mL/m2 (n = 28) | |
Number of participants transfused with blood intraoperatively
No trial reported the number of participants transfused with blood intraoperatively.
Total number of participants transfused with blood
One trial (99 participants) reported the total number of participants transfused with blood (Casas 1995). More participants treated with DDAVP were transfused with blood than those treated with aprotinin (RR 2.41, 95% CI 1.45 to 4.02; 1 trial, 99 participants; Analysis 4.1).
Intraoperative blood loss
No trial reported intraoperative blood loss.
Total blood loss
Two cardiac surgery trials (152 participants) reported total volume of blood transfused but in a format that was not suitable for meta‐analysis (Casas 1995; Rocha 1994). Results of these trials are reported in Table 10.
| Trial | Reason not included in meta‐analysis | DDAVP arm | Aprotinin arm |
| Adult cardiac surgery | |||
| Reported as mL/m2 body surface area (mean ± standard deviation) | 400 ± 192 mL/m2 (n = 50) | 195 ± 146 mL/m2 (n = 48) | |
| Reported as mL/m2 body surface area (mean ± standard deviation) | 551.8 ± 324.1 mL/m2 (n = 25) | 358.5 ± 156.3 mL/m2 (n = 28) | |
Secondary outcomes
Reoperation due to bleeding
Two cardiac surgery trials reported reoperation due to bleeding (Casas 1995; Rocha 1994). Owing to the small number of events, we are uncertain whether results showed a difference in the numbers of participants who required reoperation owing to bleeding (pOR 1.93, 95% CI 0.20 to 19.04; I2 = 0%; 2 trials, 152 participants; Analysis 4.2).
Number of participants with any bleeding (interventional procedures only)
No trial reported the number of participants with any bleeding.
All‐cause mortality
One trial reported all‐cause mortality, but no deaths occurred in either arm of the trial (Analysis 4.3).
All thrombotic events (including myocardial infarction, ischaemic stroke, other arterial thromboembolism, and venous thromboembolism)
Two cardiac surgery trials (152 participants) reported thrombotic events, and both contributed to the final pooled estimate (Casas 1995; Rocha 1994). Owing to the small number of events, we are uncertain whether results showed a difference in thrombotic events between those treated with DDAVP and those given aprotinin (pOR 0.98, 95% CI 0.06 to 15.89; I2 = 0%; 2 trials, 152 participants; Analysis 4.4).
Myocardial infarction
Two cardiac surgery trials (152 participants) reported myocardial infarction, but no events occurred in either trial (Casas 1995; Rocha 1994; Analysis 4.5).
Stroke
Two cardiac surgery trials (152 participants) reported stroke, but only a single event occurred (Casas 1995; Rocha 1994; Analysis 4.6).
Venous thromboembolism
Two trials (152 participants) reported venous thromboembolism, but no events occurred in either trial (Casas 1995; Rocha 1994; Analysis 4.7).
Clinically important hypotension
One trial (53 participants) reported clinically important hypotension, but no events occurred in either arm of the trial (Rocha 1994; Analysis 4.8).
Quality of life
No trial reported quality of life as an outcome.
Discussion
Summary of main results
DDAVP versus placebo or standard care
Sixty‐two trials compared DDAVP (1‐deamino‐8‐D‐arginine‐vasopressin; desmopressin) versus placebo or standard care. Compared with placebo, DDAVP may lead to little or no difference in the total volume of red cells transfused for orthopaedic surgery, vascular surgery, or hepatic surgery (Analysis 1.2). DDAVP may slightly reduce the total volume of red cells transfused in adult cardiac surgery (Analysis 1.2). However, this difference is small and is unlikely to be of clinical benefit. DDAVP probably leads to little or no difference in the total number of people receiving a red cell transfusion (Analysis 1.5). It is uncertain whether DDAVP improves or worsens total blood loss because the quality of evidence is very low (Analysis 1.7). DDAVP may lead to little or no difference in the risk of mortality (Analysis 1.12) or thrombotic events (Analysis 1.13).
DDAVP versus placebo or standard care: platelet dysfunction subgroup
Ten trials compared DDAVP versus placebo or standard care in people with platelet dysfunction. Compared with placebo, DDAVP may lead to a reduction in the total volume of red cells transfused (Analysis 2.1) and in total blood loss (Analysis 2.4). DDAVP probably leads to little or no difference in the total number of people receiving a red cell transfusion (Analysis 2.3). It is uncertain whether DDAVP improves or worsens all‐cause mortality (Analysis 2.6) or risk of thrombotic events (Analysis 2.7) compared with placebo because the quality of evidence is very low.
DDAVP versus tranexamic acid
Four trials compared DDAVP versus tranexamic acid. DDAVP may increase the total volume of red cells transfused (Analysis 3.1) and total blood loss (Analysis 1.7) compared with tranexamic acid. It is uncertain whether DDAVP improves or worsens the total number of people receiving a red cell transfusion (Analysis 3.2) or risk of thrombotic events (Analysis 3.5) compared with tranexamic acid because the quality of evidence is very low.
DDAVP versus aprotinin
Two trials compared DDAVP versus aprotinin. DDAVP may increase the total number of people who receive a red cell transfusion compared with aprotinin (Analysis 4.1). It is uncertain whether DDAVP improves or worsens risk of all‐cause mortality (Analysis 4.3) or thrombotic events (Analysis 4.4) compared with aprotinin because the quality of evidence is very low.
Overall completeness and applicability of evidence
This review provides the most up‐to‐date evidence for administration of DDAVP to minimise blood transfusion. The review identified 65 trials with 3874 participants and four ongoing trials with 147 participants. Most of these trials (46/65; 71%) were performed over 20 years ago, and changes in surgical and transfusion practice since that time may alter the relevance of these findings. The most common trial settings were adult cardiac surgery (39/65 trials; 60%) and orthopaedic surgery (12/65 trials; 18%); relatively few trials have examined the use of DDAVP in other types of surgery. Only 20 of the 65 (31%) trials administered DDAVP preoperatively, three trials (5%) administered DDAVP in combination with an antifibrinolytic agent, 12 trials (18%) included more than 75% of participants with platelet dysfunction, and no trials included people with thrombocytopenia or coagulopathy. These key groups are relatively under‐represented in the review dataset. Across all outcomes, available data on overall mortality and adverse events due to thrombotic events are insufficient to show clearly whether an increase, or a decrease, in events is associated with DDAVP administration. No trials reported quality of life.
Quality of the evidence
We have summarised the GRADE quality of evidence in summary of findings Table for the main comparison, summary of findings Table 2, summary of findings Table 3, and summary of findings Table 4. The overall quality of the evidence ranged from very low to moderate. We downgraded all outcomes one point for risk of bias. Most trials did not report sufficient detail to allow assessment of bias. We considered only one trial to be at low risk of bias in all domains. Domains with high risk of bias included blinding of outcome assessors, incomplete outcome data, and selective reporting. Heterogeneity was a problem for continuous outcomes, total volume of blood loss, and total number of red cells transfused owing to large differences in baseline blood loss between procedures. Mortality and thrombotic events were rare and, consequently, introduced risk of imprecision. Lastly, the trials in this review did not represent many types of surgery, and this introduced inconsistency. This was particularly the case for comparisons of DDAVP versus tranexamic acid or aprotinin.
Potential biases in the review process
We noted no obvious biases within the review process. We conducted a wide search ‐ that was not restricted by language or by full‐text publication ‐ to optimise the chances of identifying all relevant trials. Two review authors who were blinded to the other's results performed screening and data extraction in duplicate to minimise bias. A limitation of this review is that for many outcomes, the original authors published results in a format that did not allow inclusion in meta‐analysis (e.g. reported medians and ranges instead of means and standard deviations). This meant that many published trials did not contribute data to the outcomes, particularly for total volume of blood transfused and total blood loss.
Agreements and disagreements with other studies or reviews
This review is an update of a Cochrane Review published in 2004 (Carless 2004). The original review identified 29 eligible trials. In 2008, another published meta‐analysis included 38 eligible trials (Crescenzi 2008). Compared with the most recent systematic review of DDAVP for prevention of perioperative transfusion (Crescenzi 2008), this review identified 26 more trials with an additional 1386 participants. For the present update, we included interventional procedures and children, neither of which were eligible for inclusion in the original Cochrane Review. The overall findings of this update are similar to those of the original review, which also found small decreases in the total volume of red cells transfused and in total blood loss, but no difference in the number of participants receiving a red cell transfusion nor in overall mortality or thrombotic events. The original review examined heterogeneity through sensitivity analysis by subgroups (cardiac surgery and other): participants taking antiplatelet agents, use of cell salvage, use of a transfusion protocol, and duration of cardiopulmonary bypass. Data on the subgroup of participants with platelet dysfunction or taking antiplatelet agents have been co‐published separately (Desborough 2017).

Study flow diagram.

Risk of bias summary: review authors' judgements about each risk of bias item for each included study.
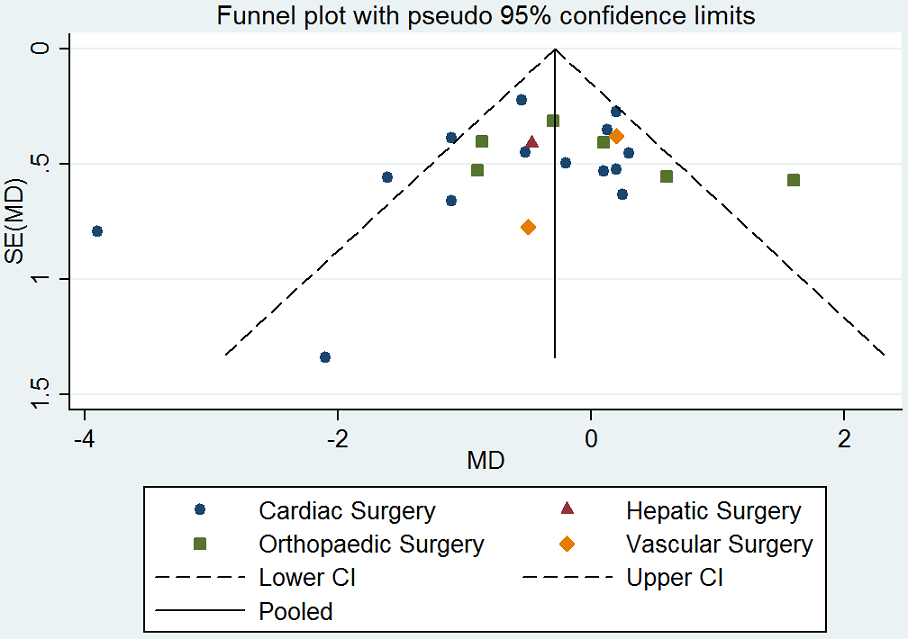
Funnel plot of comparison: desmopressin vs placebo: total red cell volume transfused. CI: confidence interval; MD: mean difference; SE: standard error.

Funnel plot of comparison: desmopressin vs placebo: number of participants receiving a red cell transfusion. CI: confidence interval; RR: relative risk.

Funnel plot of comparison: desmopressin vs placebo: total blood loss. CI: confidence interval; MD: mean difference; SE: standard error.
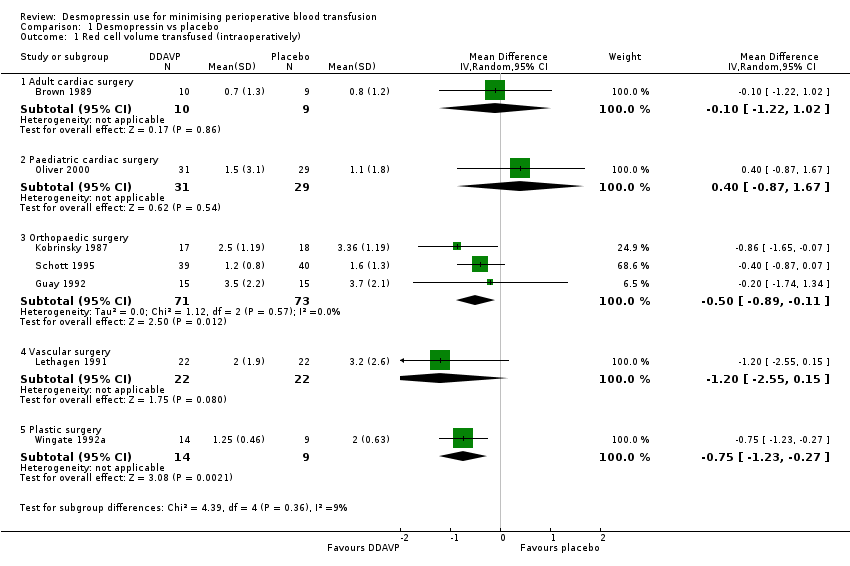
Comparison 1 Desmopressin vs placebo, Outcome 1 Red cell volume transfused (intraoperatively).
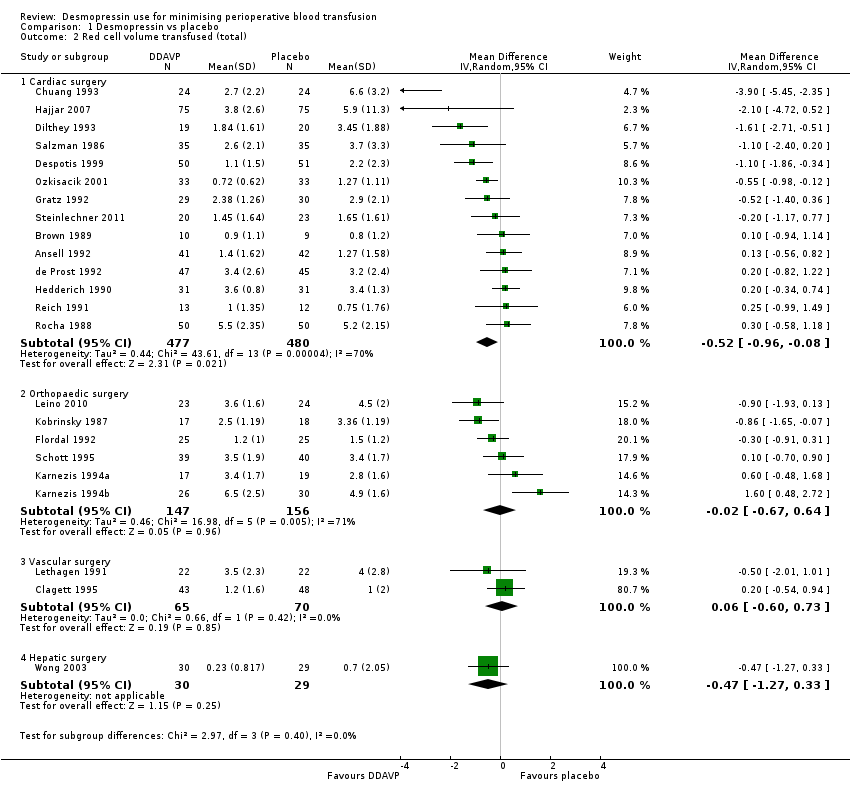
Comparison 1 Desmopressin vs placebo, Outcome 2 Red cell volume transfused (total).

Comparison 1 Desmopressin vs placebo, Outcome 3 Red cell volume transfused (children only, total).
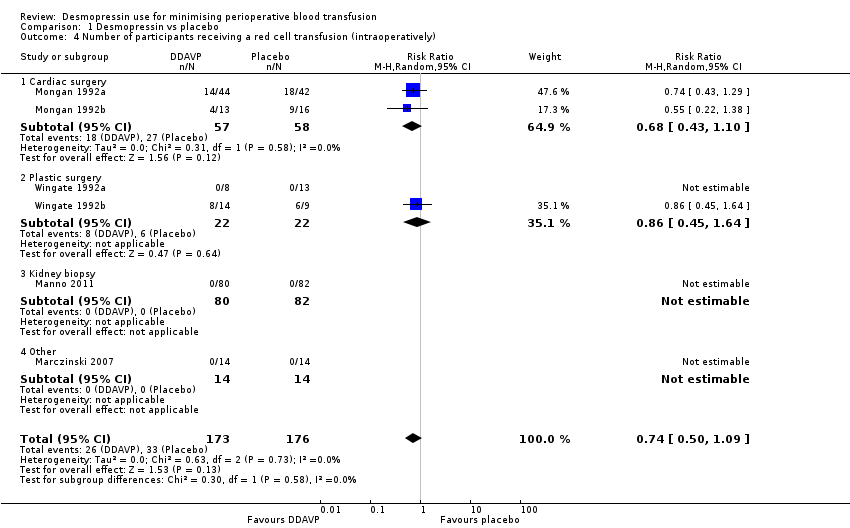
Comparison 1 Desmopressin vs placebo, Outcome 4 Number of participants receiving a red cell transfusion (intraoperatively).
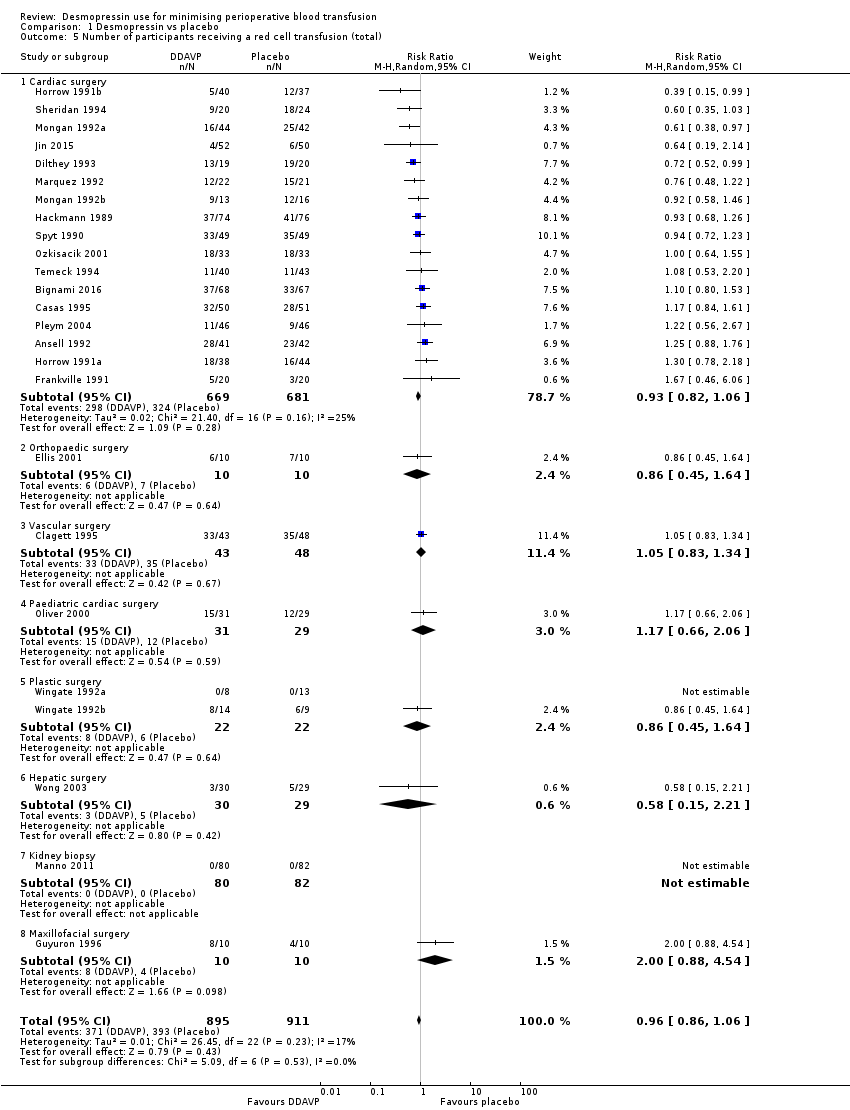
Comparison 1 Desmopressin vs placebo, Outcome 5 Number of participants receiving a red cell transfusion (total).

Comparison 1 Desmopressin vs placebo, Outcome 6 Blood loss (intraoperative).

Comparison 1 Desmopressin vs placebo, Outcome 7 Blood loss (total).
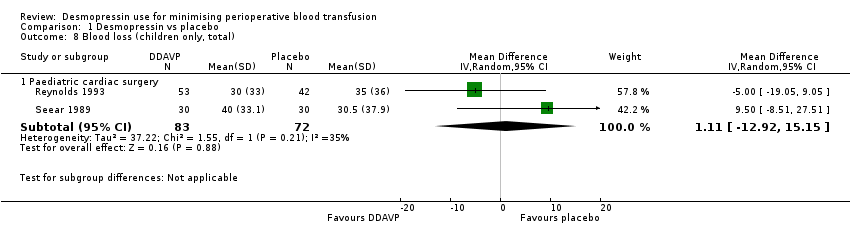
Comparison 1 Desmopressin vs placebo, Outcome 8 Blood loss (children only, total).
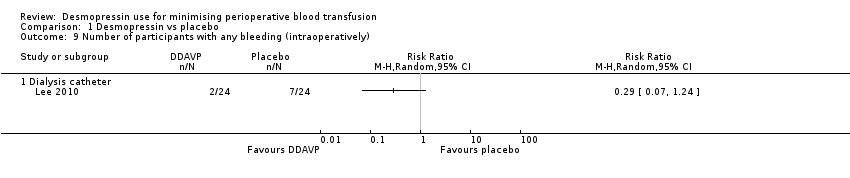
Comparison 1 Desmopressin vs placebo, Outcome 9 Number of participants with any bleeding (intraoperatively).
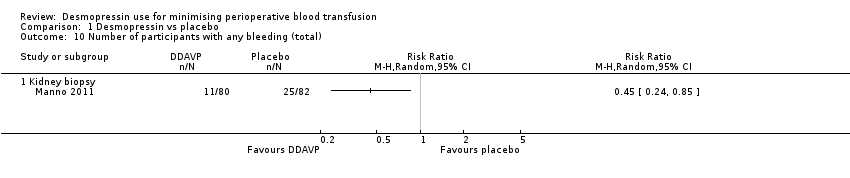
Comparison 1 Desmopressin vs placebo, Outcome 10 Number of participants with any bleeding (total).
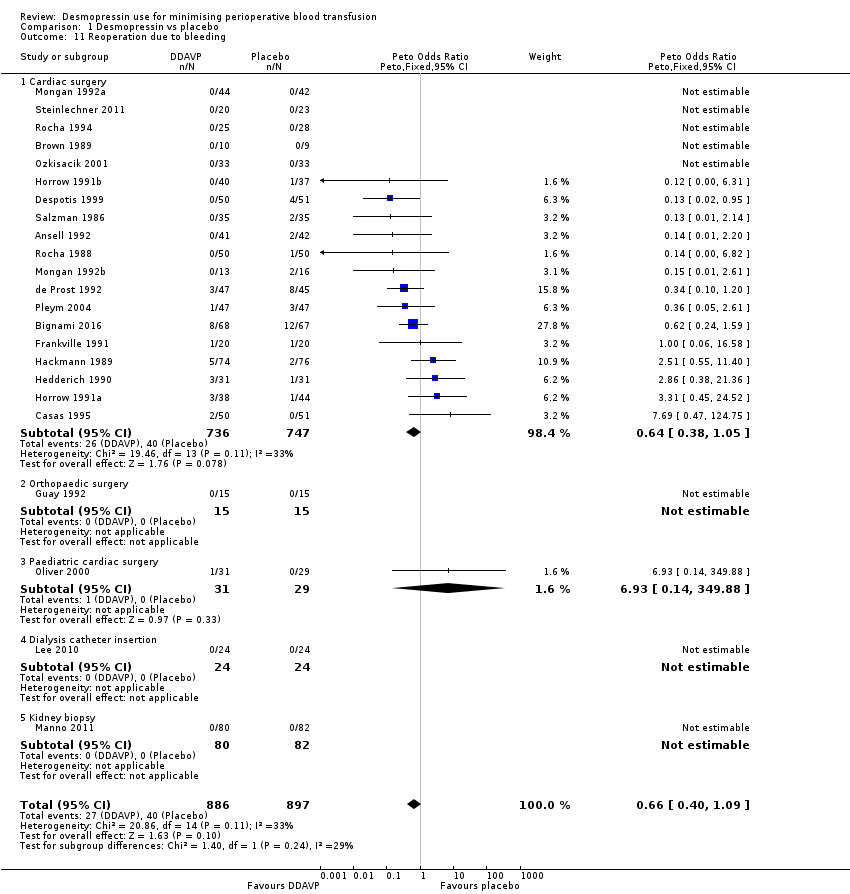
Comparison 1 Desmopressin vs placebo, Outcome 11 Reoperation due to bleeding.

Comparison 1 Desmopressin vs placebo, Outcome 12 All‐cause mortality.
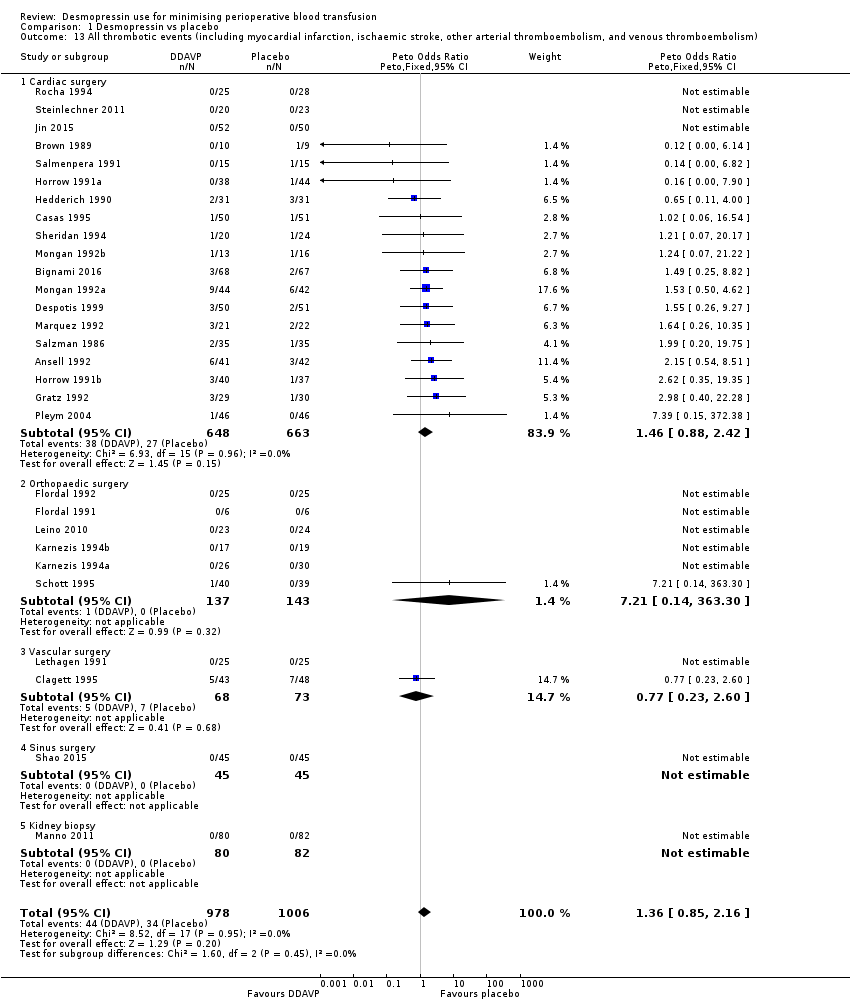
Comparison 1 Desmopressin vs placebo, Outcome 13 All thrombotic events (including myocardial infarction, ischaemic stroke, other arterial thromboembolism, and venous thromboembolism).
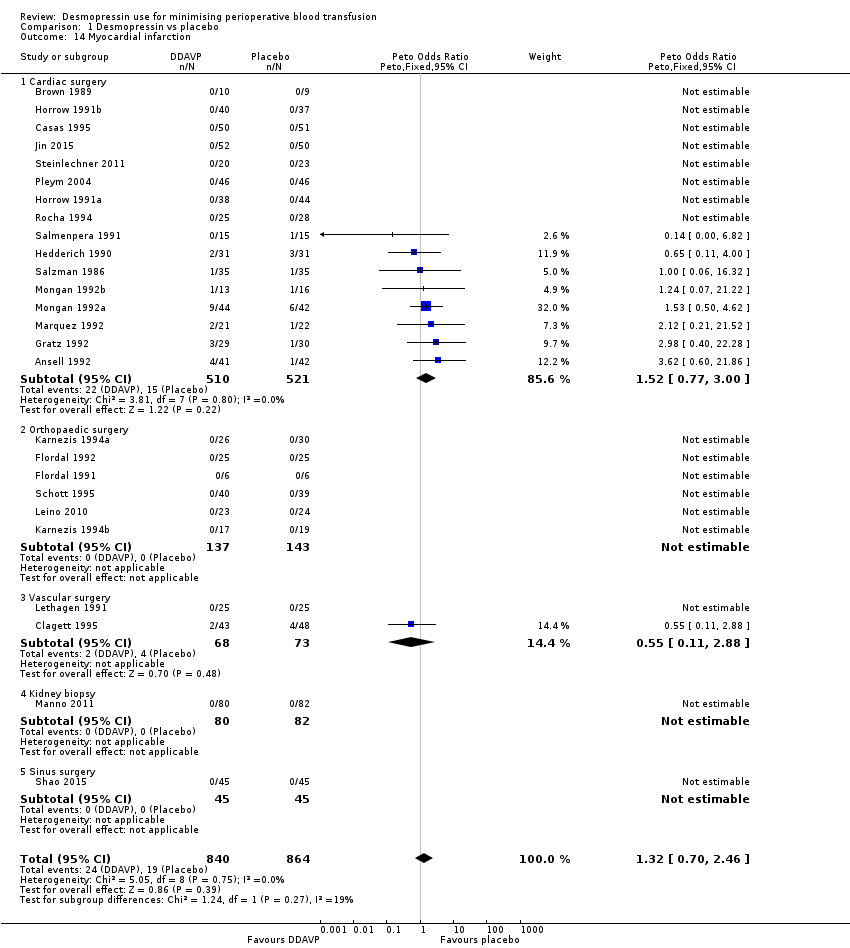
Comparison 1 Desmopressin vs placebo, Outcome 14 Myocardial infarction.

Comparison 1 Desmopressin vs placebo, Outcome 15 Stroke.
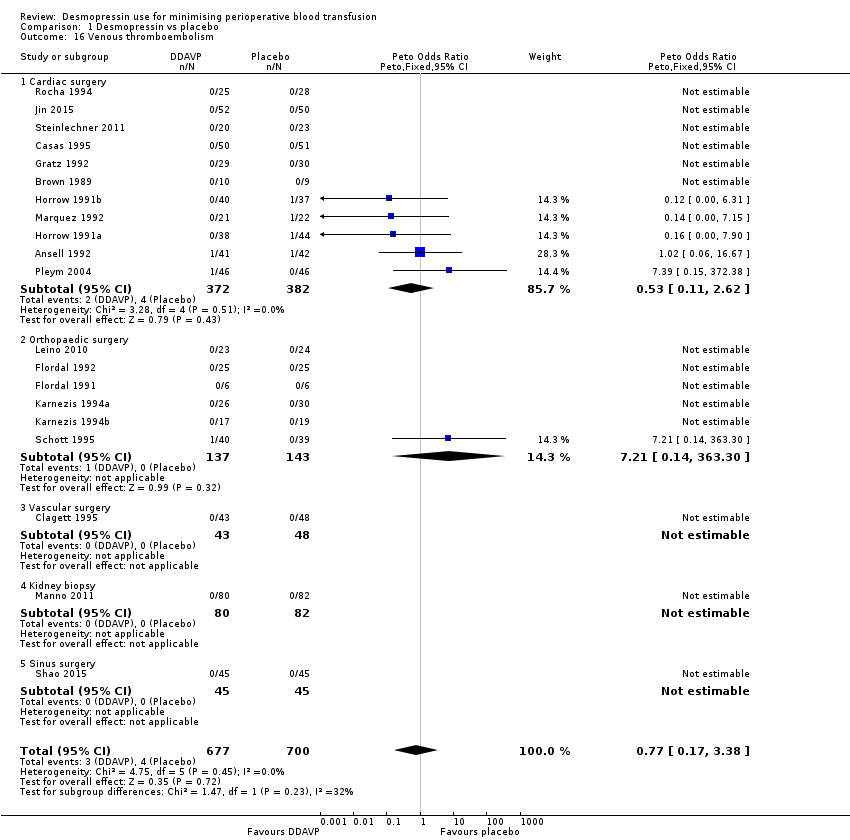
Comparison 1 Desmopressin vs placebo, Outcome 16 Venous thromboembolism.
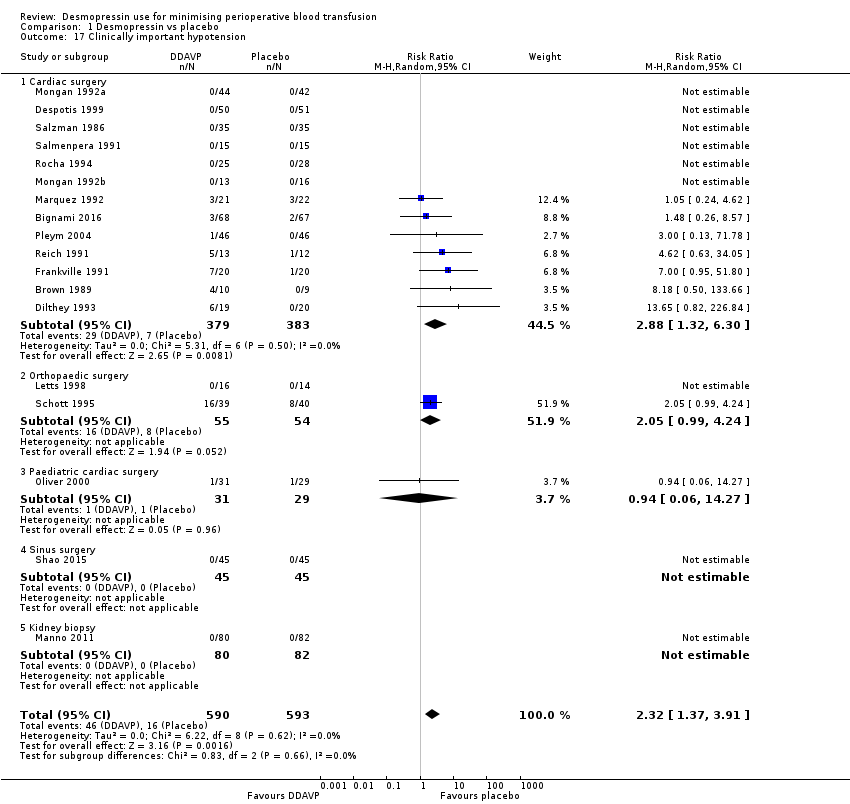
Comparison 1 Desmopressin vs placebo, Outcome 17 Clinically important hypotension.

Comparison 2 Desmopressin vs placebo (platelet dysfunction), Outcome 1 Red cell volume transfused (total).

Comparison 2 Desmopressin vs placebo (platelet dysfunction), Outcome 2 Number of participants receiving a red cell transfusion (intraoperatively).

Comparison 2 Desmopressin vs placebo (platelet dysfunction), Outcome 3 Number of participants receiving a red cell transfusion (total).
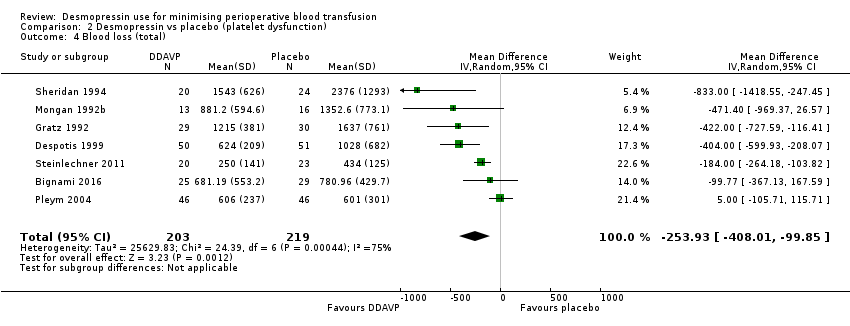
Comparison 2 Desmopressin vs placebo (platelet dysfunction), Outcome 4 Blood loss (total).
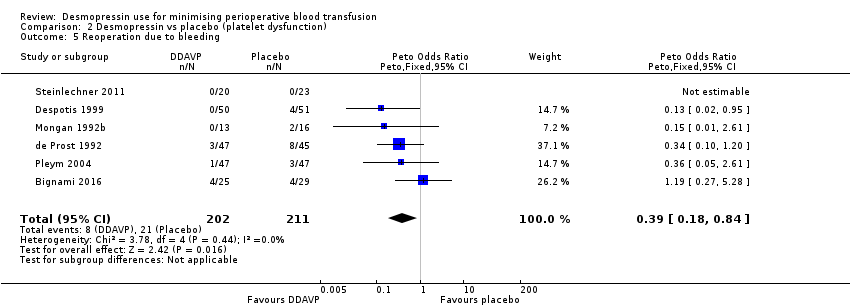
Comparison 2 Desmopressin vs placebo (platelet dysfunction), Outcome 5 Reoperation due to bleeding.

Comparison 2 Desmopressin vs placebo (platelet dysfunction), Outcome 6 All‐cause mortality.
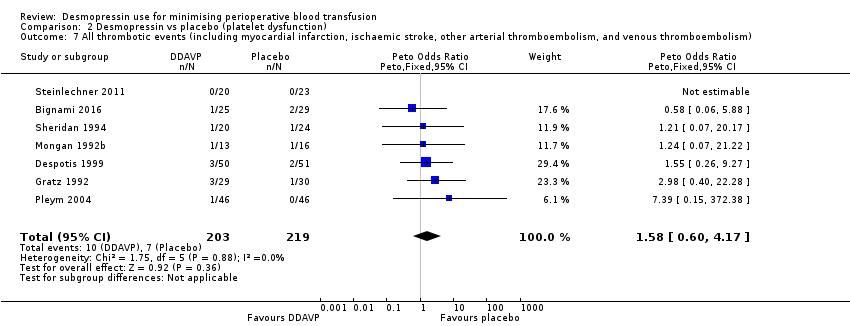
Comparison 2 Desmopressin vs placebo (platelet dysfunction), Outcome 7 All thrombotic events (including myocardial infarction, ischaemic stroke, other arterial thromboembolism, and venous thromboembolism).

Comparison 2 Desmopressin vs placebo (platelet dysfunction), Outcome 8 Myocardial infarction.
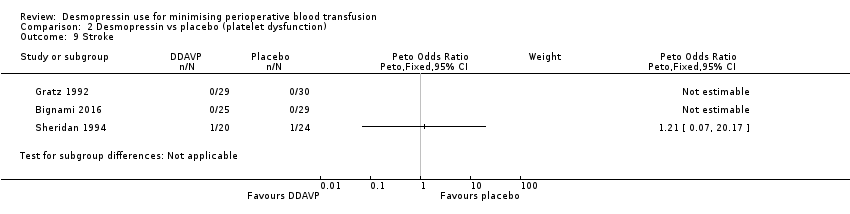
Comparison 2 Desmopressin vs placebo (platelet dysfunction), Outcome 9 Stroke.

Comparison 2 Desmopressin vs placebo (platelet dysfunction), Outcome 10 Venous thromboembolism.
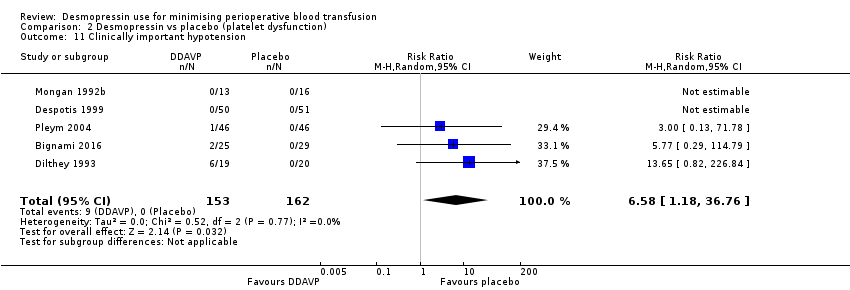
Comparison 2 Desmopressin vs placebo (platelet dysfunction), Outcome 11 Clinically important hypotension.

Comparison 3 Desmopressin vs tranexamic acid, Outcome 1 Red cell volume transfused (total).
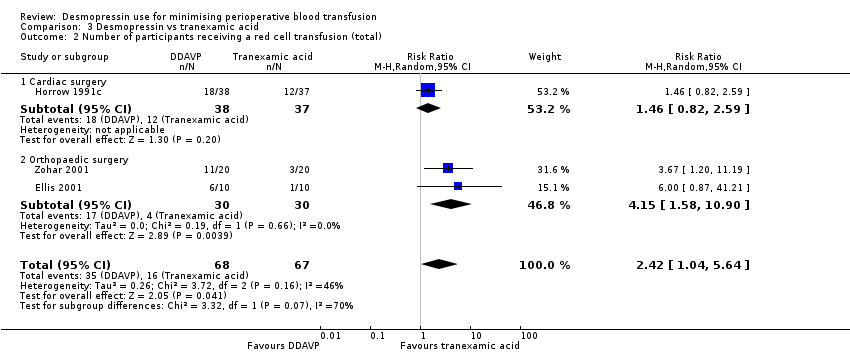
Comparison 3 Desmopressin vs tranexamic acid, Outcome 2 Number of participants receiving a red cell transfusion (total).
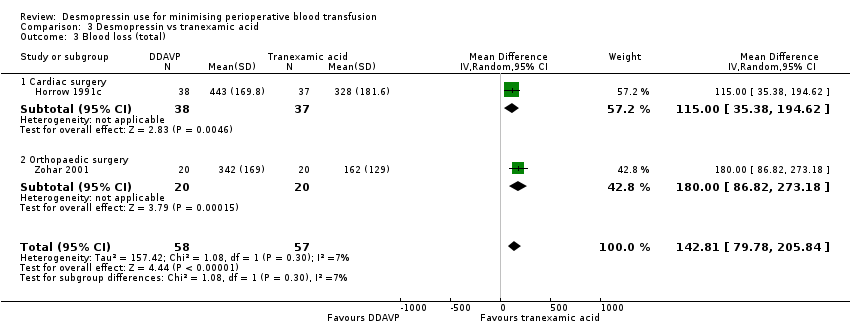
Comparison 3 Desmopressin vs tranexamic acid, Outcome 3 Blood loss (total).
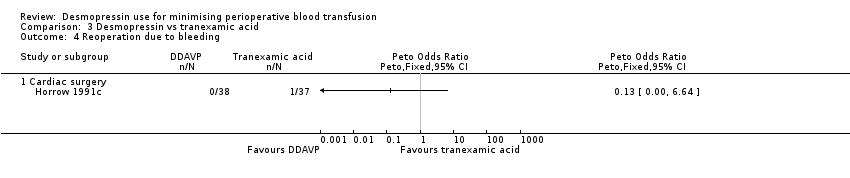
Comparison 3 Desmopressin vs tranexamic acid, Outcome 4 Reoperation due to bleeding.

Comparison 3 Desmopressin vs tranexamic acid, Outcome 5 All thrombotic events (including myocardial infarction, ischaemic stroke, other arterial thromboembolism, and venous thromboembolism).

Comparison 3 Desmopressin vs tranexamic acid, Outcome 6 Myocardial infarction.

Comparison 3 Desmopressin vs tranexamic acid, Outcome 7 Stroke.

Comparison 3 Desmopressin vs tranexamic acid, Outcome 8 Venous thromboembolism.

Comparison 4 Desmopressin vs aprotinin, Outcome 1 Number of participants receiving a red cell transfusion (total).

Comparison 4 Desmopressin vs aprotinin, Outcome 2 Reoperation due to bleeding.
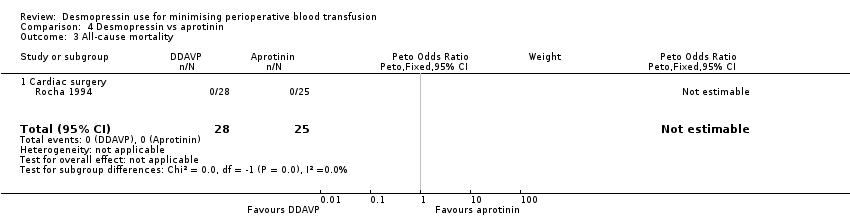
Comparison 4 Desmopressin vs aprotinin, Outcome 3 All‐cause mortality.

Comparison 4 Desmopressin vs aprotinin, Outcome 4 All thrombotic events (including myocardial infarction, ischaemic stroke, other arterial thromboembolism, and venous thromboembolism).

Comparison 4 Desmopressin vs aprotinin, Outcome 5 Myocardial infarction.

Comparison 4 Desmopressin vs aprotinin, Outcome 6 Stroke.
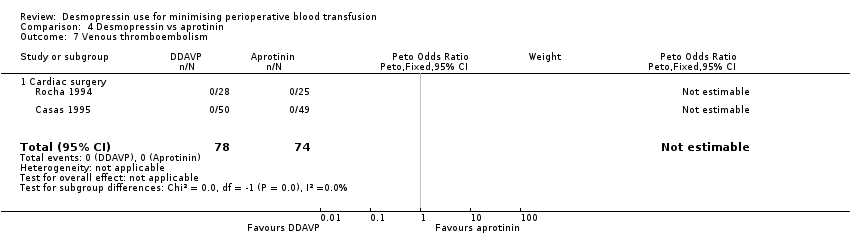
Comparison 4 Desmopressin vs aprotinin, Outcome 7 Venous thromboembolism.

Comparison 4 Desmopressin vs aprotinin, Outcome 8 Clinically significant hypotension.
| Participant or population: participants undergoing surgery | ||||||
| Outcomes | Anticipated absolute effects* (95% CI) | Relative effect | No. of participants | Quality of the evidence | Comments | |
| Risk with placebo | Risk with desmopressin | |||||
| Red cell volume transfused (total) | Adult cardiac surgery: red cell volume transfused in the desmopressin group was 0.52 units less (0.96 fewer to 0.08 fewer units, 14 RCTs, 957 participants) | 1454 | ⊕⊕⊝⊝ | Data not pooled due to clinical heterogeneity and reported as subgroups | ||
| Orthopaedic surgery: red cell volume transfused in the desmopressin group was 0.02 units less (0.67 less to 0.64 more units, 6 RCTs, 303 participants) | ||||||
| Vascular surgery: red cell volume transfused in the desmopressin group was 0.06 units more (0.60 less to 0.73 more units, 2 RCTs, 135 participants) | ||||||
| Hepatic surgery: red cell volume transfused in the desmopressin group was 0.47 units less (1.27 less to 0.33 more units, 1 RCT, 59 participants) | ||||||
| Number of participants receiving a red cell transfusion (total) | 450 per 1000 | 436 per 1000 | RR 0.96 | 1806 | ⊕⊕⊕⊝ | |
| Blood loss (total) | Cardiac surgery: total blood loss in the desmopressin group was 135.24 mL less (210.8 mL to 59.68 mL less, 22 RCTs, 1358 participants). | 1643 | ⊕⊝⊝⊝ | Data not pooled owing to clinical heterogeneity and reported as subgroups | ||
| Orthopaedic surgery: total blood loss in the desmopressin group was 285.76 mL less (514.99 mL to 56.53 mL less, 5 RCTs, 241 participants) | ||||||
| Vascular surgery: total blood loss in the desmopressin group was 582 mL less (1264.07 mL less to 100.07 mL more, 1 RCT, 44 participants) | ||||||
| All‐cause mortality | 16 per 1000 | 17 per 1000 | pOR 1.09 (0.51 to 2.34) | 1631 | ⊕⊕⊝⊝ | |
| All thrombotic events (including myocardial infarction, ischaemic stroke, other arterial thromboembolism, and venous thromboembolism) | 34 per 1000 | 44 per 1000 | pOR 1.36 (0.85 to 2.16) | 1984 | ⊕⊕⊝⊝ | |
| Quality of life | Not reported | ‐ | (No studies) | ‐ | ||
| *The risk in the intervention group (and its 95% confidence interval) is based on the assumed risk in the comparison group and the relative effect of the intervention (and its 95% CI) | ||||||
| GRADE Working Group grades of evidence | ||||||
| aDowngraded one level due to risk of bias: inadequate reporting of blinding and incomplete outcome data bDowngraged one level for inconsistency: I2 = 66% cDowngraded one level for inconsistency: I2 = 73% and sensitivity analysis unable to determine cause of heterogeneity dDowngraded one level for suspected publication bias eDowngraded one level due to imprecision, as confidence intervals include both clinically important benefit and clinically important harm | ||||||
| Participant or population: participants with platelet dysfunction undergoing surgery | ||||||
| Outcomes | Anticipated absolute effects* (95% CI) | Relative effect | No. of participants | Quality of the evidence | Comments | |
| Risk with placebo | Risk with desmopressin | |||||
| Red cell volume transfused (total) | Red cell volume transfused was 2.6 units | Red cell volume transfused in the desmopressin group was 0.65 units less (1.16 less to 0.13 less) | ‐ | 388 | ⊕⊕⊝⊝ | |
| Number of participants receiving a red cell transfusion (total) | 541 per 1000 | 449 per 1000 | RR 0.83 | 258 | ⊕⊕⊝⊝ | |
| Blood loss (total) | Mean total blood loss was 1098 mL | Total blood loss in the desmopressin group was 253.93 mL less (408.01 mL less to 99.85 mL less) | ‐ | 422 | ⊕⊕⊝⊝ | |
| All‐cause mortality | 14 per 1000 | 10 per 1000 (2 to 59) | pOR 0.72 (0.12 to 4.22) | 422 | ⊕⊝⊝⊝ | |
| All thrombotic events (including myocardial infarction, ischaemic stroke, other arterial thromboembolism, and venous thromboembolism) | 32 per 1000 | 51 per 1000 | pOR 1.58 | 422 | ⊕⊝⊝⊝ | |
| Quality of life | Not reported | ‐ | (No studies) | ‐ | ||
| *The risk in the intervention group (and its 95% confidence interval) is based on the assumed risk in the comparison group and the relative effect of the intervention (and its 95% CI) | ||||||
| GRADE Working Group grades of evidence | ||||||
| aDowngraded one level for risk of bias bDowngraded one level for inconsistency due to variation in baseline level of transfusion and blood loss cDowngraded two levels for imprecision, as confidence intervals include clinically important benefit and clinically important harm with low background event rate dDowngraded one level for imprecision | ||||||
| Participant or population: participants undergoing surgery | ||||||
| Outcomes | Anticipated absolute effects* (95% CI) | Relative effect | No. of participants | Quality of the evidence | Comments | |
| Risk with tranexamic acid | Risk with desmopressin | |||||
| Red cell volume transfused (total) | Mean red cell volume transfused was 0.2 units | Red cell volume transfused in the desmopressin group was 0.6 units more (0.09 more to 1.11 more) | ‐ | 40 | ⊕⊕⊝⊝ | |
| Number of participants receiving a red cell transfusion (total) | 239 per 1000 | 578 per 1000 | RR 2.42 | 135 | ⊕⊝⊝⊝ | |
| Blood loss (total) | Mean blood loss was 270 mL | Total blood loss in the desmopressin group was 142.81 mL more (79.78 mL more to 205.84 mL more) | ‐ | 115 | ⊕⊕⊝⊝ | |
| All‐cause mortality | Not reported | ‐ | (No studies) | ‐ | ||
| All thrombotic events (including myocardial infarction, ischaemic stroke, other arterial thromboembolism, and venous thromboembolism) | 18 per 1000 | 51 per 1000 | RR 2.92 | 115 | ⊕⊝⊝⊝ | |
| Quality of life | Not reported | ‐ | (No studies) | ‐ | ||
| *The risk in the intervention group (and its 95% confidence interval) is based on the assumed risk in the comparison group and the relative effect of the intervention (and its 95% CI) | ||||||
| GRADE Working Group grades of evidence | ||||||
| aDowngraded one level for risk of bias bDowngraded one level for indirectness because most types of surgery or procedures were not represented by the included trials cDowngraded one level for imprecision owing to wide confidence intervals dDowngraded two levels for imprecision owing to very wide confidence intervals eOutcome not downgraded for indirectness because already downgraded three levels for other reasons | ||||||
| Participant or population: participants undergoing surgery | ||||||
| Outcomes | Anticipated absolute effects* (95% CI) | Relative effect | No. of participants | Quality of the evidence | Comments | |
| Risk with aprotinin | Risk with desmopressin | |||||
| Red cell volume transfused (total) | Not reported | ‐ | (No studies) | ‐ | ||
| Number of participants receiving a red cell transfusion (total) | 265 per 1000 | 639 per 1000 | RR 2.41 | 99 | ⊕⊕⊝⊝ | |
| Blood loss (total) | Not reported | ‐ | (No studies) | ‐ | ||
| All‐cause mortality | No deaths in either arm of the trial | Not estimable | 53 | ⊕⊝⊝⊝ | ||
| All thrombotic events (including myocardial infarction, ischaemic stroke, other arterial thromboembolism, and venous thromboembolism) | 14 per 1000 | 13 per 1000 | pOR 0.98 | 152 | ⊕⊝⊝⊝ | |
| Quality of life | Not reported | ‐ | (No studies) | ‐ | ||
| *The risk in the intervention group (and its 95% confidence interval) is based on the assumed risk in the comparison group and the relative effect of the intervention (and its 95% CI) | ||||||
| GRADE Working Group grades of evidence | ||||||
| aDowngraded one level for risk of bias bDowngraded one level for indirectness because most types of surgery or procedures were not represented by the included trials cDowngraded two levels for imprecision (no deaths in either arm) dNot downgraded for indirectness because already downgraded three levels for other reasons eDowngraded two levels for imprecision (very wide confidence intervals) | ||||||
| Trial (country) | Number of participants | Surgery type | Cases | Antiplatelet agents | Anticoagulants (%) | Coagulopathy (%) | Thrombocytopenia (%) | Antifibrinolytics (%) | Transfusion protocol | Timing of blood loss or transfusion assessment (hours) |
| (Japan) | 9 | Cardiac | ‐ | ‐ | ‐ | ‐ | ‐ | ‐ | ‐ | 24 |
| (Japan) | 11 | Cardiac | ‐ | ‐ | ‐ | ‐ | ‐ | ‐ | ‐ | 24 |
| (Turkey) | 40 | Orthopaedic | Elective | ‐ | ‐ | ‐ | ‐ | ‐ | ‐ | 24 |
| (Sweden) | 19 | Cardiac | Elective | 0 | 0 | ‐ | ‐ | ‐ | ‐ | ‐ |
| (USA) | 83 | Cardiac | Elective | ‐ | ‐ | ‐ | ‐ | DDAVP: 2‐4a Placebo: 0 | ‐ | 24 |
| (Italy) | 135 | Cardiac | Elective | DDAVP: 38b Placebo: 43b | ‐ | DDAVP: 1‐5 Placebo: 1‐5 | ‐ | 100c | Yes | 24 |
| (USA) | 39 | Cardiac | Elective | DDAVP: 60b Placebo: 50b | ‐ | 0 | ‐ | ‐ | ‐ | 24 |
| (Spain) | 149 | Cardiac | Elective | DDAVP: 14b Placebo: 9‐8b Aprotinin: 14‐6b | 0 | 0 | ‐ | DDAVP: 0 Placebo: 0 Aprotinin: 100d | Yes | 24 |
| (China) | 96 | Cardiac | ‐ | ‐ | ‐ | ‐ | ‐ | ‐ | ‐ | 24 |
| (USA) | 91 | Vascular | Elective | 0 | ‐ | ‐ | ‐ | ‐ | ‐ | 72 |
| (France) | 92 | Cardiac | ‐ | 100e | ‐ | ‐ | 0 | DDAVP: 4‐3d Placebo: 13‐3d | Yes | 24 |
| (USA) | 101 | Cardiac | Elective | DDAVP: 52b Placebo: 66b 100f | DDAVP: 6 Placebo: 0 | ‐ | ‐ | DDAVP 50a Placebo 61a | No | 24 |
| (Germany) | 39 | Cardiac | Elective | 100b | 0 | 0 | ‐ | 0 | Yes | 24 |
| (Israel) | 30 | Orthopaedic | Elective | ‐ | ‐ | ‐ | ‐ | DDAVP: 0 TXA: 100c | Yes | 72 |
| (Sweden) | 12 | Orthopaedic | Elective | ‐ | ‐ | ‐ | ‐ | ‐ | ‐ | 24 |
| (Sweden) | 50 | Orthopaedic | Elective | ‐ | ‐ | ‐ | ‐ | ‐ | ‐ | ‐ |
| (USA) | 40 | Cardiac | Elective | 0 | 0 | 0 | 0 | ‐ | ‐ | 24 |
| (USA) | 59 | Cardiac | Elective | 100b | ‐ | ‐ | 0 | ‐ | ‐ | 24 |
| (Canada) | 30 | Orthopaedic | Elective | 0 | 0 | 0 | 0 | ‐ | Yes | 24 |
| (USA) | 20 | Maxillofacial | Elective | ‐ | ‐ | 0 | ‐ | ‐ | ‐ | 24 |
| (Canada) | 150 | Cardiac | Elective | DDAVP: 21‐6b Placebo: 14‐5b | ‐ | 0 | 0 | ‐ | ‐ | 24 |
| (Brazil) | 150 | Cardiac | ‐ | ‐ | ‐ | ‐ | ‐ | ‐ | ‐ | 72 |
| (Canada) | 62 | Cardiac | Elective | DDAVP: 38‐7b Placebo: 41.9b | ‐ | ‐ | ‐ | ‐ | ‐ | 18 blood loss 48 transfusion |
| (Turkey) | 20 | Cardiac | Emergency | 100b | ‐ | ‐ | ‐ | 0 | ‐ | 30 |
| (Turkey) | 34 | Cardiac | Emergency | 100b | ‐ | ‐ | ‐ | 100c | ‐ | 30 |
| (Turkey) | 28 | Cardiac | Emergency | 100b | ‐ | ‐ | ‐ | DDAVP: 0 TXA: 100c | ‐ | 30 |
| (USA) | 82 | Cardiac | Elective | ‐ | 0 | ‐ | ‐ | 0 | Yes | 12 |
| (USA) | 77 | Cardiac | Elective | ‐ | 0 | ‐ | ‐ | 100c | Yes | 12 |
| (USA) | 75 | Cardiac | Elective | ‐ | 0 | ‐ | ‐ | DDAVP: 0 TXA: 100c | Yes | 12 |
| (China) | 102 | Cardiac | Elective | ‐ | 0 | 0 | 0 | 100c | ‐ | 6 |
| (USA) | 36 | Orthopaedic | Elective | ‐ | 0 | ‐ | ‐ | ‐ | Yes | 24 |
| (USA) | 56 | Orthopaedic | Elective | ‐ | 0 | ‐ | ‐ | ‐ | Yes | 24 |
| (USA) | 35 | Cardiac | Elective | 0 | ‐ | ‐ | ‐ | ‐ | ‐ | 34 |
| (Finland) | 30 | Cardiac | Elective | 0 | 0 | ‐ | ‐ | ‐ | Yes | 16 |
| (USA) | 23 | Not reported | ‐ | ‐ | ‐ | ‐ | ‐ | ‐ | ‐ | ‐ |
| (South Korea) | 48 | Dialysis catheter | Elective | 100g | ‐ | ‐ | 0 | ‐ | ‐ | ‐ |
| (Finland) | 71 | Orthopaedic | Elective | 0 | 0 | 0 | ‐ | ‐ | Yes | 96 |
| (Sweden) | 50 | Vascular | Elective | 0 | 0 | 0 | ‐ | ‐ | Yes | ‐ |
| (Canada) | 30 | Orthopaedic | Elective | ‐ | ‐ | ‐ | ‐ | ‐ | ‐ | Intraoperative only |
| (Italy) | 162 | Kidney biopsy | Elective | 0 | 0 | ‐ | ‐ | ‐ | ‐ | 72 |
| (USA) | 65 | Cardiac | Elective | 0 | 0 | ‐ | ‐ | ‐ | Yes | 24 |
| (Netherlands) | 28 | Orthopaedic/Breast/Abdominal | Elective | 0 | 0 | 0 | 0 | ‐ | ‐ | 48 |
| (USA) | 86 | Cardiac | Elective | 0 | 0 | ‐ | ‐ | ‐ | Yes | 24 |
| (USA) | 29 | Cardiac | Elective | 100h | 0 | ‐ | ‐ | ‐ | Yes | 24 |
| (USA) | 60 | Paediatric cardiac | Elective | DDAVP: 9.7b Placebo: 3.4b | DDAVP: 6.5 Placebo: 6.9 | ‐ | ‐ | ‐ | No | 24 |
| (Turkey) | 66 | Cardiac | Elective | 0 | ‐ | 0 | ‐ | ‐ | Yes | 24 |
| (Norway) | 92 | Cardiac | Elective | 100b | 0 | 0 | 0 | DDAVP: 6.5c Placebo: 17.4c | Yes | 16 |
| (USA) | 27 | Cardiac | Elective | DDAVP: 28.6b Placebo: 38.5b | ‐ | 0 | 0 | ‐ | ‐ | 24 |
| (USA) | 95 | Paediatric cardiac | ‐ | ‐ | ‐ | ‐ | ‐ | ‐ | ‐ | 24 |
| (Spain) | 100 | Cardiac | Elective | ‐ | ‐ | 0 | 0 | ‐ | ‐ | 72 |
| (Spain) | 109 | Cardiac | Elective | ‐ | ‐ | 0 | 0 | DDAVP (1): 0 DDAVP (2): 0 Control: 0 Aprotinin: 100d | ‐ | 72 |
| (Finland) | 30 | Cardiac | Elective | 0 | 0 | 0 | ‐ | ‐ | Yes | 16 |
| (USA) | 70 | Cardiac | Elective | ‐ | ‐ | ‐ | ‐ | ‐ | ‐ | 24 |
| (Sweden) | 79 | Orthopaedic | Elective | 0 | 0 | 0 | 0 | ‐ | Yes | 24 |
| (Canada) | 60 | Paediatric cardiac | ‐ | ‐ | ‐ | ‐ | ‐ | ‐ | ‐ | 24 |
| (China) | 90 | Sinus | Elective | 0 | 0 | 0 | 0 | ‐ | ‐ | Intraoperative only |
| (Canada) | 44 | Cardiac | Elective | 100b | 0 | 0 | 0 | ‐ | ‐ | 24 |
| (UK) | 98 | Cardiac | Elective | DDAVP: 14.3b Placebo: 10.2b | 0 | ‐ | ‐ | ‐ | Yes | ˜24 |
| (Austria) | 43 | Cardiac | Elective | 100g | 0 | ‐ | ‐ | ‐ | Yes | 24 |
| (USA) | 83 | Cardiac | Elective | ‐ | ‐ | ‐ | ‐ | DDAVP: 20a Placebo: 30.2a | ‐ | 24 |
| (USA) | 21 | Orthopaedic | Elective | 0 | 0 | 0 | 0 | ‐ | Yes | 24 |
| (USA) | 23 | Plastic | Elective | ‐ | ‐ | ‐ | ‐ | ‐ | ‐ | 24 |
| (USA) | 21 | Plastic | Elective | ‐ | ‐ | ‐ | ‐ | ‐ | ‐ | 24 |
| (Hong Kong) | 59 | Hepatic | Elective | 0 | 0 | 0 | ‐ | ‐ | Yes | Intraoperative only |
| (Israel) | 40 | Orthopaedic | Elective | ‐ | 0 | ‐ | ‐ | DDAVP: 0 TXA: 100c | Yes | 12 |
| Blank cells indicate that information was not reported in the original papers | ||||||||||
| Trial | DDAVP dose(s) (μg/kg) | Timing of dose | Timing summary | Comparator(s) |
| Preoperative DDAVP | ||||
| 0.3 | Induction of anaesthesia | Preoperative | Placebo | |
| 0.3 (× 2) | At start of surgery and again after 6 hours | Preoperative | Placebo | |
| 0.3 (× 2) | At start of surgery and again after 6 hours | Preoperative | Placebo | |
| 10 μg/m2 | At time of first skin incision | Preoperative | Placebo | |
| 20 μg | 30 minutes preoperatively | Preoperative | Placebo | |
| 10 μg/m2 | Immediately after induction of anaesthesia | Preoperative | Placebo | |
| 0.3 | After anaesthetic induction | Preoperative | Placebo | |
| 0.3 | Not reported | Preoperative | Placebo | |
| 0.4 | At start of surgery | Preoperative | Placebo | |
| DDAVP 0.2 μg/kg | ||||
| 0.3 | Immediately before start of operation | Preoperative | Placebo | |
| 10 μg/m2 | Immediately after induction of anaesthesia | Preoperative | Placebo | |
| 0.3 | 1 hour before biopsy | Preoperative | Placebo | |
| 15 μg to 45 μg depending on weight | Not reported | Preoperative | Placebo | |
| 0.3 (× 2) | Post induction of anaesthesia and again after 6 hours | Preoperative | Placebo | |
| 0.3 | After induction of anaesthesia | Preoperative | Placebo | |
| 0.3 | After induction of anaesthesia | Preoperative | Placebo | |
| 0.3 | Not reported | Preoperative | Placebo | |
| 0.3 | After induction of anaesthesia | Preoperative | Placebo | |
| 0.3 | After induction of anaesthesia | Preoperative | Placebo | |
| 0.3 | After induction of anaesthesia | Preoperative | Placebo | |
| DDAVP administered at end of operation | ||||
| 0.3 | 15 minutes after reversal of heparin | End of operation | Placebo | |
| 0.3 | 15 minutes after reversal of heparin | End of operation | Placebo | |
| 0.3 | 15 minutes after reversal of heparin | End of operation | Placebo | |
| 0.3 | Immediately after reversal of heparin | End of operation | Placebo | |
| 0.3 | In event of excessive bleeding, after reversal of heparin | End of operation/postoperative | Placebo | |
| 0.3 | Immediately after reversal of heparin | End of operation | Placebo | |
| 0.3 | Immediately after reversal of heparin | End of operation | Placebo | |
| Aprotinina | ||||
| 0.3 | 60 minutes after reversal of heparin | End of operation | Placebo | |
| 20 μg | 15 minutes after heparinisation and before aortic cross‐clamp application | End of operation | Placebo | |
| 0.4 | Unclear | End of operation | Placebo | |
| 0.3 | 5 minutes after reversal of heparin | End of operation | Placebo | |
| 0.3 | Before removal of tourniquet | End of operation | Placebo | |
| Tranexamic acidb | ||||
| 0.3 | 5 minutes after reversal of heparin | End of operation | Placebo | |
| 0.3 | Immediately after reversal of heparin | End of operation | Placebo | |
| 0.3 | Immediately after reversal of heparin | End of operation | Placebo | |
| 0.3 | Immediately after surgery | End of operation | Placebo | |
| 0.3 | Immediately after reversal of heparin | End of operation | Placebo | |
| 0.3 | Immediately after reversal of heparin | End of operation | Placebo | |
| 0.3 | Immediately after reversal of heparin | End of operation | Placebo | |
| 0.3 | Immediately after reversal of heparin | End of operation | Tranexamic acidc | |
| 0.3 | Before cardiac rewarming | End of operation | Placebo | |
| 0.3 | 30 minutes before closure of wound | End of operation | Placebo | |
| 0.3 | 30 minutes before closure of wound | End of operation | Placebo | |
| 0.3 | Immediately after reversal of heparin | End of operation | Placebo | |
| DDAVP 0.3 μg/kg × 2 | ||||
| 0.3 | After reversal of heparin and before chest closure | End of operation | Placebo | |
| 0.3 | After reversal of heparin and before chest closure | End of operation | Placebo | |
| 0.3 | 10 minutes after reversal of heparin | End of operation | Placebo | |
| 0.3 | After reversal of heparin (timing unclear) | End of operation | Placebo | |
| 0.3 | Immediately after reversal of heparin | End of operation | Placebo | |
| 0.3 | 15 minutes after reversal of heparin | End of operation | Placebo | |
| 0.3 | 5 minutes after reversal of heparin | End of operation | Placebo | |
| 0.3 | Immediately after reversal of heparin | End of operation | Placebo | |
| 0.3 | Immediately after reversal of heparin | End of operation | Standard care | |
| Aprotinind | ||||
| DDAVP 0.3 μg/kg × 2 | ||||
| 0.3 | Via pulmonary artery catheter immediately after sternal closure | End of operation | Placebo | |
| 0.3 | Immediately after reversal of heparin | End of operation | Placebo | |
| 0.3 | After reversal of heparin (timing unclear) | End of operation | Placebo | |
| 10 μg/m2 | After reversal of heparin (timing unclear) | End of operation | Placebo | |
| 0.3 | After reversal of heparin (timing unclear) | End of operation | Placebo | |
| 0.3 | After reversal of heparin (timing unclear) | End of operation | Placebo | |
| 0.3 | 30 minutes before deflation of tourniquet | End of operation | Tranexamic acidb | |
| DDAVP administered postoperatively | ||||
| 0.3 | Between end of operation and 6 hours postoperatively | Postoperative | Placebo | |
| 0.3 | Immediately after sternal closure | Postoperative | Placebo | |
| Timing of DDAVP administration unclear | ||||
| 0.3 | Not reported | Not clear | Standard care | |
| 0.3 | Not reported | Not clear | Standard care | |
| 0.3 | Not reported | Not clear | Tranexamic acidc | |
| aAprotinin 2 million KIU in 200 mL preoperatively, 2 million KIU in 200 mL in fluid prime, 500,000 KIU in 50 mL/h from skin incision to skin closure Abbreviation KIU: kilounits | ||||
| Trial | Reason not included in meta‐analysis | DDAVP arm | Placebo arm |
| Orthopaedic surgery | |||
| Reported as mean (no standard deviation) | 0.3 units (n = 23) | 0.5 units (n = 24) | |
| Reported as mean (no standard deviation) | 4.6 units (n = 16) | 5.0 units (n = 14) | |
| Reported as median and range | 51.5 (24 to 98.6) mL/kg (n = 10) | 48.3 (24.5 to 96) mL/kg (n = 11) | |
| Trial | Reason not included in meta‐analysis | DDAVP arm | Placebo arm |
| Adult cardiac surgery | |||
| Reported as mL/kg (mean ± standard deviation) | 8.3 ± 5.6 mL/kg (n = 5) | 10.8 ± 6.3 mL/kg (n = 4) | |
| Reported as mL/kg (mean ± standard deviation) | 10.2 ± 6.4 mL/kg (n = 5) | 13.2 ± 6.6 mL/kg (n = 6) | |
| Reported as median (interquartile range) | 1.7 (2.3) units (n = 18) | 0.6 (1.3) units (n = 22) | |
| Reported as median (interquartile range) | 2 (1 to 4) units (n = 68) | 2 (1 to 3) units (n = 67) | |
| Reported as mean (no standard deviation) | 2.4 units (n = 15) | 2 units (n = 15) | |
| Reported as median (90% confidence interval) | 2 (1 to 8.5) units (n = 74) | 2 (1 to 9.8) units (n = 76) | |
| Reported as mean (range) | 1.3 (0 to 2) units (n = 15) | 1.1 (0 to 3) units (n = 15) | |
| Reported as median only | 2 units (n = 21) | 2 units (n = 22) | |
| Reported as mean only | 0.86 units (n = 44) | 1.79 units n = 42) | |
| Reported as mean only | 2.4 units (n = 13) | 2.2 units (n = 16) | |
| Reported as mL/m2 (mean ± standard deviation) | 740.4 ± 416.3 mL/m2 (n = 25) | 662.8 ± 380.7 mL/m2 (n = 28) | |
| Reported as mean only | 1.38 units (n = 49) | 1.30 units (n = 49) | |
| Orthopaedic surgery | |||
| Reported as mean only | 0.7 units (n = 10) | 1.1 units (n = 10) | |
| Reported as median and range | 64.8 (30.3 to 123.6) mL/kg (n = 10) | 64.9 (33.8 to 110) mL/kg (n = 11) | |
| Maxillofacial surgery | |||
| Reported as mean (no standard deviation) | 0.6 units (n = 10) | 0.9 units (n = 10) | |
| Trial | Reason not included in meta‐analysis | DDAVP arm | Placebo arm |
| Adult cardiac surgery | |||
| Reported as median (90% confidence interval) | 200 (0 to 1150) mL (n = 74) | 200 (0 to 1013) mL (n = 76) | |
| Reported as mL/m2 body surface area | 131 ± 106 mL/m2 (n = 50) | 193 ± 137 mL/m2 (n = 50) | |
| Paediatric cardiac surgery | |||
| Reported as mL/m2 | 49.3 ± 43.7 mL/m2 (n = 31) | 73.6 ± 71.1 mL/m2 (n = 29) | |
| Orthopaedic surgery | |||
| Reported as mean (no standard deviation) | 1200 mL (n = 23) | 1463 mL (n = 24) | |
| Hepatic surgery | |||
| Reported as median (range) | 832.5 (350 to 2955) mL (n = 30) | 800 mL (250 to 7128) mL (n = 29) | |
| Other surgery | |||
| Reported as mean and range | 251 (2 to 1330) mL (n = 14) | 504 (50 to 2100) mL (n = 14) | |
| Trial | Reason not included in meta‐analysis | DDAVP arm | Placebo arm |
| Adult cardiac surgery | |||
| Reported as mL/kg (mean ± standard deviation) | 8.0 ± 1.4 mL/kg (n = 5) | 5.9 ± 1.5 mL/kg (n = 4) | |
| Reported as mL/kg (mean ± standard deviation) | 11.3 ± 10 mL/kg (n = 5) | 7.5 ± 4 mL/kg (n = 6) | |
| Reported as median (interquartile range) | 950 (950) mL (n = 18) | 975 (811) mL (n = 22) | |
| Reported as median (interquartile range) | 575 (422.5 to 770) mL (n = 68) | 590 (476.25 to 1013.75) mL (n = 67) | |
| Reported as mL/m2 body surface area (mean ± standard deviation) | 400 ± 192 mL/m2 (n = 50) | 489 ± 361 mL/m2 (n = 51) | |
| Reported as mL/m2 body surface area (mean ± standard deviation) | 582 ± 410 mL/m2 (n = 44) | 465 ± 303 mL/m2 (n = 37) | |
| Reported as median (range) | 1000 (600 to 1800) mL (n = 19) | 1075 (400 to 1740) mL (n = 20) | |
| Reported as median (90% confidence interval) | 865 (358 to 2495) mL (n = 74) | 783 (300 to 2219) mL (n = 76) | |
| Reported as mL/m2 (mean ± standard deviation) | 258 ± 106 mL/m2 (n = 75) | 526 ± 314 mL/m2 (n = 75) | |
| Reported as mean (no standard deviation) | 1430 mL (n = 10) | 1767 mL (n = 10) | |
| Reported as mean (no standard deviation) | 574 mL (n = 16) | 535 mL (n = 18) | |
| Reported as median only | 1157 mL (n = 21) | 1180 mL (n = 22) | |
| Reported as mL/m2 body surface area (mean ± standard deviation) | 458 ± 206 mL/m2 (n = 50) | 536 ± 304 mL/m2 (n = 50) | |
| Reported as mL/m2 body surface area (mean ± standard deviation) | 551.8 ± 324.1 mL/m2 (n = 28) | 438.7 ± 228.1 mL/m2 (n = 25) | |
| Reported as median (range) | 1020 (530 to 1155) mL (n = 15) | 1100 (425 to 1720) mL (n = 15) | |
| Orthopaedic surgery | |||
| Reported as mean (no standard deviation) | 1320 mL (n = 6) | 1380 mL (n = 6) | |
| Reported as estimated percentage blood loss: median (range) | 147.8% (57% to 428.8%) (n = 10) | 111.2% (65% to 239.5%) (n = 11) | |
| Maxillofacial surgery | |||
| Reported as mean (range) | 675 (380 to 1330) mL (n = 10) | 819 (200 to 1600) mL (n = 10) | |
| Trial | Reason not included in meta‐analysis | DDAVP arm | Tranexamic acid arm |
| Orthopaedic surgery | |||
| Reported as mean only | 0.7 units (n = 10) | 0.1 units (n = 10) | |
| Trial | Reason not included in meta‐analysis | DDAVP arm | Tranexamic acid arm |
| Adult cardiac surgery | |||
| Reported as mean (no standard deviation) | 1430 mL (n = 10) | 535 mL (n = 18) | |
| Trial | Reason not included in meta‐analysis | DDAVP arm | Aprotinin arm |
| Adult cardiac surgery | |||
| Reported as mL/m2 body surface area (mean ± standard deviation) | 740.4 ± 416.3 mL/m2 (n = 25) | 366.1 ± 331.9 mL/m2 (n = 28) | |
| Trial | Reason not included in meta‐analysis | DDAVP arm | Aprotinin arm |
| Adult cardiac surgery | |||
| Reported as mL/m2 body surface area (mean ± standard deviation) | 400 ± 192 mL/m2 (n = 50) | 195 ± 146 mL/m2 (n = 48) | |
| Reported as mL/m2 body surface area (mean ± standard deviation) | 551.8 ± 324.1 mL/m2 (n = 25) | 358.5 ± 156.3 mL/m2 (n = 28) | |
| Outcome or subgroup title | No. of studies | No. of participants | Statistical method | Effect size |
| 1 Red cell volume transfused (intraoperatively) Show forest plot | 7 | Mean Difference (IV, Random, 95% CI) | Subtotals only | |
| 1.1 Adult cardiac surgery | 1 | 19 | Mean Difference (IV, Random, 95% CI) | ‐0.10 [‐1.22, 1.02] |
| 1.2 Paediatric cardiac surgery | 1 | 60 | Mean Difference (IV, Random, 95% CI) | 0.40 [‐0.87, 1.67] |
| 1.3 Orthopaedic surgery | 3 | 144 | Mean Difference (IV, Random, 95% CI) | ‐0.50 [‐0.89, ‐0.11] |
| 1.4 Vascular surgery | 1 | 44 | Mean Difference (IV, Random, 95% CI) | ‐1.20 [‐2.55, 0.15] |
| 1.5 Plastic surgery | 1 | 23 | Mean Difference (IV, Random, 95% CI) | ‐0.75 [‐1.23, ‐0.27] |
| 2 Red cell volume transfused (total) Show forest plot | 23 | Mean Difference (IV, Random, 95% CI) | Subtotals only | |
| 2.1 Cardiac surgery | 14 | 957 | Mean Difference (IV, Random, 95% CI) | ‐0.52 [‐0.96, ‐0.08] |
| 2.2 Orthopaedic surgery | 6 | 303 | Mean Difference (IV, Random, 95% CI) | ‐0.02 [‐0.67, 0.64] |
| 2.3 Vascular surgery | 2 | 135 | Mean Difference (IV, Random, 95% CI) | 0.06 [‐0.60, 0.73] |
| 2.4 Hepatic surgery | 1 | 59 | Mean Difference (IV, Random, 95% CI) | ‐0.47 [‐1.27, 0.33] |
| 3 Red cell volume transfused (children only, total) Show forest plot | 1 | Mean Difference (IV, Random, 95% CI) | Subtotals only | |
| 4 Number of participants receiving a red cell transfusion (intraoperatively) Show forest plot | 6 | 349 | Risk Ratio (M‐H, Random, 95% CI) | 0.74 [0.50, 1.09] |
| 4.1 Cardiac surgery | 2 | 115 | Risk Ratio (M‐H, Random, 95% CI) | 0.68 [0.43, 1.10] |
| 4.2 Plastic surgery | 2 | 44 | Risk Ratio (M‐H, Random, 95% CI) | 0.86 [0.45, 1.64] |
| 4.3 Kidney biopsy | 1 | 162 | Risk Ratio (M‐H, Random, 95% CI) | 0.0 [0.0, 0.0] |
| 4.4 Other | 1 | 28 | Risk Ratio (M‐H, Random, 95% CI) | 0.0 [0.0, 0.0] |
| 5 Number of participants receiving a red cell transfusion (total) Show forest plot | 25 | 1806 | Risk Ratio (M‐H, Random, 95% CI) | 0.96 [0.86, 1.06] |
| 5.1 Cardiac surgery | 17 | 1350 | Risk Ratio (M‐H, Random, 95% CI) | 0.93 [0.82, 1.06] |
| 5.2 Orthopaedic surgery | 1 | 20 | Risk Ratio (M‐H, Random, 95% CI) | 0.86 [0.45, 1.64] |
| 5.3 Vascular surgery | 1 | 91 | Risk Ratio (M‐H, Random, 95% CI) | 1.05 [0.83, 1.34] |
| 5.4 Paediatric cardiac surgery | 1 | 60 | Risk Ratio (M‐H, Random, 95% CI) | 1.17 [0.66, 2.06] |
| 5.5 Plastic surgery | 2 | 44 | Risk Ratio (M‐H, Random, 95% CI) | 0.86 [0.45, 1.64] |
| 5.6 Hepatic surgery | 1 | 59 | Risk Ratio (M‐H, Random, 95% CI) | 0.58 [0.15, 2.21] |
| 5.7 Kidney biopsy | 1 | 162 | Risk Ratio (M‐H, Random, 95% CI) | 0.0 [0.0, 0.0] |
| 5.8 Maxillofacial surgery | 1 | 20 | Risk Ratio (M‐H, Random, 95% CI) | 2.0 [0.88, 4.54] |
| 6 Blood loss (intraoperative) Show forest plot | 11 | Mean Difference (IV, Random, 95% CI) | Subtotals only | |
| 6.1 Cardiac surgery | 2 | 87 | Mean Difference (IV, Random, 95% CI) | ‐138.20 [‐623.40, 347.01] |
| 6.2 Orthopaedic surgery | 5 | 224 | Mean Difference (IV, Random, 95% CI) | ‐118.24 [‐278.43, 41.95] |
| 6.3 Vascular surgery | 1 | 44 | Mean Difference (IV, Random, 95% CI) | ‐525.0 [‐1177.34, 127.34] |
| 6.4 Sinus surgery | 1 | 90 | Mean Difference (IV, Random, 95% CI) | ‐28.0 [‐31.70, ‐24.30] |
| 6.5 Plastic surgery | 2 | 44 | Mean Difference (IV, Random, 95% CI) | ‐146.02 [‐487.86, 195.83] |
| 7 Blood loss (total) Show forest plot | 28 | Mean Difference (IV, Random, 95% CI) | Subtotals only | |
| 7.1 Adult cardiac surgery | 22 | 1358 | Mean Difference (IV, Random, 95% CI) | ‐135.24 [‐210.80, ‐59.68] |
| 7.2 Orthopaedic surgery | 5 | 241 | Mean Difference (IV, Random, 95% CI) | ‐285.76 [‐514.99, ‐56.53] |
| 7.3 Vascular surgery | 1 | 44 | Mean Difference (IV, Random, 95% CI) | ‐582.0 [‐1264.07, 100.07] |
| 8 Blood loss (children only, total) Show forest plot | 2 | Mean Difference (IV, Random, 95% CI) | Subtotals only | |
| 8.1 Paediatric cardiac surgery | 2 | 155 | Mean Difference (IV, Random, 95% CI) | 1.11 [‐12.92, 15.15] |
| 9 Number of participants with any bleeding (intraoperatively) Show forest plot | 1 | Risk Ratio (M‐H, Random, 95% CI) | Totals not selected | |
| 9.1 Dialysis catheter | 1 | Risk Ratio (M‐H, Random, 95% CI) | 0.0 [0.0, 0.0] | |
| 10 Number of participants with any bleeding (total) Show forest plot | 1 | Risk Ratio (M‐H, Random, 95% CI) | Totals not selected | |
| 10.1 Kidney biopsy | 1 | Risk Ratio (M‐H, Random, 95% CI) | 0.0 [0.0, 0.0] | |
| 11 Reoperation due to bleeding Show forest plot | 23 | 1783 | Peto Odds Ratio (Peto, Fixed, 95% CI) | 0.66 [0.40, 1.09] |
| 11.1 Cardiac surgery | 19 | 1483 | Peto Odds Ratio (Peto, Fixed, 95% CI) | 0.64 [0.38, 1.05] |
| 11.2 Orthopaedic surgery | 1 | 30 | Peto Odds Ratio (Peto, Fixed, 95% CI) | 0.0 [0.0, 0.0] |
| 11.3 Paediatric cardiac surgery | 1 | 60 | Peto Odds Ratio (Peto, Fixed, 95% CI) | 6.93 [0.14, 349.88] |
| 11.4 Dialysis catheter insertion | 1 | 48 | Peto Odds Ratio (Peto, Fixed, 95% CI) | 0.0 [0.0, 0.0] |
| 11.5 Kidney biopsy | 1 | 162 | Peto Odds Ratio (Peto, Fixed, 95% CI) | 0.0 [0.0, 0.0] |
| 12 All‐cause mortality Show forest plot | 22 | 1631 | Peto Odds Ratio (Peto, Fixed, 95% CI) | 1.09 [0.51, 2.34] |
| 12.1 Cardiac surgery | 16 | 1239 | Peto Odds Ratio (Peto, Fixed, 95% CI) | 1.09 [0.48, 2.51] |
| 12.2 Orthopaedic surgery | 3 | 171 | Peto Odds Ratio (Peto, Fixed, 95% CI) | 0.0 [0.0, 0.0] |
| 12.3 Vascular surgery | 1 | 91 | Peto Odds Ratio (Peto, Fixed, 95% CI) | 8.50 [0.52, 138.60] |
| 12.4 Paediatric cardiac surgery | 2 | 130 | Peto Odds Ratio (Peto, Fixed, 95% CI) | 0.13 [0.01, 2.14] |
| 13 All thrombotic events (including myocardial infarction, ischaemic stroke, other arterial thromboembolism, and venous thromboembolism) Show forest plot | 29 | 1984 | Peto Odds Ratio (Peto, Fixed, 95% CI) | 1.36 [0.85, 2.16] |
| 13.1 Cardiac surgery | 19 | 1311 | Peto Odds Ratio (Peto, Fixed, 95% CI) | 1.46 [0.88, 2.42] |
| 13.2 Orthopaedic surgery | 6 | 280 | Peto Odds Ratio (Peto, Fixed, 95% CI) | 7.21 [0.14, 363.30] |
| 13.3 Vascular surgery | 2 | 141 | Peto Odds Ratio (Peto, Fixed, 95% CI) | 0.77 [0.23, 2.60] |
| 13.4 Sinus surgery | 1 | 90 | Peto Odds Ratio (Peto, Fixed, 95% CI) | 0.0 [0.0, 0.0] |
| 13.5 Kidney biopsy | 1 | 162 | Peto Odds Ratio (Peto, Fixed, 95% CI) | 0.0 [0.0, 0.0] |
| 14 Myocardial infarction Show forest plot | 26 | 1704 | Peto Odds Ratio (Peto, Fixed, 95% CI) | 1.32 [0.70, 2.46] |
| 14.1 Cardiac surgery | 16 | 1031 | Peto Odds Ratio (Peto, Fixed, 95% CI) | 1.52 [0.77, 3.00] |
| 14.2 Orthopaedic surgery | 6 | 280 | Peto Odds Ratio (Peto, Fixed, 95% CI) | 0.0 [0.0, 0.0] |
| 14.3 Vascular surgery | 2 | 141 | Peto Odds Ratio (Peto, Fixed, 95% CI) | 0.55 [0.11, 2.88] |
| 14.4 Kidney biopsy | 1 | 162 | Peto Odds Ratio (Peto, Fixed, 95% CI) | 0.0 [0.0, 0.0] |
| 14.5 Sinus surgery | 1 | 90 | Peto Odds Ratio (Peto, Fixed, 95% CI) | 0.0 [0.0, 0.0] |
| 15 Stroke Show forest plot | 19 | 1277 | Peto Odds Ratio (Peto, Fixed, 95% CI) | 2.95 [0.94, 9.24] |
| 15.1 Cardiac surgery | 11 | 733 | Peto Odds Ratio (Peto, Fixed, 95% CI) | 2.95 [0.94, 9.24] |
| 15.2 Orthopaedic surgery | 5 | 201 | Peto Odds Ratio (Peto, Fixed, 95% CI) | 0.0 [0.0, 0.0] |
| 15.3 Vascular surgery | 1 | 91 | Peto Odds Ratio (Peto, Fixed, 95% CI) | 0.0 [0.0, 0.0] |
| 15.4 Kidney biopsy | 1 | 162 | Peto Odds Ratio (Peto, Fixed, 95% CI) | 0.0 [0.0, 0.0] |
| 15.5 Sinus surgery | 1 | 90 | Peto Odds Ratio (Peto, Fixed, 95% CI) | 0.0 [0.0, 0.0] |
| 16 Venous thromboembolism Show forest plot | 20 | 1377 | Peto Odds Ratio (Peto, Fixed, 95% CI) | 0.77 [0.17, 3.38] |
| 16.1 Cardiac surgery | 11 | 754 | Peto Odds Ratio (Peto, Fixed, 95% CI) | 0.53 [0.11, 2.62] |
| 16.2 Orthopaedic surgery | 6 | 280 | Peto Odds Ratio (Peto, Fixed, 95% CI) | 7.21 [0.14, 363.30] |
| 16.3 Vascular surgery | 1 | 91 | Peto Odds Ratio (Peto, Fixed, 95% CI) | 0.0 [0.0, 0.0] |
| 16.4 Kidney biopsy | 1 | 162 | Peto Odds Ratio (Peto, Fixed, 95% CI) | 0.0 [0.0, 0.0] |
| 16.5 Sinus surgery | 1 | 90 | Peto Odds Ratio (Peto, Fixed, 95% CI) | 0.0 [0.0, 0.0] |
| 17 Clinically important hypotension Show forest plot | 18 | 1183 | Risk Ratio (M‐H, Random, 95% CI) | 2.32 [1.37, 3.91] |
| 17.1 Cardiac surgery | 13 | 762 | Risk Ratio (M‐H, Random, 95% CI) | 2.88 [1.32, 6.30] |
| 17.2 Orthopaedic surgery | 2 | 109 | Risk Ratio (M‐H, Random, 95% CI) | 2.05 [0.99, 4.24] |
| 17.3 Paediatric cardiac surgery | 1 | 60 | Risk Ratio (M‐H, Random, 95% CI) | 0.94 [0.06, 14.27] |
| 17.4 Sinus surgery | 1 | 90 | Risk Ratio (M‐H, Random, 95% CI) | 0.0 [0.0, 0.0] |
| 17.5 Kidney biopsy | 1 | 162 | Risk Ratio (M‐H, Random, 95% CI) | 0.0 [0.0, 0.0] |
| Outcome or subgroup title | No. of studies | No. of participants | Statistical method | Effect size |
| 1 Red cell volume transfused (total) Show forest plot | 6 | 388 | Mean Difference (IV, Random, 95% CI) | ‐0.65 [‐1.16, ‐0.13] |
| 2 Number of participants receiving a red cell transfusion (intraoperatively) Show forest plot | 1 | Risk Ratio (M‐H, Random, 95% CI) | Subtotals only | |
| 3 Number of participants receiving a red cell transfusion (total) Show forest plot | 5 | 258 | Risk Ratio (M‐H, Random, 95% CI) | 0.83 [0.66, 1.04] |
| 4 Blood loss (total) Show forest plot | 7 | 422 | Mean Difference (IV, Random, 95% CI) | ‐253.93 [‐408.01, ‐99.85] |
| 5 Reoperation due to bleeding Show forest plot | 6 | 413 | Peto Odds Ratio (Peto, Fixed, 95% CI) | 0.39 [0.18, 0.84] |
| 6 All‐cause mortality Show forest plot | 7 | 422 | Peto Odds Ratio (Peto, Fixed, 95% CI) | 0.72 [0.12, 4.22] |
| 7 All thrombotic events (including myocardial infarction, ischaemic stroke, other arterial thromboembolism, and venous thromboembolism) Show forest plot | 7 | 422 | Peto Odds Ratio (Peto, Fixed, 95% CI) | 1.58 [0.60, 4.17] |
| 8 Myocardial infarction Show forest plot | 5 | 277 | Peto Odds Ratio (Peto, Fixed, 95% CI) | 2.72 [0.60, 12.37] |
| 9 Stroke Show forest plot | 3 | Peto Odds Ratio (Peto, Fixed, 95% CI) | Subtotals only | |
| 10 Venous thromboembolism Show forest plot | 4 | 248 | Peto Odds Ratio (Peto, Fixed, 95% CI) | 0.56 [0.06, 5.50] |
| 11 Clinically important hypotension Show forest plot | 5 | 315 | Risk Ratio (M‐H, Random, 95% CI) | 6.58 [1.18, 36.76] |
| Outcome or subgroup title | No. of studies | No. of participants | Statistical method | Effect size |
| 1 Red cell volume transfused (total) Show forest plot | 1 | Mean Difference (IV, Random, 95% CI) | Totals not selected | |
| 1.1 Orthopaedic surgery | 1 | Mean Difference (IV, Random, 95% CI) | 0.0 [0.0, 0.0] | |
| 2 Number of participants receiving a red cell transfusion (total) Show forest plot | 3 | 135 | Risk Ratio (M‐H, Random, 95% CI) | 2.42 [1.04, 5.64] |
| 2.1 Cardiac surgery | 1 | 75 | Risk Ratio (M‐H, Random, 95% CI) | 1.46 [0.82, 2.59] |
| 2.2 Orthopaedic surgery | 2 | 60 | Risk Ratio (M‐H, Random, 95% CI) | 4.15 [1.58, 10.90] |
| 3 Blood loss (total) Show forest plot | 2 | 115 | Mean Difference (IV, Random, 95% CI) | 142.81 [79.78, 205.84] |
| 3.1 Cardiac surgery | 1 | 75 | Mean Difference (IV, Random, 95% CI) | 115.0 [35.38, 194.62] |
| 3.2 Orthopaedic surgery | 1 | 40 | Mean Difference (IV, Random, 95% CI) | 180.0 [86.82, 273.18] |
| 4 Reoperation due to bleeding Show forest plot | 1 | Peto Odds Ratio (Peto, Fixed, 95% CI) | Totals not selected | |
| 4.1 Cardiac surgery | 1 | Peto Odds Ratio (Peto, Fixed, 95% CI) | 0.0 [0.0, 0.0] | |
| 5 All thrombotic events (including myocardial infarction, ischaemic stroke, other arterial thromboembolism, and venous thromboembolism) Show forest plot | 2 | Risk Ratio (M‐H, Random, 95% CI) | Totals not selected | |
| 5.1 Cardiac surgery | 1 | Risk Ratio (M‐H, Random, 95% CI) | 0.0 [0.0, 0.0] | |
| 5.2 Orthopaedic surgery | 1 | Risk Ratio (M‐H, Random, 95% CI) | 0.0 [0.0, 0.0] | |
| 6 Myocardial infarction Show forest plot | 2 | 115 | Risk Ratio (M‐H, Random, 95% CI) | 0.0 [0.0, 0.0] |
| 6.1 Cardiac surgery | 1 | 75 | Risk Ratio (M‐H, Random, 95% CI) | 0.0 [0.0, 0.0] |
| 6.2 Orthopaedic surgery | 1 | 40 | Risk Ratio (M‐H, Random, 95% CI) | 0.0 [0.0, 0.0] |
| 7 Stroke Show forest plot | 2 | Risk Ratio (M‐H, Random, 95% CI) | Totals not selected | |
| 7.1 Cardiac surgery | 1 | Risk Ratio (M‐H, Random, 95% CI) | 0.0 [0.0, 0.0] | |
| 7.2 Orthopaedic surgery | 1 | Risk Ratio (M‐H, Random, 95% CI) | 0.0 [0.0, 0.0] | |
| 8 Venous thromboembolism Show forest plot | 2 | 115 | Risk Ratio (M‐H, Random, 95% CI) | 0.0 [0.0, 0.0] |
| 8.1 Cardiac surgery | 1 | 75 | Risk Ratio (M‐H, Random, 95% CI) | 0.0 [0.0, 0.0] |
| 8.2 Orthopaedic surgery | 1 | 40 | Risk Ratio (M‐H, Random, 95% CI) | 0.0 [0.0, 0.0] |
| Outcome or subgroup title | No. of studies | No. of participants | Statistical method | Effect size |
| 1 Number of participants receiving a red cell transfusion (total) Show forest plot | 1 | Risk Ratio (M‐H, Random, 95% CI) | Totals not selected | |
| 1.1 Cardiac surgery | 1 | Risk Ratio (M‐H, Random, 95% CI) | 0.0 [0.0, 0.0] | |
| 2 Reoperation due to bleeding Show forest plot | 2 | Peto Odds Ratio (Peto, Fixed, 95% CI) | Totals not selected | |
| 2.1 Cardiac surgery | 2 | Peto Odds Ratio (Peto, Fixed, 95% CI) | 0.0 [0.0, 0.0] | |
| 3 All‐cause mortality Show forest plot | 1 | 53 | Peto Odds Ratio (Peto, Fixed, 95% CI) | 0.0 [0.0, 0.0] |
| 3.1 Cardiac surgery | 1 | 53 | Peto Odds Ratio (Peto, Fixed, 95% CI) | 0.0 [0.0, 0.0] |
| 4 All thrombotic events (including myocardial infarction, ischaemic stroke, other arterial thromboembolism, and venous thromboembolism) Show forest plot | 2 | Peto Odds Ratio (Peto, Fixed, 95% CI) | Totals not selected | |
| 4.1 Cardiac surgery | 2 | Peto Odds Ratio (Peto, Fixed, 95% CI) | 0.0 [0.0, 0.0] | |
| 5 Myocardial infarction Show forest plot | 2 | 152 | Peto Odds Ratio (Peto, Fixed, 95% CI) | 0.0 [0.0, 0.0] |
| 5.1 Cardiac surgery | 2 | 152 | Peto Odds Ratio (Peto, Fixed, 95% CI) | 0.0 [0.0, 0.0] |
| 6 Stroke Show forest plot | 2 | Peto Odds Ratio (Peto, Fixed, 95% CI) | Totals not selected | |
| 6.1 Cardiac surgery | 2 | Peto Odds Ratio (Peto, Fixed, 95% CI) | 0.0 [0.0, 0.0] | |
| 7 Venous thromboembolism Show forest plot | 2 | 152 | Peto Odds Ratio (Peto, Fixed, 95% CI) | 0.0 [0.0, 0.0] |
| 7.1 Cardiac surgery | 2 | 152 | Peto Odds Ratio (Peto, Fixed, 95% CI) | 0.0 [0.0, 0.0] |
| 8 Clinically significant hypotension Show forest plot | 1 | 53 | Peto Odds Ratio (Peto, Fixed, 95% CI) | 0.0 [0.0, 0.0] |
| 8.1 Cardiac surgery | 1 | 53 | Peto Odds Ratio (Peto, Fixed, 95% CI) | 0.0 [0.0, 0.0] |