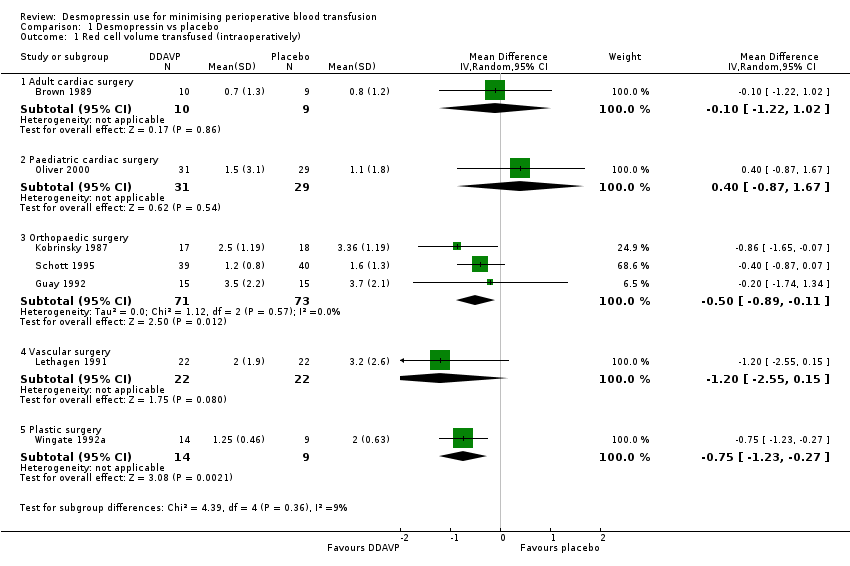
| 1 Red cell volume transfused (intraoperatively) Show forest plot | 7 | | Mean Difference (IV, Random, 95% CI) | Subtotals only |
|
| 1.1 Adult cardiac surgery | 1 | 19 | Mean Difference (IV, Random, 95% CI) | ‐0.10 [‐1.22, 1.02] |
| 1.2 Paediatric cardiac surgery | 1 | 60 | Mean Difference (IV, Random, 95% CI) | 0.40 [‐0.87, 1.67] |
| 1.3 Orthopaedic surgery | 3 | 144 | Mean Difference (IV, Random, 95% CI) | ‐0.50 [‐0.89, ‐0.11] |
| 1.4 Vascular surgery | 1 | 44 | Mean Difference (IV, Random, 95% CI) | ‐1.20 [‐2.55, 0.15] |
| 1.5 Plastic surgery | 1 | 23 | Mean Difference (IV, Random, 95% CI) | ‐0.75 [‐1.23, ‐0.27] |
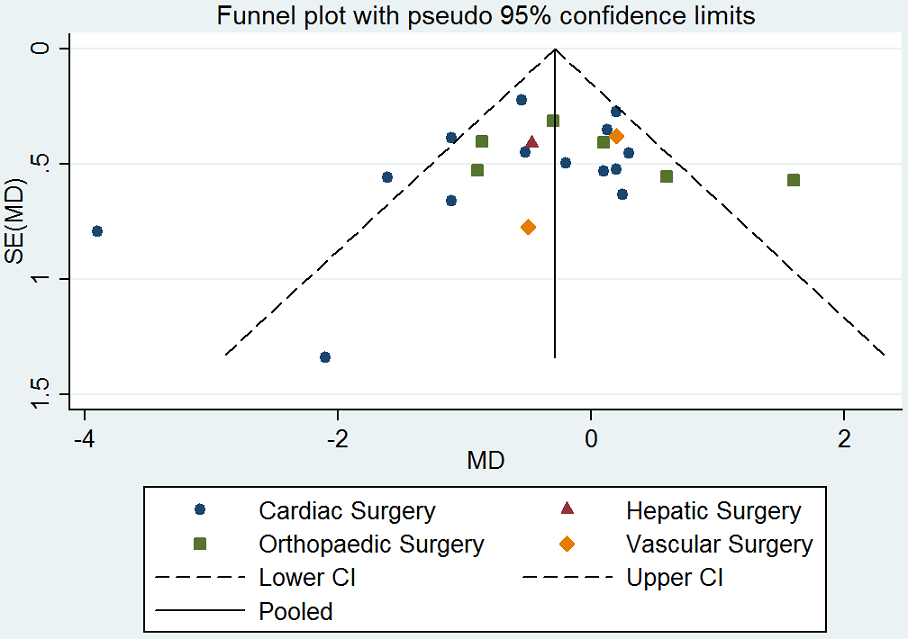
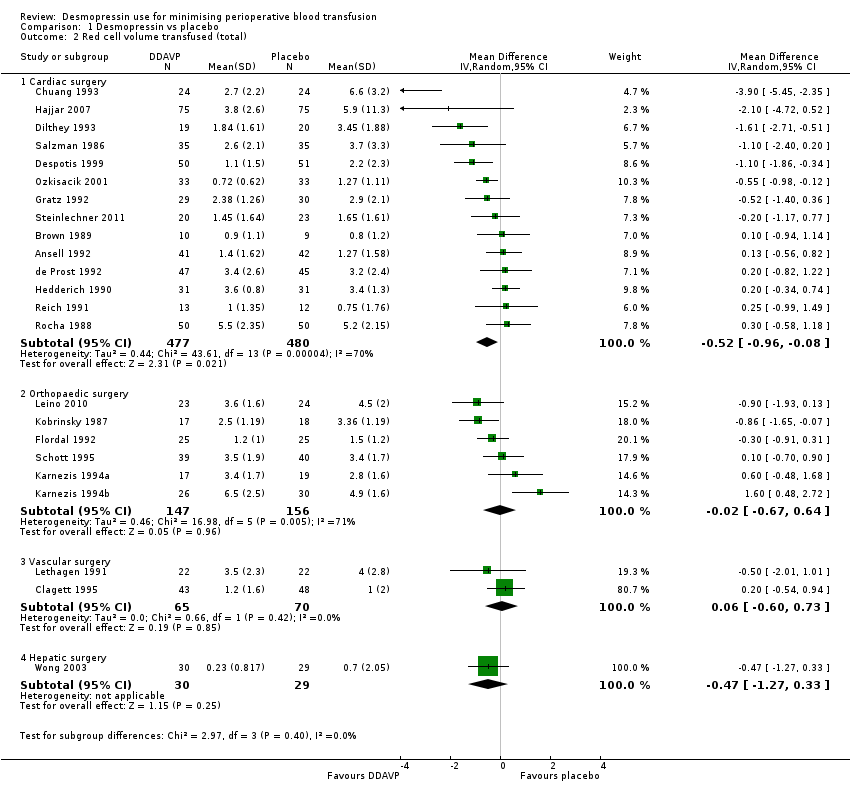
| 2 Red cell volume transfused (total) Show forest plot | 23 | | Mean Difference (IV, Random, 95% CI) | Subtotals only |
|
| 2.1 Cardiac surgery | 14 | 957 | Mean Difference (IV, Random, 95% CI) | ‐0.52 [‐0.96, ‐0.08] |
| 2.2 Orthopaedic surgery | 6 | 303 | Mean Difference (IV, Random, 95% CI) | ‐0.02 [‐0.67, 0.64] |
| 2.3 Vascular surgery | 2 | 135 | Mean Difference (IV, Random, 95% CI) | 0.06 [‐0.60, 0.73] |
| 2.4 Hepatic surgery | 1 | 59 | Mean Difference (IV, Random, 95% CI) | ‐0.47 [‐1.27, 0.33] |
| 3 Red cell volume transfused (children only, total) Show forest plot | 1 | | Mean Difference (IV, Random, 95% CI) | Subtotals only |
|
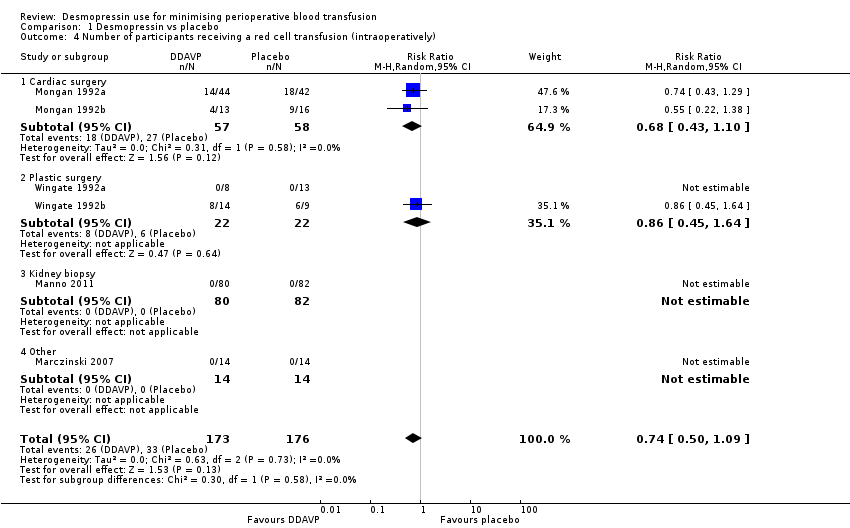
| 4 Number of participants receiving a red cell transfusion (intraoperatively) Show forest plot | 6 | 349 | Risk Ratio (M‐H, Random, 95% CI) | 0.74 [0.50, 1.09] |
|
| 4.1 Cardiac surgery | 2 | 115 | Risk Ratio (M‐H, Random, 95% CI) | 0.68 [0.43, 1.10] |
| 4.2 Plastic surgery | 2 | 44 | Risk Ratio (M‐H, Random, 95% CI) | 0.86 [0.45, 1.64] |
| 4.3 Kidney biopsy | 1 | 162 | Risk Ratio (M‐H, Random, 95% CI) | 0.0 [0.0, 0.0] |
| 4.4 Other | 1 | 28 | Risk Ratio (M‐H, Random, 95% CI) | 0.0 [0.0, 0.0] |
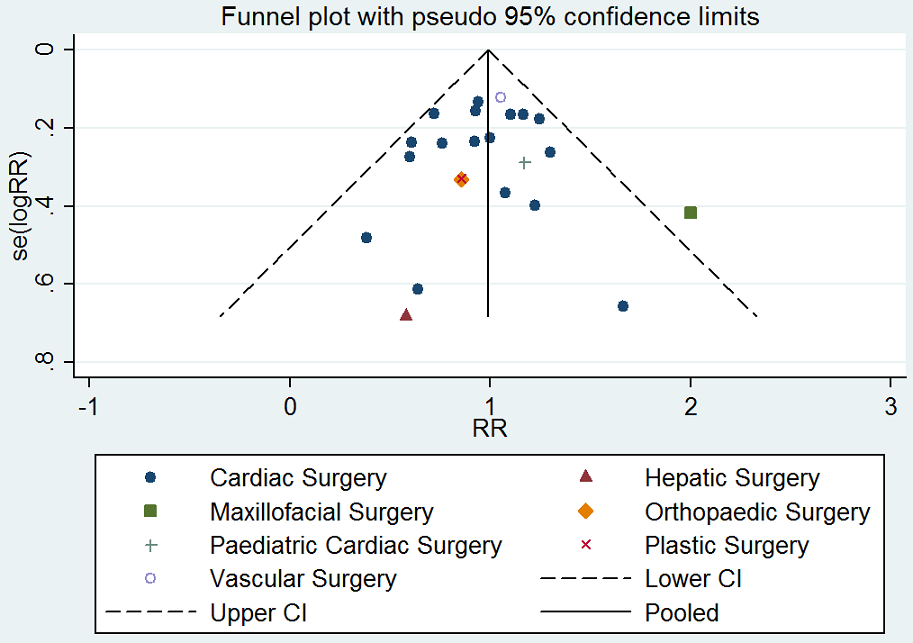
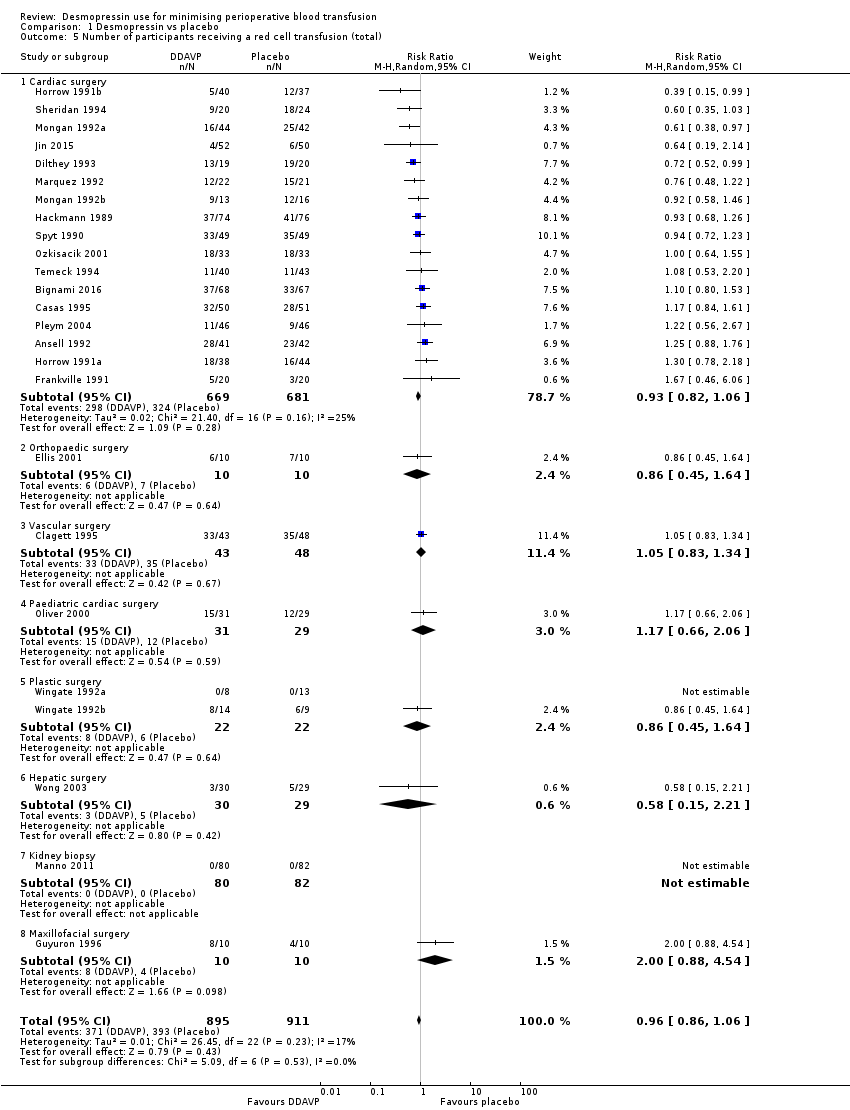
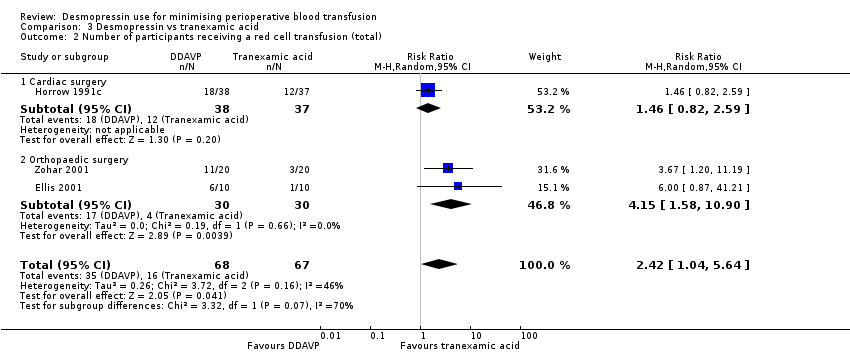
| 5 Number of participants receiving a red cell transfusion (total) Show forest plot | 25 | 1806 | Risk Ratio (M‐H, Random, 95% CI) | 0.96 [0.86, 1.06] |
|
| 5.1 Cardiac surgery | 17 | 1350 | Risk Ratio (M‐H, Random, 95% CI) | 0.93 [0.82, 1.06] |
| 5.2 Orthopaedic surgery | 1 | 20 | Risk Ratio (M‐H, Random, 95% CI) | 0.86 [0.45, 1.64] |
| 5.3 Vascular surgery | 1 | 91 | Risk Ratio (M‐H, Random, 95% CI) | 1.05 [0.83, 1.34] |
| 5.4 Paediatric cardiac surgery | 1 | 60 | Risk Ratio (M‐H, Random, 95% CI) | 1.17 [0.66, 2.06] |
| 5.5 Plastic surgery | 2 | 44 | Risk Ratio (M‐H, Random, 95% CI) | 0.86 [0.45, 1.64] |
| 5.6 Hepatic surgery | 1 | 59 | Risk Ratio (M‐H, Random, 95% CI) | 0.58 [0.15, 2.21] |
| 5.7 Kidney biopsy | 1 | 162 | Risk Ratio (M‐H, Random, 95% CI) | 0.0 [0.0, 0.0] |
| 5.8 Maxillofacial surgery | 1 | 20 | Risk Ratio (M‐H, Random, 95% CI) | 2.0 [0.88, 4.54] |
| 6 Blood loss (intraoperative) Show forest plot | 11 | | Mean Difference (IV, Random, 95% CI) | Subtotals only |
|
| 6.1 Cardiac surgery | 2 | 87 | Mean Difference (IV, Random, 95% CI) | ‐138.20 [‐623.40, 347.01] |
| 6.2 Orthopaedic surgery | 5 | 224 | Mean Difference (IV, Random, 95% CI) | ‐118.24 [‐278.43, 41.95] |
| 6.3 Vascular surgery | 1 | 44 | Mean Difference (IV, Random, 95% CI) | ‐525.0 [‐1177.34, 127.34] |
| 6.4 Sinus surgery | 1 | 90 | Mean Difference (IV, Random, 95% CI) | ‐28.0 [‐31.70, ‐24.30] |
| 6.5 Plastic surgery | 2 | 44 | Mean Difference (IV, Random, 95% CI) | ‐146.02 [‐487.86, 195.83] |
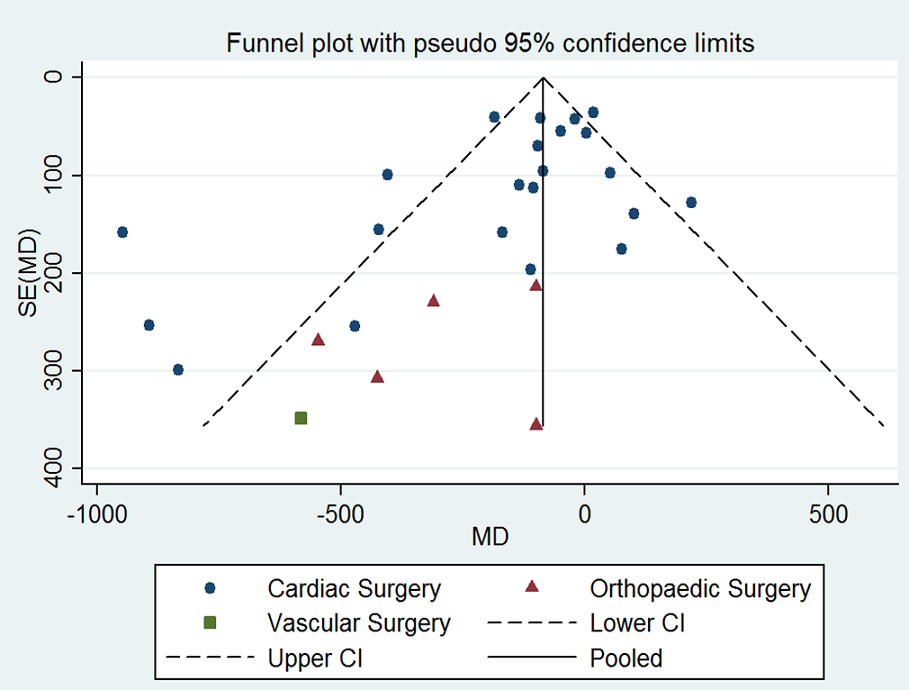
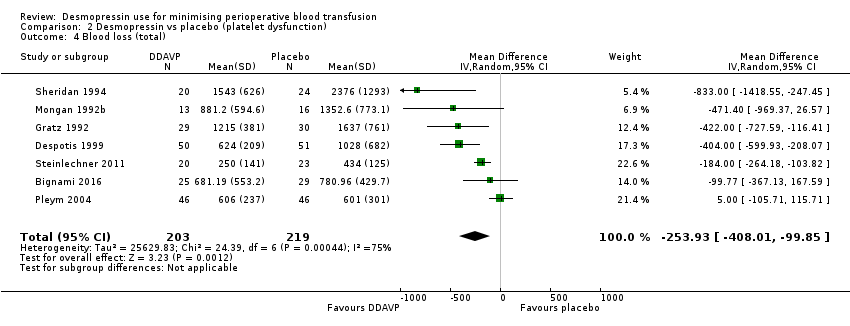
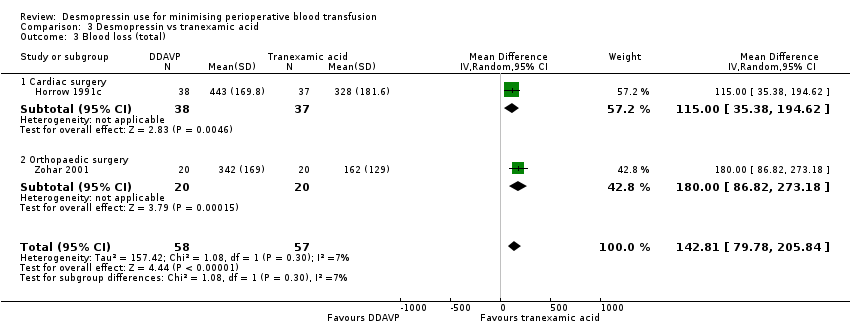
| 7 Blood loss (total) Show forest plot | 28 | | Mean Difference (IV, Random, 95% CI) | Subtotals only |
|
| 7.1 Adult cardiac surgery | 22 | 1358 | Mean Difference (IV, Random, 95% CI) | ‐135.24 [‐210.80, ‐59.68] |
| 7.2 Orthopaedic surgery | 5 | 241 | Mean Difference (IV, Random, 95% CI) | ‐285.76 [‐514.99, ‐56.53] |
| 7.3 Vascular surgery | 1 | 44 | Mean Difference (IV, Random, 95% CI) | ‐582.0 [‐1264.07, 100.07] |
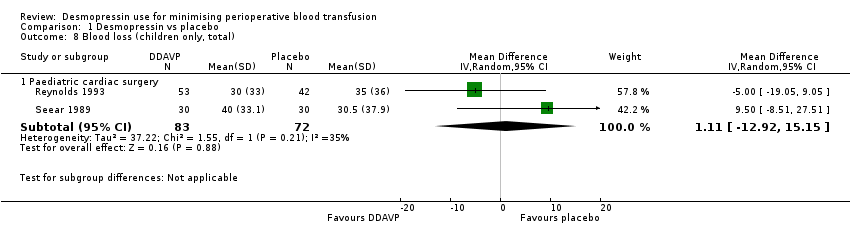
| 8 Blood loss (children only, total) Show forest plot | 2 | | Mean Difference (IV, Random, 95% CI) | Subtotals only |
|
| 8.1 Paediatric cardiac surgery | 2 | 155 | Mean Difference (IV, Random, 95% CI) | 1.11 [‐12.92, 15.15] |
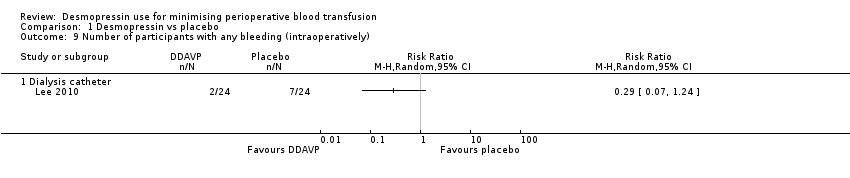
| 9 Number of participants with any bleeding (intraoperatively) Show forest plot | 1 | | Risk Ratio (M‐H, Random, 95% CI) | Totals not selected |
|
| 9.1 Dialysis catheter | 1 | | Risk Ratio (M‐H, Random, 95% CI) | 0.0 [0.0, 0.0] |
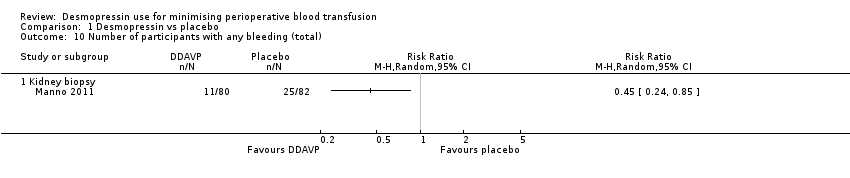
| 10 Number of participants with any bleeding (total) Show forest plot | 1 | | Risk Ratio (M‐H, Random, 95% CI) | Totals not selected |
|
| 10.1 Kidney biopsy | 1 | | Risk Ratio (M‐H, Random, 95% CI) | 0.0 [0.0, 0.0] |
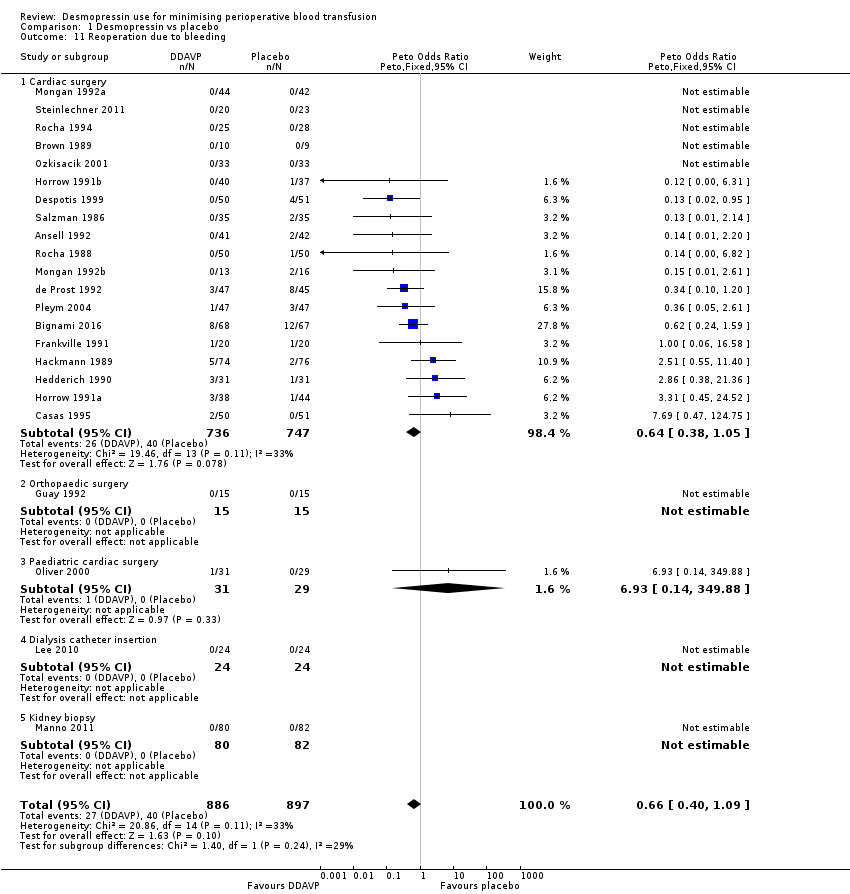
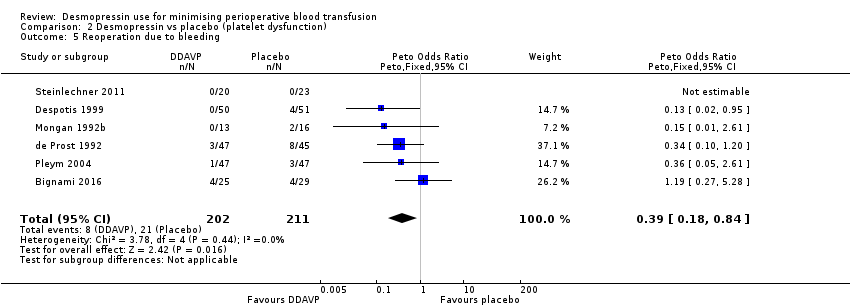
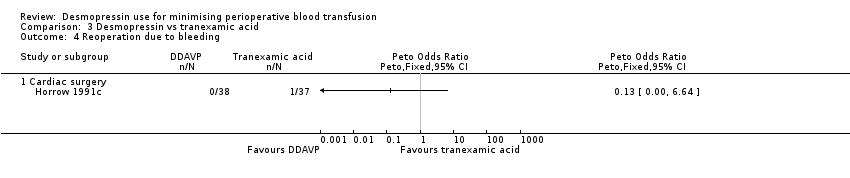
| 11 Reoperation due to bleeding Show forest plot | 23 | 1783 | Peto Odds Ratio (Peto, Fixed, 95% CI) | 0.66 [0.40, 1.09] |
|
| 11.1 Cardiac surgery | 19 | 1483 | Peto Odds Ratio (Peto, Fixed, 95% CI) | 0.64 [0.38, 1.05] |
| 11.2 Orthopaedic surgery | 1 | 30 | Peto Odds Ratio (Peto, Fixed, 95% CI) | 0.0 [0.0, 0.0] |
| 11.3 Paediatric cardiac surgery | 1 | 60 | Peto Odds Ratio (Peto, Fixed, 95% CI) | 6.93 [0.14, 349.88] |
| 11.4 Dialysis catheter insertion | 1 | 48 | Peto Odds Ratio (Peto, Fixed, 95% CI) | 0.0 [0.0, 0.0] |
| 11.5 Kidney biopsy | 1 | 162 | Peto Odds Ratio (Peto, Fixed, 95% CI) | 0.0 [0.0, 0.0] |
| 12 All‐cause mortality Show forest plot | 22 | 1631 | Peto Odds Ratio (Peto, Fixed, 95% CI) | 1.09 [0.51, 2.34] |
|
| 12.1 Cardiac surgery | 16 | 1239 | Peto Odds Ratio (Peto, Fixed, 95% CI) | 1.09 [0.48, 2.51] |
| 12.2 Orthopaedic surgery | 3 | 171 | Peto Odds Ratio (Peto, Fixed, 95% CI) | 0.0 [0.0, 0.0] |
| 12.3 Vascular surgery | 1 | 91 | Peto Odds Ratio (Peto, Fixed, 95% CI) | 8.50 [0.52, 138.60] |
| 12.4 Paediatric cardiac surgery | 2 | 130 | Peto Odds Ratio (Peto, Fixed, 95% CI) | 0.13 [0.01, 2.14] |
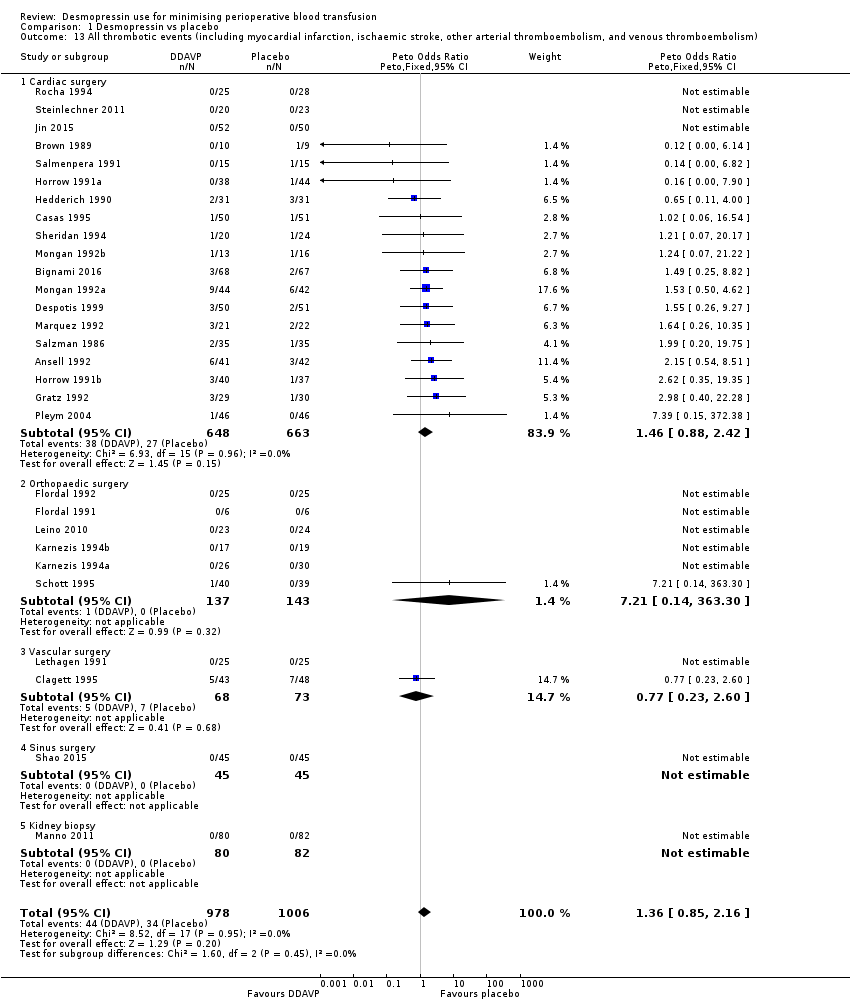
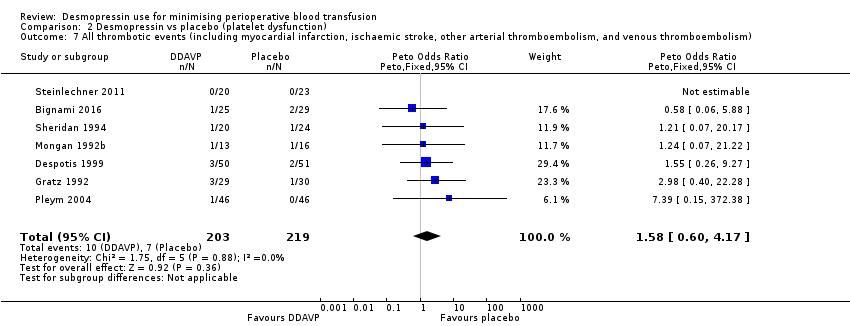
| 13 All thrombotic events (including myocardial infarction, ischaemic stroke, other arterial thromboembolism, and venous thromboembolism) Show forest plot | 29 | 1984 | Peto Odds Ratio (Peto, Fixed, 95% CI) | 1.36 [0.85, 2.16] |
|
| 13.1 Cardiac surgery | 19 | 1311 | Peto Odds Ratio (Peto, Fixed, 95% CI) | 1.46 [0.88, 2.42] |
| 13.2 Orthopaedic surgery | 6 | 280 | Peto Odds Ratio (Peto, Fixed, 95% CI) | 7.21 [0.14, 363.30] |
| 13.3 Vascular surgery | 2 | 141 | Peto Odds Ratio (Peto, Fixed, 95% CI) | 0.77 [0.23, 2.60] |
| 13.4 Sinus surgery | 1 | 90 | Peto Odds Ratio (Peto, Fixed, 95% CI) | 0.0 [0.0, 0.0] |
| 13.5 Kidney biopsy | 1 | 162 | Peto Odds Ratio (Peto, Fixed, 95% CI) | 0.0 [0.0, 0.0] |
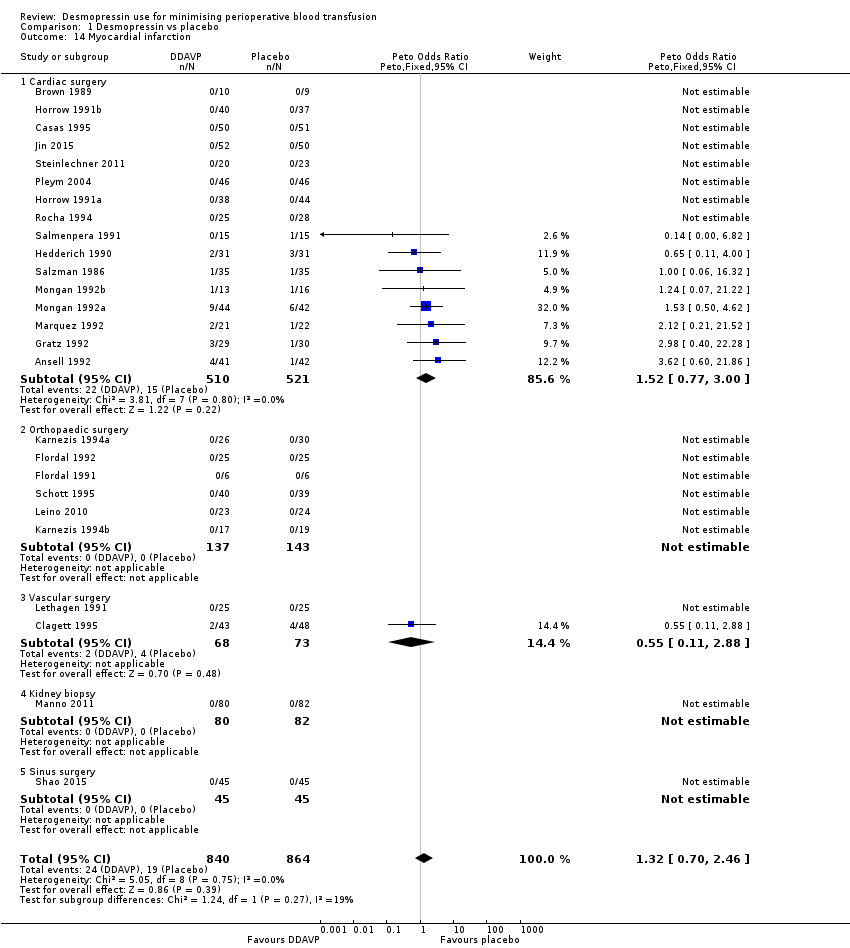
| 14 Myocardial infarction Show forest plot | 26 | 1704 | Peto Odds Ratio (Peto, Fixed, 95% CI) | 1.32 [0.70, 2.46] |
|
| 14.1 Cardiac surgery | 16 | 1031 | Peto Odds Ratio (Peto, Fixed, 95% CI) | 1.52 [0.77, 3.00] |
| 14.2 Orthopaedic surgery | 6 | 280 | Peto Odds Ratio (Peto, Fixed, 95% CI) | 0.0 [0.0, 0.0] |
| 14.3 Vascular surgery | 2 | 141 | Peto Odds Ratio (Peto, Fixed, 95% CI) | 0.55 [0.11, 2.88] |
| 14.4 Kidney biopsy | 1 | 162 | Peto Odds Ratio (Peto, Fixed, 95% CI) | 0.0 [0.0, 0.0] |
| 14.5 Sinus surgery | 1 | 90 | Peto Odds Ratio (Peto, Fixed, 95% CI) | 0.0 [0.0, 0.0] |
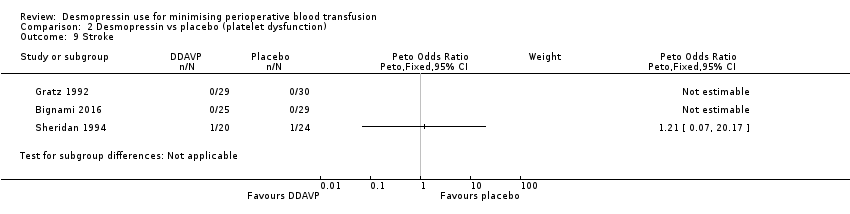
| 15 Stroke Show forest plot | 19 | 1277 | Peto Odds Ratio (Peto, Fixed, 95% CI) | 2.95 [0.94, 9.24] |
|
| 15.1 Cardiac surgery | 11 | 733 | Peto Odds Ratio (Peto, Fixed, 95% CI) | 2.95 [0.94, 9.24] |
| 15.2 Orthopaedic surgery | 5 | 201 | Peto Odds Ratio (Peto, Fixed, 95% CI) | 0.0 [0.0, 0.0] |
| 15.3 Vascular surgery | 1 | 91 | Peto Odds Ratio (Peto, Fixed, 95% CI) | 0.0 [0.0, 0.0] |
| 15.4 Kidney biopsy | 1 | 162 | Peto Odds Ratio (Peto, Fixed, 95% CI) | 0.0 [0.0, 0.0] |
| 15.5 Sinus surgery | 1 | 90 | Peto Odds Ratio (Peto, Fixed, 95% CI) | 0.0 [0.0, 0.0] |
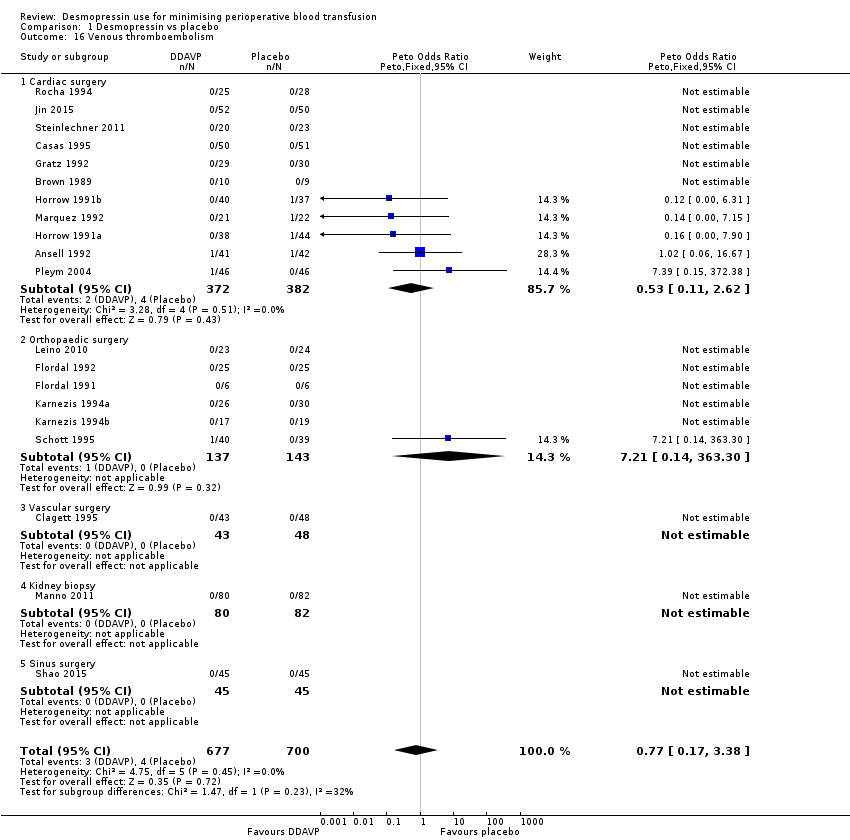
| 16 Venous thromboembolism Show forest plot | 20 | 1377 | Peto Odds Ratio (Peto, Fixed, 95% CI) | 0.77 [0.17, 3.38] |
|
| 16.1 Cardiac surgery | 11 | 754 | Peto Odds Ratio (Peto, Fixed, 95% CI) | 0.53 [0.11, 2.62] |
| 16.2 Orthopaedic surgery | 6 | 280 | Peto Odds Ratio (Peto, Fixed, 95% CI) | 7.21 [0.14, 363.30] |
| 16.3 Vascular surgery | 1 | 91 | Peto Odds Ratio (Peto, Fixed, 95% CI) | 0.0 [0.0, 0.0] |
| 16.4 Kidney biopsy | 1 | 162 | Peto Odds Ratio (Peto, Fixed, 95% CI) | 0.0 [0.0, 0.0] |
| 16.5 Sinus surgery | 1 | 90 | Peto Odds Ratio (Peto, Fixed, 95% CI) | 0.0 [0.0, 0.0] |
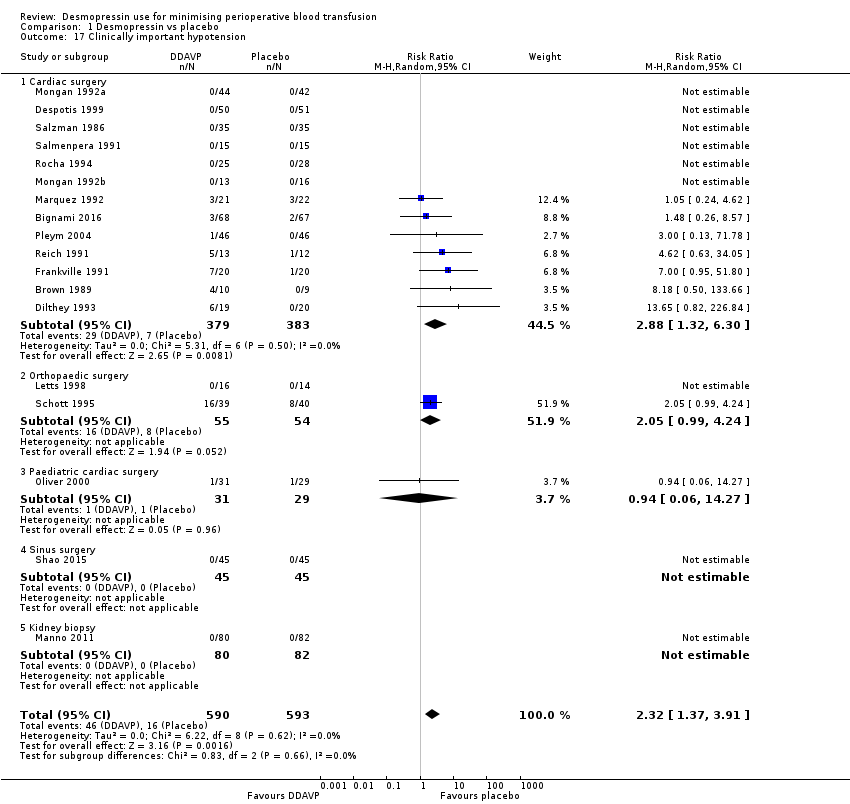
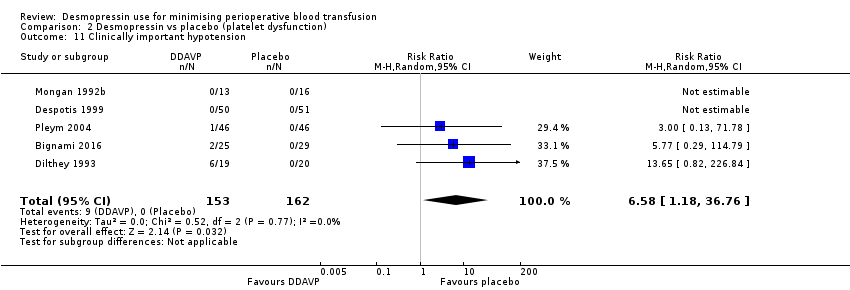
| 17 Clinically important hypotension Show forest plot | 18 | 1183 | Risk Ratio (M‐H, Random, 95% CI) | 2.32 [1.37, 3.91] |
|
| 17.1 Cardiac surgery | 13 | 762 | Risk Ratio (M‐H, Random, 95% CI) | 2.88 [1.32, 6.30] |
| 17.2 Orthopaedic surgery | 2 | 109 | Risk Ratio (M‐H, Random, 95% CI) | 2.05 [0.99, 4.24] |
| 17.3 Paediatric cardiac surgery | 1 | 60 | Risk Ratio (M‐H, Random, 95% CI) | 0.94 [0.06, 14.27] |
| 17.4 Sinus surgery | 1 | 90 | Risk Ratio (M‐H, Random, 95% CI) | 0.0 [0.0, 0.0] |
| 17.5 Kidney biopsy | 1 | 162 | Risk Ratio (M‐H, Random, 95% CI) | 0.0 [0.0, 0.0] |