Desmopresina para disminuir la transfusión de sangre perioperatoria
Información
- DOI:
- https://doi.org/10.1002/14651858.CD001884.pub3Copiar DOI

- Base de datos:
-
- Cochrane Database of Systematic Reviews
- Versión publicada:
-
- 10 julio 2017see what's new
- Tipo:
-
- Intervention
- Etapa:
-
- Review
- Grupo Editorial Cochrane:
-
Grupo Cochrane de Lesiones
- Copyright:
-
- Copyright © 2017 The Cochrane Collaboration. Published by John Wiley & Sons, Ltd.
Cifras del artículo
Altmetric:
Citado por:
Autores
Contributions of authors
-
Michael Desborough: content expert
-
Kathryn Oakland: content expert
-
Charlotte Brierley: content expert
-
Sean Bennett: content expert
-
Carolyn Doree: creator and author of the new search strategy
-
Marialena Trivella: statistical expert
-
Sally Hopewell: methodological expert
-
Simon J Stanworth: content expert
-
Lise J Estcourt: content expert
Sources of support
Internal sources
-
National Institute for Health Research Oxford Biomedical Research Centre Programme, UK.
External sources
-
National Institute for Health Research (NIHR) Cochrane Programme Grant ‐ Safe and Effective Use of Blood Components, UK.
Declarations of interest
-
Michael Desborough: investigator for a trial of DDAVP for treatment of thrombocytopenia
-
Kathryn Oakland: none known
-
Charlotte Brierley: none known
-
Sean Bennett: none known
-
Carolyn Doree: none known
-
Marialena Trivella: none known
-
Sally Hopewell: none known
-
Simon J Stanworth: investigator for a trial of DDAVP for treatment of thrombocytopenia
-
Lise J Estcourt: none known
Acknowledgements
We would like to thank the authors of the original review (Carless 2004): Paul Carless, David Henry, Anette Moxey, and Barrie Stokes. Also, we would also like to thank Junko Kiriya for help in translating the trials by Aida and colleagues from Japanese into English (Aida 1991a; Aida 1991b), and Michiel ten Hove for translating the Marczinski 2007 trial from Dutch into English. Lastly, we would like to thank all the authors of the original trials incorporated into this systematic review.
This project was supported by the UK National Institute for Health Research, through Cochrane Infrastructure funding to the Cochrane Injuries Group. The views and opinions expressed are those of the authors and do not necessarily reflect those of the Systematic Reviews Programme, NIHR, NHS, or the Department of Health.
Version history
| Published | Title | Stage | Authors | Version |
| 2017 Jul 10 | Desmopressin use for minimising perioperative blood transfusion | Review | Michael J Desborough, Kathryn Oakland, Charlotte Brierley, Sean Bennett, Carolyn Doree, Marialena Trivella, Sally Hopewell, Simon J Stanworth, Lise J Estcourt | |
| 2004 Jan 26 | Desmopressin use for minimising perioperative allogeneic blood transfusion | Review | Michael Desborough, Lise J Estcourt, Carolyn Doree, Marialena Trivella, Simon J Stanworth | |
| 1998 Dec 07 | Desmopressin for minimising perioperative allogeneic blood transfusion | Review | David A Henry, Annette AJ Moxey, Paul PAC Carless, Dianne D O'Connell, Brian DBL McClelland, Kim KM Henderson, Ketrina K Sly, Andreas A Laupacis, Dean D Fergusson | |
Differences between protocol and review
The title has changed from 'Desmopressin use for minimising perioperative allogeneic blood transfusion', to 'Desmopressin use for minimising perioperative blood transfusion', as we felt that the latter encapsulated the scope of the review more accurately.
We have included a copy of amendments to the original protocol in Published notes. We updated the original review in accordance with current Cochrane MECIR standards (Carless 2004; Henry 1998). The original review was published in 1998 (Henry 1998). Methods have changed considerably since that time, as has clinical management of perioperative blood loss. Consequently, we published an updated protocol before commencing this review (Desborough 2016).
Differences between prespecified changes to the protocol and the published review due to lack of data
Participants
For types of participants, we have added the following text: “We excluded trials in participants with inherited bleeding disorders such as haemophilia A or von Willebrand disease. DDAVP is already part of standard of care in mild‐to‐moderate haemophilia A, von Willebrand disease, and inherited platelet function disorders (Estcourt 2017; Keeling 2008; Laffan 2014)." These participants were also excluded in original iterations of this review (Carless 2004; Henry 1998).
Outcomes
In the protocol, we intended to report the primary outcomes at three separate time points: intraoperatively, at 24 hours, and total blood loss. We removed the 24‐hour time point for clarity because in most cases, this was the same as total blood loss.
Subgroup analysis
Data were insufficient for assessment of subgroups of participants with liver disease and uraemia, so we did not perform this analysis. Future updates of this review will include analysis of these subgroups if published data are sufficient. We added platelet dysfunction as a subgroup because publication of recent guidelines has suggested that this is of greatest interest to clinicians (American Society of Anesthesiologists 2015; Kozek‐Langenecker 2013; Rossaint 2016; Society of Thoracic Surgeons 2011). We included subgroups of trials that performed cell salvage or used a transfusion protocol as sensitivity analyses rather than full subgroups. In the previous iteration of this review (Carless 2004), participants in these subgroups were not found to be different from those not in the subgroups. Consequently, although we believed it was not appropriate to include them as full subgroups in this iteration, we have monitored their effect on the overall effect estimate by including them in sensitivity analyses.
Sensitivity analysis
In addition to changes outlined in the subgroup section above, we made changes to the definition of 'low‐risk trials'. We did not provide a precise description of a trial at low risk of bias in the protocol, which included the following text: "for example, RCTs with methods assessed as low risk for random sequence generation and concealment of treatment allocation". We adjusted the definition of trials at low risk of bias to: "trials with no high risk of bias assessments and at least half low risk of bias assessments". This yielded a global assessment of risk of bias.
Timing of outcome assessments
In the protocol, we intended to assess transfusion and blood loss intraoperatively, at 24 hours, and at 30 days. Most trials reported outcome data up to 24 to 48 hours. Consequently, we did not include the 24‐hour time point and reported total blood loss, volume of red cells transfused, and participants receiving a red cell transfusion. In most cases, timing for these outcomes was 24 to 48 hours.
Serious adverse events
Most included trials did not report serious adverse events, with the exception of clinically important hypotension and thrombotic events (which are already included as separate outcomes). For clarity, we reported clinically important hypotension as an outcome rather than as a serious adverse event.
Notes
Revised protocol for this review
We updated this review in accordance with current Cochrane MECIR standards (Carless 2004; Higgins 2016). The original review was published in 1998 (Henry 1998). Methods have changed considerably since that time, as has clinical management of perioperative bleeding. We published the protocol below before updating the review in 2017 to accommodate the MECIR 2016 standards (Desborough 2016; Higgins 2016).
Criteria for considering studies for this review
Types of studies
We will include randomised controlled trials (RCTs). There will be no restrictions on language or publication status.
Types of participants
Adults or children undergoing any type of surgery or interventional procedure.
Types of interventions
Subcutaneous or intravenous DDAVP.
We will consider:
-
trials comparing subcutaneous or intravenous DDAVP versus placebo or no active comparator; and
-
trials comparing subcutaneous or intravenous DDAVP versus active comparator (e.g. tranexamic acid).
Types of outcome measures
We have added time frames to the primary and secondary outcomes and added the number of participants with any bleeding, quality of life, and serious adverse events as outcomes.
Primary outcomes
-
Number of participants transfused with blood (during the procedure, up to 24 hours post procedure, and within 30 days of the procedure)
-
Volume of blood transfused (expressed as total units of blood or millilitres per kilogram for children; during the procedure, up to 24 hours post procedure, and within 30 days of the procedure)
-
Blood loss in millilitres per adult participant, or blood loss in millilitres per kilogram for children (total blood loss, intraoperative blood loss, and postoperative blood loss up to 24 hours post procedure)
Secondary outcomes
-
Reoperation due to bleeding
-
Number of participants with any bleeding ‐ low‐risk procedures only (intraoperative blood loss, and postoperative blood loss up to 24 hours post procedure)
-
All‐cause mortality within 30 days from the procedure
-
Risk of thrombotic events (arterial or venous):
-
-
myocardial infarction up to 30 days post infusion
-
stroke up to 30 days post infusion
-
venous thromboembolism up to 30 days post infusion
-
-
Serious adverse events within 30 days of the procedure
-
Quality of life
Search methods for identification of studies
We will create a new search strategy. We will search for RCTs in the following databases:
-
CENTRAL (Cochrane Library, latest issue)
-
MEDLINE (OvidSP, 1946 to present);
-
PubMed (epublications only, to present);
-
Embase (OvidSP, 1974 to present);
-
CINAHL (EBSCOhost, 1937 to present);
-
UKBTS/SRI Transfusion Evidence Library (www.transfusionevidencelibrary.com) (1950 to present);
-
Web of Science: Conference Proceedings Citation Index‐Science (CPCI‐S) (Thomson Reuters, 1990 to present);
-
LILACS (BIREME/PAHO/WHO, 1982 to present);
-
IndMed (ICMR‐NIC, 1985 to present);
-
KoreaMed (KAMJE, 1997 to present);
-
PakMediNet (2001 to present).
We will combine searches in MEDLINE, Embase, and CINAHL with adaptations of the Cochrane RCT search filters, as detailed in the Cochrane Handbook for Systematic Reviews of Interventions (Lefebvre 2011).
We will also search ClinicalTrials.gov (clinicaltrials.gov), the WHO International Clinical Trials Registry (ICTRP ‐ apps.who.int/trialsearch), and the Hong Kong University Clinical Trials Register (www.hkuctr.com) to identify ongoing trials. We have included the new search strategy in Appendix 2.
Data collection and analysis
Data extraction
We will collect data on trial registration and the new outcomes in this review: number of participants with any bleeding; quality of life; and serious adverse events.
Risk of bias
We will perform an assessment of all RCTs using the Cochrane 'Risk of bias' tool according to Chapter 8 of the Cochrane Handbook for Systematic Reviews of Interventions (Higgins 2011b). Two review authors will work independently to assess each element of potential bias listed below as 'high', 'low', or 'unclear risk of bias'. We will report a brief description of the judgement statements upon which review authors have assessed potential bias in the 'Characteristics of included studies' table. We will ensure that a consensus on the degree of risk of bias is met through comparison of review authors' statements and, when necessary, through consultation with a third review author. We will use the Cochrane tool for assessing risk of bias, which includes the following domains:
-
selection bias: random sequence generation and allocation concealment;
-
performance bias: blinding of participants and personnel;
-
detection bias: blinding of outcome assessment;
-
attrition bias: incomplete outcome data;
-
reporting bias: selective reporting;
-
other bias.
Measures of treatment effect
For continuous outcomes, we will record means, standard deviations, and total numbers of participants for both treatment and control groups. For dichotomous outcomes, we will record numbers of events and total numbers of participants for both treatment and control groups.
For continuous outcomes using the same scale, we will perform analyses using the mean difference (MD) with 95% confidence intervals (CIs). For continuous outcomes measured on different scales, we will present the standard mean difference (SMD). If available, we will extract and report hazard ratios (HRs) for mortality data. If HRs are not available, we will make every effort to estimate the HR as accurately as possible using available data and a purpose‐built method based on the Parmar and Tierney approach (Parmar 1998; Tierney 2007).
For dichotomous outcomes, we will report the pooled risk ratio (RR) with 95% CIs. When the number of observed events is small (< 5% of sample per group), and when trials include balanced treatment groups, we will report the Peto odds ratio (OR) with 95% CIs (Deeks 2011).
If data allow, we will undertake quantitative assessments using Review Manager 5 (RevMan 2014).
When appropriate, we will report the number needed to treat for an additional beneficial outcome (NNTB) and the number needed to treat for an additional harmful outcome (NNTH) with CIs.
If we cannot report available data in any of the formats described above, we will prepare a narrative report, and, if appropriate, we will present the data in tables.
Unit of analysis issues
We do not expect to encounter unit of analysis issues, as we are unlikely to include cluster‐randomised trials, cross‐over studies, and multiple observations for the same outcome in this review. Should we identify any studies of these designs, we will treat them in accordance with advice given in Chapter 16 of the Cochrane Handbook for Systematic Reviews of Interventions (Higgins 2011c). If participants are randomised more than once we will contact the authors of the study to request data on the procedure associated with the initial randomisation. For studies with multiple treatment groups, two review authors will exclude subgroups that are considered irrelevant to the analysis. We will tabulate all subgroups in the 'Characteristics of included studies' section. When appropriate, we will combine groups to create a single pair‐wise comparison. If this is not possible, we will select the most appropriate pair of interventions and will exclude the others (Higgins 2011c).
Dealing with missing data
When we identify data as missing or unclear in published literature, we will contact study authors directly. We will record the number of participants lost to follow‐up for each study. When possible, we will analyse data on an intention‐to‐treat (ITT) basis, but if insufficient data are available, we will present per‐protocol analyses (Higgins 2011c).
Assessment of heterogeneity
If clinical and methodological characteristics of individual studies are sufficiently homogeneous, we will combine the data to perform a meta‐analysis. We will assess statistical heterogeneity of treatment effects between studies using a Chi2 test with a significance level of P < 0.1. We will use the I2 statistic to quantify the degree of potential heterogeneity and will classify it as moderate if I2 is less than 50%, or considerable if I2 is between 50% and 80%. We will assess potential causes of heterogeneity by conducting sensitivity and subgroup analyses (Deeks 2011).
Assessment of reporting biases
When we identify at least 10 studies for inclusion in a meta‐analysis, we will explore potential publication bias (small‐trial bias) by generating a funnel plot and performing a linear regression test. We will consider a P value of less than 0.1 as statistically significant for this test (Sterne 2011).
Data synthesis
We will perform analyses according to recommendations provided in Chapter 9 of the Cochrane Handbook for Systematic Reviews of Interventions, using aggregated data for analysis (Deeks 2011). For statistical analysis, we will enter data into Review Manager 5 software (RevMan 2014). One review author will enter the data, and a second review author will check the data for accuracy.
When meta‐analysis is feasible, we will use the fixed‐effect model for pooling data. We will use the Mantel‐Haenszel method for dichotomous outcomes, and the inverse variance method (or standardised mean differences as necessary) for continuous outcomes. When events are rare, and appropriate conditions are satisfied, we will use the Peto odds method. We will use the generic inverse variance method for time‐to‐event outcomes.
Trial sequential analysis
We will provide a sample size estimate showing how many participants need to be included in a meta‐analysis for reliable results. We will use trial sequential methods to explore all treatment effects attained before the required sample size is reached, using TSA v0.9 software (TSA 2011). We will sequence trials by first publication date of the full articles. This will provide the information size required to detect a statistically significant underlying effect. We will apply trial sequential analysis to the following outcomes:
-
mean blood loss up to 24 hours post procedure; and
-
number of participants transfused with blood up to 24 hours post procedure.
We will calculate mean blood loss and transfusion requirements for this population by using the mean blood loss and transfusion requirements derived from control group data. We will calculate the information size necessary for a relative risk reduction of bleeding and of receiving a red cell transfusion of 15%, which is equivalent to the effect size proposed for prophylactic use of tranexamic acid before surgery (Ker 2012).
If the calculated cumulative Z‐curve crosses trial sequential monitoring boundaries, we will consider statistical significance to be reached while maintaining the overall type I error rate. Futility boundaries will be produced such that if the cumulative Z‐curve crosses the futility threshold, evidence shows that the two treatments do not differ more than the anticipated effect size. We will use the O'Brien Fleming alpha‐spending function with an overall 5% type I error rate and 80% statistical power to derive two‐sided sequential monitoring and futility boundaries.
'Summary of findings' table
We will use the GRADE approach to create a 'Summary of findings' table, as suggested in Chapters 11 and 12 of the Cochrane Handbook for Systematic Reviews of Interventions (Schünemann 2011a; Schünemann 2011b). We will use the GRADE approach to rate the quality of the evidence as 'high', 'moderate', 'low', or 'very low', using the five GRADE considerations:
-
risk of bias: serious or very serious;
-
inconsistency: serious or very serious;
-
indirectness: serious or very serious;
-
imprecision: serious or very serious; and
-
publication bias: likely or very likely.
We will include the following outcomes:
-
mean blood loss up to 24 hours post procedure;
-
number of participants transfused with blood up to 24 hours post‐procedure;
-
overall mortality up to 30 days post infusion;
-
risk of thrombotic events (arterial or venous);
-
-
myocardial infarction up to 30 days post infusion;
-
stroke up to 30 days post infusion;
-
venous thromboembolism up to 30 days post infusion; and
-
-
quality of life.
Subgroup analysis and investigation of heterogeneity
If adequate data are available, we will perform subgroup analyses for each of the following outcomes to assess their effect on heterogeneity:
-
type of surgery or procedure;
-
type of participant (liver disease and kidney disease with uraemia);
-
age of participant (infants, children, adults);
-
preoperative exposure of participants to acetylsalicylic acid (ASA) or other antiplatelet agents;
-
use of cell‐salvage techniques for the two primary outcomes:
-
number of participants transfused with blood, or both (during the procedure, up to 24 hours post procedure, and within 30 days of the procedure);
-
volume of blood transfused (expressed as total units of blood or millilitres per kilogram for children; during the procedure, up to 24 hours post procedure, and within 30 days of the procedure).
-
If appropriate, we will also investigate heterogeneity between studies according to use of a transfusion protocol.
Sensitivity analysis
We will assess the robustness of our findings by performing the following sensitivity analyses when appropriate.
-
Inclusion only of studies with a low risk of bias (e.g. RCTs with methods assessed as low risk for random sequence generation and concealment of treatment allocation).
-
Inclusion only of studies with a dropout rate of less than 20%.
-
Inclusion only of studies published before 2010 plus those registered prospectively and published after 2010.
Changes to future updates of this review
In future updates of this review, review authors will compare only DDAVP versus placebo (or standard of care) and will remove comparisons of DDAVP versus tranexamic acid and DDAVP versus aprotinin.
In addition, review authors will limit the time period for follow‐up for primary outcomes to 48 hours, rather than up to 30 days.
Keywords
MeSH
Medical Subject Headings (MeSH) Keywords
- Antifibrinolytic Agents [administration & dosage];
- Aprotinin [administration & dosage];
- Blood Loss, Surgical [*prevention & control];
- Cardiac Surgical Procedures [statistics & numerical data];
- Deamino Arginine Vasopressin [*administration & dosage];
- Erythrocyte Transfusion [*statistics & numerical data];
- Hemostatics [*administration & dosage];
- Orthopedic Procedures [statistics & numerical data];
- Randomized Controlled Trials as Topic;
- Tranexamic Acid [administration & dosage];
- Transplantation, Homologous;
- Vascular Surgical Procedures [statistics & numerical data];
Medical Subject Headings Check Words
Adult; Humans;
PICO

Study flow diagram.
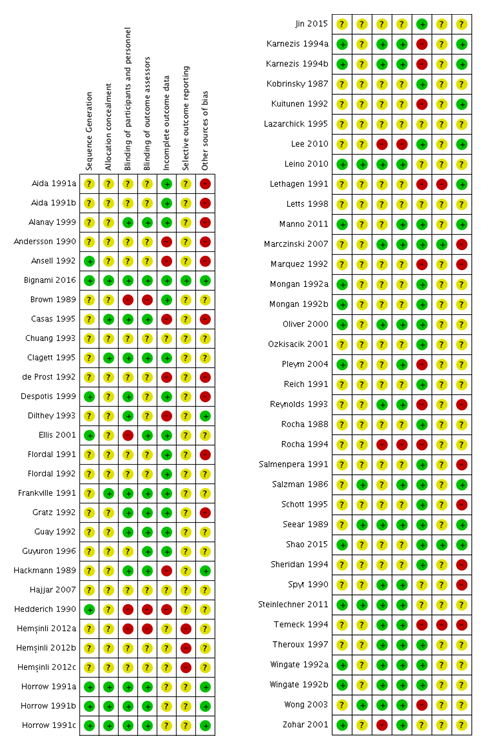
Risk of bias summary: review authors' judgements about each risk of bias item for each included study.
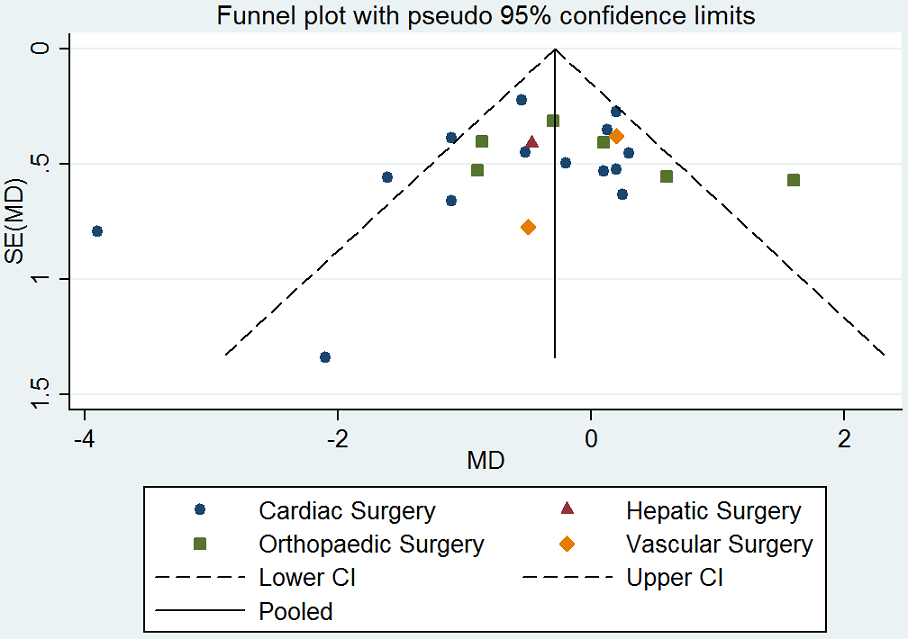
Funnel plot of comparison: desmopressin vs placebo: total red cell volume transfused. CI: confidence interval; MD: mean difference; SE: standard error.
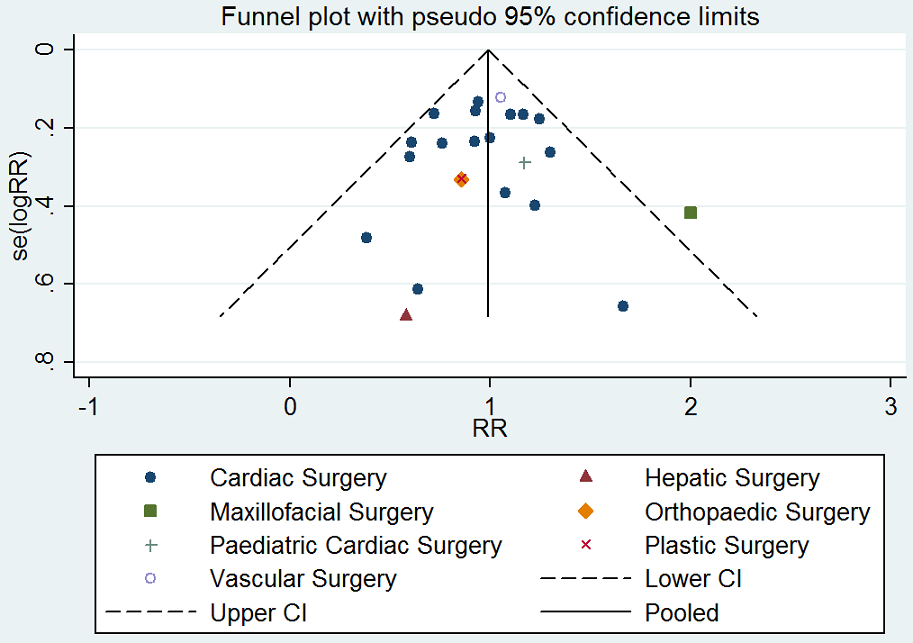
Funnel plot of comparison: desmopressin vs placebo: number of participants receiving a red cell transfusion. CI: confidence interval; RR: relative risk.
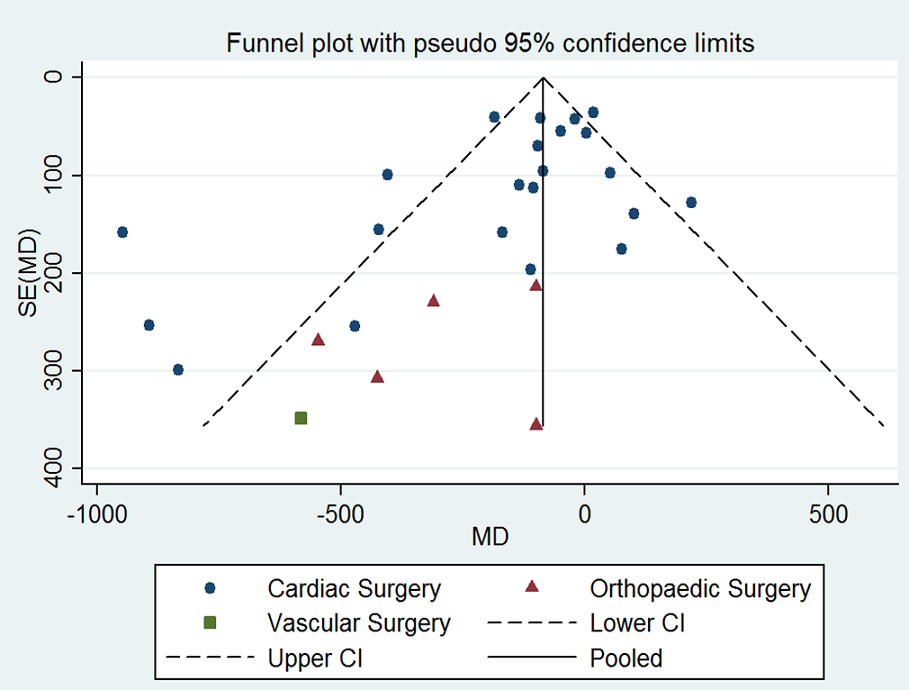
Funnel plot of comparison: desmopressin vs placebo: total blood loss. CI: confidence interval; MD: mean difference; SE: standard error.
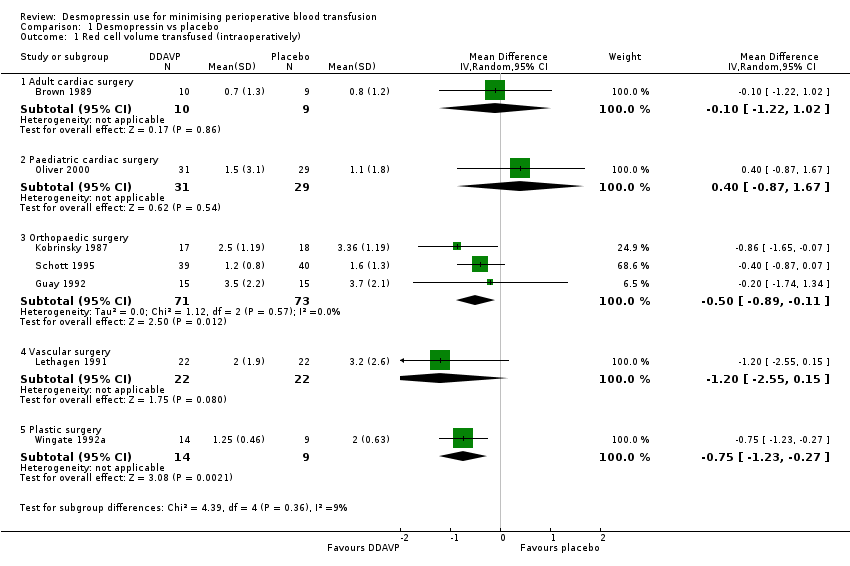
Comparison 1 Desmopressin vs placebo, Outcome 1 Red cell volume transfused (intraoperatively).
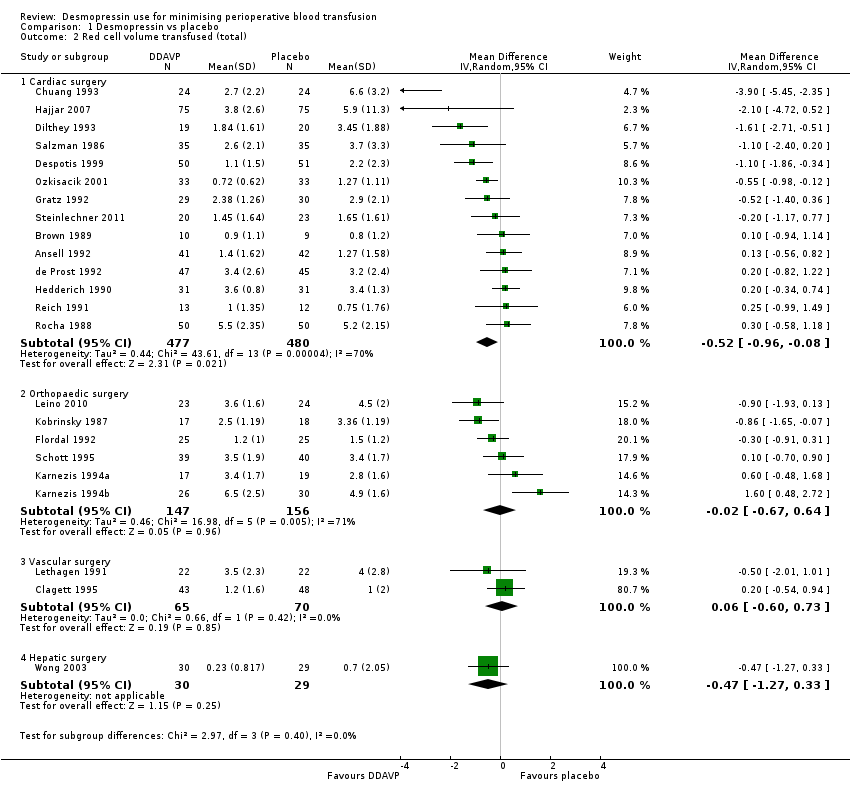
Comparison 1 Desmopressin vs placebo, Outcome 2 Red cell volume transfused (total).

Comparison 1 Desmopressin vs placebo, Outcome 3 Red cell volume transfused (children only, total).
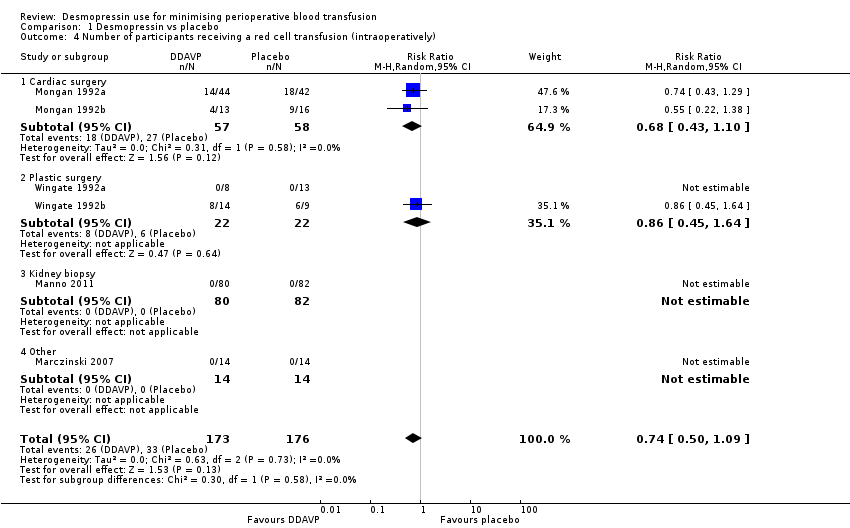
Comparison 1 Desmopressin vs placebo, Outcome 4 Number of participants receiving a red cell transfusion (intraoperatively).
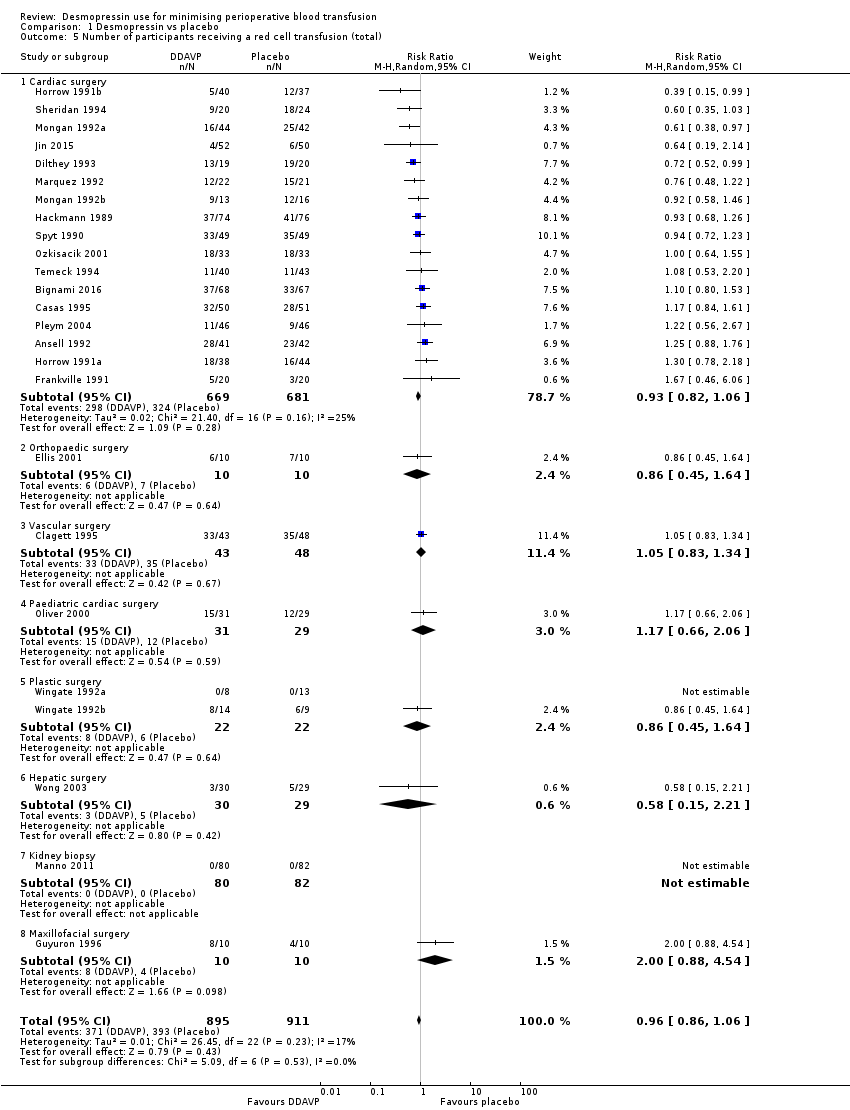
Comparison 1 Desmopressin vs placebo, Outcome 5 Number of participants receiving a red cell transfusion (total).

Comparison 1 Desmopressin vs placebo, Outcome 6 Blood loss (intraoperative).

Comparison 1 Desmopressin vs placebo, Outcome 7 Blood loss (total).
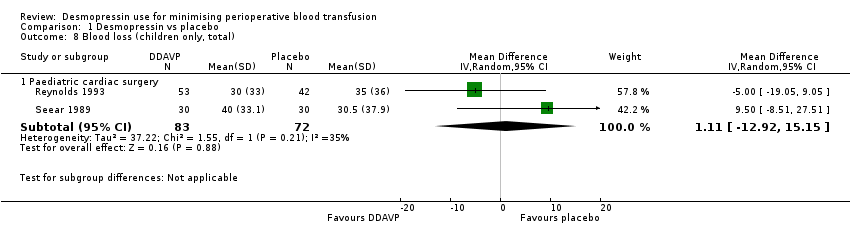
Comparison 1 Desmopressin vs placebo, Outcome 8 Blood loss (children only, total).
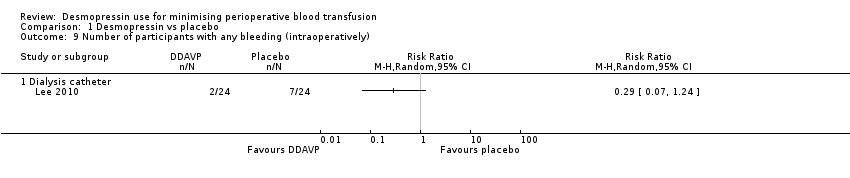
Comparison 1 Desmopressin vs placebo, Outcome 9 Number of participants with any bleeding (intraoperatively).
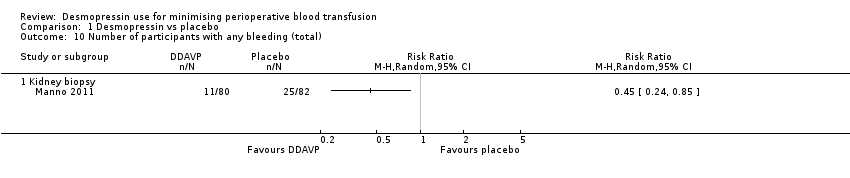
Comparison 1 Desmopressin vs placebo, Outcome 10 Number of participants with any bleeding (total).
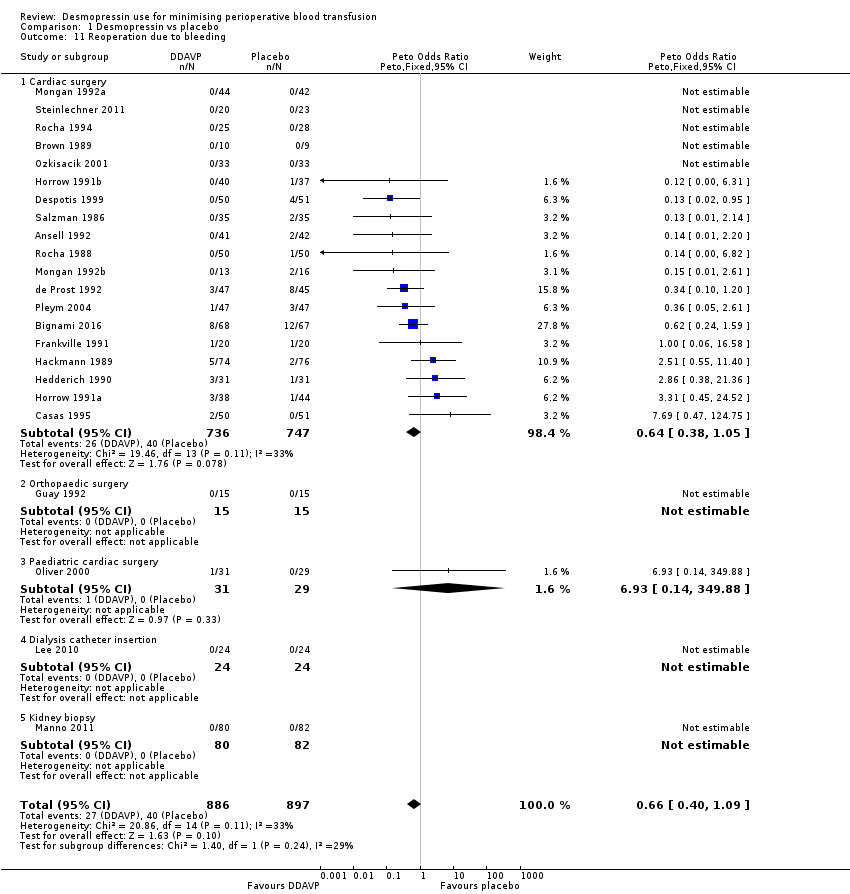
Comparison 1 Desmopressin vs placebo, Outcome 11 Reoperation due to bleeding.

Comparison 1 Desmopressin vs placebo, Outcome 12 All‐cause mortality.
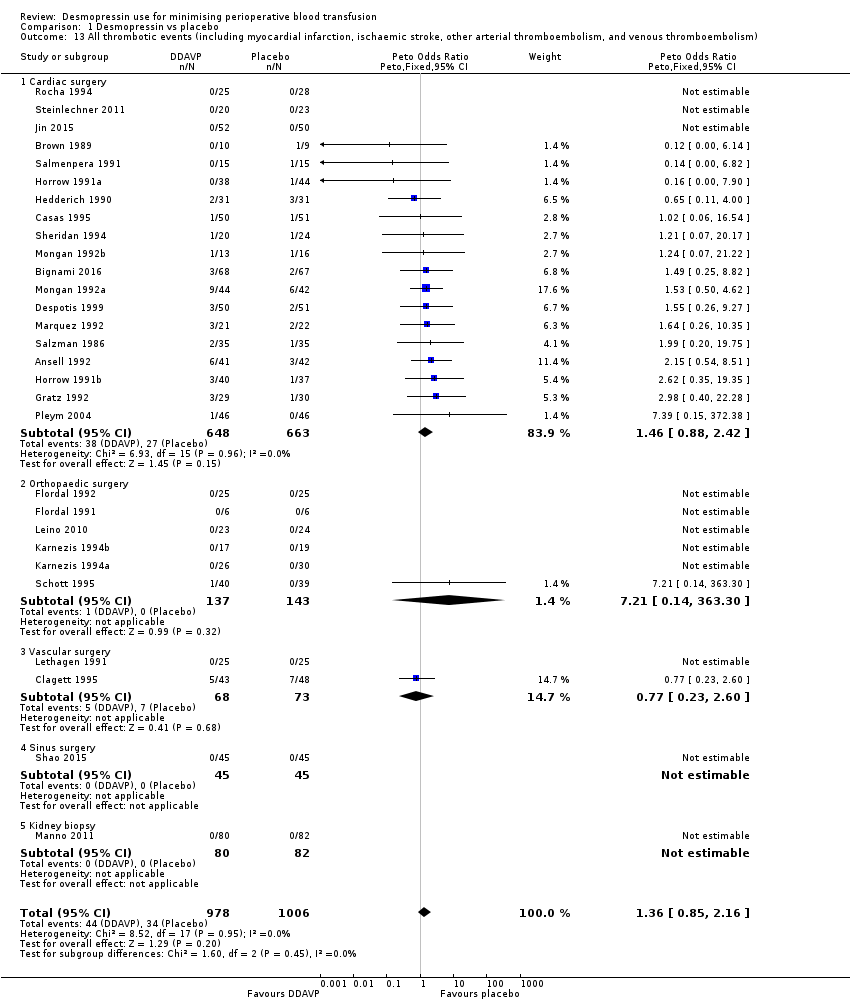
Comparison 1 Desmopressin vs placebo, Outcome 13 All thrombotic events (including myocardial infarction, ischaemic stroke, other arterial thromboembolism, and venous thromboembolism).
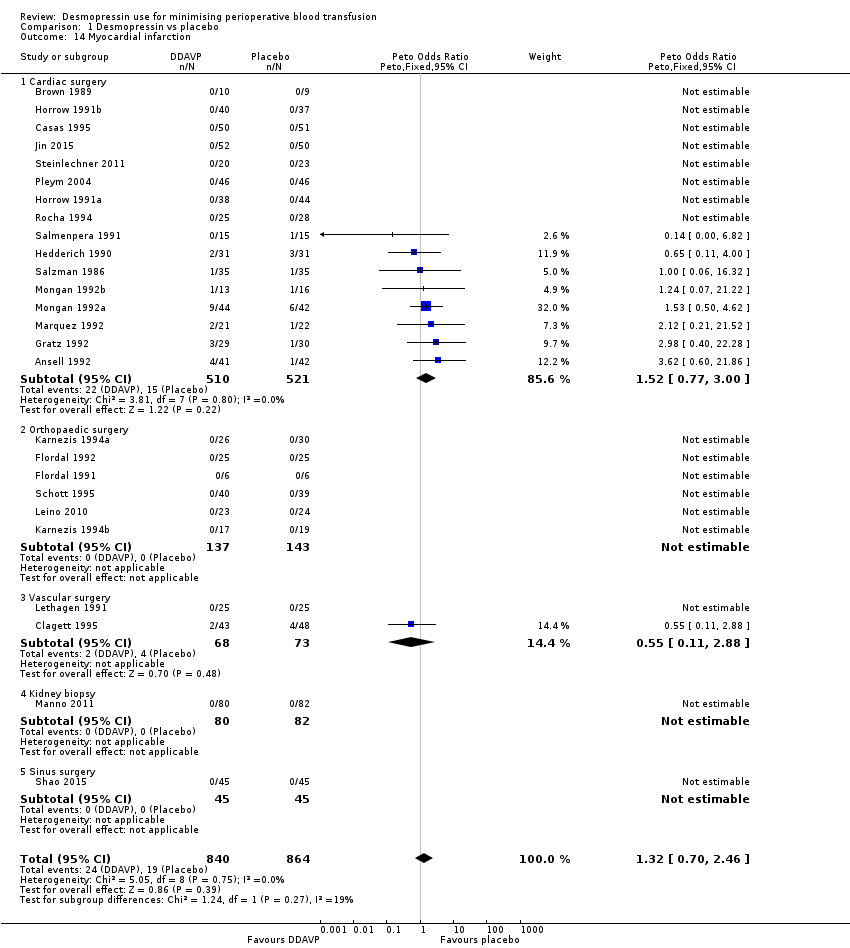
Comparison 1 Desmopressin vs placebo, Outcome 14 Myocardial infarction.

Comparison 1 Desmopressin vs placebo, Outcome 15 Stroke.
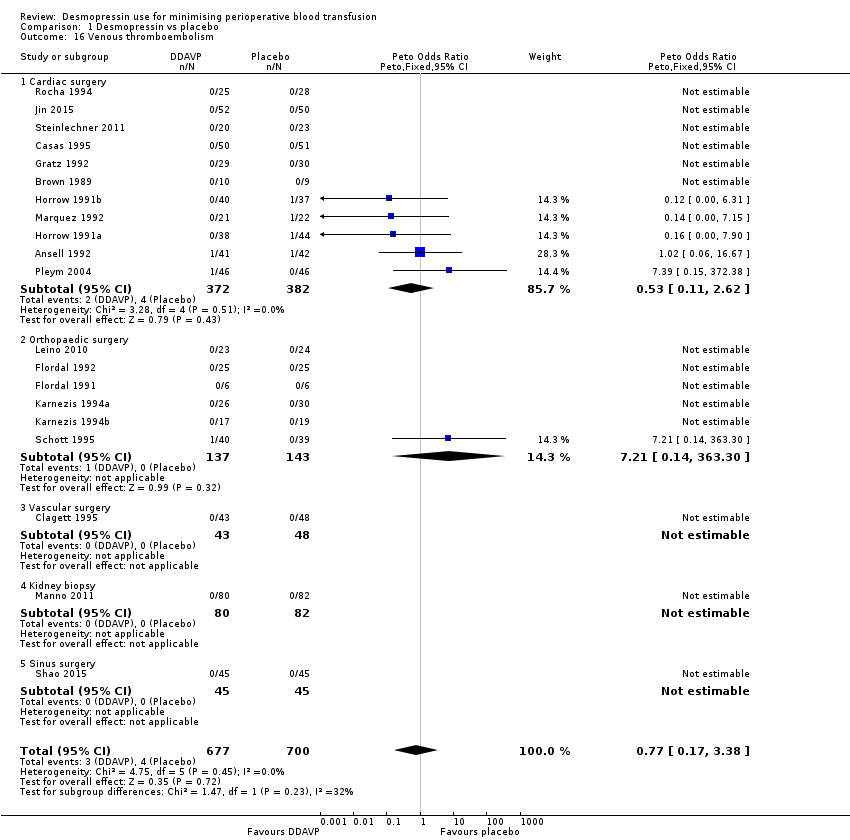
Comparison 1 Desmopressin vs placebo, Outcome 16 Venous thromboembolism.
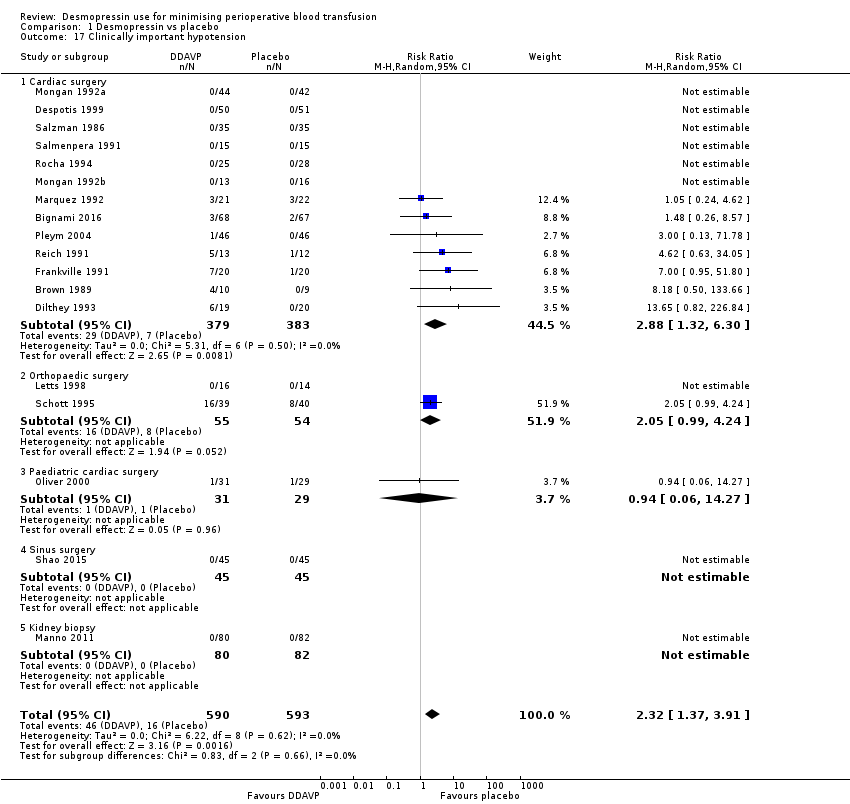
Comparison 1 Desmopressin vs placebo, Outcome 17 Clinically important hypotension.

Comparison 2 Desmopressin vs placebo (platelet dysfunction), Outcome 1 Red cell volume transfused (total).

Comparison 2 Desmopressin vs placebo (platelet dysfunction), Outcome 2 Number of participants receiving a red cell transfusion (intraoperatively).

Comparison 2 Desmopressin vs placebo (platelet dysfunction), Outcome 3 Number of participants receiving a red cell transfusion (total).
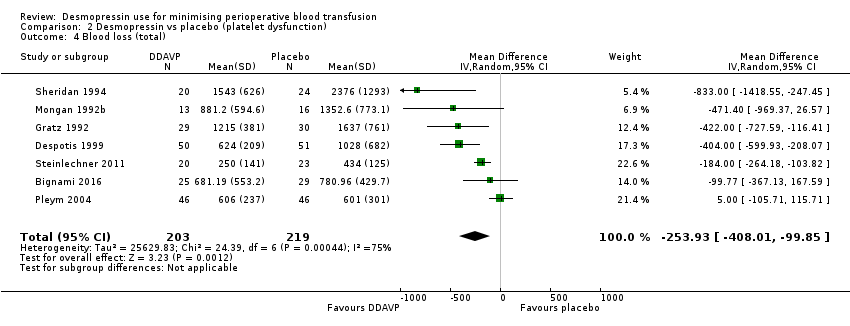
Comparison 2 Desmopressin vs placebo (platelet dysfunction), Outcome 4 Blood loss (total).
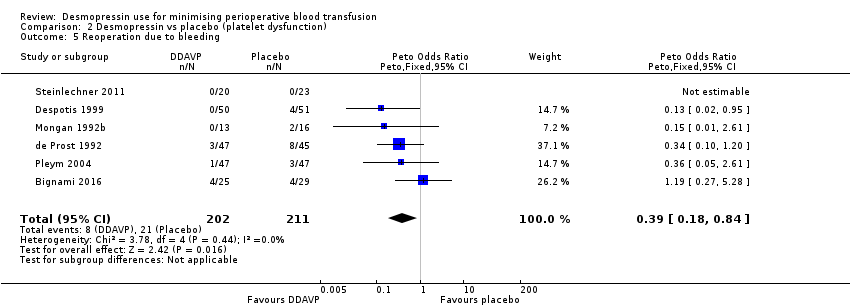
Comparison 2 Desmopressin vs placebo (platelet dysfunction), Outcome 5 Reoperation due to bleeding.

Comparison 2 Desmopressin vs placebo (platelet dysfunction), Outcome 6 All‐cause mortality.
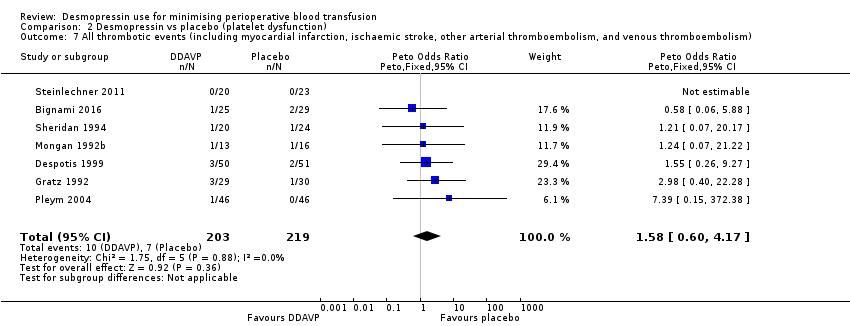
Comparison 2 Desmopressin vs placebo (platelet dysfunction), Outcome 7 All thrombotic events (including myocardial infarction, ischaemic stroke, other arterial thromboembolism, and venous thromboembolism).

Comparison 2 Desmopressin vs placebo (platelet dysfunction), Outcome 8 Myocardial infarction.
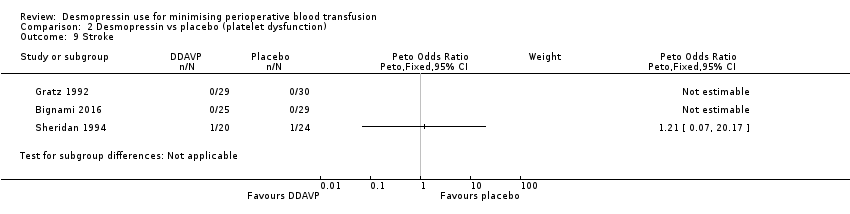
Comparison 2 Desmopressin vs placebo (platelet dysfunction), Outcome 9 Stroke.

Comparison 2 Desmopressin vs placebo (platelet dysfunction), Outcome 10 Venous thromboembolism.
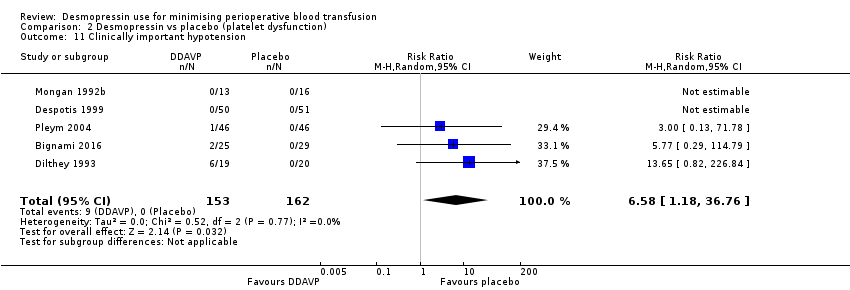
Comparison 2 Desmopressin vs placebo (platelet dysfunction), Outcome 11 Clinically important hypotension.

Comparison 3 Desmopressin vs tranexamic acid, Outcome 1 Red cell volume transfused (total).
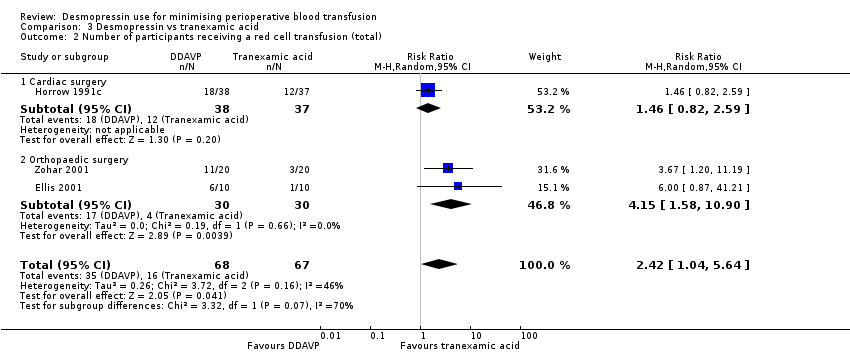
Comparison 3 Desmopressin vs tranexamic acid, Outcome 2 Number of participants receiving a red cell transfusion (total).
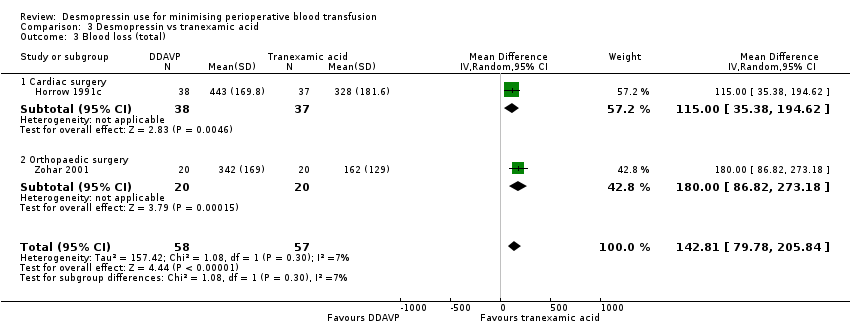
Comparison 3 Desmopressin vs tranexamic acid, Outcome 3 Blood loss (total).
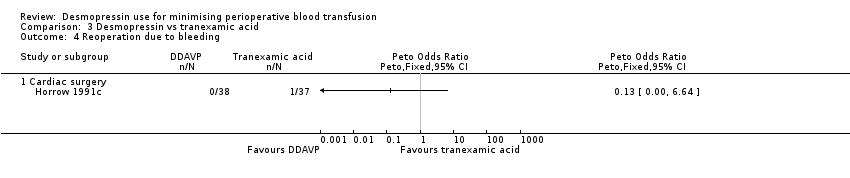
Comparison 3 Desmopressin vs tranexamic acid, Outcome 4 Reoperation due to bleeding.

Comparison 3 Desmopressin vs tranexamic acid, Outcome 5 All thrombotic events (including myocardial infarction, ischaemic stroke, other arterial thromboembolism, and venous thromboembolism).

Comparison 3 Desmopressin vs tranexamic acid, Outcome 6 Myocardial infarction.

Comparison 3 Desmopressin vs tranexamic acid, Outcome 7 Stroke.

Comparison 3 Desmopressin vs tranexamic acid, Outcome 8 Venous thromboembolism.

Comparison 4 Desmopressin vs aprotinin, Outcome 1 Number of participants receiving a red cell transfusion (total).

Comparison 4 Desmopressin vs aprotinin, Outcome 2 Reoperation due to bleeding.
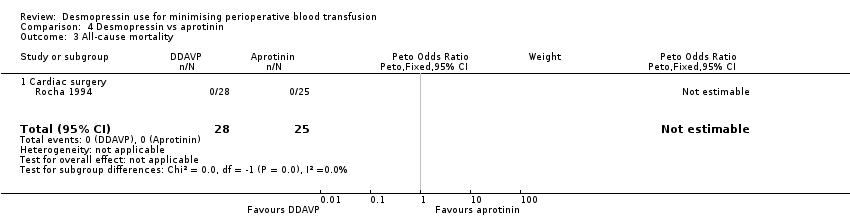
Comparison 4 Desmopressin vs aprotinin, Outcome 3 All‐cause mortality.

Comparison 4 Desmopressin vs aprotinin, Outcome 4 All thrombotic events (including myocardial infarction, ischaemic stroke, other arterial thromboembolism, and venous thromboembolism).

Comparison 4 Desmopressin vs aprotinin, Outcome 5 Myocardial infarction.

Comparison 4 Desmopressin vs aprotinin, Outcome 6 Stroke.
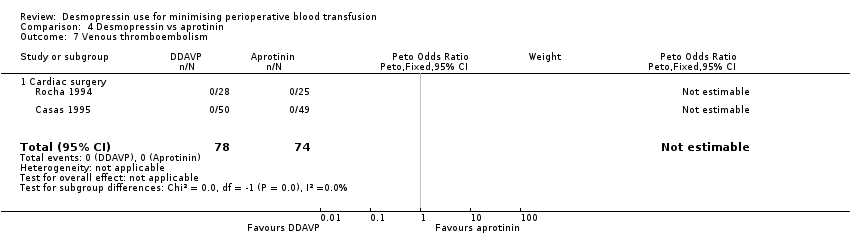
Comparison 4 Desmopressin vs aprotinin, Outcome 7 Venous thromboembolism.

Comparison 4 Desmopressin vs aprotinin, Outcome 8 Clinically significant hypotension.
| Participant or population: participants undergoing surgery | ||||||
| Outcomes | Anticipated absolute effects* (95% CI) | Relative effect | No. of participants | Quality of the evidence | Comments | |
| Risk with placebo | Risk with desmopressin | |||||
| Red cell volume transfused (total) | Adult cardiac surgery: red cell volume transfused in the desmopressin group was 0.52 units less (0.96 fewer to 0.08 fewer units, 14 RCTs, 957 participants) | 1454 | ⊕⊕⊝⊝ | Data not pooled due to clinical heterogeneity and reported as subgroups | ||
| Orthopaedic surgery: red cell volume transfused in the desmopressin group was 0.02 units less (0.67 less to 0.64 more units, 6 RCTs, 303 participants) | ||||||
| Vascular surgery: red cell volume transfused in the desmopressin group was 0.06 units more (0.60 less to 0.73 more units, 2 RCTs, 135 participants) | ||||||
| Hepatic surgery: red cell volume transfused in the desmopressin group was 0.47 units less (1.27 less to 0.33 more units, 1 RCT, 59 participants) | ||||||
| Number of participants receiving a red cell transfusion (total) | 450 per 1000 | 436 per 1000 | RR 0.96 | 1806 | ⊕⊕⊕⊝ | |
| Blood loss (total) | Cardiac surgery: total blood loss in the desmopressin group was 135.24 mL less (210.8 mL to 59.68 mL less, 22 RCTs, 1358 participants). | 1643 | ⊕⊝⊝⊝ | Data not pooled owing to clinical heterogeneity and reported as subgroups | ||
| Orthopaedic surgery: total blood loss in the desmopressin group was 285.76 mL less (514.99 mL to 56.53 mL less, 5 RCTs, 241 participants) | ||||||
| Vascular surgery: total blood loss in the desmopressin group was 582 mL less (1264.07 mL less to 100.07 mL more, 1 RCT, 44 participants) | ||||||
| All‐cause mortality | 16 per 1000 | 17 per 1000 | pOR 1.09 (0.51 to 2.34) | 1631 | ⊕⊕⊝⊝ | |
| All thrombotic events (including myocardial infarction, ischaemic stroke, other arterial thromboembolism, and venous thromboembolism) | 34 per 1000 | 44 per 1000 | pOR 1.36 (0.85 to 2.16) | 1984 | ⊕⊕⊝⊝ | |
| Quality of life | Not reported | ‐ | (No studies) | ‐ | ||
| *The risk in the intervention group (and its 95% confidence interval) is based on the assumed risk in the comparison group and the relative effect of the intervention (and its 95% CI) | ||||||
| GRADE Working Group grades of evidence | ||||||
| aDowngraded one level due to risk of bias: inadequate reporting of blinding and incomplete outcome data bDowngraged one level for inconsistency: I2 = 66% cDowngraded one level for inconsistency: I2 = 73% and sensitivity analysis unable to determine cause of heterogeneity dDowngraded one level for suspected publication bias eDowngraded one level due to imprecision, as confidence intervals include both clinically important benefit and clinically important harm | ||||||
| Participant or population: participants with platelet dysfunction undergoing surgery | ||||||
| Outcomes | Anticipated absolute effects* (95% CI) | Relative effect | No. of participants | Quality of the evidence | Comments | |
| Risk with placebo | Risk with desmopressin | |||||
| Red cell volume transfused (total) | Red cell volume transfused was 2.6 units | Red cell volume transfused in the desmopressin group was 0.65 units less (1.16 less to 0.13 less) | ‐ | 388 | ⊕⊕⊝⊝ | |
| Number of participants receiving a red cell transfusion (total) | 541 per 1000 | 449 per 1000 | RR 0.83 | 258 | ⊕⊕⊝⊝ | |
| Blood loss (total) | Mean total blood loss was 1098 mL | Total blood loss in the desmopressin group was 253.93 mL less (408.01 mL less to 99.85 mL less) | ‐ | 422 | ⊕⊕⊝⊝ | |
| All‐cause mortality | 14 per 1000 | 10 per 1000 (2 to 59) | pOR 0.72 (0.12 to 4.22) | 422 | ⊕⊝⊝⊝ | |
| All thrombotic events (including myocardial infarction, ischaemic stroke, other arterial thromboembolism, and venous thromboembolism) | 32 per 1000 | 51 per 1000 | pOR 1.58 | 422 | ⊕⊝⊝⊝ | |
| Quality of life | Not reported | ‐ | (No studies) | ‐ | ||
| *The risk in the intervention group (and its 95% confidence interval) is based on the assumed risk in the comparison group and the relative effect of the intervention (and its 95% CI) | ||||||
| GRADE Working Group grades of evidence | ||||||
| aDowngraded one level for risk of bias bDowngraded one level for inconsistency due to variation in baseline level of transfusion and blood loss cDowngraded two levels for imprecision, as confidence intervals include clinically important benefit and clinically important harm with low background event rate dDowngraded one level for imprecision | ||||||
| Participant or population: participants undergoing surgery | ||||||
| Outcomes | Anticipated absolute effects* (95% CI) | Relative effect | No. of participants | Quality of the evidence | Comments | |
| Risk with tranexamic acid | Risk with desmopressin | |||||
| Red cell volume transfused (total) | Mean red cell volume transfused was 0.2 units | Red cell volume transfused in the desmopressin group was 0.6 units more (0.09 more to 1.11 more) | ‐ | 40 | ⊕⊕⊝⊝ | |
| Number of participants receiving a red cell transfusion (total) | 239 per 1000 | 578 per 1000 | RR 2.42 | 135 | ⊕⊝⊝⊝ | |
| Blood loss (total) | Mean blood loss was 270 mL | Total blood loss in the desmopressin group was 142.81 mL more (79.78 mL more to 205.84 mL more) | ‐ | 115 | ⊕⊕⊝⊝ | |
| All‐cause mortality | Not reported | ‐ | (No studies) | ‐ | ||
| All thrombotic events (including myocardial infarction, ischaemic stroke, other arterial thromboembolism, and venous thromboembolism) | 18 per 1000 | 51 per 1000 | RR 2.92 | 115 | ⊕⊝⊝⊝ | |
| Quality of life | Not reported | ‐ | (No studies) | ‐ | ||
| *The risk in the intervention group (and its 95% confidence interval) is based on the assumed risk in the comparison group and the relative effect of the intervention (and its 95% CI) | ||||||
| GRADE Working Group grades of evidence | ||||||
| aDowngraded one level for risk of bias bDowngraded one level for indirectness because most types of surgery or procedures were not represented by the included trials cDowngraded one level for imprecision owing to wide confidence intervals dDowngraded two levels for imprecision owing to very wide confidence intervals eOutcome not downgraded for indirectness because already downgraded three levels for other reasons | ||||||
| Participant or population: participants undergoing surgery | ||||||
| Outcomes | Anticipated absolute effects* (95% CI) | Relative effect | No. of participants | Quality of the evidence | Comments | |
| Risk with aprotinin | Risk with desmopressin | |||||
| Red cell volume transfused (total) | Not reported | ‐ | (No studies) | ‐ | ||
| Number of participants receiving a red cell transfusion (total) | 265 per 1000 | 639 per 1000 | RR 2.41 | 99 | ⊕⊕⊝⊝ | |
| Blood loss (total) | Not reported | ‐ | (No studies) | ‐ | ||
| All‐cause mortality | No deaths in either arm of the trial | Not estimable | 53 | ⊕⊝⊝⊝ | ||
| All thrombotic events (including myocardial infarction, ischaemic stroke, other arterial thromboembolism, and venous thromboembolism) | 14 per 1000 | 13 per 1000 | pOR 0.98 | 152 | ⊕⊝⊝⊝ | |
| Quality of life | Not reported | ‐ | (No studies) | ‐ | ||
| *The risk in the intervention group (and its 95% confidence interval) is based on the assumed risk in the comparison group and the relative effect of the intervention (and its 95% CI) | ||||||
| GRADE Working Group grades of evidence | ||||||
| aDowngraded one level for risk of bias bDowngraded one level for indirectness because most types of surgery or procedures were not represented by the included trials cDowngraded two levels for imprecision (no deaths in either arm) dNot downgraded for indirectness because already downgraded three levels for other reasons eDowngraded two levels for imprecision (very wide confidence intervals) | ||||||
| Trial (country) | Number of participants | Surgery type | Cases | Antiplatelet agents | Anticoagulants (%) | Coagulopathy (%) | Thrombocytopenia (%) | Antifibrinolytics (%) | Transfusion protocol | Timing of blood loss or transfusion assessment (hours) |
| (Japan) | 9 | Cardiac | ‐ | ‐ | ‐ | ‐ | ‐ | ‐ | ‐ | 24 |
| (Japan) | 11 | Cardiac | ‐ | ‐ | ‐ | ‐ | ‐ | ‐ | ‐ | 24 |
| (Turkey) | 40 | Orthopaedic | Elective | ‐ | ‐ | ‐ | ‐ | ‐ | ‐ | 24 |
| (Sweden) | 19 | Cardiac | Elective | 0 | 0 | ‐ | ‐ | ‐ | ‐ | ‐ |
| (USA) | 83 | Cardiac | Elective | ‐ | ‐ | ‐ | ‐ | DDAVP: 2‐4a Placebo: 0 | ‐ | 24 |
| (Italy) | 135 | Cardiac | Elective | DDAVP: 38b Placebo: 43b | ‐ | DDAVP: 1‐5 Placebo: 1‐5 | ‐ | 100c | Yes | 24 |
| (USA) | 39 | Cardiac | Elective | DDAVP: 60b Placebo: 50b | ‐ | 0 | ‐ | ‐ | ‐ | 24 |
| (Spain) | 149 | Cardiac | Elective | DDAVP: 14b Placebo: 9‐8b Aprotinin: 14‐6b | 0 | 0 | ‐ | DDAVP: 0 Placebo: 0 Aprotinin: 100d | Yes | 24 |
| (China) | 96 | Cardiac | ‐ | ‐ | ‐ | ‐ | ‐ | ‐ | ‐ | 24 |
| (USA) | 91 | Vascular | Elective | 0 | ‐ | ‐ | ‐ | ‐ | ‐ | 72 |
| (France) | 92 | Cardiac | ‐ | 100e | ‐ | ‐ | 0 | DDAVP: 4‐3d Placebo: 13‐3d | Yes | 24 |
| (USA) | 101 | Cardiac | Elective | DDAVP: 52b Placebo: 66b 100f | DDAVP: 6 Placebo: 0 | ‐ | ‐ | DDAVP 50a Placebo 61a | No | 24 |
| (Germany) | 39 | Cardiac | Elective | 100b | 0 | 0 | ‐ | 0 | Yes | 24 |
| (Israel) | 30 | Orthopaedic | Elective | ‐ | ‐ | ‐ | ‐ | DDAVP: 0 TXA: 100c | Yes | 72 |
| (Sweden) | 12 | Orthopaedic | Elective | ‐ | ‐ | ‐ | ‐ | ‐ | ‐ | 24 |
| (Sweden) | 50 | Orthopaedic | Elective | ‐ | ‐ | ‐ | ‐ | ‐ | ‐ | ‐ |
| (USA) | 40 | Cardiac | Elective | 0 | 0 | 0 | 0 | ‐ | ‐ | 24 |
| (USA) | 59 | Cardiac | Elective | 100b | ‐ | ‐ | 0 | ‐ | ‐ | 24 |
| (Canada) | 30 | Orthopaedic | Elective | 0 | 0 | 0 | 0 | ‐ | Yes | 24 |
| (USA) | 20 | Maxillofacial | Elective | ‐ | ‐ | 0 | ‐ | ‐ | ‐ | 24 |
| (Canada) | 150 | Cardiac | Elective | DDAVP: 21‐6b Placebo: 14‐5b | ‐ | 0 | 0 | ‐ | ‐ | 24 |
| (Brazil) | 150 | Cardiac | ‐ | ‐ | ‐ | ‐ | ‐ | ‐ | ‐ | 72 |
| (Canada) | 62 | Cardiac | Elective | DDAVP: 38‐7b Placebo: 41.9b | ‐ | ‐ | ‐ | ‐ | ‐ | 18 blood loss 48 transfusion |
| (Turkey) | 20 | Cardiac | Emergency | 100b | ‐ | ‐ | ‐ | 0 | ‐ | 30 |
| (Turkey) | 34 | Cardiac | Emergency | 100b | ‐ | ‐ | ‐ | 100c | ‐ | 30 |
| (Turkey) | 28 | Cardiac | Emergency | 100b | ‐ | ‐ | ‐ | DDAVP: 0 TXA: 100c | ‐ | 30 |
| (USA) | 82 | Cardiac | Elective | ‐ | 0 | ‐ | ‐ | 0 | Yes | 12 |
| (USA) | 77 | Cardiac | Elective | ‐ | 0 | ‐ | ‐ | 100c | Yes | 12 |
| (USA) | 75 | Cardiac | Elective | ‐ | 0 | ‐ | ‐ | DDAVP: 0 TXA: 100c | Yes | 12 |
| (China) | 102 | Cardiac | Elective | ‐ | 0 | 0 | 0 | 100c | ‐ | 6 |
| (USA) | 36 | Orthopaedic | Elective | ‐ | 0 | ‐ | ‐ | ‐ | Yes | 24 |
| (USA) | 56 | Orthopaedic | Elective | ‐ | 0 | ‐ | ‐ | ‐ | Yes | 24 |
| (USA) | 35 | Cardiac | Elective | 0 | ‐ | ‐ | ‐ | ‐ | ‐ | 34 |
| (Finland) | 30 | Cardiac | Elective | 0 | 0 | ‐ | ‐ | ‐ | Yes | 16 |
| (USA) | 23 | Not reported | ‐ | ‐ | ‐ | ‐ | ‐ | ‐ | ‐ | ‐ |
| (South Korea) | 48 | Dialysis catheter | Elective | 100g | ‐ | ‐ | 0 | ‐ | ‐ | ‐ |
| (Finland) | 71 | Orthopaedic | Elective | 0 | 0 | 0 | ‐ | ‐ | Yes | 96 |
| (Sweden) | 50 | Vascular | Elective | 0 | 0 | 0 | ‐ | ‐ | Yes | ‐ |
| (Canada) | 30 | Orthopaedic | Elective | ‐ | ‐ | ‐ | ‐ | ‐ | ‐ | Intraoperative only |
| (Italy) | 162 | Kidney biopsy | Elective | 0 | 0 | ‐ | ‐ | ‐ | ‐ | 72 |
| (USA) | 65 | Cardiac | Elective | 0 | 0 | ‐ | ‐ | ‐ | Yes | 24 |
| (Netherlands) | 28 | Orthopaedic/Breast/Abdominal | Elective | 0 | 0 | 0 | 0 | ‐ | ‐ | 48 |
| (USA) | 86 | Cardiac | Elective | 0 | 0 | ‐ | ‐ | ‐ | Yes | 24 |
| (USA) | 29 | Cardiac | Elective | 100h | 0 | ‐ | ‐ | ‐ | Yes | 24 |
| (USA) | 60 | Paediatric cardiac | Elective | DDAVP: 9.7b Placebo: 3.4b | DDAVP: 6.5 Placebo: 6.9 | ‐ | ‐ | ‐ | No | 24 |
| (Turkey) | 66 | Cardiac | Elective | 0 | ‐ | 0 | ‐ | ‐ | Yes | 24 |
| (Norway) | 92 | Cardiac | Elective | 100b | 0 | 0 | 0 | DDAVP: 6.5c Placebo: 17.4c | Yes | 16 |
| (USA) | 27 | Cardiac | Elective | DDAVP: 28.6b Placebo: 38.5b | ‐ | 0 | 0 | ‐ | ‐ | 24 |
| (USA) | 95 | Paediatric cardiac | ‐ | ‐ | ‐ | ‐ | ‐ | ‐ | ‐ | 24 |
| (Spain) | 100 | Cardiac | Elective | ‐ | ‐ | 0 | 0 | ‐ | ‐ | 72 |
| (Spain) | 109 | Cardiac | Elective | ‐ | ‐ | 0 | 0 | DDAVP (1): 0 DDAVP (2): 0 Control: 0 Aprotinin: 100d | ‐ | 72 |
| (Finland) | 30 | Cardiac | Elective | 0 | 0 | 0 | ‐ | ‐ | Yes | 16 |
| (USA) | 70 | Cardiac | Elective | ‐ | ‐ | ‐ | ‐ | ‐ | ‐ | 24 |
| (Sweden) | 79 | Orthopaedic | Elective | 0 | 0 | 0 | 0 | ‐ | Yes | 24 |
| (Canada) | 60 | Paediatric cardiac | ‐ | ‐ | ‐ | ‐ | ‐ | ‐ | ‐ | 24 |
| (China) | 90 | Sinus | Elective | 0 | 0 | 0 | 0 | ‐ | ‐ | Intraoperative only |
| (Canada) | 44 | Cardiac | Elective | 100b | 0 | 0 | 0 | ‐ | ‐ | 24 |
| (UK) | 98 | Cardiac | Elective | DDAVP: 14.3b Placebo: 10.2b | 0 | ‐ | ‐ | ‐ | Yes | ˜24 |
| (Austria) | 43 | Cardiac | Elective | 100g | 0 | ‐ | ‐ | ‐ | Yes | 24 |
| (USA) | 83 | Cardiac | Elective | ‐ | ‐ | ‐ | ‐ | DDAVP: 20a Placebo: 30.2a | ‐ | 24 |
| (USA) | 21 | Orthopaedic | Elective | 0 | 0 | 0 | 0 | ‐ | Yes | 24 |
| (USA) | 23 | Plastic | Elective | ‐ | ‐ | ‐ | ‐ | ‐ | ‐ | 24 |
| (USA) | 21 | Plastic | Elective | ‐ | ‐ | ‐ | ‐ | ‐ | ‐ | 24 |
| (Hong Kong) | 59 | Hepatic | Elective | 0 | 0 | 0 | ‐ | ‐ | Yes | Intraoperative only |
| (Israel) | 40 | Orthopaedic | Elective | ‐ | 0 | ‐ | ‐ | DDAVP: 0 TXA: 100c | Yes | 12 |
| Blank cells indicate that information was not reported in the original papers | ||||||||||
| Trial | DDAVP dose(s) (μg/kg) | Timing of dose | Timing summary | Comparator(s) |
| Preoperative DDAVP | ||||
| 0.3 | Induction of anaesthesia | Preoperative | Placebo | |
| 0.3 (× 2) | At start of surgery and again after 6 hours | Preoperative | Placebo | |
| 0.3 (× 2) | At start of surgery and again after 6 hours | Preoperative | Placebo | |
| 10 μg/m2 | At time of first skin incision | Preoperative | Placebo | |
| 20 μg | 30 minutes preoperatively | Preoperative | Placebo | |
| 10 μg/m2 | Immediately after induction of anaesthesia | Preoperative | Placebo | |
| 0.3 | After anaesthetic induction | Preoperative | Placebo | |
| 0.3 | Not reported | Preoperative | Placebo | |
| 0.4 | At start of surgery | Preoperative | Placebo | |
| DDAVP 0.2 μg/kg | ||||
| 0.3 | Immediately before start of operation | Preoperative | Placebo | |
| 10 μg/m2 | Immediately after induction of anaesthesia | Preoperative | Placebo | |
| 0.3 | 1 hour before biopsy | Preoperative | Placebo | |
| 15 μg to 45 μg depending on weight | Not reported | Preoperative | Placebo | |
| 0.3 (× 2) | Post induction of anaesthesia and again after 6 hours | Preoperative | Placebo | |
| 0.3 | After induction of anaesthesia | Preoperative | Placebo | |
| 0.3 | After induction of anaesthesia | Preoperative | Placebo | |
| 0.3 | Not reported | Preoperative | Placebo | |
| 0.3 | After induction of anaesthesia | Preoperative | Placebo | |
| 0.3 | After induction of anaesthesia | Preoperative | Placebo | |
| 0.3 | After induction of anaesthesia | Preoperative | Placebo | |
| DDAVP administered at end of operation | ||||
| 0.3 | 15 minutes after reversal of heparin | End of operation | Placebo | |
| 0.3 | 15 minutes after reversal of heparin | End of operation | Placebo | |
| 0.3 | 15 minutes after reversal of heparin | End of operation | Placebo | |
| 0.3 | Immediately after reversal of heparin | End of operation | Placebo | |
| 0.3 | In event of excessive bleeding, after reversal of heparin | End of operation/postoperative | Placebo | |
| 0.3 | Immediately after reversal of heparin | End of operation | Placebo | |
| 0.3 | Immediately after reversal of heparin | End of operation | Placebo | |
| Aprotinina | ||||
| 0.3 | 60 minutes after reversal of heparin | End of operation | Placebo | |
| 20 μg | 15 minutes after heparinisation and before aortic cross‐clamp application | End of operation | Placebo | |
| 0.4 | Unclear | End of operation | Placebo | |
| 0.3 | 5 minutes after reversal of heparin | End of operation | Placebo | |
| 0.3 | Before removal of tourniquet | End of operation | Placebo | |
| Tranexamic acidb | ||||
| 0.3 | 5 minutes after reversal of heparin | End of operation | Placebo | |
| 0.3 | Immediately after reversal of heparin | End of operation | Placebo | |
| 0.3 | Immediately after reversal of heparin | End of operation | Placebo | |
| 0.3 | Immediately after surgery | End of operation | Placebo | |
| 0.3 | Immediately after reversal of heparin | End of operation | Placebo | |
| 0.3 | Immediately after reversal of heparin | End of operation | Placebo | |
| 0.3 | Immediately after reversal of heparin | End of operation | Placebo | |
| 0.3 | Immediately after reversal of heparin | End of operation | Tranexamic acidc | |
| 0.3 | Before cardiac rewarming | End of operation | Placebo | |
| 0.3 | 30 minutes before closure of wound | End of operation | Placebo | |
| 0.3 | 30 minutes before closure of wound | End of operation | Placebo | |
| 0.3 | Immediately after reversal of heparin | End of operation | Placebo | |
| DDAVP 0.3 μg/kg × 2 | ||||
| 0.3 | After reversal of heparin and before chest closure | End of operation | Placebo | |
| 0.3 | After reversal of heparin and before chest closure | End of operation | Placebo | |
| 0.3 | 10 minutes after reversal of heparin | End of operation | Placebo | |
| 0.3 | After reversal of heparin (timing unclear) | End of operation | Placebo | |
| 0.3 | Immediately after reversal of heparin | End of operation | Placebo | |
| 0.3 | 15 minutes after reversal of heparin | End of operation | Placebo | |
| 0.3 | 5 minutes after reversal of heparin | End of operation | Placebo | |
| 0.3 | Immediately after reversal of heparin | End of operation | Placebo | |
| 0.3 | Immediately after reversal of heparin | End of operation | Standard care | |
| Aprotinind | ||||
| DDAVP 0.3 μg/kg × 2 | ||||
| 0.3 | Via pulmonary artery catheter immediately after sternal closure | End of operation | Placebo | |
| 0.3 | Immediately after reversal of heparin | End of operation | Placebo | |
| 0.3 | After reversal of heparin (timing unclear) | End of operation | Placebo | |
| 10 μg/m2 | After reversal of heparin (timing unclear) | End of operation | Placebo | |
| 0.3 | After reversal of heparin (timing unclear) | End of operation | Placebo | |
| 0.3 | After reversal of heparin (timing unclear) | End of operation | Placebo | |
| 0.3 | 30 minutes before deflation of tourniquet | End of operation | Tranexamic acidb | |
| DDAVP administered postoperatively | ||||
| 0.3 | Between end of operation and 6 hours postoperatively | Postoperative | Placebo | |
| 0.3 | Immediately after sternal closure | Postoperative | Placebo | |
| Timing of DDAVP administration unclear | ||||
| 0.3 | Not reported | Not clear | Standard care | |
| 0.3 | Not reported | Not clear | Standard care | |
| 0.3 | Not reported | Not clear | Tranexamic acidc | |
| aAprotinin 2 million KIU in 200 mL preoperatively, 2 million KIU in 200 mL in fluid prime, 500,000 KIU in 50 mL/h from skin incision to skin closure Abbreviation KIU: kilounits | ||||
| Trial | Reason not included in meta‐analysis | DDAVP arm | Placebo arm |
| Orthopaedic surgery | |||
| Reported as mean (no standard deviation) | 0.3 units (n = 23) | 0.5 units (n = 24) | |
| Reported as mean (no standard deviation) | 4.6 units (n = 16) | 5.0 units (n = 14) | |
| Reported as median and range | 51.5 (24 to 98.6) mL/kg (n = 10) | 48.3 (24.5 to 96) mL/kg (n = 11) | |
| Trial | Reason not included in meta‐analysis | DDAVP arm | Placebo arm |
| Adult cardiac surgery | |||
| Reported as mL/kg (mean ± standard deviation) | 8.3 ± 5.6 mL/kg (n = 5) | 10.8 ± 6.3 mL/kg (n = 4) | |
| Reported as mL/kg (mean ± standard deviation) | 10.2 ± 6.4 mL/kg (n = 5) | 13.2 ± 6.6 mL/kg (n = 6) | |
| Reported as median (interquartile range) | 1.7 (2.3) units (n = 18) | 0.6 (1.3) units (n = 22) | |
| Reported as median (interquartile range) | 2 (1 to 4) units (n = 68) | 2 (1 to 3) units (n = 67) | |
| Reported as mean (no standard deviation) | 2.4 units (n = 15) | 2 units (n = 15) | |
| Reported as median (90% confidence interval) | 2 (1 to 8.5) units (n = 74) | 2 (1 to 9.8) units (n = 76) | |
| Reported as mean (range) | 1.3 (0 to 2) units (n = 15) | 1.1 (0 to 3) units (n = 15) | |
| Reported as median only | 2 units (n = 21) | 2 units (n = 22) | |
| Reported as mean only | 0.86 units (n = 44) | 1.79 units n = 42) | |
| Reported as mean only | 2.4 units (n = 13) | 2.2 units (n = 16) | |
| Reported as mL/m2 (mean ± standard deviation) | 740.4 ± 416.3 mL/m2 (n = 25) | 662.8 ± 380.7 mL/m2 (n = 28) | |
| Reported as mean only | 1.38 units (n = 49) | 1.30 units (n = 49) | |
| Orthopaedic surgery | |||
| Reported as mean only | 0.7 units (n = 10) | 1.1 units (n = 10) | |
| Reported as median and range | 64.8 (30.3 to 123.6) mL/kg (n = 10) | 64.9 (33.8 to 110) mL/kg (n = 11) | |
| Maxillofacial surgery | |||
| Reported as mean (no standard deviation) | 0.6 units (n = 10) | 0.9 units (n = 10) | |
| Trial | Reason not included in meta‐analysis | DDAVP arm | Placebo arm |
| Adult cardiac surgery | |||
| Reported as median (90% confidence interval) | 200 (0 to 1150) mL (n = 74) | 200 (0 to 1013) mL (n = 76) | |
| Reported as mL/m2 body surface area | 131 ± 106 mL/m2 (n = 50) | 193 ± 137 mL/m2 (n = 50) | |
| Paediatric cardiac surgery | |||
| Reported as mL/m2 | 49.3 ± 43.7 mL/m2 (n = 31) | 73.6 ± 71.1 mL/m2 (n = 29) | |
| Orthopaedic surgery | |||
| Reported as mean (no standard deviation) | 1200 mL (n = 23) | 1463 mL (n = 24) | |
| Hepatic surgery | |||
| Reported as median (range) | 832.5 (350 to 2955) mL (n = 30) | 800 mL (250 to 7128) mL (n = 29) | |
| Other surgery | |||
| Reported as mean and range | 251 (2 to 1330) mL (n = 14) | 504 (50 to 2100) mL (n = 14) | |
| Trial | Reason not included in meta‐analysis | DDAVP arm | Placebo arm |
| Adult cardiac surgery | |||
| Reported as mL/kg (mean ± standard deviation) | 8.0 ± 1.4 mL/kg (n = 5) | 5.9 ± 1.5 mL/kg (n = 4) | |
| Reported as mL/kg (mean ± standard deviation) | 11.3 ± 10 mL/kg (n = 5) | 7.5 ± 4 mL/kg (n = 6) | |
| Reported as median (interquartile range) | 950 (950) mL (n = 18) | 975 (811) mL (n = 22) | |
| Reported as median (interquartile range) | 575 (422.5 to 770) mL (n = 68) | 590 (476.25 to 1013.75) mL (n = 67) | |
| Reported as mL/m2 body surface area (mean ± standard deviation) | 400 ± 192 mL/m2 (n = 50) | 489 ± 361 mL/m2 (n = 51) | |
| Reported as mL/m2 body surface area (mean ± standard deviation) | 582 ± 410 mL/m2 (n = 44) | 465 ± 303 mL/m2 (n = 37) | |
| Reported as median (range) | 1000 (600 to 1800) mL (n = 19) | 1075 (400 to 1740) mL (n = 20) | |
| Reported as median (90% confidence interval) | 865 (358 to 2495) mL (n = 74) | 783 (300 to 2219) mL (n = 76) | |
| Reported as mL/m2 (mean ± standard deviation) | 258 ± 106 mL/m2 (n = 75) | 526 ± 314 mL/m2 (n = 75) | |
| Reported as mean (no standard deviation) | 1430 mL (n = 10) | 1767 mL (n = 10) | |
| Reported as mean (no standard deviation) | 574 mL (n = 16) | 535 mL (n = 18) | |
| Reported as median only | 1157 mL (n = 21) | 1180 mL (n = 22) | |
| Reported as mL/m2 body surface area (mean ± standard deviation) | 458 ± 206 mL/m2 (n = 50) | 536 ± 304 mL/m2 (n = 50) | |
| Reported as mL/m2 body surface area (mean ± standard deviation) | 551.8 ± 324.1 mL/m2 (n = 28) | 438.7 ± 228.1 mL/m2 (n = 25) | |
| Reported as median (range) | 1020 (530 to 1155) mL (n = 15) | 1100 (425 to 1720) mL (n = 15) | |
| Orthopaedic surgery | |||
| Reported as mean (no standard deviation) | 1320 mL (n = 6) | 1380 mL (n = 6) | |
| Reported as estimated percentage blood loss: median (range) | 147.8% (57% to 428.8%) (n = 10) | 111.2% (65% to 239.5%) (n = 11) | |
| Maxillofacial surgery | |||
| Reported as mean (range) | 675 (380 to 1330) mL (n = 10) | 819 (200 to 1600) mL (n = 10) | |
| Trial | Reason not included in meta‐analysis | DDAVP arm | Tranexamic acid arm |
| Orthopaedic surgery | |||
| Reported as mean only | 0.7 units (n = 10) | 0.1 units (n = 10) | |
| Trial | Reason not included in meta‐analysis | DDAVP arm | Tranexamic acid arm |
| Adult cardiac surgery | |||
| Reported as mean (no standard deviation) | 1430 mL (n = 10) | 535 mL (n = 18) | |
| Trial | Reason not included in meta‐analysis | DDAVP arm | Aprotinin arm |
| Adult cardiac surgery | |||
| Reported as mL/m2 body surface area (mean ± standard deviation) | 740.4 ± 416.3 mL/m2 (n = 25) | 366.1 ± 331.9 mL/m2 (n = 28) | |
| Trial | Reason not included in meta‐analysis | DDAVP arm | Aprotinin arm |
| Adult cardiac surgery | |||
| Reported as mL/m2 body surface area (mean ± standard deviation) | 400 ± 192 mL/m2 (n = 50) | 195 ± 146 mL/m2 (n = 48) | |
| Reported as mL/m2 body surface area (mean ± standard deviation) | 551.8 ± 324.1 mL/m2 (n = 25) | 358.5 ± 156.3 mL/m2 (n = 28) | |
| Outcome or subgroup title | No. of studies | No. of participants | Statistical method | Effect size |
| 1 Red cell volume transfused (intraoperatively) Show forest plot | 7 | Mean Difference (IV, Random, 95% CI) | Subtotals only | |
| 1.1 Adult cardiac surgery | 1 | 19 | Mean Difference (IV, Random, 95% CI) | ‐0.10 [‐1.22, 1.02] |
| 1.2 Paediatric cardiac surgery | 1 | 60 | Mean Difference (IV, Random, 95% CI) | 0.40 [‐0.87, 1.67] |
| 1.3 Orthopaedic surgery | 3 | 144 | Mean Difference (IV, Random, 95% CI) | ‐0.50 [‐0.89, ‐0.11] |
| 1.4 Vascular surgery | 1 | 44 | Mean Difference (IV, Random, 95% CI) | ‐1.20 [‐2.55, 0.15] |
| 1.5 Plastic surgery | 1 | 23 | Mean Difference (IV, Random, 95% CI) | ‐0.75 [‐1.23, ‐0.27] |
| 2 Red cell volume transfused (total) Show forest plot | 23 | Mean Difference (IV, Random, 95% CI) | Subtotals only | |
| 2.1 Cardiac surgery | 14 | 957 | Mean Difference (IV, Random, 95% CI) | ‐0.52 [‐0.96, ‐0.08] |
| 2.2 Orthopaedic surgery | 6 | 303 | Mean Difference (IV, Random, 95% CI) | ‐0.02 [‐0.67, 0.64] |
| 2.3 Vascular surgery | 2 | 135 | Mean Difference (IV, Random, 95% CI) | 0.06 [‐0.60, 0.73] |
| 2.4 Hepatic surgery | 1 | 59 | Mean Difference (IV, Random, 95% CI) | ‐0.47 [‐1.27, 0.33] |
| 3 Red cell volume transfused (children only, total) Show forest plot | 1 | Mean Difference (IV, Random, 95% CI) | Subtotals only | |
| 4 Number of participants receiving a red cell transfusion (intraoperatively) Show forest plot | 6 | 349 | Risk Ratio (M‐H, Random, 95% CI) | 0.74 [0.50, 1.09] |
| 4.1 Cardiac surgery | 2 | 115 | Risk Ratio (M‐H, Random, 95% CI) | 0.68 [0.43, 1.10] |
| 4.2 Plastic surgery | 2 | 44 | Risk Ratio (M‐H, Random, 95% CI) | 0.86 [0.45, 1.64] |
| 4.3 Kidney biopsy | 1 | 162 | Risk Ratio (M‐H, Random, 95% CI) | 0.0 [0.0, 0.0] |
| 4.4 Other | 1 | 28 | Risk Ratio (M‐H, Random, 95% CI) | 0.0 [0.0, 0.0] |
| 5 Number of participants receiving a red cell transfusion (total) Show forest plot | 25 | 1806 | Risk Ratio (M‐H, Random, 95% CI) | 0.96 [0.86, 1.06] |
| 5.1 Cardiac surgery | 17 | 1350 | Risk Ratio (M‐H, Random, 95% CI) | 0.93 [0.82, 1.06] |
| 5.2 Orthopaedic surgery | 1 | 20 | Risk Ratio (M‐H, Random, 95% CI) | 0.86 [0.45, 1.64] |
| 5.3 Vascular surgery | 1 | 91 | Risk Ratio (M‐H, Random, 95% CI) | 1.05 [0.83, 1.34] |
| 5.4 Paediatric cardiac surgery | 1 | 60 | Risk Ratio (M‐H, Random, 95% CI) | 1.17 [0.66, 2.06] |
| 5.5 Plastic surgery | 2 | 44 | Risk Ratio (M‐H, Random, 95% CI) | 0.86 [0.45, 1.64] |
| 5.6 Hepatic surgery | 1 | 59 | Risk Ratio (M‐H, Random, 95% CI) | 0.58 [0.15, 2.21] |
| 5.7 Kidney biopsy | 1 | 162 | Risk Ratio (M‐H, Random, 95% CI) | 0.0 [0.0, 0.0] |
| 5.8 Maxillofacial surgery | 1 | 20 | Risk Ratio (M‐H, Random, 95% CI) | 2.0 [0.88, 4.54] |
| 6 Blood loss (intraoperative) Show forest plot | 11 | Mean Difference (IV, Random, 95% CI) | Subtotals only | |
| 6.1 Cardiac surgery | 2 | 87 | Mean Difference (IV, Random, 95% CI) | ‐138.20 [‐623.40, 347.01] |
| 6.2 Orthopaedic surgery | 5 | 224 | Mean Difference (IV, Random, 95% CI) | ‐118.24 [‐278.43, 41.95] |
| 6.3 Vascular surgery | 1 | 44 | Mean Difference (IV, Random, 95% CI) | ‐525.0 [‐1177.34, 127.34] |
| 6.4 Sinus surgery | 1 | 90 | Mean Difference (IV, Random, 95% CI) | ‐28.0 [‐31.70, ‐24.30] |
| 6.5 Plastic surgery | 2 | 44 | Mean Difference (IV, Random, 95% CI) | ‐146.02 [‐487.86, 195.83] |
| 7 Blood loss (total) Show forest plot | 28 | Mean Difference (IV, Random, 95% CI) | Subtotals only | |
| 7.1 Adult cardiac surgery | 22 | 1358 | Mean Difference (IV, Random, 95% CI) | ‐135.24 [‐210.80, ‐59.68] |
| 7.2 Orthopaedic surgery | 5 | 241 | Mean Difference (IV, Random, 95% CI) | ‐285.76 [‐514.99, ‐56.53] |
| 7.3 Vascular surgery | 1 | 44 | Mean Difference (IV, Random, 95% CI) | ‐582.0 [‐1264.07, 100.07] |
| 8 Blood loss (children only, total) Show forest plot | 2 | Mean Difference (IV, Random, 95% CI) | Subtotals only | |
| 8.1 Paediatric cardiac surgery | 2 | 155 | Mean Difference (IV, Random, 95% CI) | 1.11 [‐12.92, 15.15] |
| 9 Number of participants with any bleeding (intraoperatively) Show forest plot | 1 | Risk Ratio (M‐H, Random, 95% CI) | Totals not selected | |
| 9.1 Dialysis catheter | 1 | Risk Ratio (M‐H, Random, 95% CI) | 0.0 [0.0, 0.0] | |
| 10 Number of participants with any bleeding (total) Show forest plot | 1 | Risk Ratio (M‐H, Random, 95% CI) | Totals not selected | |
| 10.1 Kidney biopsy | 1 | Risk Ratio (M‐H, Random, 95% CI) | 0.0 [0.0, 0.0] | |
| 11 Reoperation due to bleeding Show forest plot | 23 | 1783 | Peto Odds Ratio (Peto, Fixed, 95% CI) | 0.66 [0.40, 1.09] |
| 11.1 Cardiac surgery | 19 | 1483 | Peto Odds Ratio (Peto, Fixed, 95% CI) | 0.64 [0.38, 1.05] |
| 11.2 Orthopaedic surgery | 1 | 30 | Peto Odds Ratio (Peto, Fixed, 95% CI) | 0.0 [0.0, 0.0] |
| 11.3 Paediatric cardiac surgery | 1 | 60 | Peto Odds Ratio (Peto, Fixed, 95% CI) | 6.93 [0.14, 349.88] |
| 11.4 Dialysis catheter insertion | 1 | 48 | Peto Odds Ratio (Peto, Fixed, 95% CI) | 0.0 [0.0, 0.0] |
| 11.5 Kidney biopsy | 1 | 162 | Peto Odds Ratio (Peto, Fixed, 95% CI) | 0.0 [0.0, 0.0] |
| 12 All‐cause mortality Show forest plot | 22 | 1631 | Peto Odds Ratio (Peto, Fixed, 95% CI) | 1.09 [0.51, 2.34] |
| 12.1 Cardiac surgery | 16 | 1239 | Peto Odds Ratio (Peto, Fixed, 95% CI) | 1.09 [0.48, 2.51] |
| 12.2 Orthopaedic surgery | 3 | 171 | Peto Odds Ratio (Peto, Fixed, 95% CI) | 0.0 [0.0, 0.0] |
| 12.3 Vascular surgery | 1 | 91 | Peto Odds Ratio (Peto, Fixed, 95% CI) | 8.50 [0.52, 138.60] |
| 12.4 Paediatric cardiac surgery | 2 | 130 | Peto Odds Ratio (Peto, Fixed, 95% CI) | 0.13 [0.01, 2.14] |
| 13 All thrombotic events (including myocardial infarction, ischaemic stroke, other arterial thromboembolism, and venous thromboembolism) Show forest plot | 29 | 1984 | Peto Odds Ratio (Peto, Fixed, 95% CI) | 1.36 [0.85, 2.16] |
| 13.1 Cardiac surgery | 19 | 1311 | Peto Odds Ratio (Peto, Fixed, 95% CI) | 1.46 [0.88, 2.42] |
| 13.2 Orthopaedic surgery | 6 | 280 | Peto Odds Ratio (Peto, Fixed, 95% CI) | 7.21 [0.14, 363.30] |
| 13.3 Vascular surgery | 2 | 141 | Peto Odds Ratio (Peto, Fixed, 95% CI) | 0.77 [0.23, 2.60] |
| 13.4 Sinus surgery | 1 | 90 | Peto Odds Ratio (Peto, Fixed, 95% CI) | 0.0 [0.0, 0.0] |
| 13.5 Kidney biopsy | 1 | 162 | Peto Odds Ratio (Peto, Fixed, 95% CI) | 0.0 [0.0, 0.0] |
| 14 Myocardial infarction Show forest plot | 26 | 1704 | Peto Odds Ratio (Peto, Fixed, 95% CI) | 1.32 [0.70, 2.46] |
| 14.1 Cardiac surgery | 16 | 1031 | Peto Odds Ratio (Peto, Fixed, 95% CI) | 1.52 [0.77, 3.00] |
| 14.2 Orthopaedic surgery | 6 | 280 | Peto Odds Ratio (Peto, Fixed, 95% CI) | 0.0 [0.0, 0.0] |
| 14.3 Vascular surgery | 2 | 141 | Peto Odds Ratio (Peto, Fixed, 95% CI) | 0.55 [0.11, 2.88] |
| 14.4 Kidney biopsy | 1 | 162 | Peto Odds Ratio (Peto, Fixed, 95% CI) | 0.0 [0.0, 0.0] |
| 14.5 Sinus surgery | 1 | 90 | Peto Odds Ratio (Peto, Fixed, 95% CI) | 0.0 [0.0, 0.0] |
| 15 Stroke Show forest plot | 19 | 1277 | Peto Odds Ratio (Peto, Fixed, 95% CI) | 2.95 [0.94, 9.24] |
| 15.1 Cardiac surgery | 11 | 733 | Peto Odds Ratio (Peto, Fixed, 95% CI) | 2.95 [0.94, 9.24] |
| 15.2 Orthopaedic surgery | 5 | 201 | Peto Odds Ratio (Peto, Fixed, 95% CI) | 0.0 [0.0, 0.0] |
| 15.3 Vascular surgery | 1 | 91 | Peto Odds Ratio (Peto, Fixed, 95% CI) | 0.0 [0.0, 0.0] |
| 15.4 Kidney biopsy | 1 | 162 | Peto Odds Ratio (Peto, Fixed, 95% CI) | 0.0 [0.0, 0.0] |
| 15.5 Sinus surgery | 1 | 90 | Peto Odds Ratio (Peto, Fixed, 95% CI) | 0.0 [0.0, 0.0] |
| 16 Venous thromboembolism Show forest plot | 20 | 1377 | Peto Odds Ratio (Peto, Fixed, 95% CI) | 0.77 [0.17, 3.38] |
| 16.1 Cardiac surgery | 11 | 754 | Peto Odds Ratio (Peto, Fixed, 95% CI) | 0.53 [0.11, 2.62] |
| 16.2 Orthopaedic surgery | 6 | 280 | Peto Odds Ratio (Peto, Fixed, 95% CI) | 7.21 [0.14, 363.30] |
| 16.3 Vascular surgery | 1 | 91 | Peto Odds Ratio (Peto, Fixed, 95% CI) | 0.0 [0.0, 0.0] |
| 16.4 Kidney biopsy | 1 | 162 | Peto Odds Ratio (Peto, Fixed, 95% CI) | 0.0 [0.0, 0.0] |
| 16.5 Sinus surgery | 1 | 90 | Peto Odds Ratio (Peto, Fixed, 95% CI) | 0.0 [0.0, 0.0] |
| 17 Clinically important hypotension Show forest plot | 18 | 1183 | Risk Ratio (M‐H, Random, 95% CI) | 2.32 [1.37, 3.91] |
| 17.1 Cardiac surgery | 13 | 762 | Risk Ratio (M‐H, Random, 95% CI) | 2.88 [1.32, 6.30] |
| 17.2 Orthopaedic surgery | 2 | 109 | Risk Ratio (M‐H, Random, 95% CI) | 2.05 [0.99, 4.24] |
| 17.3 Paediatric cardiac surgery | 1 | 60 | Risk Ratio (M‐H, Random, 95% CI) | 0.94 [0.06, 14.27] |
| 17.4 Sinus surgery | 1 | 90 | Risk Ratio (M‐H, Random, 95% CI) | 0.0 [0.0, 0.0] |
| 17.5 Kidney biopsy | 1 | 162 | Risk Ratio (M‐H, Random, 95% CI) | 0.0 [0.0, 0.0] |
| Outcome or subgroup title | No. of studies | No. of participants | Statistical method | Effect size |
| 1 Red cell volume transfused (total) Show forest plot | 6 | 388 | Mean Difference (IV, Random, 95% CI) | ‐0.65 [‐1.16, ‐0.13] |
| 2 Number of participants receiving a red cell transfusion (intraoperatively) Show forest plot | 1 | Risk Ratio (M‐H, Random, 95% CI) | Subtotals only | |
| 3 Number of participants receiving a red cell transfusion (total) Show forest plot | 5 | 258 | Risk Ratio (M‐H, Random, 95% CI) | 0.83 [0.66, 1.04] |
| 4 Blood loss (total) Show forest plot | 7 | 422 | Mean Difference (IV, Random, 95% CI) | ‐253.93 [‐408.01, ‐99.85] |
| 5 Reoperation due to bleeding Show forest plot | 6 | 413 | Peto Odds Ratio (Peto, Fixed, 95% CI) | 0.39 [0.18, 0.84] |
| 6 All‐cause mortality Show forest plot | 7 | 422 | Peto Odds Ratio (Peto, Fixed, 95% CI) | 0.72 [0.12, 4.22] |
| 7 All thrombotic events (including myocardial infarction, ischaemic stroke, other arterial thromboembolism, and venous thromboembolism) Show forest plot | 7 | 422 | Peto Odds Ratio (Peto, Fixed, 95% CI) | 1.58 [0.60, 4.17] |
| 8 Myocardial infarction Show forest plot | 5 | 277 | Peto Odds Ratio (Peto, Fixed, 95% CI) | 2.72 [0.60, 12.37] |
| 9 Stroke Show forest plot | 3 | Peto Odds Ratio (Peto, Fixed, 95% CI) | Subtotals only | |
| 10 Venous thromboembolism Show forest plot | 4 | 248 | Peto Odds Ratio (Peto, Fixed, 95% CI) | 0.56 [0.06, 5.50] |
| 11 Clinically important hypotension Show forest plot | 5 | 315 | Risk Ratio (M‐H, Random, 95% CI) | 6.58 [1.18, 36.76] |
| Outcome or subgroup title | No. of studies | No. of participants | Statistical method | Effect size |
| 1 Red cell volume transfused (total) Show forest plot | 1 | Mean Difference (IV, Random, 95% CI) | Totals not selected | |
| 1.1 Orthopaedic surgery | 1 | Mean Difference (IV, Random, 95% CI) | 0.0 [0.0, 0.0] | |
| 2 Number of participants receiving a red cell transfusion (total) Show forest plot | 3 | 135 | Risk Ratio (M‐H, Random, 95% CI) | 2.42 [1.04, 5.64] |
| 2.1 Cardiac surgery | 1 | 75 | Risk Ratio (M‐H, Random, 95% CI) | 1.46 [0.82, 2.59] |
| 2.2 Orthopaedic surgery | 2 | 60 | Risk Ratio (M‐H, Random, 95% CI) | 4.15 [1.58, 10.90] |
| 3 Blood loss (total) Show forest plot | 2 | 115 | Mean Difference (IV, Random, 95% CI) | 142.81 [79.78, 205.84] |
| 3.1 Cardiac surgery | 1 | 75 | Mean Difference (IV, Random, 95% CI) | 115.0 [35.38, 194.62] |
| 3.2 Orthopaedic surgery | 1 | 40 | Mean Difference (IV, Random, 95% CI) | 180.0 [86.82, 273.18] |
| 4 Reoperation due to bleeding Show forest plot | 1 | Peto Odds Ratio (Peto, Fixed, 95% CI) | Totals not selected | |
| 4.1 Cardiac surgery | 1 | Peto Odds Ratio (Peto, Fixed, 95% CI) | 0.0 [0.0, 0.0] | |
| 5 All thrombotic events (including myocardial infarction, ischaemic stroke, other arterial thromboembolism, and venous thromboembolism) Show forest plot | 2 | Risk Ratio (M‐H, Random, 95% CI) | Totals not selected | |
| 5.1 Cardiac surgery | 1 | Risk Ratio (M‐H, Random, 95% CI) | 0.0 [0.0, 0.0] | |
| 5.2 Orthopaedic surgery | 1 | Risk Ratio (M‐H, Random, 95% CI) | 0.0 [0.0, 0.0] | |
| 6 Myocardial infarction Show forest plot | 2 | 115 | Risk Ratio (M‐H, Random, 95% CI) | 0.0 [0.0, 0.0] |
| 6.1 Cardiac surgery | 1 | 75 | Risk Ratio (M‐H, Random, 95% CI) | 0.0 [0.0, 0.0] |
| 6.2 Orthopaedic surgery | 1 | 40 | Risk Ratio (M‐H, Random, 95% CI) | 0.0 [0.0, 0.0] |
| 7 Stroke Show forest plot | 2 | Risk Ratio (M‐H, Random, 95% CI) | Totals not selected | |
| 7.1 Cardiac surgery | 1 | Risk Ratio (M‐H, Random, 95% CI) | 0.0 [0.0, 0.0] | |
| 7.2 Orthopaedic surgery | 1 | Risk Ratio (M‐H, Random, 95% CI) | 0.0 [0.0, 0.0] | |
| 8 Venous thromboembolism Show forest plot | 2 | 115 | Risk Ratio (M‐H, Random, 95% CI) | 0.0 [0.0, 0.0] |
| 8.1 Cardiac surgery | 1 | 75 | Risk Ratio (M‐H, Random, 95% CI) | 0.0 [0.0, 0.0] |
| 8.2 Orthopaedic surgery | 1 | 40 | Risk Ratio (M‐H, Random, 95% CI) | 0.0 [0.0, 0.0] |
| Outcome or subgroup title | No. of studies | No. of participants | Statistical method | Effect size |
| 1 Number of participants receiving a red cell transfusion (total) Show forest plot | 1 | Risk Ratio (M‐H, Random, 95% CI) | Totals not selected | |
| 1.1 Cardiac surgery | 1 | Risk Ratio (M‐H, Random, 95% CI) | 0.0 [0.0, 0.0] | |
| 2 Reoperation due to bleeding Show forest plot | 2 | Peto Odds Ratio (Peto, Fixed, 95% CI) | Totals not selected | |
| 2.1 Cardiac surgery | 2 | Peto Odds Ratio (Peto, Fixed, 95% CI) | 0.0 [0.0, 0.0] | |
| 3 All‐cause mortality Show forest plot | 1 | 53 | Peto Odds Ratio (Peto, Fixed, 95% CI) | 0.0 [0.0, 0.0] |
| 3.1 Cardiac surgery | 1 | 53 | Peto Odds Ratio (Peto, Fixed, 95% CI) | 0.0 [0.0, 0.0] |
| 4 All thrombotic events (including myocardial infarction, ischaemic stroke, other arterial thromboembolism, and venous thromboembolism) Show forest plot | 2 | Peto Odds Ratio (Peto, Fixed, 95% CI) | Totals not selected | |
| 4.1 Cardiac surgery | 2 | Peto Odds Ratio (Peto, Fixed, 95% CI) | 0.0 [0.0, 0.0] | |
| 5 Myocardial infarction Show forest plot | 2 | 152 | Peto Odds Ratio (Peto, Fixed, 95% CI) | 0.0 [0.0, 0.0] |
| 5.1 Cardiac surgery | 2 | 152 | Peto Odds Ratio (Peto, Fixed, 95% CI) | 0.0 [0.0, 0.0] |
| 6 Stroke Show forest plot | 2 | Peto Odds Ratio (Peto, Fixed, 95% CI) | Totals not selected | |
| 6.1 Cardiac surgery | 2 | Peto Odds Ratio (Peto, Fixed, 95% CI) | 0.0 [0.0, 0.0] | |
| 7 Venous thromboembolism Show forest plot | 2 | 152 | Peto Odds Ratio (Peto, Fixed, 95% CI) | 0.0 [0.0, 0.0] |
| 7.1 Cardiac surgery | 2 | 152 | Peto Odds Ratio (Peto, Fixed, 95% CI) | 0.0 [0.0, 0.0] |
| 8 Clinically significant hypotension Show forest plot | 1 | 53 | Peto Odds Ratio (Peto, Fixed, 95% CI) | 0.0 [0.0, 0.0] |
| 8.1 Cardiac surgery | 1 | 53 | Peto Odds Ratio (Peto, Fixed, 95% CI) | 0.0 [0.0, 0.0] |