Intervenciones farmacológicas para reducir la pérdida sanguínea y la necesidad de transfusión de sangre en la resección hepática
Referencias
Referencias de los estudios incluidos en esta revisión
Ir a:
Referencias adicionales
Ir a:
Characteristics of studies
Characteristics of included studies [ordered by study ID]
| Methods | Randomised clinical trial Sequence generation: adequate. | |
| Participants | Country: France. Inclusion criteria:
Exclusion criteria:
| |
| Interventions | Participants were randomly assigned to two groups. Group 1: Aprotinin (n = 48). Further details of intervention: Other details: | |
| Outcomes | The outcome measures were mortality, survival (one year survival and 28 months survival in patients with colorectal liver metastases), peri‐operative morbidity, transfusion requirements, blood loss and liver function tests. | |
| Notes | 12 patients from both groups (individual groups not stated) in whom tumour could not be removed (n = 6), had wrong operative histological assessment (n = 5), and thoracotomy (n = 1) were excluded from analysis. Attempts to contact the authors in November 2008 were unsuccessful. | |
| Risk of bias | ||
| Bias | Authors' judgement | Support for judgement |
| Adequate sequence generation? | Low risk | Quote: "Adult patients scheduled for elective liver resection performed through abdominal incision were assigned in a double‐blind fashion, by means of a computer‐generated random code ....." |
| Allocation concealment? | Unclear risk | Unclear. |
| Blinding? | Low risk | Quote: "Adult patients scheduled for elective liver resection performed through abdominal incision were assigned in a double‐blind fashion ....."; "An identical‐appearing placebo was prepared by a nurse not involved in latter assessment." |
| Incomplete outcome data addressed? | High risk | Comment: There were 12 post‐randomisation drop‐outs. The reasons for these drop‐outs could be related to the treatment effect. |
| Free of selective reporting? | High risk | Comment: Important outcomes such as liver failure were not reported. |
| Free of baseline imbalance? | Unclear risk | Unclear. |
| Free of early stopping bias? | Low risk | Comment: The trialists recruited the intended number of patients. |
| Free of academic bias? | Low risk | Comment: There were no previously published trials of same comparisons by the author. |
| Free of sponsor bias? | High risk | Quote: "This study was conducted independently of, but partially supported |
| Methods | Randomised clinical trial Sequence generation: adequate. | |
| Participants | Country: France, Germany, Spain, United Kingdom. Inclusion criteria:
Exclusion criteria:
| |
| Interventions | Participants were randomly assigned to three groups. Group 1: rFVIIa 80 mcg/kg (n = 59). Further details of intervention: Other details: | |
| Outcomes | The outcome measures were mortality, transfusion requirements, peri‐operative morbidity, operating time, and blood loss. | |
| Notes | 19 patients from all three groups (individual groups not stated) in whom drug was not administered (n = 4) and in those who did not undergo liver resection after the drug was administered (n = 15) were excluded from analysis. Attempts to contact the authors in November 2008 were unsuccessful. | |
| Risk of bias | ||
| Bias | Authors' judgement | Support for judgement |
| Adequate sequence generation? | Low risk | Quote: "Randomization was computer‐generated and was performed after patient eligibility assessments on the day of surgery by means of a central interactive voice response system set up by Novo Nordisk A/S." |
| Allocation concealment? | Low risk | Quote: "Randomization was computer‐generated and was performed after patient eligibility assessments on the day of surgery by means of a central interactive voice response system set up by Novo Nordisk A/S." |
| Blinding? | Low risk | Quote: "To maintain blinding, an equal volume of trial drug per body weight was administered to all patients, irrespective of treatment group allocation." |
| Incomplete outcome data addressed? | High risk | Comment: 19 patients were excluded post‐randomisation. This could be related to the treatment effect. |
| Free of selective reporting? | High risk | Comment: Important outcomes such as liver failure were not reported. |
| Free of baseline imbalance? | Low risk | Yes. |
| Free of early stopping bias? | Low risk | Comment: The trialists recruited the intended number of patients. |
| Free of academic bias? | Low risk | Comment: There were no previously published trials of same comparisons by the author. |
| Free of sponsor bias? | High risk | Quote: "The authors thank the patients and the hospital staff participating in the trial, as well as Allan Blemings, M.Sc. (Statistician), and Karsten Soendergaard, M.Sc. |
| Methods | Randomised clinical trial Sequence generation: unclear. | |
| Participants | Country: China, Thailand, Taiwan. Inclusion criteria:
Exclusion criteria:
| |
| Interventions | Participants were randomly assigned to three groups. Group 1: rFVIIa 100 mcg/kg (n = 74). Further details of intervention: Other details: | |
| Outcomes | The outcome measures were mortality, transfusion requirements, peri‐operative morbidity, operating time, and blood loss. | |
| Notes | 12 patients from all three groups (individual groups not stated) who did not undergo liver resection (n = 11) and who withdrew consent (n = 1) were excluded from analysis. The data of 2 patients in the placebo group were lost. Thus only 221 patients were included for analysis. Attempts to contact the authors in November 2008 were unsuccessful. | |
| Risk of bias | ||
| Bias | Authors' judgement | Support for judgement |
| Adequate sequence generation? | Unclear risk | Unclear. |
| Allocation concealment? | Unclear risk | Unclear. |
| Blinding? | Low risk | Quote: "Within 10 minutes before the first skin cut, a bolus dose of rFVIIa 50 or 100 g/kg or placebo was administered intravenously over the course of 2 minutes...." |
| Incomplete outcome data addressed? | High risk | Comment: 14 patients were excluded post‐randomisation. This could be related to the treatment effect. |
| Free of selective reporting? | High risk | Comment: Important outcomes such as liver failure were not reported. |
| Free of baseline imbalance? | Unclear risk | Unclear. |
| Free of early stopping bias? | Low risk | Comment: The trialists recruited the intended number of patients. |
| Free of academic bias? | Low risk | Comment: There were no previously published trials of same comparisons by the author. |
| Free of sponsor bias? | Unclear risk | Unclear. |
| Methods | Randomised clinical trial Sequence generation: unclear. | |
| Participants | Country: Japan. Inclusion criteria:
| |
| Interventions | Participants were randomly assigned to two groups. Group 1: antithrombin (n = 13). Further details of intervention Other details: | |
| Outcomes | The outcome measures were liver failure, transfusion requirements, peri‐operative morbidity, operating time, blood loss, and liver function tests. | |
| Notes | Attempts to contact the authors in November 2008 were unsuccessful. | |
| Risk of bias | ||
| Bias | Authors' judgement | Support for judgement |
| Adequate sequence generation? | Unclear risk | Unclear. |
| Allocation concealment? | Unclear risk | Unclear. |
| Blinding? | High risk | No. |
| Incomplete outcome data addressed? | Unclear risk | Unclear. |
| Free of selective reporting? | High risk | Comment: Important outcomes such as mortality were not reported. |
| Free of baseline imbalance? | High risk | Comment: There was statisitically significantly more patients with cirrhosis in the intervention group. |
| Free of early stopping bias? | Unclear risk | Unclear. |
| Free of academic bias? | Low risk | Comment: There were no previously published trials of same comparisons by the author. |
| Free of sponsor bias? | Unclear risk | Unclear. |
| Methods | Randomised clinical trial Sequence generation: unclear. | |
| Participants | Country: China. Inclusion criteria: Exclusion criteria
| |
| Interventions | Participants were randomly assigned to two groups. Group 1: desmopressin (n = 30). Further details of intervention: Other details: | |
| Outcomes | The outcome measures were transfusion requirements, operating time, and blood loss. | |
| Notes | Attempts to contact the authors in November 2008 were unsuccessful. | |
| Risk of bias | ||
| Bias | Authors' judgement | Support for judgement |
| Adequate sequence generation? | Unclear risk | Unclear. |
| Allocation concealment? | Unclear risk | Quote: "Patient randomization was by drawing a sealed envelope specifying a prescription for either desmopressin or placebo...." Comment: It is not clear whether the authors used opaque envelopes. |
| Blinding? | Low risk | Quote: "Patient randomization was by drawing a sealed envelope specifying a prescription for either desmopressin or placebo, which was then prepared by an |
| Incomplete outcome data addressed? | Low risk | Comment: There were no post‐randomisation drop‐outs. |
| Free of selective reporting? | High risk | Comment: Important outcomes such as liver failure were not reported. |
| Free of baseline imbalance? | Unclear risk | Unclear. |
| Free of early stopping bias? | Unclear risk | Unclear. |
| Free of academic bias? | Low risk | Comment: There were no previously published trials of same comparisons by the author. |
| Free of sponsor bias? | Low risk | Quote: "This study was supported by a Hong Kong University CRCG grant (10202115/20013/20100/323/01)." |
| Methods | Randomised clinical trial Sequence generation: adequate. | |
| Participants | Country: China. Inclusion criteria: Exclusion criteria:
| |
| Interventions | Participants were randomly assigned to two groups. Group 1: tranexamic acid (n = 108). Further details of intervention: Other details: | |
| Outcomes | The outcome measures were mortality, transfusion requirements, operating time, hospital stay, and blood loss. | |
| Notes | 1 patient from intervention group and 2 patients from control group in whom liver resection was not completed because of presence of peritoneal dissemination or because the tumours were present in both lobes of the liver were excluded from analysis. Authors replied to questions related to methodological quality and mortality in November 2008. | |
| Risk of bias | ||
| Bias | Authors' judgement | Support for judgement |
| Adequate sequence generation? | Low risk | Quote: "The random sequence was made by random number table." (author replies) |
| Allocation concealment? | Unclear risk | Quote: "The randomization was double‐blinded in a sealed envelope." Comment: It is not clear whether the authors used opaque envelopes. |
| Blinding? | Low risk | Quote: "...a similar volume of normal saline was used as a placebo at the same |
| Incomplete outcome data addressed? | High risk | Comment: 3 patients were excluded post‐randomisation. The outcomes could be measured and reported in these patients. But these were not reported. |
| Free of selective reporting? | High risk | Comment: Important outcomes such as liver failure were not reported. |
| Free of baseline imbalance? | Low risk | Yes. |
| Free of early stopping bias? | Unclear risk | Unclear. |
| Free of academic bias? | Low risk | Comment: There were no previously published trials of same comparisons by the author. |
| Free of sponsor bias? | Low risk | Quote: "Supported in part by a grant from National Science Council, Taiwan (No. |
CUSA = cavitron ultrasonic surgical aspirator
CVP = central venous pressure
MAP = mean arterial pressure
PTC = portal triad clamping
Data and analyses
| Outcome or subgroup title | No. of studies | No. of participants | Statistical method | Effect size | ||||||||||||||||||||
| 1 Mortality Show forest plot | 4 | Risk Ratio (M‐H, Fixed, 95% CI) | Subtotals only | |||||||||||||||||||||
| Analysis 1.1  Comparison 1 Intervention versus control, Outcome 1 Mortality. | ||||||||||||||||||||||||
| 1.1 Aprotinin versus control | 1 | 37 | Risk Ratio (M‐H, Fixed, 95% CI) | 1.18 [0.18, 7.48] | ||||||||||||||||||||
| 1.2 Tranexamic acid versus control | 1 | 217 | Risk Ratio (M‐H, Fixed, 95% CI) | 0.0 [0.0, 0.0] | ||||||||||||||||||||
| 1.3 Recombinant VIIa (rFVIIa) high dose (80 to 100 mcg/kg) versus control | 2 | 272 | Risk Ratio (M‐H, Fixed, 95% CI) | 0.79 [0.18, 3.51] | ||||||||||||||||||||
| 1.4 Recombinant VIIa (rFVIIa) low dose (20 to 50 mcg/kg) versus control | 2 | 273 | Risk Ratio (M‐H, Fixed, 95% CI) | 1.59 [0.43, 5.89] | ||||||||||||||||||||
| 1.5 Recombinant VIIa (rFVIIa) high dose (80 to 100 mcg/kg) versus low dose (20 to 50 mcg/kg) | 2 | 267 | Risk Ratio (M‐H, Fixed, 95% CI) | 0.46 [0.10, 2.08] | ||||||||||||||||||||
| 2 Survival Show forest plot | Other data | No numeric data | ||||||||||||||||||||||
| Analysis 1.2
Comparison 1 Intervention versus control, Outcome 2 Survival. | ||||||||||||||||||||||||
| 2.1 Aprotinin versus control | Other data | No numeric data | ||||||||||||||||||||||
| 3 Liver failure Show forest plot | Other data | No numeric data | ||||||||||||||||||||||
| Analysis 1.3
Comparison 1 Intervention versus control, Outcome 3 Liver failure. | ||||||||||||||||||||||||
| 3.1 Antithrombin III versus control | Other data | No numeric data | ||||||||||||||||||||||
| 4 Peri‐operative morbidity | Other data | No numeric data | ||||||||||||||||||||||
| 4.1 See analysis 2 | Other data | No numeric data | ||||||||||||||||||||||
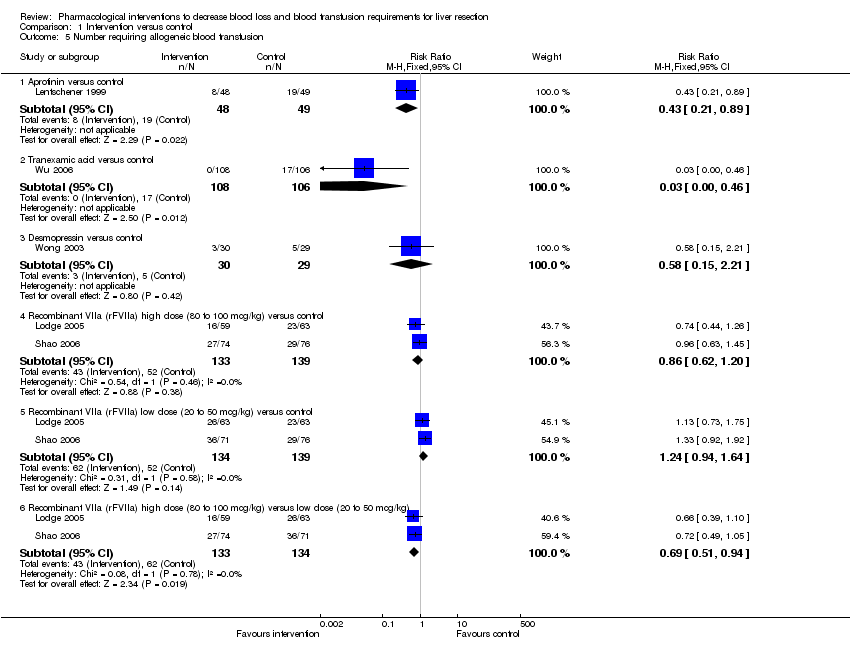
| 5 Number requiring allogeneic blood transfusion Show forest plot | 5 | Risk Ratio (M‐H, Fixed, 95% CI) | Subtotals only | |||||||||||||||||||||
| Analysis 1.5  Comparison 1 Intervention versus control, Outcome 5 Number requiring allogeneic blood transfusion. | ||||||||||||||||||||||||
| 5.1 Aprotinin versus control | 1 | 97 | Risk Ratio (M‐H, Fixed, 95% CI) | 0.43 [0.21, 0.89] | ||||||||||||||||||||
| 5.2 Tranexamic acid versus control | 1 | 214 | Risk Ratio (M‐H, Fixed, 95% CI) | 0.03 [0.00, 0.46] | ||||||||||||||||||||
| 5.3 Desmopressin versus control | 1 | 59 | Risk Ratio (M‐H, Fixed, 95% CI) | 0.58 [0.15, 2.21] | ||||||||||||||||||||
| 5.4 Recombinant VIIa (rFVIIa) high dose (80 to 100 mcg/kg) versus control | 2 | 272 | Risk Ratio (M‐H, Fixed, 95% CI) | 0.86 [0.62, 1.20] | ||||||||||||||||||||
| 5.5 Recombinant VIIa (rFVIIa) low dose (20 to 50 mcg/kg) versus control | 2 | 273 | Risk Ratio (M‐H, Fixed, 95% CI) | 1.24 [0.94, 1.64] | ||||||||||||||||||||
| 5.6 Recombinant VIIa (rFVIIa) high dose (80 to 100 mcg/kg) versus low dose (20 to 50 mcg/kg) | 2 | 267 | Risk Ratio (M‐H, Fixed, 95% CI) | 0.69 [0.51, 0.94] | ||||||||||||||||||||
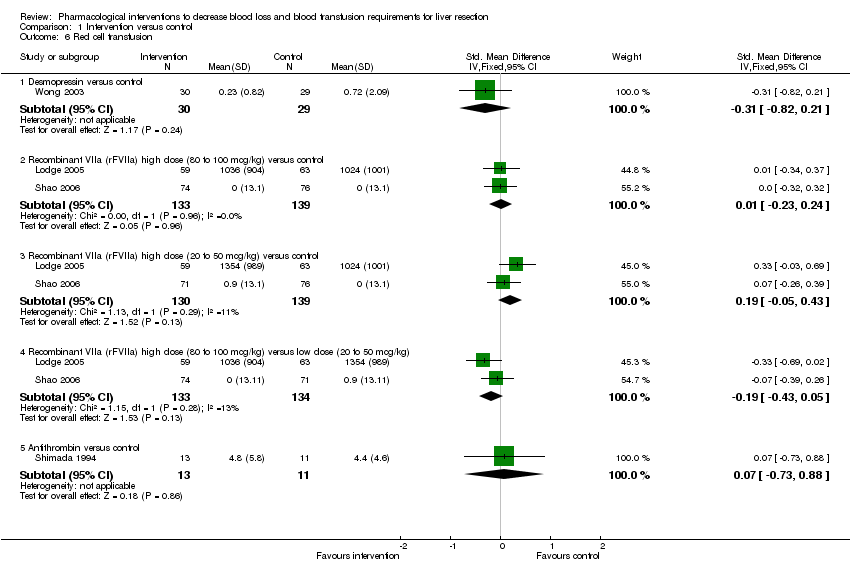
| 6 Red cell transfusion Show forest plot | 4 | Std. Mean Difference (IV, Fixed, 95% CI) | Subtotals only | |||||||||||||||||||||
| Analysis 1.6  Comparison 1 Intervention versus control, Outcome 6 Red cell transfusion. | ||||||||||||||||||||||||
| 6.1 Desmopressin versus control | 1 | 59 | Std. Mean Difference (IV, Fixed, 95% CI) | ‐0.31 [‐0.82, 0.21] | ||||||||||||||||||||
| 6.2 Recombinant VIIa (rFVIIa) high dose (80 to 100 mcg/kg) versus control | 2 | 272 | Std. Mean Difference (IV, Fixed, 95% CI) | 0.01 [‐0.23, 0.24] | ||||||||||||||||||||
| 6.3 Recombinant VIIa (rFVIIa) high dose (20 to 50 mcg/kg) versus control | 2 | 269 | Std. Mean Difference (IV, Fixed, 95% CI) | 0.19 [‐0.05, 0.43] | ||||||||||||||||||||
| 6.4 Recombinant VIIa (rFVIIa) high dose (80 to 100 mcg/kg) versus low dose (20 to 50 mcg/kg) | 2 | 267 | Std. Mean Difference (IV, Fixed, 95% CI) | ‐0.19 [‐0.43, 0.05] | ||||||||||||||||||||
| 6.5 Antithrombin versus control | 1 | 24 | Std. Mean Difference (IV, Fixed, 95% CI) | 0.07 [‐0.73, 0.88] | ||||||||||||||||||||
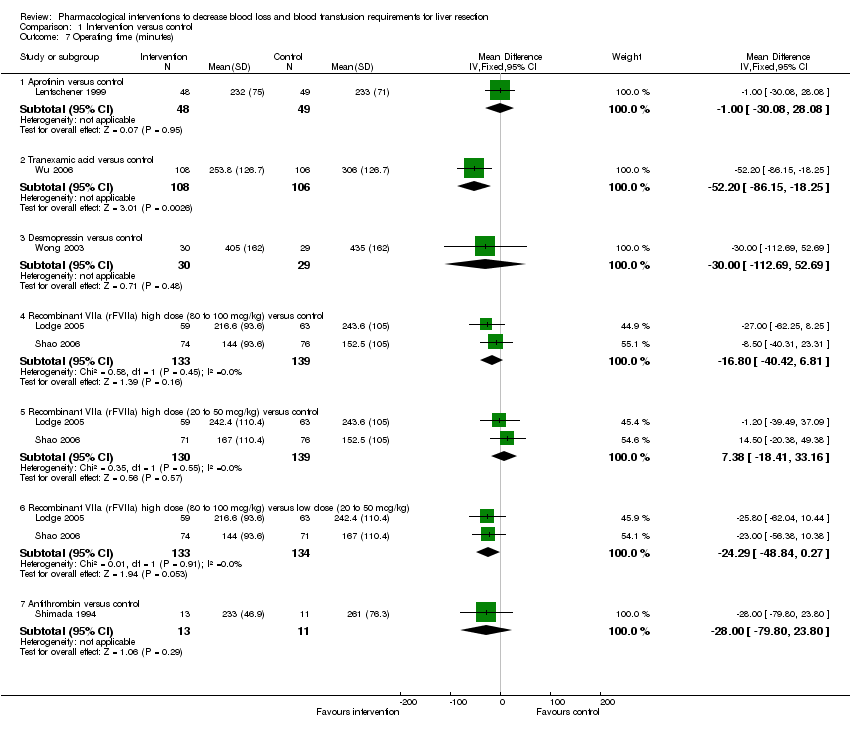
| 7 Operating time (minutes) Show forest plot | 6 | Mean Difference (IV, Fixed, 95% CI) | Subtotals only | |||||||||||||||||||||
| Analysis 1.7  Comparison 1 Intervention versus control, Outcome 7 Operating time (minutes). | ||||||||||||||||||||||||
| 7.1 Aprotinin versus control | 1 | 97 | Mean Difference (IV, Fixed, 95% CI) | ‐1.0 [‐30.08, 28.08] | ||||||||||||||||||||
| 7.2 Tranexamic acid versus control | 1 | 214 | Mean Difference (IV, Fixed, 95% CI) | ‐52.20 [‐86.15, ‐18.25] | ||||||||||||||||||||
| 7.3 Desmopressin versus control | 1 | 59 | Mean Difference (IV, Fixed, 95% CI) | ‐30.0 [‐112.69, 52.69] | ||||||||||||||||||||
| 7.4 Recombinant VIIa (rFVIIa) high dose (80 to 100 mcg/kg) versus control | 2 | 272 | Mean Difference (IV, Fixed, 95% CI) | ‐16.80 [‐40.42, 6.81] | ||||||||||||||||||||
| 7.5 Recombinant VIIa (rFVIIa) high dose (20 to 50 mcg/kg) versus control | 2 | 269 | Mean Difference (IV, Fixed, 95% CI) | 7.38 [‐18.41, 33.16] | ||||||||||||||||||||
| 7.6 Recombinant VIIa (rFVIIa) high dose (80 to 100 mcg/kg) versus low dose (20 to 50 mcg/kg) | 2 | 267 | Mean Difference (IV, Fixed, 95% CI) | ‐24.29 [‐48.84, 0.27] | ||||||||||||||||||||
| 7.7 Antithrombin versus control | 1 | 24 | Mean Difference (IV, Fixed, 95% CI) | ‐28.0 [‐79.80, 23.80] | ||||||||||||||||||||
| 8 Hospital stay (days) Show forest plot | Other data | No numeric data | ||||||||||||||||||||||
| Analysis 1.8
Comparison 1 Intervention versus control, Outcome 8 Hospital stay (days). | ||||||||||||||||||||||||
| 8.1 Tranexamic acid versus control | Other data | No numeric data | ||||||||||||||||||||||
| 9 Transection blood loss (ml) Show forest plot | 2 | Mean Difference (IV, Fixed, 95% CI) | Subtotals only | |||||||||||||||||||||
| Analysis 1.9  Comparison 1 Intervention versus control, Outcome 9 Transection blood loss (ml). | ||||||||||||||||||||||||
| 9.1 Tranexamic acid versus control | 1 | 214 | Mean Difference (IV, Fixed, 95% CI) | ‐260.0 [‐434.99, ‐85.01] | ||||||||||||||||||||
| 9.2 Desmopressin versus control | 1 | 59 | Mean Difference (IV, Fixed, 95% CI) | ‐45.0 [‐626.86, 536.86] | ||||||||||||||||||||
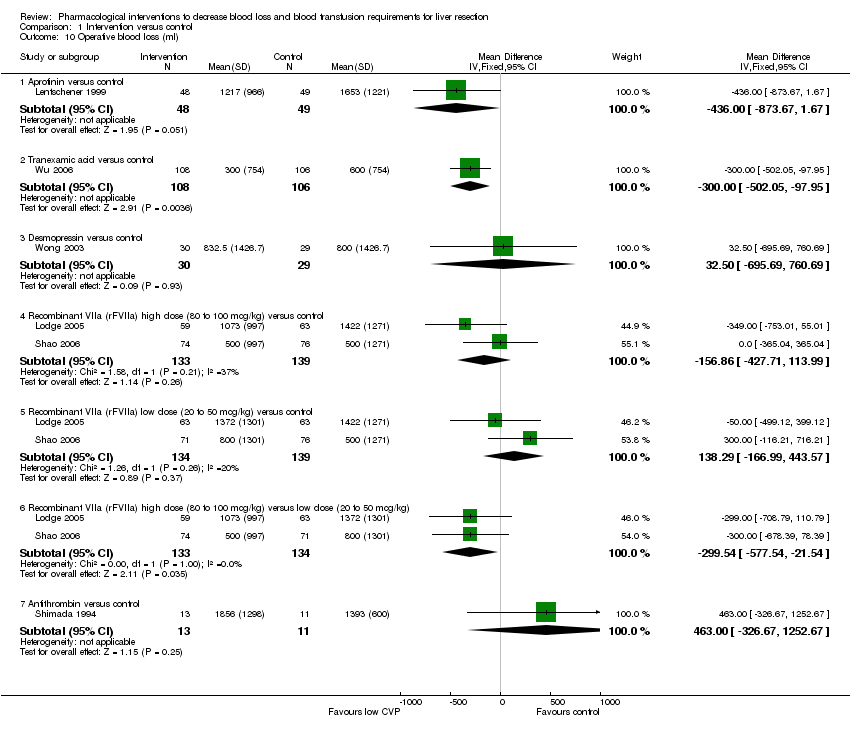
| 10 Operative blood loss (ml) Show forest plot | 6 | Mean Difference (IV, Fixed, 95% CI) | Subtotals only | |||||||||||||||||||||
| Analysis 1.10  Comparison 1 Intervention versus control, Outcome 10 Operative blood loss (ml). | ||||||||||||||||||||||||
| 10.1 Aprotinin versus control | 1 | 97 | Mean Difference (IV, Fixed, 95% CI) | ‐434.00 [‐873.67, 1.67] | ||||||||||||||||||||
| 10.2 Tranexamic acid versus control | 1 | 214 | Mean Difference (IV, Fixed, 95% CI) | ‐300.0 [‐502.05, ‐97.95] | ||||||||||||||||||||
| 10.3 Desmopressin versus control | 1 | 59 | Mean Difference (IV, Fixed, 95% CI) | 32.5 [‐695.69, 760.69] | ||||||||||||||||||||
| 10.4 Recombinant VIIa (rFVIIa) high dose (80 to 100 mcg/kg) versus control | 2 | 272 | Mean Difference (IV, Fixed, 95% CI) | ‐156.86 [‐427.71, 113.99] | ||||||||||||||||||||
| 10.5 Recombinant VIIa (rFVIIa) low dose (20 to 50 mcg/kg) versus control | 2 | 273 | Mean Difference (IV, Fixed, 95% CI) | 138.29 [‐166.99, 443.57] | ||||||||||||||||||||
| 10.6 Recombinant VIIa (rFVIIa) high dose (80 to 100 mcg/kg) versus low dose (20 to 50 mcg/kg) | 2 | 267 | Mean Difference (IV, Fixed, 95% CI) | ‐299.54 [‐577.54, ‐21.54] | ||||||||||||||||||||
| 10.7 Antithrombin versus control | 1 | 24 | Mean Difference (IV, Fixed, 95% CI) | 463.00 [‐326.67, 1252.67] | ||||||||||||||||||||
| 11 Bilirubin (micromol/litre) Show forest plot | Other data | No numeric data | ||||||||||||||||||||||
| Analysis 1.11
Comparison 1 Intervention versus control, Outcome 11 Bilirubin (micromol/litre). | ||||||||||||||||||||||||
| 11.1 Antithrombin III versus control | Other data | No numeric data | ||||||||||||||||||||||
| 12 Prothrombin activity (percentage of normal activity) Show forest plot | Other data | No numeric data | ||||||||||||||||||||||
| Analysis 1.12
Comparison 1 Intervention versus control, Outcome 12 Prothrombin activity (percentage of normal activity). | ||||||||||||||||||||||||
| 12.1 Aprotinin versus control | Other data | No numeric data | ||||||||||||||||||||||
| 13 Aspartate transaminase (international units per litre) (peak) Show forest plot | Other data | No numeric data | ||||||||||||||||||||||
| Analysis 1.13
Comparison 1 Intervention versus control, Outcome 13 Aspartate transaminase (international units per litre) (peak). | ||||||||||||||||||||||||
| 13.1 Antithrombin III versus control | Other data | No numeric data | ||||||||||||||||||||||
| 14 Alanine transminase (international units per litre) (peak) Show forest plot | Other data | No numeric data | ||||||||||||||||||||||
| Analysis 1.14
Comparison 1 Intervention versus control, Outcome 14 Alanine transminase (international units per litre) (peak). | ||||||||||||||||||||||||
| 14.2 Antithrombin III versus control | Other data | No numeric data | ||||||||||||||||||||||
| Outcome or subgroup title | No. of studies | No. of participants | Statistical method | Effect size | ||||||||||||||||
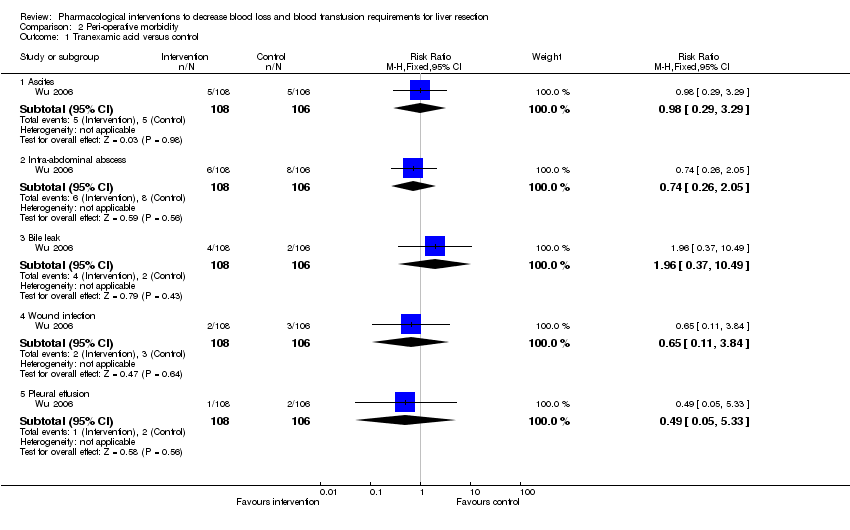
| 1 Tranexamic acid versus control Show forest plot | 1 | Risk Ratio (M‐H, Fixed, 95% CI) | Subtotals only | |||||||||||||||||
| Analysis 2.1  Comparison 2 Peri‐operative morbidity, Outcome 1 Tranexamic acid versus control. | ||||||||||||||||||||
| 1.1 Ascites | 1 | 214 | Risk Ratio (M‐H, Fixed, 95% CI) | 0.98 [0.29, 3.29] | ||||||||||||||||
| 1.2 Intra‐abdominal abscess | 1 | 214 | Risk Ratio (M‐H, Fixed, 95% CI) | 0.74 [0.26, 2.05] | ||||||||||||||||
| 1.3 Bile leak | 1 | 214 | Risk Ratio (M‐H, Fixed, 95% CI) | 1.96 [0.37, 10.49] | ||||||||||||||||
| 1.4 Wound infection | 1 | 214 | Risk Ratio (M‐H, Fixed, 95% CI) | 0.65 [0.11, 3.84] | ||||||||||||||||
| 1.5 Pleural effusion | 1 | 214 | Risk Ratio (M‐H, Fixed, 95% CI) | 0.49 [0.05, 5.33] | ||||||||||||||||
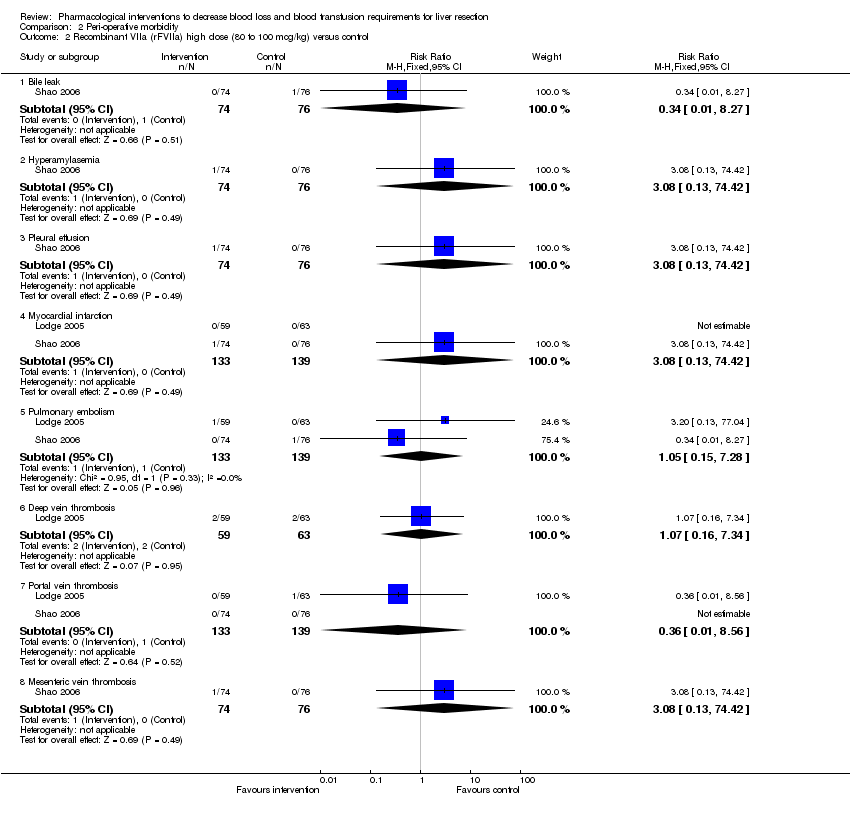
| 2 Recombinant VIIa (rFVIIa) high dose (80 to 100 mcg/kg) versus control Show forest plot | 2 | Risk Ratio (M‐H, Fixed, 95% CI) | Subtotals only | |||||||||||||||||
| Analysis 2.2  Comparison 2 Peri‐operative morbidity, Outcome 2 Recombinant VIIa (rFVIIa) high dose (80 to 100 mcg/kg) versus control. | ||||||||||||||||||||
| 2.1 Bile leak | 1 | 150 | Risk Ratio (M‐H, Fixed, 95% CI) | 0.34 [0.01, 8.27] | ||||||||||||||||
| 2.2 Hyperamylasemia | 1 | 150 | Risk Ratio (M‐H, Fixed, 95% CI) | 3.08 [0.13, 74.42] | ||||||||||||||||
| 2.3 Pleural effusion | 1 | 150 | Risk Ratio (M‐H, Fixed, 95% CI) | 3.08 [0.13, 74.42] | ||||||||||||||||
| 2.4 Myocardial infarction | 2 | 272 | Risk Ratio (M‐H, Fixed, 95% CI) | 3.08 [0.13, 74.42] | ||||||||||||||||
| 2.5 Pulmonary embolism | 2 | 272 | Risk Ratio (M‐H, Fixed, 95% CI) | 1.05 [0.15, 7.28] | ||||||||||||||||
| 2.6 Deep vein thrombosis | 1 | 122 | Risk Ratio (M‐H, Fixed, 95% CI) | 1.07 [0.16, 7.34] | ||||||||||||||||
| 2.7 Portal vein thrombosis | 2 | 272 | Risk Ratio (M‐H, Fixed, 95% CI) | 0.36 [0.01, 8.56] | ||||||||||||||||
| 2.8 Mesenteric vein thrombosis | 1 | 150 | Risk Ratio (M‐H, Fixed, 95% CI) | 3.08 [0.13, 74.42] | ||||||||||||||||
| 3 Recombinant VIIa (rFVIIa) low dose (20 to 50 mcg/kg) versus control Show forest plot | 2 | Risk Ratio (M‐H, Fixed, 95% CI) | Subtotals only | |||||||||||||||||
| Analysis 2.3  Comparison 2 Peri‐operative morbidity, Outcome 3 Recombinant VIIa (rFVIIa) low dose (20 to 50 mcg/kg) versus control. | ||||||||||||||||||||
| 3.1 Bile leak | 1 | 147 | Risk Ratio (M‐H, Fixed, 95% CI) | 1.07 [0.07, 16.79] | ||||||||||||||||
| 3.2 Hyperamylasemia | 1 | 147 | Risk Ratio (M‐H, Fixed, 95% CI) | 0.0 [0.0, 0.0] | ||||||||||||||||
| 3.3 Pleural effusion | 1 | 147 | Risk Ratio (M‐H, Fixed, 95% CI) | 0.0 [0.0, 0.0] | ||||||||||||||||
| 3.4 Myocardial infarction | 2 | 273 | Risk Ratio (M‐H, Fixed, 95% CI) | 5.0 [0.24, 102.10] | ||||||||||||||||
| 3.5 Pulmonary embolism | 2 | 273 | Risk Ratio (M‐H, Fixed, 95% CI) | 1.03 [0.14, 7.38] | ||||||||||||||||
| 3.6 Deep vein thrombosis | 1 | 126 | Risk Ratio (M‐H, Fixed, 95% CI) | 0.2 [0.01, 4.08] | ||||||||||||||||
| 3.7 Portal vein thrombosis | 2 | 273 | Risk Ratio (M‐H, Fixed, 95% CI) | 1.03 [0.15, 7.14] | ||||||||||||||||
| 3.8 Mesenteric vein thrombosis | 1 | 147 | Risk Ratio (M‐H, Fixed, 95% CI) | 0.0 [0.0, 0.0] | ||||||||||||||||
| 4 Recombinant VIIa (rFVIIa) high dose (80 to 100 mcg/kg) versus low dose (20 to 50 mcg/kg) Show forest plot | 2 | Risk Ratio (M‐H, Fixed, 95% CI) | Subtotals only | |||||||||||||||||
| Analysis 2.4  Comparison 2 Peri‐operative morbidity, Outcome 4 Recombinant VIIa (rFVIIa) high dose (80 to 100 mcg/kg) versus low dose (20 to 50 mcg/kg). | ||||||||||||||||||||
| 4.1 Bile leak | 1 | 145 | Risk Ratio (M‐H, Fixed, 95% CI) | 0.32 [0.01, 7.73] | ||||||||||||||||
| 4.2 Hyperamylasemia | 1 | 145 | Risk Ratio (M‐H, Fixed, 95% CI) | 2.88 [0.12, 69.55] | ||||||||||||||||
| 4.3 Pleural effusion | 1 | 145 | Risk Ratio (M‐H, Fixed, 95% CI) | 2.88 [0.12, 69.55] | ||||||||||||||||
| 4.4 Myocardial infarction | 2 | 267 | Risk Ratio (M‐H, Fixed, 95% CI) | 0.68 [0.11, 4.12] | ||||||||||||||||
| 4.5 Pulmonary embolism | 2 | 267 | Risk Ratio (M‐H, Fixed, 95% CI) | 1.07 [0.07, 16.69] | ||||||||||||||||
| 4.6 Deep vein thrombosis | 1 | 122 | Risk Ratio (M‐H, Fixed, 95% CI) | 5.33 [0.26, 108.84] | ||||||||||||||||
| 4.7 Portal vein thrombosis | 2 | 267 | Risk Ratio (M‐H, Fixed, 95% CI) | 0.32 [0.01, 7.73] | ||||||||||||||||
| 4.8 Mesenteric vein thrombosis | 1 | 145 | Risk Ratio (M‐H, Fixed, 95% CI) | 2.88 [0.12, 69.55] | ||||||||||||||||
| 5 Anitithrombin III versus control Show forest plot | Other data | No numeric data | ||||||||||||||||||
| Analysis 2.5
Comparison 2 Peri‐operative morbidity, Outcome 5 Anitithrombin III versus control. | ||||||||||||||||||||
| 5.1 Infected intra‐abdominal collection | Other data | No numeric data | ||||||||||||||||||

Reference flow chart
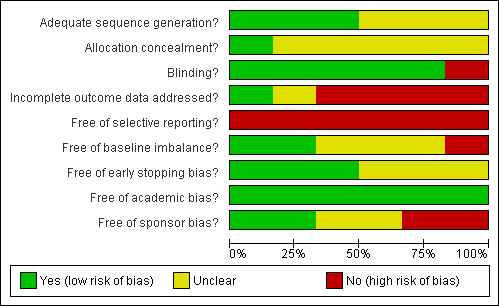
Methodological quality graph: review authors' judgements about each methodological quality item presented as percentages across all included studies.
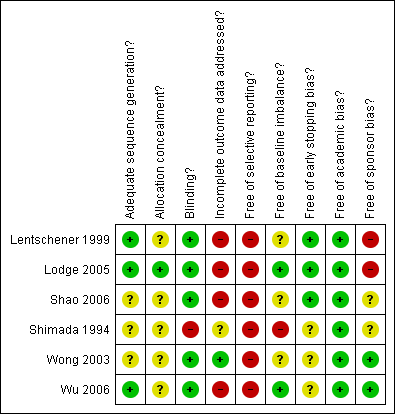
Methodological quality summary: review authors' judgements about each methodological quality item for each included study.

Comparison 1 Intervention versus control, Outcome 1 Mortality.
| Study | |
| Aprotinin versus control | |
| Lentschener 1999 | In this trial, survival was reported for patients undergoing liver resection for colorectal liver metastases. The exact number of patients in each group was not stated and survival outcomes could not be included for meta‐analysis. The one‐year survival in patients with colorectal liver metastases was statistically greater in the aprotinin group than the control group. However, the survival advantage was lost at 28 months. |
Comparison 1 Intervention versus control, Outcome 2 Survival.
| Study | Antithrombin | Control | P value |
| Antithrombin III versus control | |||
| Shimada 1994 | 1/13 (7.7%) | 1/11 (9.1%) | P > 0.9999 |
Comparison 1 Intervention versus control, Outcome 3 Liver failure.
Comparison 1 Intervention versus control, Outcome 5 Number requiring allogeneic blood transfusion.
Comparison 1 Intervention versus control, Outcome 6 Red cell transfusion.
Comparison 1 Intervention versus control, Outcome 7 Operating time (minutes).
| Study | Tranexamic acid Mean (standard deviation) | ControlMean (standard deviation) | P value |
| Tranexamic acid versus control | |||
| Wu 2006 | 8 (7.66) | 9 (7.66) | 0.34 |
Comparison 1 Intervention versus control, Outcome 8 Hospital stay (days).

Comparison 1 Intervention versus control, Outcome 9 Transection blood loss (ml).
Comparison 1 Intervention versus control, Outcome 10 Operative blood loss (ml).
| Study | Antithrombin III Mean (standard deviation) | Control Mean (standard deviation) | Mean difference (95% confidence intervals) | Statistical signficance |
| Antithrombin III versus control | ||||
| Shimada 1994 | 2.1(1.1) | 2.5(1.3) | ‐0.40 (‐1.37 to 0.57) | P = 0.42 |
Comparison 1 Intervention versus control, Outcome 11 Bilirubin (micromol/litre).
| Study | Aprotinin Mean (standard deviation) | Control Mean (standard deviation) | Mean difference(95% confidence intervals) | Statistical significance |
| Aprotinin versus control | ||||
| Lentschener 1999 | 63(12) | 63(15) | 0 (‐5.4 to 5.4) | P = 1.00 |
Comparison 1 Intervention versus control, Outcome 12 Prothrombin activity (percentage of normal activity).
| Study | Antithrombin III Mean (standard deviation) | Control Mean (standard deviation) | Mean difference (95% confidence intervals) | Statistical significance |
| Antithrombin III versus control | ||||
| Shimada 1994 | 170 (86.5) | 177(63) | ‐7.00 (‐66.98 to 52.98) | P = 0.82 |
Comparison 1 Intervention versus control, Outcome 13 Aspartate transaminase (international units per litre) (peak).
| Study | Antithrombin III Mean (standard deviation) | Control Mean (standard deviation) | Mean difference (95% confidence intervals) | Statistical significance |
| Antithrombin III versus control | ||||
| Shimada 1994 | 95 (39.7) | 86 (39.8) | 9.00 (‐22.92 to 40.92) | P = 0.58 |
Comparison 1 Intervention versus control, Outcome 14 Alanine transminase (international units per litre) (peak).
Comparison 2 Peri‐operative morbidity, Outcome 1 Tranexamic acid versus control.
Comparison 2 Peri‐operative morbidity, Outcome 2 Recombinant VIIa (rFVIIa) high dose (80 to 100 mcg/kg) versus control.

Comparison 2 Peri‐operative morbidity, Outcome 3 Recombinant VIIa (rFVIIa) low dose (20 to 50 mcg/kg) versus control.

Comparison 2 Peri‐operative morbidity, Outcome 4 Recombinant VIIa (rFVIIa) high dose (80 to 100 mcg/kg) versus low dose (20 to 50 mcg/kg).
| Study | Antithrombin | Control | P value |
| Infected intra‐abdominal collection | |||
| Shimada 1994 | 1/13 (7.7%) | 1/11 (9.1%) | P > 0.9999 |
Comparison 2 Peri‐operative morbidity, Outcome 5 Anitithrombin III versus control.
| Outcome or subgroup title | No. of studies | No. of participants | Statistical method | Effect size |
| 1 Mortality Show forest plot | 4 | Risk Ratio (M‐H, Fixed, 95% CI) | Subtotals only | |
| 1.1 Aprotinin versus control | 1 | 37 | Risk Ratio (M‐H, Fixed, 95% CI) | 1.18 [0.18, 7.48] |
| 1.2 Tranexamic acid versus control | 1 | 217 | Risk Ratio (M‐H, Fixed, 95% CI) | 0.0 [0.0, 0.0] |
| 1.3 Recombinant VIIa (rFVIIa) high dose (80 to 100 mcg/kg) versus control | 2 | 272 | Risk Ratio (M‐H, Fixed, 95% CI) | 0.79 [0.18, 3.51] |
| 1.4 Recombinant VIIa (rFVIIa) low dose (20 to 50 mcg/kg) versus control | 2 | 273 | Risk Ratio (M‐H, Fixed, 95% CI) | 1.59 [0.43, 5.89] |
| 1.5 Recombinant VIIa (rFVIIa) high dose (80 to 100 mcg/kg) versus low dose (20 to 50 mcg/kg) | 2 | 267 | Risk Ratio (M‐H, Fixed, 95% CI) | 0.46 [0.10, 2.08] |
| 2 Survival Show forest plot | Other data | No numeric data | ||
| 2.1 Aprotinin versus control | Other data | No numeric data | ||
| 3 Liver failure Show forest plot | Other data | No numeric data | ||
| 3.1 Antithrombin III versus control | Other data | No numeric data | ||
| 4 Peri‐operative morbidity | Other data | No numeric data | ||
| 4.1 See analysis 2 | Other data | No numeric data | ||
| 5 Number requiring allogeneic blood transfusion Show forest plot | 5 | Risk Ratio (M‐H, Fixed, 95% CI) | Subtotals only | |
| 5.1 Aprotinin versus control | 1 | 97 | Risk Ratio (M‐H, Fixed, 95% CI) | 0.43 [0.21, 0.89] |
| 5.2 Tranexamic acid versus control | 1 | 214 | Risk Ratio (M‐H, Fixed, 95% CI) | 0.03 [0.00, 0.46] |
| 5.3 Desmopressin versus control | 1 | 59 | Risk Ratio (M‐H, Fixed, 95% CI) | 0.58 [0.15, 2.21] |
| 5.4 Recombinant VIIa (rFVIIa) high dose (80 to 100 mcg/kg) versus control | 2 | 272 | Risk Ratio (M‐H, Fixed, 95% CI) | 0.86 [0.62, 1.20] |
| 5.5 Recombinant VIIa (rFVIIa) low dose (20 to 50 mcg/kg) versus control | 2 | 273 | Risk Ratio (M‐H, Fixed, 95% CI) | 1.24 [0.94, 1.64] |
| 5.6 Recombinant VIIa (rFVIIa) high dose (80 to 100 mcg/kg) versus low dose (20 to 50 mcg/kg) | 2 | 267 | Risk Ratio (M‐H, Fixed, 95% CI) | 0.69 [0.51, 0.94] |
| 6 Red cell transfusion Show forest plot | 4 | Std. Mean Difference (IV, Fixed, 95% CI) | Subtotals only | |
| 6.1 Desmopressin versus control | 1 | 59 | Std. Mean Difference (IV, Fixed, 95% CI) | ‐0.31 [‐0.82, 0.21] |
| 6.2 Recombinant VIIa (rFVIIa) high dose (80 to 100 mcg/kg) versus control | 2 | 272 | Std. Mean Difference (IV, Fixed, 95% CI) | 0.01 [‐0.23, 0.24] |
| 6.3 Recombinant VIIa (rFVIIa) high dose (20 to 50 mcg/kg) versus control | 2 | 269 | Std. Mean Difference (IV, Fixed, 95% CI) | 0.19 [‐0.05, 0.43] |
| 6.4 Recombinant VIIa (rFVIIa) high dose (80 to 100 mcg/kg) versus low dose (20 to 50 mcg/kg) | 2 | 267 | Std. Mean Difference (IV, Fixed, 95% CI) | ‐0.19 [‐0.43, 0.05] |
| 6.5 Antithrombin versus control | 1 | 24 | Std. Mean Difference (IV, Fixed, 95% CI) | 0.07 [‐0.73, 0.88] |
| 7 Operating time (minutes) Show forest plot | 6 | Mean Difference (IV, Fixed, 95% CI) | Subtotals only | |
| 7.1 Aprotinin versus control | 1 | 97 | Mean Difference (IV, Fixed, 95% CI) | ‐1.0 [‐30.08, 28.08] |
| 7.2 Tranexamic acid versus control | 1 | 214 | Mean Difference (IV, Fixed, 95% CI) | ‐52.20 [‐86.15, ‐18.25] |
| 7.3 Desmopressin versus control | 1 | 59 | Mean Difference (IV, Fixed, 95% CI) | ‐30.0 [‐112.69, 52.69] |
| 7.4 Recombinant VIIa (rFVIIa) high dose (80 to 100 mcg/kg) versus control | 2 | 272 | Mean Difference (IV, Fixed, 95% CI) | ‐16.80 [‐40.42, 6.81] |
| 7.5 Recombinant VIIa (rFVIIa) high dose (20 to 50 mcg/kg) versus control | 2 | 269 | Mean Difference (IV, Fixed, 95% CI) | 7.38 [‐18.41, 33.16] |
| 7.6 Recombinant VIIa (rFVIIa) high dose (80 to 100 mcg/kg) versus low dose (20 to 50 mcg/kg) | 2 | 267 | Mean Difference (IV, Fixed, 95% CI) | ‐24.29 [‐48.84, 0.27] |
| 7.7 Antithrombin versus control | 1 | 24 | Mean Difference (IV, Fixed, 95% CI) | ‐28.0 [‐79.80, 23.80] |
| 8 Hospital stay (days) Show forest plot | Other data | No numeric data | ||
| 8.1 Tranexamic acid versus control | Other data | No numeric data | ||
| 9 Transection blood loss (ml) Show forest plot | 2 | Mean Difference (IV, Fixed, 95% CI) | Subtotals only | |
| 9.1 Tranexamic acid versus control | 1 | 214 | Mean Difference (IV, Fixed, 95% CI) | ‐260.0 [‐434.99, ‐85.01] |
| 9.2 Desmopressin versus control | 1 | 59 | Mean Difference (IV, Fixed, 95% CI) | ‐45.0 [‐626.86, 536.86] |
| 10 Operative blood loss (ml) Show forest plot | 6 | Mean Difference (IV, Fixed, 95% CI) | Subtotals only | |
| 10.1 Aprotinin versus control | 1 | 97 | Mean Difference (IV, Fixed, 95% CI) | ‐434.00 [‐873.67, 1.67] |
| 10.2 Tranexamic acid versus control | 1 | 214 | Mean Difference (IV, Fixed, 95% CI) | ‐300.0 [‐502.05, ‐97.95] |
| 10.3 Desmopressin versus control | 1 | 59 | Mean Difference (IV, Fixed, 95% CI) | 32.5 [‐695.69, 760.69] |
| 10.4 Recombinant VIIa (rFVIIa) high dose (80 to 100 mcg/kg) versus control | 2 | 272 | Mean Difference (IV, Fixed, 95% CI) | ‐156.86 [‐427.71, 113.99] |
| 10.5 Recombinant VIIa (rFVIIa) low dose (20 to 50 mcg/kg) versus control | 2 | 273 | Mean Difference (IV, Fixed, 95% CI) | 138.29 [‐166.99, 443.57] |
| 10.6 Recombinant VIIa (rFVIIa) high dose (80 to 100 mcg/kg) versus low dose (20 to 50 mcg/kg) | 2 | 267 | Mean Difference (IV, Fixed, 95% CI) | ‐299.54 [‐577.54, ‐21.54] |
| 10.7 Antithrombin versus control | 1 | 24 | Mean Difference (IV, Fixed, 95% CI) | 463.00 [‐326.67, 1252.67] |
| 11 Bilirubin (micromol/litre) Show forest plot | Other data | No numeric data | ||
| 11.1 Antithrombin III versus control | Other data | No numeric data | ||
| 12 Prothrombin activity (percentage of normal activity) Show forest plot | Other data | No numeric data | ||
| 12.1 Aprotinin versus control | Other data | No numeric data | ||
| 13 Aspartate transaminase (international units per litre) (peak) Show forest plot | Other data | No numeric data | ||
| 13.1 Antithrombin III versus control | Other data | No numeric data | ||
| 14 Alanine transminase (international units per litre) (peak) Show forest plot | Other data | No numeric data | ||
| 14.2 Antithrombin III versus control | Other data | No numeric data | ||
| Outcome or subgroup title | No. of studies | No. of participants | Statistical method | Effect size |
| 1 Tranexamic acid versus control Show forest plot | 1 | Risk Ratio (M‐H, Fixed, 95% CI) | Subtotals only | |
| 1.1 Ascites | 1 | 214 | Risk Ratio (M‐H, Fixed, 95% CI) | 0.98 [0.29, 3.29] |
| 1.2 Intra‐abdominal abscess | 1 | 214 | Risk Ratio (M‐H, Fixed, 95% CI) | 0.74 [0.26, 2.05] |
| 1.3 Bile leak | 1 | 214 | Risk Ratio (M‐H, Fixed, 95% CI) | 1.96 [0.37, 10.49] |
| 1.4 Wound infection | 1 | 214 | Risk Ratio (M‐H, Fixed, 95% CI) | 0.65 [0.11, 3.84] |
| 1.5 Pleural effusion | 1 | 214 | Risk Ratio (M‐H, Fixed, 95% CI) | 0.49 [0.05, 5.33] |
| 2 Recombinant VIIa (rFVIIa) high dose (80 to 100 mcg/kg) versus control Show forest plot | 2 | Risk Ratio (M‐H, Fixed, 95% CI) | Subtotals only | |
| 2.1 Bile leak | 1 | 150 | Risk Ratio (M‐H, Fixed, 95% CI) | 0.34 [0.01, 8.27] |
| 2.2 Hyperamylasemia | 1 | 150 | Risk Ratio (M‐H, Fixed, 95% CI) | 3.08 [0.13, 74.42] |
| 2.3 Pleural effusion | 1 | 150 | Risk Ratio (M‐H, Fixed, 95% CI) | 3.08 [0.13, 74.42] |
| 2.4 Myocardial infarction | 2 | 272 | Risk Ratio (M‐H, Fixed, 95% CI) | 3.08 [0.13, 74.42] |
| 2.5 Pulmonary embolism | 2 | 272 | Risk Ratio (M‐H, Fixed, 95% CI) | 1.05 [0.15, 7.28] |
| 2.6 Deep vein thrombosis | 1 | 122 | Risk Ratio (M‐H, Fixed, 95% CI) | 1.07 [0.16, 7.34] |
| 2.7 Portal vein thrombosis | 2 | 272 | Risk Ratio (M‐H, Fixed, 95% CI) | 0.36 [0.01, 8.56] |
| 2.8 Mesenteric vein thrombosis | 1 | 150 | Risk Ratio (M‐H, Fixed, 95% CI) | 3.08 [0.13, 74.42] |
| 3 Recombinant VIIa (rFVIIa) low dose (20 to 50 mcg/kg) versus control Show forest plot | 2 | Risk Ratio (M‐H, Fixed, 95% CI) | Subtotals only | |
| 3.1 Bile leak | 1 | 147 | Risk Ratio (M‐H, Fixed, 95% CI) | 1.07 [0.07, 16.79] |
| 3.2 Hyperamylasemia | 1 | 147 | Risk Ratio (M‐H, Fixed, 95% CI) | 0.0 [0.0, 0.0] |
| 3.3 Pleural effusion | 1 | 147 | Risk Ratio (M‐H, Fixed, 95% CI) | 0.0 [0.0, 0.0] |
| 3.4 Myocardial infarction | 2 | 273 | Risk Ratio (M‐H, Fixed, 95% CI) | 5.0 [0.24, 102.10] |
| 3.5 Pulmonary embolism | 2 | 273 | Risk Ratio (M‐H, Fixed, 95% CI) | 1.03 [0.14, 7.38] |
| 3.6 Deep vein thrombosis | 1 | 126 | Risk Ratio (M‐H, Fixed, 95% CI) | 0.2 [0.01, 4.08] |
| 3.7 Portal vein thrombosis | 2 | 273 | Risk Ratio (M‐H, Fixed, 95% CI) | 1.03 [0.15, 7.14] |
| 3.8 Mesenteric vein thrombosis | 1 | 147 | Risk Ratio (M‐H, Fixed, 95% CI) | 0.0 [0.0, 0.0] |
| 4 Recombinant VIIa (rFVIIa) high dose (80 to 100 mcg/kg) versus low dose (20 to 50 mcg/kg) Show forest plot | 2 | Risk Ratio (M‐H, Fixed, 95% CI) | Subtotals only | |
| 4.1 Bile leak | 1 | 145 | Risk Ratio (M‐H, Fixed, 95% CI) | 0.32 [0.01, 7.73] |
| 4.2 Hyperamylasemia | 1 | 145 | Risk Ratio (M‐H, Fixed, 95% CI) | 2.88 [0.12, 69.55] |
| 4.3 Pleural effusion | 1 | 145 | Risk Ratio (M‐H, Fixed, 95% CI) | 2.88 [0.12, 69.55] |
| 4.4 Myocardial infarction | 2 | 267 | Risk Ratio (M‐H, Fixed, 95% CI) | 0.68 [0.11, 4.12] |
| 4.5 Pulmonary embolism | 2 | 267 | Risk Ratio (M‐H, Fixed, 95% CI) | 1.07 [0.07, 16.69] |
| 4.6 Deep vein thrombosis | 1 | 122 | Risk Ratio (M‐H, Fixed, 95% CI) | 5.33 [0.26, 108.84] |
| 4.7 Portal vein thrombosis | 2 | 267 | Risk Ratio (M‐H, Fixed, 95% CI) | 0.32 [0.01, 7.73] |
| 4.8 Mesenteric vein thrombosis | 1 | 145 | Risk Ratio (M‐H, Fixed, 95% CI) | 2.88 [0.12, 69.55] |
| 5 Anitithrombin III versus control Show forest plot | Other data | No numeric data | ||
| 5.1 Infected intra‐abdominal collection | Other data | No numeric data | ||