Efectos a largo plazo de los fármacos para reducir el peso en los pacientes con hipertensión
Resumen
Antecedentes
Las guías principales para el tratamiento de la hipertensión recomiendan la pérdida de peso; los fármacos contra la obesidad pueden ser de utilidad en este sentido.
Objetivos
Objetivos primarios:
Evaluar los efectos a largo plazo de la reducción farmacológicamente inducida del peso corporal en adultos con hipertensión esencial sobre la mortalidad por todas las causas, la morbilidad cardiovascular y los eventos adversos (incluidos los eventos adversos graves totales, el retiro debido a eventos adversos y los eventos adversos no graves totales).
Objetivos secundarios:
Evaluar los efectos a largo plazo de la reducción farmacológicamente inducida del peso corporal en adultos con hipertensión esencial sobre el cambio a partir del inicio en la presión arterial sistólica, el cambio a partir del inicio en la presión arterial diastólica y la reducción del peso corporal.
Métodos de búsqueda
Se obtuvieron los estudios mediante búsquedas informatizadas en el registro especializado del Grupo Cochrane de Hipertensión (Cochrane Hypertension Group), Registro Cochrane Central de Ensayos Cotrolados (Cochrane Central Register of Controlled Trials) (CENTRAL), Ovid MEDLINE, Ovid EMBASE, el registro de ensayos clínicos ClinicalTrials.gov y se hicieron búsquedas manuales en las listas de referencias y revisiones sistemáticas (estado al 13 de abril de 2015).
Criterios de selección
Ensayos controlados aleatorios en adultos con hipertensión de al menos 24 semanas de duración que compararon intervenciones farmacológicas a largo plazo para la pérdida de peso con placebo.
Obtención y análisis de los datos
Dos autores de la revisión seleccionaron los estudios elegibles de forma independiente, evaluaron el riesgo de sesgo y extrajeron los datos. Cuando fue apropiado y a falta de heterogeneidad significativa entre los estudios (p > 0,1), los estudios se agruparon mediante el metanálisis de efectos fijos. Cuando hubo heterogeneidad, se utilizó el modelo de efectos aleatorios y se investigó la causa de la misma.
Resultados principales
Después de actualizar la búsqueda bibliográfica, que se extendió para incluir cuatro nuevos fármacos para reducir el peso, se identificó un estudio adicional de fentermina/topiramato, que aumentó el número total de estudios a nueve que compararon orlistat, sibutramina o fentermina/topiramato con placebo y, por lo tanto, cumplieron los criterios de inclusión. No se identificaron estudios relevantes que investigaran rimonabant, liraglutide, lorcaserina o naltrexona/bupropión. Ningún estudio incluyó la mortalidad y la morbilidad cardiovasculares como resultados predefinidos. La incidencia de efectos secundarios gastrointestinales fue consistentemente mayor en los participantes tratados con orlistat versus los tratados con placebo. Los efectos secundarios más frecuentes fueron sensación de sequedad bucal, estreñimiento y cefalea con sibutramina, y la sensación de sequedad bucal y parestesia con fentermina/topiramato. En los participantes asignados a orlistat, sibutramina o fentermina/topiramato el peso corporal se redujo más eficazmente que en los participantes en los grupos atención habitual / placebo. El orlistat redujo la presión arterial sistólica en comparación con placebo en ‐2,5 mmHg (diferencia de medias [DM]; intervalo de confianza [IC] del 95%: ‐4,0 a ‐0,9 mmHg) y la presión arterial diastólica en ‐1,9 mmHg (DM; IC del 95%: ‐3,0 a ‐0,9 mm Hg). La sibutramina aumentó la presión arterial diastólica en comparación con el placebo en +3,2 mmHg (DM; IC del 95%: +1,4 a +4,9 mm Hg). El único ensayo que investigó fentermina/topiramato indicó que se redujo la presión arterial.
Conclusiones de los autores
En los pacientes con presión arterial elevada, el orlistat y la sibutramina redujeron el peso corporal a un grado similar, mientras fentermina/topiramato redujo el peso corporal en mayor medida. En los mismos ensayos, orlistat y fentermina/topiramato redujeron la presión arterial, mientras la sibutramina lo aumentó. No fue posible incluir ensayos que investigaran rimonabant, liraglutide, lorcaserina o naltrexona/bupropión en los pacientes con presión arterial elevada. Los ensayos a largo plazo que evalúen el efecto de orlistat, liraglutide, lorcaserina, fentermina/topiramato o naltrexona/bupropión sobre la mortalidad y la morbilidad no están disponibles y son necesarios. Rimonabant y sibutramina se retiraron del mercado después de que ensayos a largo plazo sobre la mortalidad y la morbilidad confirmaron las inquietudes acerca de los posibles efectos secundarios graves de estos dos fármacos. La European Medicines Agency rechazó la autorización de comercialización para fentermina/topiramato debido a los problemas de seguridad, mientras la aplicación para la autorización europea de comercialización de lorcaserina fue retirada por el fabricante después que el Committee for Medicinal Products for Human Use consideró que el equilibrio general efectos beneficiosos / riesgos era negativo.
PICO
Resumen en términos sencillos
Efectos a largo plazo de los fármacos para reducir el peso en los pacientes con presión arterial elevada
Los médicos a menudo recomiendan que los pacientes que tengan sobrepeso u obesidad con presión arterial elevada pierdan peso, lo que puede incluir tomar fármacos contra la obesidad para ayudar en la reducción del peso y la presión arterial. Dos principios activos (rimonabant y sibutramina) se retiraron del mercado en 2009 y 2010, respectivamente. Las guías actuales para el tratamiento farmacológico de la obesidad citan cinco fármacos (orlistat, lorcaserina, fentermina/topiramato, naltrexona/bupropión y liraglutide) que se han autorizado para la reducción del peso a largo plazo por la Food and Drug Administration de los EE.UU. Sin embargo, dos de estos fármacos (fentermina/topiramato y lorcaserina) no obtuvieron autorización en Europa.
Se encontraron pruebas de que orlistat, sibutramina y fentermina/topiramato reducen moderadamente el peso. Orlistat y fentermina/topiramato redujeron la presión arterial, mientras la sibutramina la aumentó. No se encontraron estudios que investigaran rimonabant, liraglutide, lorcaserina o naltrexona/bupropión en pacientes con presión arterial elevada. no hay pruebas de los efectos de estos fármacos sobre la muerte o la morbilidad. Los efectos secundarios más frecuentes fueron los gastrointestinales para el orlistat; sequedad bucal, estreñimiento y cefalea para la sibutramina; y sequedad bucal y parestesias para fentermina/topiramato.
Conclusiones de los autores
Summary of findings
| Orlistat compared with placebo for weight reduction | |||||
| Patient or population: Men and non‐pregnant women ≥ 18 years old with essential hypertension Intervention: Orlistat Comparison: Placebo | |||||
| Outcomes | Illustrative comparative risks (per 1000 patients) | Effect estimate | No of Participants | Quality of the evidence | Comments |
| Change in systolic blood pressure as compared to placebo [mm Hg] from baseline to end of study | Not applicable | MD ‐2.46 [‐4.01, ‐0.90] | 2058 | ⊕⊕⊝⊝ | ‐ |
| Change in diastolic blood pressure as compared to placebo [mm Hg] from baseline to end of study | Not applicable | MD ‐1.92 [‐2.99, ‐0.85] | 2058 | ⊕⊕⊝⊝ | ‐ |
| Change in body weight as compared to placebo [kg] from baseline to end of study | Not applicable | MD ‐3.73 [‐4.65, ‐2.80] | 2080 | ⊕⊕⊕⊝ | ‐ |
| CI: confidence interval; MD: mean difference | |||||
| GRADE Working Group grades of evidence | |||||
| 1High risk of bias in included studies. 2Wide confidence intervals include non‐clinically important effect. | |||||
| Sibutramine compared with placebo for weight reduction | |||||
| Patient or population: Men and non‐pregnant women ≥ 18 years old with essential hypertension Intervention: Sibutramine Comparison: Placebo | |||||
| Outcomes | Illustrative comparative risks (per 1000 patients) | Effect estimates | No of Participants | Quality of the evidence | Comments |
| Change in systolic blood pressure as compared to placebo [mm Hg] from baseline to end of study | Not applicable | Not estimable | See comment | See comment | Variability measurements not available; |
| Change in diastolic blood pressure as compared to placebo [mm Hg] from baseline to end of study | Not applicable | MD 3.16 [1.40, 4.92] | 428 | ⊕⊕⊝⊝ | ‐ |
| Change in body weight as compared to placebo [kg] from baseline to end of study | Not applicable | MD ‐3.74 [‐4.84, ‐2.64] | 574 | ⊕⊕⊝⊝ | ‐ |
| CI: confidence interval; MD: mean difference | |||||
| GRADE Working Group grades of evidence | |||||
| 1High risk of bias in included studies. 2Small number of participants and studies. | |||||
Antecedentes
Descripción de la afección
La hipertensión es un trastorno crónico asociado a un aumento del riesgo de mortalidad y morbilidad cardiovasculares. Se calcula que la hipertensión provoca más de 9 000 000 de muertes por año (WHO 2013). Se ha demostrado que la disminución de los niveles de la presión arterial en los pacientes con hipertensión es un medio efectivo para reducir la morbilidad y la mortalidad cardiovasculares.
De manera sistemática, las investigaciones epidemiológicas han encontrado una asociación entre la hipertensión y los diferentes estilos de vida, entre ellos, el exceso de peso corporal. Las guías principales recomiendan la reducción del peso como una intervención de primera línea en el tratamiento de los pacientes con hipertensión (CHEP 2014; ESH‐ESC 2013; JNC 2014; NICE 2011; WHO 2005). El peso corporal se puede reducir mediante modificaciones en el estilo de vida, así como intervenciones farmacológicas e invasivas.
Descripción de la intervención
En un grupo selecto de personas en las que las intervenciones en el estilo de vida son infructuosas, los fármacos contra la obesidad pueden ser una opción para ayudar a reducir el peso corporal. Anteriormente orlistat, sibutramina y rimonabant fueron los fármacos contra obesidad utilizados con más frecuencia, pero solamente el orlistat todavía tiene autorización en el mercado para el tratamiento a largo plazo de la obesidad. La sibutramina fue autorizada por la Food and Drug Administration (FDA) de los EE.UU. (FDA) en 1997 y por la European Medicines Agency (EMA) en 1999. Sin embargo, los resultados preliminares del Sibutramine Cardiovascular Outcomes Trial (SCOUT 2010), presentaron en octubre de 2009, mostraron un mayor riesgo de eventos cardiovasculares graves (como ataque cardíaco o accidente cerebrovascular) entre los pacientes con enfermedades cardiovasculares comprobadas que recibían sibutramina. Este hecho llevó a la FDA y la EMA a recomendar la suspensión de la autorización de comercialización(EMA 2010; EMA 2010a; FDA 2010). En enero de 2010, Abbot Laboratories estuvo de acuerdo en retirar voluntariamente la sibutramina del mercado europeo (Abbott 2010), y en octubre de 2010 del mercado de los EE.UU.FDA 2010a). Rimonabant recibió autorización reguladora en varios países europeos en 2006, pero no recibió la autorización de la FDA después de que los datos preclínicos y clínicos hicieran surgir inquietudes acerca de una asociación entre la ingesta de rimonabant y un aumento en la incidencia de eventos psiquiátricos adversos que incluyeron el suicidio, una constelación mal definida de signos y síntomas neurológicos y crisis convulsivas (FDA 2007). En octubre de 2008, la EMA recomendó la suspensión del rimonabant del mercado debido a los análisis posteriores a la comercialización recientemente disponibles que demostraron efectos perjudiciales versus placebo (EMA 2008; EMA 2008a). En enero de 2009, la Comisión Europea decidió retirar la autorización de comercialización del rimonabant en todos los países de la Unión Europea (EMA 2009). Desde 2012, cuatro fármacos nuevos (lorcaserina, liraglutide, fentermina/topiramato y naltrexona/bupropión) han sido autorizados por la FDA para los pacientes con obesidad (índice de masa corporal [IMC] ≥ 30 kg/m2) y sobrepeso (IMC ≥ 27 kg/m2) con al menos una comorbilidad relacionada con la obesidad. Estos fármacos se han citado recientemente en las guías para el tratamiento farmacológico a largo plazo de la obesidad (Apovian 2015). En Europa la liraglutide, que también se ha autorizado para el tratamiento de la diabetes mellitus tipo 2 y naltrexona/bupropión se autorizaron para el control del peso en marzo de 2015 por la EMA (EMA 2015; EMA 2015a). En 2013, el fabricante de lorcaserina retiró su aplicación a la EMA después que el Committee for Medicinal Products for Human Use planteó problemas de seguridad (EMA 2013), mientras EMA rechazó la autorización de comercialización para fentermina/topiramato debido a los problemas de seguridad (EMA 2013b).
De qué manera podría funcionar la intervención
Los fármacos contra la obesidad tienen como objetivo reducir el peso corporal y mantener la reducción del peso durante un período más prolongado. El orlistat es un inhibidor de las lipasas gástrica y pancreática; la sibutramina es un inhibidor central de la recaptación de monoaminas; y el rimonabant es un antagonista de los receptores de endocannabinoides (Padwal 2007). La liraglutide, un agonista del receptor de un péptido similar al glucagón 1 (GLP‐1), parece regular el apetito al aumentar la sensación de saciedad (Russell‐Jones 2009). La combinación de fentermina, un neuroestabilizador y topiramato, un fármaco antiepiléptico, parece tener un efecto aditivo sobre la reducción del peso (Aronne 2013). En combinación con la naltrexona, el bupropión, un inhibidor de la recaptación de dopamina y norepinefrina, reduce el apetito y aumenta el gasto de energía (Caixas 2014). Los mecanismos por los que estos tres medicamentos causan pérdida de peso aún no se entienden completamente. La lorcaserina es un agonista selectivo de los receptores de serotonina y aumenta la sensación de plenitud (Taylor 2013). Los estudios con dietas como intervención en pacientes con hipertensión han demostrado una asociación positiva entre la pérdida de peso y la reducción de la presión arterial (Horvath 2008). Por lo tanto, parece razonable suponer que el tratamiento médico que reduce el peso también puede dar lugar a una reducción en la presión arterial.
Por qué es importante realizar esta revisión
En los pacientes con sobrepeso y obesidad con hipertensión establecida, la presión arterial se debe tratar primeramente con intervenciones no farmacológicas, como la reducción del peso (CHEP 2014; ESH‐ESC 2013; JNC 2014; NICE 2011; WHO 2005). Debido a que los fármacos contra la obesidad podrían apoyar los esfuerzos de los pacientes para reducir el peso corporal, es importante que el médico se informe sobre la eficacia y los posibles efectos perjudiciales de estos fármacos antes de prescribirlos.
Las revisiones sistemáticas y metanálisis han demostrado que las intervenciones farmacológicas para la reducción de peso con orlistat, Horvath 2008 y Rucker 2007,rimonabant, Rucker 2007, lorcaserina, Chan 2013, y liraglutide, Zhang 2015, reducen tanto la presión arterial como el peso corporal. El tratamiento con sibutramina, Horvath 2008, Rucker 2007,y Kim 2003, y naltrexona/bupropión,Caixas 2014, redujo el peso corporal, pero no la presión arterial. Ninguna de estas revisiones proporcionó datos que pudieran responder la pregunta de si la reducción farmacológica del peso disminuye el riesgo de mortalidad y otras variables principales de evaluación importantes para los pacientes. Dos estudios que examinaron las variables de evaluación clínicas para rimonabant, CRESCENDO 2010, y sibutramina,SCOUT 2010, han dado lugar a que los fármacos se retiraran del mercado. Este hecho hizo que solamente el orlistat se autorizara para el tratamiento a largo plazo de la obesidad en la última versión actualizada de esta revisión. Desde entonces, la FDA ha autorizado cuatro fármacos nuevos (lorcaserina, fentermina/topiramato, naltrexona/bupropión y liraglutide) para el tratamiento a largo plazo de la obesidad.
Esta revisión sistemática es una actualización de una revisión Cochrane publicada anteriormente (Siebenhofer 2013).
Objetivos
Objetivos primarios:
Evaluar los efectos a largo plazo de la reducción farmacológicamente inducida del peso corporal en adultos con hipertensión esencial sobre la mortalidad por todas las causas, la morbilidad cardiovascular y los eventos adversos (incluidos los eventos adversos graves totales, el retiro debido a eventos adversos y los eventos adversos no graves totales).
Objetivos secundarios:
Evaluar los efectos a largo plazo de la reducción farmacológicamente inducida del peso corporal en adultos con hipertensión esencial sobre el cambio a partir del inicio en la presión arterial sistólica, el cambio a partir del inicio en la presión arterial diastólica y la reducción del peso corporal.
Métodos
Criterios de inclusión de estudios para esta revisión
Tipos de estudios
El diseño del estudio debía cumplir con los siguientes criterios: todos los ensayos controlados aleatorios que compararon intervenciones farmacológicas autorizadas para el control del peso a largo plazo con placebo con un seguimiento de al menos 24 semanas. El motivo para incluir solamente los estudios con un seguimiento de al menos 24 semanas fue que los estudios con duración más corta no pueden mostrar efectos a largo plazo. Se debía haber aplicado cualquier atención activa adicional (por ejemplo, medicación antihipertensiva) al grupo de tratamiento activo y al grupo control.
Tipos de participantes
Hombres y mujeres no embarazadas a partir de los 18 años de edad con hipertensión esencial (presión arterial inicial sistólica de al menos 140 mmHg y diastólica de al menos 90 mmHg o pacientes bajo tratamiento hipotensor), en los que se informó al menos uno de los siguientes resultados: mortalidad, resultados cardiovasculares, eventos adversos o presión arterial.
Tipos de intervenciones
Monoterapia con fármacos para el control del peso a largo plazo (orlistat, sibutramina, rimonabant, fentermina/topiramato, lorcaserina, naltrexona/bupropión o liraglutide).
Tipos de medida de resultado
Resultados primarios
Los resultados primarios fueron mortalidad total, morbilidad cardiovascular y eventos adversos (retiros debido a eventos adversos, eventos adversos relacionados con cierto fármaco contra la obesidad).
Resultados secundarios
Los resultados secundarios fueron los cambios en la presión arterial sistólica, la presión arterial diastólica y el peso corporal.
Results
Description of studies
See: Characteristics of included studies; Characteristics of excluded studies
Results of the search
Our search of the electronic databases yielded 1047 records after correcting for duplication. The consensus was that on the basis of their abstracts, 903 of these were not relevant to the question under study and should be excluded.
The Institute for Quality and Efficiency in Health Care report provided data of an unpublished subgroup analysis of hypertensive people in the Xenical in the Prevention of Diabetes in Obese Subjects (XENDOS) study (IQWiG 2006; XENDOS 2001‐2006). We included the results section of this report and one corresponding citation as two additional publications of potential relevance. We identified no further studies from the reference lists of the included trials and relevant systematic reviews and meta‐analyses. We therefore identified 146 publications for further examination.
Thirty publications describing nine studies finally met the inclusion criteria after screening the full text of the selected publications (see Figure 1 for details of the PRISMA (Preferred Reporting Items for Systematic Reviews and Meta‐Analyses) statement ) (PRISMA 2009). Five publications on a potentially relevant ongoing trial were also among the excluded items because they only described the rationale for conducting the trial and its design (LEADER 2013). For details see Characteristics of ongoing studies.

Study flow diagram
All relevant studies were published after the year 2000 and were written in English, except the report from the Institute for Quality and Efficiency in Health Care, which was published in German.
Included studies
We have provided details of the characteristics of the included studies in the Characteristics of included studies table. The following gives a brief overview of the comparisons between orlistat and placebo, sibutramine and placebo, and phentermine/topiramate and placebo. No relevant study investigating rimonabant, liraglutide, lorcaserin, or naltrexone/bupropion was available for inclusion.
Orlistat vs placebo
All four included studies had a parallel, double‐blind design (Bakris 2002; Cocco 2005; Guy‐Grand 2004; XENDOS 2001‐2006). Only Cocco 2005 did not mention any industry sponsoring, and it was the only study that was performed as a single‐centre trial.
Participants and duration
The four included studies involved a total of 3132 hypertensive participants with a mean age of 46 to 55 years, a baseline systolic blood pressure (BP) of 142 to 154 mm Hg and a baseline diastolic BP of 85 to 98 mm Hg. Mean treatment duration was 6 to 48 months.
Interventions
Participants received either 120 mg orlistat three times daily or placebo in all studies.
Outcomes
Primary outcomes
No study included mortality and cardiovascular morbidity as predefined outcomes. All studies reported adverse events.
Secondary outcomes
All studies described the mean change in systolic and diastolic BP and the mean change in body weight.
Sibutramine vs placebo (marketing approval withdrawn)
All four included studies had a parallel, double‐blind design and mentioned industry sponsorship (Fanghänel 2003; Faria 2002; McMahon 2000; McMahon 2002). Two studies were performed as single‐centre studies (Fanghänel 2003; Faria 2002); the two multicentre studies did not provide information on the numbers of study centres (McMahon 2000; McMahon 2002).
Participants and duration
The four included studies involved a total of 619 hypertensive participants with a mean age of 46 to 53 years, a baseline systolic BP of 129 to 150 mm Hg and a baseline diastolic BP of 82 to 94 mm Hg. Mean treatment duration was 6 to 12 months.
Interventions
Two studies compared 10 mg sibutramine versus placebo once daily (Fanghänel 2003; Faria 2002). In the two other studies (McMahon 2000; McMahon 2002), the initial dose of 5 mg of sibutramine was titrated up to 20 mg once daily within the first eight weeks.
Outcomes
Primary outcomes
No study included mortality and cardiovascular morbidity as predefined outcomes. All studies reported on adverse events.
Secondary outcomes
All studies described the mean change in systolic and diastolic BP and the mean change in body weight.
Phentermine/topiramate vs placebo
The new included study was a multicentre study with 93 study sites in the US (CONQUER 2013). The study had a parallel, double‐blind design and the industry sponsor was mentioned.
Participants and duration
The included study involved a total of 1305 participants in the hypertensive subgroup with a mean age of 53 years, a mean baseline systolic BP of 134 mm Hg and a mean baseline diastolic BP of 84 mm Hg. Among the hypertensive subgroup, 216 participants had uncontrolled hypertension at baseline. The treatment duration was 56 weeks.
Interventions
The study compared two different dose regimens of phentermine/topiramate once daily versus placebo. All participants in the active groups received an initial dose of 7.5 mg phentermine and 23 mg topiramate. During an initial four‐week titration period, doses were increased weekly (3.75 mg phentermine and 23 mg topiramate) until the assigned dosages of 7.5 mg phentermine/46.0 mg topiramate (group low dose) or 15 mg phentermine/92.0 mg topiramate (group high dose) were achieved. The assigned dosages were maintained for 52 weeks.
Outcomes
Primary outcomes
The study did not include mortality and cardiovascular morbidity as predefined outcomes. Adverse events were reported.
Secondary outcomes
The study described the mean change in systolic and diastolic BP and the mean percentage change in body weight.
Excluded studies
The main reason for exclusion was a lack of data for the hypertensive subgroup in studies including normotensive as well as hypertensive participants. Other reasons for exclusion were not describing a randomised controlled trial, not including participants with essential hypertension, having a duration of intervention less than 24 weeks, reporting outcomes that were not relevant for this review, or including different accompanying antihypertensive therapies in the study groups. Reasons for excluding each trial are provided in the Characteristics of excluded studies table.
Risk of bias in included studies
The judgements of the risk of bias for all included studies are shown in the 'Risk of bias' summary figures (Figure 2; Figure 3). For details see the 'Risk of bias' tables in Characteristics of included studies. The following provides a brief overview.

Risk of bias graph: review authors' judgements about each risk of bias item presented as percentages across all included studies.

Risk of bias summary: review authors' judgements about each risk of bias item for each included study.
Allocation
Orlistat vs placebo
In one study the method of randomisation was not reported (Bakris 2002), and in two studies the method of concealment was not described (Bakris 2002; Cocco 2005).
Sibutramine vs placebo (marketing approval withdrawn)
Only one study adequately described the method of randomisation and concealment (Fanghänel 2003).
Phentermine/topiramate vs placebo
The included study adequately described the method of randomisation and concealment (CONQUER 2013).
Blinding
Orlistat vs placebo
While all included trials were described as double blind, three trials provided too little information, and the blinding of participants and key study personnel was uncertain (Bakris 2002; Cocco 2005; Guy‐Grand 2004). Based on the authors' information, we can only assume that blinding took place throughout the duration of one study (Cocco 2005).
Sibutramine vs placebo (marketing approval withdrawn)
While all included trials were described as double blind, two trials provided too little information, and the blinding of participants and key study personnel was uncertain (McMahon 2000; McMahon 2002). In the other studies, we can assume that blinding occurred throughout the study duration for participants and study personnel, but no information was available on the blinding of outcome assessors.
Phentermine/topiramate vs placebo
The included study was described as double blind. The investigators, participants, and study sponsors were masked to treatment assignment, and all study drugs were administered as capsules that were identical in size and appearance (CONQUER 2013).
Incomplete outcome data
Orlistat vs placebo
In two studies, the outcome data description was complete: Cocco 2005 had no losses to follow‐up, and Bakris 2002 described all reasons for withdrawals and losses to follow‐up.
In Guy‐Grand 2004, withdrawals were only reported for the whole study population and not for the hypertensive subgroup, and in XENDOS 2001‐2006, the documentation of reasons for withdrawals was incomplete.
Sibutramine vs placebo (marketing approval withdrawn)
In none of the studies were outcome data adequately assessed. In Fanghänel 2003, 14% of randomised participants were not analysed, and Faria 2002 presented only a completers analysis. In both McMahon studies (McMahon 2000; McMahon 2002), some reasons for participants’ withdrawal from the study were not reported.
Phentermine/topiramate vs placebo
The total number of withdrawals was only reported for the whole study population and not for the hypertensive subgroup of the study (CONQUER 2013). For the hypertensive subgroup, only the number of withdrawals due to adverse events was reported, therefore the documentation of reasons for withdrawals was incomplete.
Selective reporting
Orlistat vs placebo
As either no study protocol was provided (Bakris 2002; Cocco 2005; Guy‐Grand 2004), or no full publication was obtainable (XENDOS 2001‐2006), or more outcomes were reported than were prespecified (Bakris 2002), we classified the risk of bias for selective reporting as uncertain for all studies.
Sibutramine vs placebo (marketing approval withdrawn)
In none of the trials was a study protocol available. In addition, one study showed inconsistencies between different publications (Faria 2002), and another study had an inconsistent participant flow (Fanghänel 2003). We thus classified the risk of bias for selective reporting as uncertain for all studies.
Phentermine/topiramate vs placebo
No study protocol was available for the study (CONQUER 2013). We thus classified the risk of bias for selective reporting as uncertain.
Other potential sources of bias
Orlistat vs placebo
No trial included in the review reported any significant differences between groups in the main characteristics of participants at baseline. However, in Bakris 2002 and XENDOS 2001‐2006, the combination of a high withdrawal rate and the unknown length of involvement of participants in the trial increases the risk of bias, even when last observation carried forward (LOCF) analysis is used.
Sibutramine vs placebo (marketing approval withdrawn)
Two studies provided only completers analyses with a high withdrawal rate (Fanghänel 2003; Faria 2002). In the two other trials, the unknown length of involvement of participants in the trial increases risk of bias, even when LOCF analysis is used (McMahon 2000; McMahon 2002).
Phentermine/topiramate vs placebo
We could identify no other potential source of bias in the included study (CONQUER 2013).
Effects of interventions
See: Summary of findings for the main comparison Summary of findings for orlistat versus placebo; Summary of findings 2 Summary of findings for sibutramine versus placebo
Orlistat vs placebo
See: summary of findings Table for the main comparison
Primary outcomes
Mortality
Three of four studies reported on mortality. No deaths were reported in either Bakris 2002 or Cocco 2005. In XENDOS 2001‐2006, there were two deaths in the orlistat‐treated group in the first subgroup analysis (diastolic BP ≥ 90 mm Hg) and one death in the orlistat group in the second subgroup analysis (systolic BP ≥ 140 mm Hg).
Cardiovascular morbidity
Two studies presented data on cardiovascular morbidity. In Bakris 2002, two participants in the orlistat group suffered a myocardial infarction, two had chest pain, and one had an episode of atrial fibrillation. In the placebo group, one participant had a myocardial infarction, one had worsening atherosclerotic coronary artery disease, and two had an episode of chest pain. Cocco 2005 reported that in participants with resting left ventricular ejection fraction (LVEF) below 50% at baseline, LVEF did not change with placebo (0.6%), but was increased by 4.3% in the orlistat group (P < 0.001).
Adverse events
For details on adverse events see Table 1.
| Study | Adverse events | Results |
| Orlistat vs placebo | ||
| Bakris 2002 | total thereof leading to withdrawal serious gastrointestinal thereof leading to withdrawal musculoskeletal | 89% of P [O] vs 71% of P [P], P < 0.001 7% [O] vs 7% [P] 14 P (12%) [O] vs 15 P (9%) [P] 200 P (73%) [O] vs 120 P (44%) [P], P < 0.001 15 P (8%) [O] vs 6 P (5%) [P] 23% of P [O] vs 16% [P], P < 0.05 |
| Cocco 2005 | total serious gastrointestinal | nr 0 P [O] vs 0 P [P] 16 P (36%) [O]a vs 11 P (24%) [P]a |
| Guy‐Grand 2004 | total serious | nrb nrb |
| XENDOS 2001‐2006 | total leading to withdrawal serious gastrointestinal musculoskeletal nervous system dermatological vascular | 99% of P [OD] vs 96% of P [PD] 99% of P [OS] vs 97% of P [PS] 9% of P [OD] vs 4% of P [PD] 9% of P [OS] vs 4% of P [PS] 18% of P [OD] vs 12% of P [PD] 18% of P [OS] vs 12% of P [PS] 93% of P [OD] vs 70% of P [PD] 93% of P [OS] vs 71% of P [PS] 65% of P [OD] vs 62% of P [PD] 65% of P [OS] vs 63% of P [PS] 39% of P [OD] vs 39% of P [PD] 40% of P [OS] vs 37% of P [PS] 20% of P [OD] vs 17% of P [PD] 22% of P [OS] vs 17% of P [PS] 17% of P [OD] vs 19% of P [PD] 17% of P [OS] vs 19% of P [PS] |
| Sibutramine vs placebo | ||
| Fanghaenel 2003 | total constipation dizziness dry mouth headache insomnia restlessness | 14 P (21 E) [S] vs 13 P (20 E) [P] 4 P [S] vs 2 P [P] 1 P [S] vs 1 P [P] 4 P [S] vs 2 P [P] 5 P [S] vs 2 P [P] 1 P [S] vs 1 P [P] 1 P [S] vs 0 P [P] |
| Faria 2002‐2005 | total dry mouth arthralgia | nr 37% of P [S] vs 9% of P [P], P < 0.005 16% of P [S] vs 2% of P [P], P = 0.03 |
| McMahon 2002 | total serious treatment related leading to withdrawal (mostly hypertension) dry mouth headache | 141 P (97%) [S] vs 65 P (88%) [P] 9 P (6%) [S] vs 5 P (7%) [P] 2 E [S] vs 0 E [P] 23 P (16%) [S] vs 4 P (5%) [P] 30 P (21%) [S] vs 0 P [P] 41 P (28%) [S] vs 17 P (23%) [P] |
| McMahon 2000 | total leading to withdrawal (mostly hypertension) dry mouth headache constipation rash | nr 30 P (20%) [S] vs 8 P (11%) [P] 29 P (19%) [S] vs 2 P (3%) [P], P < 0.05 37 P (25%) [S] vs 21 P (28%) [P] 25 P (17%) [S] vs 2 P (3%) [P], P < 0.05 16 P (11%) [S] vs 2 P (3%) [P] |
| Phentermine/topiramate vs placebo | ||
| CONQUER 2013 | total leading to withdrawal serious cardiac adverse events dry mouth paresthaesia constipation upper respiratory tract infection nasopharyngitis dysgeusia insomnia headache dizziness sinusitis | 85.4% vs 88.8% vs 77.3% 11.9% vs 19.8% vs 9.7% 3.4% (Phen/Top [LD]) vs 3.7% (Phen/Top [HD]) vs 4.2% [P] 0.8% vs 1.2% vs 0.6% 14.2% (Phen/Top [LD]) vs 22.7% (Phen/Top [HD]) vs 2.3% [P] 14.2% (Phen/Top [LD]) vs 22.3% (Phen/Top [HD]) vs 2.3% [P] 15.7% (Phen/Top [LD]) vs 18.1% (Phen/Top [HD]) vs 5.5% [P] 12.6% (Phen/Top [LD]) vs 12.1% (Phen/Top [HD]) vs 11.8% [P] 10.3% (Phen/Top [LD]) vs 10.2% (Phen/Top [HD]) vs 8.8% [P] 7.7% (Phen/Top [LD]) vs 11.0% (Phen/Top [HD]) vs 0.8% [P] 5.7% (Phen/Top [LD]) vs 11.0% (Phen/Top [HD]) vs 4.8% [P] 5.0% (Phen/Top [LD]) vs 10.8% (Phen/Top [HD]) vs 8.4% [P] 6.5% (Phen/Top [LD]) vs 12.1% (Phen/Top [HD]) vs 3.1% [P] 5.4% (Phen/Top [LD]) vs 8.3% (Phen/Top [HD]) vs 6.5% [P] |
E: events. nr: not reported. [O]: orlistat. [OD]: orlistat and diastolic blood pressure ≥ 90 mm Hg. [OS]: orlistat and systolic blood pressure ≥ 140 mm Hg. P: participants. [P]: placebo. Phen/Top [HD]: phentermine/topiramate high dose (15 mg/92 mg). Phen/Top [LD]: phentermine/topiramate low dose (7.5 mg/46 mg). [PD]: placebo and diastolic blood pressure ≥ 90 mm Hg. [PS]: placebo and systolic blood pressure ≥ 140 mm Hg. [S]: sibutramine.
aNo data on adverse events were reported for the whole study duration. The data above refer to 4 and 3 weeks of treatment in the orlistat and placebo group, respectively. After 3 months, the number of participants with events decreased to 5(11%)[O] with flatulence and mild abdominal cramps versus 6(13%)[P] with nausea and hunger feeling.
bData were not available for the hypertensive subgroup, only for the whole study population (withdrawal due to defecation troubles in 10 [O] versus 2 [P] participants).
At least one adverse event was reported by significantly more participants in the orlistat‐treated group (89%) than in the placebo‐treated group (71%) with a P value of < 0.001. Of those, 7% of participants in the orlistat group versus 7% of participants in the placebo group withdrew. Twelve per cent of all adverse events in the orlistat‐treated group versus 9% in the placebo‐treated group were classified as serious adverse events, and none was classified as being related to study medication. Gastrointestinal side effects were significantly higher in the orlistat‐treated group than in the placebo group (73% versus 44%; P < 0.001); 8% of those participants in the orlistat group and 5% in the placebo group stopped taking the medication for this reason. Musculoskeletal side effects were also reported significantly more often in the orlistat versus the placebo group (23% versus 16%, P < 0.05).
As reported by the authors, side effects were mild. No overall adverse events were reported. Gastrointestinal side effects were the most common adverse events and were described for 24% of the placebo group within the first three weeks and for 36% of the orlistat group within the first four weeks.
Data were only presented for the whole study group, no information on the hypertensive subgroup was provided.
First subgroup (diastolic BP ≥ 90 mm Hg): Side effects were reported in 99% of participants in the orlistat and 96% of participants in the placebo group. Eighteen per cent of participants in the orlistat group and 12% of participants in the placebo group experienced severe adverse events. Gastrointestinal side effects were more common in the orlistat versus the placebo group (93% versus 70%). Musculoskeletal, nervous, dermatological, and vascular events were comparable in both treatment groups. Nine per cent withdrew due to side effects in the orlistat versus 4% in the placebo group, but it is not clear whether the reported side effects were study drug related.
Second subgroup (systolic BP ≥ 140 mm Hg): Side effects were reported in 99% of participants in the orlistat and 97% of participants in the placebo group. Eighteen per cent of participants in the orlistat group and 12% of participants in the placebo group experienced severe adverse events. Gastrointestinal side effects were more common in the orlistat versus the placebo group (93% versus 71%). Musculoskeletal, nervous, dermatological, and vascular events were comparable in both treatment groups. Nine per cent withdrew due to side effects in the orlistat versus 4% in the placebo group. It is not clear whether the reported side effects were study drug related.
Secondary outcomes
For details on secondary outcome data see Table 2, Table 3, Table 4. Due to between‐study variability, we have presented results from random‐effects models in the following analyses.
| Study | Baselinea | 6 moa | 12 moa | 48 moa | Change from baseline to endpointa |
| Orlistat vs placebo | |||||
| Bakris 2002b Orlistat Placebo | 101 (1)c 102 (1)c | nr nr | nr nr | ‐ ‐ | P < 0.001 ‐5.4 (6.4) ‐2.7 (6.4) |
| Cocco 2005 Orlistat Placebo | 107 (6) 106 (6) | 102 (4) 104 (5) | ‐ ‐ | ‐ ‐ | P < 0.001 ‐5.4d ‐2.5d |
| Guy‐Grand 2004 Orlistat Placebo | 94 (1)c 94 (1)c | nr nr | ‐ ‐ | ‐ ‐ | P < 0.0001 ‐5.8 (0.3) ‐1.8 (0.2) |
| XENDOS 2001‐2006 Orlistat [OD] Placebo [PD] Orlistat [OS] Placebo [PS] | 117 (18) 115 (18) 117 (17) 116 (18) | 106 (17) 108 (18) 106 (17) 109 (18) | 105 (18) 108 (19) 105 (17) 110 (19) | 110 (19) 111 (20) 110 (18) 113 (19) | P < 0.001 ‐6.6 (8.6) ‐3.8 (7.8) P < 0.001 ‐6.8 (8.7) ‐3.2 (7.4) |
| Sibutramine vs placebo | |||||
| Fanghaenel 2003 Sibutramine Placebo | 75 (10) 78 (9) | 70 (10) 75 (9) | ‐ ‐ | ‐ ‐ | significant ‐5.5 (‐3.8; ‐7.1)e ‐3.4 (‐1.9; ‐5.0)e |
| Faria 2002‐2005 Sibutramine Placebo | 100 (19) 97 (14) | 93 (18) 94 (15) | ‐ ‐ | ‐ ‐ | P < 0.001 ‐6.8 (2.3) ‐2.4 (4.2) |
| McMahon 2002 Sibutramine Placebo | 97 (16) 99 (14) | nr nr | nr nr | ‐ ‐ | P < 0.05 ‐4.5 ‐0.4 |
| McMahon 2000 Sibutramine Placebo | 97 (13) 96 (17) | nr nr | nr nr | ‐ ‐ | P < 0.05 ‐4.4 ‐0.5 |
| Phentermine/topiramate vs placebo | |||||
| CONQUER 2013 Phen/Top [LD] Phen/Top [HD] Placebo | 104 (18)f | nr nr nr | nr nr nr | ‐ ‐ ‐ | P < 0.0001g ‐8.1% ‐10.1% ‐1.9% |
Mo: months. nr: not reported. [O]: orlistat. [OD]: orlistat and diastolic blood pressure ≥ 90 mm Hg. [OS]: orlistat and systolic blood pressure ≥ 140 mm Hg. P: participants. [P]: placebo. Phen/Top [HD]: phentermine/topiramate high dose (15 mg/92 mg). Phen/Top [LD]: phentermine/topiramate low dose (7.5 mg/46 mg). [PD]: placebo and diastolic blood pressure ≥ 90 mm Hg. [PS]: placebo and systolic blood pressure ≥ 140 mm Hg. [S]: sibutramine. SD: standard deviation.
aMean kg (SD), unless otherwise indicated.
bData are reported for 267 of 278 [O] and 265 of 276 [P] participants only.
cReported as being the standard deviation but probably the standard error due to its small number.
dPublished values are different, but data were corrected after personal communication with the author.
e95% confidence interval.
fReported only combined for all three study groups.
gFor each intervention group versus placebo.
| Study | Baselinea | 6 moa | 12 moa | 48 moa | Change from baseline to endpointa |
| Orlistat vs placebo | |||||
| Bakris 2002b Orlistat Placebo | 154 (13) 151 (13) | nr nr | nr nr | ‐ ‐ | ns ‐13.3 (15.2) ‐11.0 (15.0) |
| Cocco 2005 Orlistat Placebo | 146 (10) 142 (6) | 142 (13) 141 (9) | ‐ ‐ | ‐ ‐ | P = 0.025 ‐4.3 ‐0.9 |
| Guy‐Grand 2004 Orlistat Placebo | 150 (1)c 152 (1)c | nr nr | ‐ ‐ | ‐ ‐ | ns ‐9.8 (1) ‐9.8 (1) |
| XENDOS 2001‐2006 Orlistat [OD]d Placebo [PD]d Orlistat [OS]d Placebo [PS]d | 146 (13) 146 (12) 149 (10) 149 (8) | 135 (14) 136 (15) 125 (14) 138 (14) | 135 (14) 138 (16) 135 (14) 140 (14) | 137 (15) 139 (16) 138 (15) 140 (15) | P = 0.024 ‐8.8 (14.8) ‐6.4 (15.1) P < 0.002 ‐11.5 (14.9) ‐8.6 (14.3) |
| Sibutramine vs placebo | |||||
| Fanghaenel 2003e Sibutramine Placebo | 139 (9) 139 (13) | 125 (9) 123 (10) | ‐ ‐ | ‐ ‐ | ns ‐13.9f ‐16.5f |
| Faria 2002‐2005 Sibutramine Placebo | 150 (18) 150 (15) | 146 (15) 149 (22) | ‐ ‐ | ‐ ‐ | ns ‐4.6f ‐0.6f |
| McMahon 2002 Sibutramine Placebo | 129 (11) 129 (11) | nr nr | 133 130 | ‐ ‐ | P = 0.0497 3.8 1.1 |
| McMahon 2000 Sibutramine Placebo | 134 (10) 134 (11) | nr nr | nr nr | ‐ ‐ | ns 2.7 1.5 |
| Phentermine/topiramate vs placebo | |||||
| CONQUER 2013 Phen/Top [LD] Phen/Top [HD] Placebo | 134 (nr) 133 (nr) 135 (nr) | nr nr nr | nr nr nr | ‐ ‐ ‐ | P = 0.0475 [LD] P < 0.0001 [HD] ‐6.9 ‐9.1 ‐4.9 |
Mo: months. nr: not reported. [O]: orlistat. [OD]: orlistat and diastolic blood pressure ≥ 90 mm Hg. [OS]: orlistat and systolic blood pressure ≥ 140 mm Hg. P: participants. [P]: placebo. Phen/Top [HD]: phentermine/topiramate high dose (15 mg/92 mg). Phen/Top [LD]: phentermine/topiramate low dose (7.5 mg/46 mg). [PD]: placebo and diastolic blood pressure ≥ 90 mm Hg. [PS]: placebo and systolic blood pressure ≥ 140 mm Hg. [S]: sibutramine. SD: standard deviation.
aMean mm Hg (SD), unless otherwise indicated.
bData are reported for 267 of 278 [O] and 265 of 276 [P] participants only.
cReported as being the standard deviation but probably the standard error due to its small number.
dBased on last observation carried forward data on 399 [OD], 423 [PD], 493 [OS], and 504 [PS] participants.
eData at baseline were recorded after a two‐week wash‐out period of antihypertensive drugs for diagnostic confirmation of hypertension.
fCalculated.
| Study | Baselinea | 6 moa | 12 moa | 48 moa | Change from baseline to endpointa |
| Orlistat vs placebo | |||||
| Bakris 2002b Orlistat Placebo | 98 (4) 98 (4)c | nr nr | nr nr | ‐ ‐ | P = 0.002 ‐11.4 (8.3) ‐9.2 (8.4) |
| Cocco 2005 Orlistat Placebo | 88 (7) 85 (6) | 84 (9) 85 (7) | ‐ ‐ | ‐ ‐ | P = 0.012 ‐3.6 ‐0.8 |
| Guy‐Grand 2004 Orlistat Placebo | 97 (0)d 97 (0)d | nr nr | ‐ ‐ | ‐ ‐ | ns ‐7.5 (0.6) ‐7.3 (0.6) |
| XENDOS 2001‐2006 Orlistat [OD]e Placebo [PD]e Orlistat [OS]e Placebo [PS]e | 95 (6) 95 (5) 91 (9) 91 (8) | 86 (8) 88 (9) 84 (9) 87 (9) | 86 (8) 88 (10) 85 (9) 88 (10) | 87 (9) 89 (10) 86 (9) 88 (10) | P < 0.006 ‐8.1 (9.3) ‐6.2 (9.9) P < 0.001 ‐5.0 (9.9) ‐3.0 (10.4) |
| Sibutramine vs placebo | |||||
| Fanghaenel 2003f Sibutramine Placebo | 93 (7) 92 (8) | 82 (5) 80 (5) | ‐ ‐ | ‐ ‐ | ns ‐11.4g ‐11.7g |
| Faria 2002‐2005 Sibutramine Placebo | 91 (12) 94 (12) | 92 (13) 92 (14) | ‐ ‐ | ‐ ‐ | ns 1.0g ‐2.06g |
| McMahon 2002 Sibutramine Placebo | 82 (6) 83 (6) | nr nr | 86 83 | ‐ ‐ | P = 0.004 3.0 ‐0.1 |
| McMahon 2000 Sibutramine Placebo | 84 (5) 84 (6) | nr nr | nr nr | ‐ ‐ | P < 0.05 2.0 ‐1.3 |
| Phentermine/topiramate vs placebo | |||||
| CONQUER 2013 Phen/Top [LD] Phen/Top [HD] Placebo | 83 (nr) 83 (nr) 85 (nr) | nr nr nr | nr nr nr | ‐ ‐ ‐ | P = 0.0400 [LD] P = 0.0003 [HD] ‐5.2 ‐5.8 ‐3.9 |
Mo: months. nr: not reported. [O]: orlistat. [OD]: orlistat and diastolic blood pressure ≥ 90 mm Hg. [OS]: orlistat and systolic blood pressure ≥ 140 mm Hg. P: participants. [P]: placebo. Phen/Top [HD]: phentermine/topiramate high dose (15 mg/92 mg). Phen/Top [LD]: phentermine/topiramate low dose (7.5 mg/46 mg). [PD]: placebo and diastolic blood pressure ≥ 90 mm Hg. [PS]: placebo and systolic blood pressure ≥ 140 mm Hg. [S]: sibutramine. SD: standard deviation.
aMean mm Hg (SD), unless otherwise indicated.
bData are reported for 267 of 278 [O] and 265 of 276 [P] participants only.
cThe standard deviation was published as being 35 but should probably be 3.5.
dReported as being the standard deviation but probably the standard error due to its small number.
eBased on last observation carried forward data on 399 [OD], 423 [PD], 493 [OS], and 504 [PS] participants.
fData at baseline were recorded after a two‐week wash‐out period of antihypertensive drugs for diagnostic confirmation of hypertension.
gCalculated.
Changes in systolic blood pressure
We could include all four studies investigating the effects of orlistat on systolic BP in the meta‐analysis. For the XENDOS study (XENDOS 2001‐2006), we used the results after 12 months’ study duration for the subgroup of participants with diastolic BP ≥ 90 mm Hg at baseline for the analysis. There was a significant reduction in systolic BP with a mean difference (MD) of ‐2.5 mm Hg (95% confidence interval (CI) ‐4.0 to ‐0.9) in favour of orlistat. The test of heterogeneity gave a P value of 0.2 (I2 = 36%) (see Analysis 1.1, Figure 4). Differences in study quality could not explain heterogeneity. We could deduce no plausible explanation for heterogeneity from differences in study design, study duration, sample sizes, interventions, or characteristics of included participants.
![Forest plot of comparison: 1 Orlistat versus placebo, outcome: 1.1 Change in systolic blood pressure from baseline to endpoint [mm Hg].](/cdsr/doi/10.1002/14651858.CD007654.pub4/media/CDSR/CD007654/rel0004/CD007654/image_n/nCD007654-AFig-FIG04.png)
Forest plot of comparison: 1 Orlistat versus placebo, outcome: 1.1 Change in systolic blood pressure from baseline to endpoint [mm Hg].
Changes in diastolic blood pressure
We could include all four studies investigating the effects of orlistat on diastolic BP in the meta‐analysis. For the XENDOS study (XENDOS 2001‐2006), we used the results for the subgroup of participants with diastolic BP ≥ 90 mm Hg at baseline (subgroup 1) after 12 months' study duration for the analysis. Diastolic BP was also significantly reduced in participants treated with orlistat with a MD of ‐1.9 mm Hg (95% CI ‐3.0 to ‐0.9). The test of heterogeneity gave a P value of 0.1 (I2 = 47%) (see Analysis 1.2, Figure 5). Differences in study quality could not explain heterogeneity. We could deduce no plausible explanation for heterogeneity from differences in study design, study duration, sample sizes, interventions, or characteristics of included participants.
![Forest plot of comparison: 1 Orlistat versus placebo, outcome: 1.2 Change in diastolic blood pressure from baseline to endpoint [mm Hg].](/cdsr/doi/10.1002/14651858.CD007654.pub4/media/CDSR/CD007654/rel0004/CD007654/image_n/nCD007654-AFig-FIG05.png)
Forest plot of comparison: 1 Orlistat versus placebo, outcome: 1.2 Change in diastolic blood pressure from baseline to endpoint [mm Hg].
Body weight
Orlistat was found to lower body weight significantly more effectively than placebo in all studies. The meta‐analysis of orlistat studies obtained a MD of ‐3.7 kg (95% CI ‐4.7 to ‐2.8). The test of heterogeneity gave a P value of 0.03 (I2 = 66%) (see Analysis 1.3, Figure 6). Differences in study quality could not explain heterogeneity. We could deduce no plausible explanation for heterogeneity from differences in study design, study duration, sample sizes, interventions, or characteristics of included participants.
![Forest plot of comparison: 1 Orlistat versus placebo, outcome: 1.3 Change in body weight from baseline to endpoint [kg].](/cdsr/doi/10.1002/14651858.CD007654.pub4/media/CDSR/CD007654/rel0004/CD007654/image_n/nCD007654-AFig-FIG06.png)
Forest plot of comparison: 1 Orlistat versus placebo, outcome: 1.3 Change in body weight from baseline to endpoint [kg].
Subgroup analyses
Not performed due to lack of data.
Sensitivity analyses
Not performed due to lack of data.
Publication and small‐study bias
A clear interpretation of the funnel plot was not possible, which we mainly attributed to the relatively small number of included studies.
Sibutramine vs placebo (marketing approval withdrawn)
See: summary of findings Table 2
Primary outcomes
Mortality
Only one study reported on mortality (McMahon 2002), and there were no deaths in either treatment group.
Cardiovascular morbidity
None of the four studies presented data on cardiovascular morbidity.
Adverse events
For details on adverse events see Table 1.
In the sibutramine group, 14 participants reported 21 adverse events. In the placebo group, 13 participants reported 20 adverse events. None of the adverse events were associated with withdrawals from treatment. The most common adverse events in the sibutramine group were constipation, headache, and dry mouth.
Overall numbers of adverse events were not reported. Dry mouth occurred significantly more often in the sibutramine group (37%) versus in the placebo group (9%) (P < 0.005). Participants also suffered significantly more often from arthralgia in the sibutramine group (16%) versus in the placebo group (2%) (P value = 0.03).
Side effects were reported in 97% of participants in the sibutramine group versus 88% of participants in the placebo group, which was not statistically significantly different. Sixteen per cent of participants in the sibutramine group versus 5% in the placebo group discontinued because of adverse events. The main reason for discontinuation was a protocol‐defined increase in blood pressure. The rates of withdrawal due to hypertension did not differ between the groups (P > 0.05). As absolute numbers were missing, we could not discern a trend in favour of either sibutramine or placebo. Headache and dry mouth were the most frequent side effects in the sibutramine group. The rates of serious adverse events of 6% in the sibutramine group versus 7% in the placebo group were comparable. Two events in the sibutramine group versus no events in the placebo group were possibly related to study drug.
Overall numbers of adverse events and serious adverse events were not reported. Twenty per cent of participants in the sibutramine group versus 11% in the placebo group discontinued because of adverse events. The main reason for discontinuation was high blood pressure, reported in 5% of participants in the sibutramine group versus 1% in the placebo group. Dry mouth (19% versus 3%) and constipation (17% versus 3%) were the most frequent side effects in the sibutramine group, with P < 0.05 for both comparisons.
Secondary outcomes
For details on secondary outcome data see Table 2, Table 3, Table 4.
Changes in systolic blood pressure
As variability measurements were not available, a meta‐analysis was not possible. In two studies blood pressure decreased until study end in both treatment arms (Fanghänel 2003; Faria 2002). In one of these studies, the decrease in the placebo group was greater than in the sibutramine group, without reaching statistical significance (Fanghänel 2003). In the other study, systolic BP decreased more in the sibutramine group without reaching statistical significance (Faria 2002). The other two studies found an increase in systolic BP between baseline and follow‐up. In one study, the mean increase in systolic BP between the treatment groups was statistically higher in the sibutramine group with a P value of 0.05 (McMahon 2002). The last study also showed a more pronounced increase in systolic BP in the sibutramine group versus the placebo group, but it was not statistically significant (McMahon 2000).
Changes in diastolic blood pressure
We could include two studies investigating the effects of sibutramine on diastolic BP in a meta‐analysis. For McMahon 2000 and McMahon 2002, we could calculate standard deviations from provided P values. No variability measurements were available for the other studies (Fanghänel 2003; Faria 2002).
A combined analysis for the diastolic BP of the remaining two studies by McMahon showed a statistically significant difference between sibutramine and placebo, with a detrimental effect in participants treated with sibutramine with a MD +3.2 mm Hg (95% CI +1.4 to +4.9) (McMahon 2000;McMahon 2002). The test of heterogeneity gave a P value of 0.9 (I2 = 0%) (see Analysis 2.1, Figure 7).
![Forest plot of comparison: 2 Sibutramine versus placebo, outcome: 2.1 Change in diastolic blood pressure from baseline to endpoint [mm Hg].](/cdsr/doi/10.1002/14651858.CD007654.pub4/media/CDSR/CD007654/rel0004/CD007654/image_n/nCD007654-AFig-FIG07.png)
Forest plot of comparison: 2 Sibutramine versus placebo, outcome: 2.1 Change in diastolic blood pressure from baseline to endpoint [mm Hg].
The other two studies showed the following results: One study reported a decrease in diastolic BP in both treatment groups (Fanghänel 2003), without any statistically significant difference between the groups. In the other study (Faria 2002), diastolic BP decreased in the placebo group only, whereas an increase in diastolic BP in the sibutramine group was observed. This difference was not statistically significantly different.
Body weight
Sibutramine was found to lower body weight significantly more effectively than placebo in all four studies. The meta‐analysis of sibutramine studies obtained a MD of ‐3.7 kg (95% CI ‐4.8 to ‐2.6). The test of heterogeneity gave a P value of 0.4 (I2 = 3%) (see Analysis 2.2, Figure 8).
![Forest plot of comparison: 2 Sibutramine versus placebo, outcome: 2.2 Change in body weight from baseline to endpoint [kg].](/cdsr/doi/10.1002/14651858.CD007654.pub4/media/CDSR/CD007654/rel0004/CD007654/image_n/nCD007654-AFig-FIG08.png)
Forest plot of comparison: 2 Sibutramine versus placebo, outcome: 2.2 Change in body weight from baseline to endpoint [kg].
Heterogeneity
The meta‐analysis performed provided homogeneous results.
Subgroup analyses
Not performed due to lack of data.
Sensitivity analyses
Not performed due to lack of data.
Publication and small‐study bias
A clear interpretation of the funnel plot was not possible, which we attributed to the small number of included studies.
Phentermine/topiramate vs placebo
Primary outcomes
Mortality
It was reported that only one participant in the placebo group in the dyslipidaemia subgroup died during the study. There were no deaths in the hypertensive subgroup (CONQUER 2013).
Cardiovascular morbidity
In CONQUER 2013, 2.3% of the hypertensive participants in the 7.5 mg phentermine/46 mg topiramate group, 3.7% in the 15 mg phentermine/92 mg topiramate group, and 1.7% of the placebo group experienced treatment‐emergent cardiovascular adverse events. Palpitations occurred in 0.8%, 1.2%, and 0.6% of the hypertensive participants, respectively. Serious adverse cardiac events occurred in six hypertensive participants and serious adverse vascular events in two hypertensive participants, but it was not reported which treatment group these participants belonged to.
Adverse events
For details on adverse events see Table 1.
In the hypertensive subgroup, treatment‐emergent adverse events were reported in 85.4% of participants in the 7.5 mg/46 mg phentermine/topiramate group, 88.8% of participants in the 15 mg/92 mg phentermine/topiramate group and 77.3% of participants in the placebo group. Serious adverse events occurred in 3.4% (7.5 mg/46 mg group) and 3.7% (15 mg/92 mg group) of the hypertensive participants treated with phentermine/topiramate and in 4.2% of participants in the placebo group. The most common treatment‐emergent adverse events in the phentermine/topiramate groups were dry mouth (14.2% (7.5 mg/46 mg group) and 22.7%(15 mg/92 mg group)) and paresthaesia (14.2% (7.5 mg/46 mg group) and 22.3%(15 mg/92 mg group)) when compared to placebo (2.3% for each outcome).
Secondary outcomes
For details on secondary outcome data see Table 2, Table 3, Table 4.
Changes in systolic blood pressure
In hypertensive participants, greater reductions in systolic BP were noted in the phentermine/topiramate groups than in the placebo group (‐6.9 mm Hg (7.5 mg/46 mg group) and ‐9.1 mm Hg (15 mg/92 mg group) versus ‐4.9 mm Hg; P = 0.047 and P < 0.0001 for comparisons). Compared with placebo, a greater percentage of phentermine/topiramate‐treated participants with uncontrolled hypertension at baseline (≥ 140/90 mm Hg; placebo n = 104; 7.5 mg/46 mg n = 40; 15 mg /92 mg n = 72) achieved the BP goal of 140/90 mm Hg by week 56: 52.9% in the placebo group, 62.5% in the 7.5 mg/46 mg group, and 75.0% in the 15 mg/92 mg group (P = 0.2996 for 7.5/46 versus placebo; P = 0.0034 for 15/92 versus placebo) (CONQUER 2013).
Changes in diastolic blood pressure
Both doses of phentermine/topiramate were associated with a significantly greater reduction in diastolic BP compared to placebo in hypertensive participants (‐5.2 mm Hg (7.5 mg/46 mg group) and ‐5.8 mm Hg (15 mg/92 mg group) versus ‐3.9 mm Hg; P = 0.04 and 0.0003 for comparisons) (CONQUER 2013).
Body weight
Compared to placebo, phentermine/topiramate produced a significantly greater percentage weight loss in participants with hypertension at baseline (‐8.1%, ‐10.1%, and ‐1.9%, for 7.5 mg/46 mg, 15 mg/92 mg, and placebo respectively, P < 0.0001). In addition, significantly more participants in the hypertensive subgroup achieved weight loss of ≥ 5%, ≥ 10%, and ≥ 15% with phentermine/topiramate compared with placebo (CONQUER 2013).
Heterogeneity
Only one study; no meta‐analysis performed.
Subgroup analyses
Only one study; no meta‐analysis performed.
Sensitivity analyses
Only one study; no meta‐analysis performed.
Publication and small‐study bias
Only one study; not applicable.
Discusión
Resumen de los resultados principales
Esta revisión sistemática actualizada intentó determinar los efectos a largo plazo de la pérdida de peso mediante la intervención farmacológica sobre las variables principales de evaluación importantes para los pacientes, sobre todo muerte y complicaciones cardiovasculares, en el tratamiento de la hipertensión de pacientes con hipertensión esencial, pero encontró que actualmente no existen ensayos controlados aleatorios diseñados para responder esta pregunta. La búsqueda reveló solamente los estudios que se centraron principalmente en la evaluación de los efectos sobre el peso corporal, la presión arterial y los eventos adversos. Además de cuatro ensayos relevantes de orlistat y cuatro ensayos relevantes de sibutramina que ya formaban parte de la revisión, la actualización mostró un estudio nuevo (que investigó la combinación de fentermina/topiramato). No fue posible incluir en esta revisión estudios que examinaran rimonabant, liraglutide, lorcaserina o naltrexona/bupropión, ya que el único ensayo potencialmente relevante no logró presentar el análisis de los participantes con hipertensión.
Se encontró que, de los cuatro estudios sobre los efectos del orlistat incluidos en los análisis, solamente uno se consideró que presentó deficiencias graves en la calidad del estudio. Los metanálisis mostraron que los pacientes bajo tratamiento con orlistat pudieron reducir significativamente más su peso y los niveles de presión arterial desde el punto de vista estadístico que los pacientes de los grupos placebo. Aunque estos resultados indican que el orlistat puede ser una opción útil en el tratamiento de la hipertensión en los pacientes con obesidad e hipertensión, aún quedan algunas interrogantes. En primer lugar, los participantes que recibieron tratamiento con orlistat presentaron efectos secundarios significativos, principalmente de naturaleza gastrointestinal. Este hecho podría limitar la efectividad de la medicación en contextos fuera de los estudios científicos. Además, todavía no está claro si los niveles de presión arterial permanecerán bajos durante un período más prolongado o hasta que se interrumpa la medicación, ya que algunos estudios de investigación encontraron que el peso corporal aumentaba nuevamente después de un año, se continuara o no con el orlistat(Davidson 1999; Sjostrom 1998).
Aunque la sibutramina redujo el peso corporal hasta el mismo nivel que el orlistat, no mostró los mismos efectos beneficiosos sobre la presión arterial. En dos estudios que administraron una dosis de 20 mg por día, mayor que la dosis actualmente autorizada (en Alemania) de 10 a 15 mg por día, la presión arterial aumentó incluso en los pacientes tratados con sibutramina. Este resultado se enfatiza aún más mediante el resultado de una comparación directa del orlistat con la sibutramina (Derosa 2005). Se encontró que, mientras en los pacientes del grupo de orlistat (120 mg tres veces al día) una reducción de ‐8,4 kg en el peso corporal dio lugar a una reducción de la PAS y PAD de ‐4,0 y ‐3,0 mmHg respectivamente, la misma pérdida de peso corporal de ‐8,3 kg en el grupo de sibutramina no causó un cambio en la presión arterial en los pacientes tratados con 10 mg por día de sibutramina (0 y 0 mmHg respectivamente). En un metanálisis realizado por Kim y cols. que comparó la sibutramina con placebo en participantes con o sin hipertensión al inicio (Kim 2003), también se encontró un aumento significativo en la PA sistólica (+1,6 mmHg) y la PA diastólica (+1,8 mmHg) en el grupo de tratamiento con sibutramina a pesar de un efecto grande sobre la pérdida de peso en este grupo. Como hay problemas de seguridad en los pacientes con hipertensión, la European Medicines Agency (EMA) exigió un ensayo a largo plazo de los pacientes con riesgo cardiovascular alto y se inició el Sibutramine Cardiovascular Outcome Trial (SCOUT). Este ensayo aleatorio controlado con placebo y doble ciego, en aproximadamente 10 000 participantes con sobrepeso / obesidad con alto riesgo cardiovascular, comenzó el reclutamiento en diciembre de 2002 y se diseñó para determinar la repercusión de la pérdida de peso en 10 742 participantes (SCOUT 2010). Después de una duración media de 3,5 años, el 11,4% de los participantes en el grupo de sibutramina y el 10,0% en el grupo placebo tuvieron un evento primario de resultado. Estos fueron un infarto de miocardio no mortal, un accidente cerebrovascular no mortal, reanimación después de paro cardíaco o muerte cardiovascular (cociente de riesgos instantáneos 1,16; IC del 95%: 1,03 a 1,31; P = 0,02; número necesario a tratar para dañar: 71]. Como cualquier pérdida observada en el peso corporal fue solamente moderada, la Food and Drug Administration (FDA) de los EE.UU. y la EMA concluyeron que el riesgo de un evento cardiovascular adverso sobrepasaba cualquier efecto beneficioso como resultado de la administración de la sibutramina. Aunque cerca de un tercio de la población estudiada era hipertensa, el estudio SCOUT no se incluyó en esta revisión porque no se presentaron análisis de los subgrupos con hipertensión. Además, como se ha retirado la autorización de comercialización para la sibutramina, no se estableció contacto con los autores para obtener los datos necesarios de este subgrupo.
Para el tratamiento de combinación con fentermina/topiramato solamente fue posible incluir un ensayo que incluye un subgrupo con hipertensión en el análisis de esta revisión (CONQUER 2013). Un ensayo adicional de 56 semanas comparó dos dosis diferentes de fentermina/topiramato con placebo en participantes con obesidad con presión arterial por debajo de 140/90 mmHg (EQUIP 2012). En estos ensayos la pérdida de peso media con fentermina/topiramato fue de alrededor de 6 a 8 kg, que es mayor que en el caso del orlistat, mientras que el efecto antihipertensivo de fentermina/topiramato es equivalente al del orlistat. Después de la finalización del ensayo CONQUER, los participantes podían participar en un ensayo adicional de extensión de 52 semanas (SEQUEL 2014). Debido a que este ensayo de extensión no presentó resultados para el subgrupo con hipertensión y el reclutamiento en el estudio ocurrió a solicitud de los participantes, los resultados no se incluyeron en el análisis de esta revisión. Aunque hubo una pérdida de peso significativa y mantenida en los grupos de fentermina/topiramato en comparación con placebo, la reducción de la presión arterial no difirió significativamente entre los grupos después de dos años (SEQUEL 2014). Al contrario que en los EE.UU., donde la FDA autorizó fentermina/topiramato para el tratamiento farmacológico a largo plazo de la obesidad en 2012 (FDA 2012), la EMA rechazó la autorización en Europa el 21 de febrero de 2013 debido a inquietudes importantes con respecto a los efectos a largo plazo del fármaco sobre el corazón y los vasos sanguíneos, y en particular porque se sabe que la fentermina aumenta la frecuencia cardíaca. También hubo inquietudes por los efectos psiquiátricos y cognitivos a largo plazo relacionados con el componente topiramato (EMA 2013c).
Con respecto a los cuatro fármacos restantes que se han autorizado para la reducción del peso a largo plazo por la FDA, la mayoría de los estudios reclutaron solamente a pacientes con sobrepeso u obesidad sin hipertensión o a una población mixta de participantes normotensos e hipertensos, sin proporcionar resultados para el subgrupo con hipertensión. Por lo tanto los resultados de estos ensayos se excluyeron del análisis de esta revisión y sólo se analizan brevemente.
Cuatro estudios (los estudios Rimonabant in Obesity [RIO]) investigaron los efectos de un tratamiento diario de 5 mg y 20 mg de rimonabant en comparación con placebo en poblaciones de estudio que incluyeron participantes normotensos e hipertensos (30% al 60%) (Despres 2005; Pi‐Sunyer 2006; Scheen 2006; Van Gaal 2005). Ninguno de los estudios RIO se diseñó para evaluar los efectos sobre las variables de evaluación importantes para los pacientes. Los participantes que recibieron tratamiento con rimonabant redujeron el peso corporal a un grado significativamente mayor desde el punto de vista estadístico que los participantes con placebo, independientemente de la dosis. Contrariamente a estos hallazgos, los estudios produjeron resultados heterogéneos en cuanto a los cambios en la presión arterial. En especial, el tratamiento con 5 mg de rimonabant mostró resultados inconsistentes, con una reducción mayor de la presión arterial en comparación con placebo en algunos estudios, pero una menor reducción en otros. El tratamiento con 20 mg de rimonabant diariamente mostró hallazgos más uniformes, con una reducción mayor de la PAS en los cuatro estudios (la diferencia fue estadísticamente significativa en dos). Además, en tres estudios la reducción de la PA diastólica fue más pronunciada en los participantes que tomaban 20 mg de rimonabant que en el grupo placebo (la diferencia fue estadísticamente significativa en uno), pero ligeramente menos pronunciada en un estudio. Solamente la publicación del estudio RIO Lipid mostró información sobre un subgrupo con hipertensión (Despres 2005). En los participantes con hipertensión tratados con 20 mg de rimonabant, la presión arterial se redujo a un grado significativamente mayor desde el punto de vista estadístico que en los participantes del grupo placebo (PA sistólica: ‐5,9 mm Hg; PA diastólica: ‐3,9 mm Hg). Como no se suministra otra información sobre el subgrupo con hipertensión (el artículo ni siquiera informa el porcentaje de pacientes con hipertensión al inicio), la pertinencia de estos hallazgos no está clara. Además, se debe señalar que el rimonabant nunca fue autorizado por la FDA porque surgieron graves problemas de seguridad (FDA 2007). El análisis original de los datos que realizó la FDA indicó que la incidencia de tendencia suicida se duplicó con rimonabant versus placebo. De manera similar, la incidencia de eventos adversos psiquiátricos, eventos adversos neurológicos y crisis convulsivas fueron sistemáticamente mayores con 20 mg de rimonabant en comparación con placebo. Rimonabant recibió autorización de comercialización de la EMA el 19 de junio de 2006. Sin embargo, nuevos datos provenientes de la experiencia posterior a la comercialización y de los ensayos clínicos en curso llevaron a la EMA el 23 de octubre de 2008 a recomendar la suspensión de la autorización de comercialización para el rimonabant también en Europa (EMA 2008; EMA 2008a). En enero de 2009, la Comisión Europea adoptó la decisión de retirar la autorización de comercialización del rimonabant en todos los países de la UE (EMA 2009). Para el rimonabant, se tendrán que publicar muchos más datos de resultados a largo plazo antes de que se pueda tomar una decisión sobre su utilidad. Los resultados del ensayo Comprehensive Rimonabant Evaluation Study of Cardiovascular Endpoints and Outcomes (CRESCENDO) publicado en 2010 no cambiaron la recomendación hecha por la EMA en 2009 (CRESCENDO 2010). Este estudio se interrumpió temprano, en noviembre de 2008, debido a las tasas altas de suicidio y otros efectos secundarios psiquiátricos relacionados con el rimonabant. Fue un ensayo multicéntrico doble ciego controlado con placebo con un seguimiento medio de 13,8 meses, que tuvo como objetivo determinar si el tratamiento a largo plazo con 20 mg de rimonabant podría reducir potencialmente el riesgo de eventos cardiovasculares en 9314 participantes con un riesgo previamente manifiesto o mayor de vasculopatía. Aunque cerca del 88% de los participantes presentaba hipertensión, no se presentaron análisis de los subgrupos con hipertensión. Las variables principales de evaluación fueron la muerte cardiovascular, el infarto de miocardio o el accidente cerebrovascular, que ocurrieron en el 3,9% de los participantes asignados a rimonabant, en comparación con el 4,0% de los participantes asignados a placebo (cociente de riesgos instantáneos 0,97; IC del 95%: 0,84 a 1,12; P = 0,68). Entre los participantes que recibieron rimonabant, la incidencia de efectos secundarios gastrointestinales (33% versus 22%), neuropsiquiátricos (32% versus 21%) y psiquiátricos graves (2,5% versus 1,3%) aumentó significativamente en comparación con placebo. Cuatro participantes del grupo de rimonabant y uno del grupo placebo se suicidaron.
Tres ensayos grandes de fase III evaluaron la eficacia y la seguridad de lorcaserina en pacientes con obesidad con o sin comorbilidades relacionadas con el peso (BLOOM 2010; BLOOM‐DM 2012; Fidler 2011). El ensayo Behavioral Modification and Lorcaserin Second Study for Obesity Management (BLOSSOM) reclutó a 4008 participantes que se asignaron al azar a dos dosis diarias diferentes de lorcaserina o placebo (Fidler 2011). Cerca del 24% de los participantes presentaba hipertensión. En el estudio Behavioral Modification and Lorcaserin for Overweight and Obesity Management (BLOOM), 3182 participantes normotensos con sobrepeso u obesidad recibieron 10 mg de lorcaserina dos veces al día o placebo (BLOOM 2010), mientras que el ensayo Behavioral Modification and Lorcaserin for Obesity and Overweight Management in Diabetes Mellitus (BLOOM‐DM) investigó el efecto de dos dosis diferentes diarias de lorcaserina versus placebo en 604 pacientes con sobrepeso u obesidad con diabetes mellitus tipo 2 (BLOOM‐DM 2012). En los tres ensayos, la medicación de estudio se combinó con una dieta con reducción en las calorías y mayor actividad física. Ninguno de los estudios se diseñó para evaluar los efectos sobre variables de evaluación importantes para los pacientes. En todos los estudios los grupos de lorcaserina mostraron una pérdida de peso media significativa de cerca de 3 a 4 kg en comparación con los grupos placebo después de 52 semanas. Por el contrario, la presión arterial no cambió a un grado estadísticamente significativo en los ensayos BLOSSOM y BLOOM‐DM. En el ensayo BLOOM, que incluyó solamente participantes normotensos, hubo una reducción significativa en la PA sistólica y la PA diastólica en los grupos de lorcaserina en comparación con placebo (PA sistólica: ‐0,6 mm Hg; PA diastólica: ‐0,5 mm Hg). Los eventos adversos más frecuentes en los grupos de lorcaserina fueron cefalea, nasofaringitis y náuseas. Además, en los ensayos se informaron tasas grandes de interrupción de hasta el 50% (Taylor 2013). Aunque no hubo diferencias en la incidencia de valvulopatía entre lorcaserina y placebo, la FDA ha solicitado que se realice un ensayo posterior a la autorización para evaluar los efectos cardiovasculares a largo plazo de la lorcaserina (Yanovski 2014). En enero de 2013, una revisión del Committee for Medicinal Products for Human Use de la EMA señaló algunas inquietudes por el posible riesgo de trastornos psiquiátricos y valvulopatía, además del posible riesgo de tumores, particularmente cuando se administraba a largo plazo, según los resultados de pruebas de laboratorio (EMA 2013a). Como resultado de este equilibrio negativo general de efectos beneficiosos / riesgo de la lorcaserina, el fabricante retiró su aplicación para la autorización de la comercialización en Europa (EMA 2013).
La combinación de naltrexona/bupropión, que se ha autorizado para el control del peso por la FDA y la EMA (EMA 2015; FDA 2014), se evaluó en cuatro ensayos de 56 semanas del programa de estudio Contrave Obesity Research (COR). En este estudio participaron 4536 pacientes con sobrepeso u obesidad con o sin hipertensión, dislipidemia o diabetes mellitus tipo 2. En dos de los ensayos el porcentaje de participantes con hipertensión inicial fue de cerca del 20% (COR‐I 2010; COR‐II 2013); en los otros dos ensayos no se informó (COR‐BMOD 2011; COR‐Diabetes 2013). Se informó una reducción de peso estadísticamente significativa de alrededor de 4 a 5 kg con naltrexona/bupropión en comparación con placebo, además de dieta y orientación para la realización de ejercicios (COR‐Diabetes 2013; COR‐I 2010; COR‐II 2013), o un programa intensivo de modificación del comportamiento (COR‐BMOD 2011). La presión arterial permaneció sin modificaciones o se redujo ligeramente en los grupos de naltrexona/bupropión, pero hubo una reducción más grande en los grupos placebo. Las diferencias entre los grupos fueron significativas para la PA sistólica en los ensayos COR‐I 2010, COR‐II 2013 y COR‐BMOD 2011 y para la PA diastólica en los ensayos COR‐I 2010 y COR‐BMOD 2011. Ninguno de estos estudios investigó los efectos sobre resultados relacionados con el paciente. Las tasas de abandono de los cuatro ensayos variaron del 42% al 50%. Las náuseas, el mareo, el estreñimiento y el tinnitus fueron los eventos adversos más frecuentes en los grupos de naltrexona/bupropión.
Liraglutide se autorizó por primera vez por la EMA en 2009 y por la FDA en 2010 para mejorar el control glucémico en adultos con diabetes mellitus tipo 2 (EMA 2009a; FDA 2010b). Una revisión Cochrane del agonista del receptor del péptido 1 similar al glucagón (GLP‐1) para la diabetes mellitus tipo 2 mostró una reducción significativa del peso de 1,33 kg (p < 0,0001) y una reducción marginalmente significativa de la PA sistólica de ‐2,42 mmHg (p = 0,05) con 1,8 mg de liraglutide en comparación con placebo después de 24 semanas. No se informaron diferencias en la PA diastólica. Los eventos adversos más frecuentes de liraglutide fueron gastrointestinales, como las náuseas o vómitos (Shyangdan 2011). También hubo más casos de pancreatitis entre los pacientes que recibieron liraglutide en comparación con los comparadores, y en 2011 la FDA emitió una advertencia de que liraglutide puede provocar pancreatitis y carcinoma del tiroides (NEJM Journal Watch 2011). Actualmente el ensayo Liraglutide Effect and Action in Diabetes: Evaluation of cardiovascular outcome Results (LEADER), un ensayo controlado aleatorio doble ciego y controlado con placebo que incluyó 9340 participantes con diabetes mellitus tipo 2 con alto riesgo de enfermedades cardiovasculares, investiga los efectos a largo plazo de 1,8 mg de liraglutide en comparación con placebo sobre los resultados cardiovasculares, así como las neoplasias y otros eventos adversos (LEADER 2013). El estudio está previsto que finalice en 2016. Además de para el control glucémico, liraglutide fue autorizado por la FDA y la EMA a una dosis de 3,0 mg para el tratamiento de la obesidad en 2014/2015 (EMA 2015a; FDA 2014a). Esta indicación se investigó en el programa de estudio SCALA, en el cual participaron 5358 pacientes con sobrepeso u obesidad con o sin comorbilidades relacionadas con el peso (SCALE diabetes 2014; SCALE maintenance 2013; SCALE obesity and prediabetes 2014; SCALE sleep apnoea 2014). Aunque el porcentaje de participantes con hipertensión fue tan alto como del 70% en estos ensayos, no se presentaron resultados para un subgrupo con hipertensión. Al final de los estudios (32 a 56 semanas), el peso corporal medio se redujo significativamente entre los pacientes que recibieron liraglutide en comparación con placebo (‐3 a ‐6 kg). La PA sistólica también se redujo significativamente en los cuatro ensayos (‐3 mmHg), mientras que en la PA diastólica solamente un ensayo mostró una diferencia significativa entre liraglutide y placebo (‐1 mmHg) (SCALE obesity and prediabetes 2014). Las tasas de abandono en los estudios estuvieron alrededor del 23% al 34%, por lo que fueron inferiores a las de otros ensayos de control del peso. Como en los ensayos de control glucémico, los eventos adversos más frecuentes fueron náuseas, diarrea y vómitos. En el grupo de liraglutide también ocurrió pancreatitis con mayor frecuencia en comparación con placebo.
Compleción y aplicabilidad general de las pruebas
Se realizaron búsquedas en cuatro bases de datos electrónicas y en el registro de ensayos clínicos ClinicalTrials.gov hasta el 13 de abril de 2015 y se examinaron las listas de referencias de los ensayos incluidos, revisiones sistemáticas relevantes y metanálisis. Debido a que cuatro fármacos nuevos se han autorizado recientemente para el control farmacológico del peso a largo plazo, se ampliaron los términos de búsqueda. Se evaluó la calidad de cada estudio y se resumieron los resultados. Por lo tanto, los resultados de esta revisión se pueden tomar como completos y aplicables. Para obtener información completa, ver los detalles en las secciones pertinentes.
Calidad de la evidencia
De los cuatro estudios de orlistat incluidos en los análisis, se consideró que solamente uno tuvo deficiencias graves en la calidad del estudio (Bakris 2002). Todos los estudios de sibutramina se consideraron con deficiencias graves en la calidad del estudio. Se consideró que el único estudio incluido de fentermina/topiramato no tuvo deficiencias graves en la calidad. Los detalles completos se proporcionan en las tablas "Riesgo de sesgo" en " Características de los estudios incluidos.
Sesgos potenciales en el proceso de revisión
Una limitación importante de esta revisión es que, debido a la información insuficiente en los estudios incluidos, no fue posible establecer conclusiones sobre los efectos de las diferentes intervenciones farmacéuticas para la pérdida de peso sobre los resultados a largo plazo importantes para los pacientes.
Acuerdos y desacuerdos con otros estudios o revisiones
Las revisiones sistemáticas sobre los efectos a largo plazo de los fármacos para reducir el peso en pacientes con hipertensión son poco frecuentes. Una revisión sistemática publicada (Aucott 2005) estableció la misma conclusión, es decir, que solamente estaban disponibles ensayos a corto plazo. Los autores de la revisión también advirtieron, "que la extrapolación de los cambios en la presión arterial a corto plazo con una pérdida de peso a largo plazo es potencialmente engañoso. La relación entre peso e hipertensión es compleja y se necesitan estudios bien realizados con un seguimiento a largo plazo a fin de examinar los efectos de la pérdida de peso sobre los resultados de la hipertensión".
Además, también participamos en la preparación del informe científico sobre la evaluación de los beneficios y los daños de las estrategias de tratamiento no farmacológicas en personas con hipertensión esencial (IQWiG 2006) y se publicó un documento sobre este tema en 2008 (Horvath 2008). Desde la última búsqueda realizada el 17 de agosto de 2012 (Siebenhofer 2013) de ensayos que investigaran la reducción farmacológicamente inducida del peso corporal, se han autorizado cuatro fármacos nuevos para el control del peso a largo plazo, por lo que se incluyeron en la búsqueda de esta actualización de la revisión. Como resultado, se identificó e incluyó un estudio adicional que analizó la pregunta de investigación en el análisis actualizado de la presente revisión. Se conocen todos los principales estudios y revisiones sistemáticas pertinentes y se puede establecer con confianza que los hallazgos concuerdan bien con las revisiones y los estudios publicados recientemente.
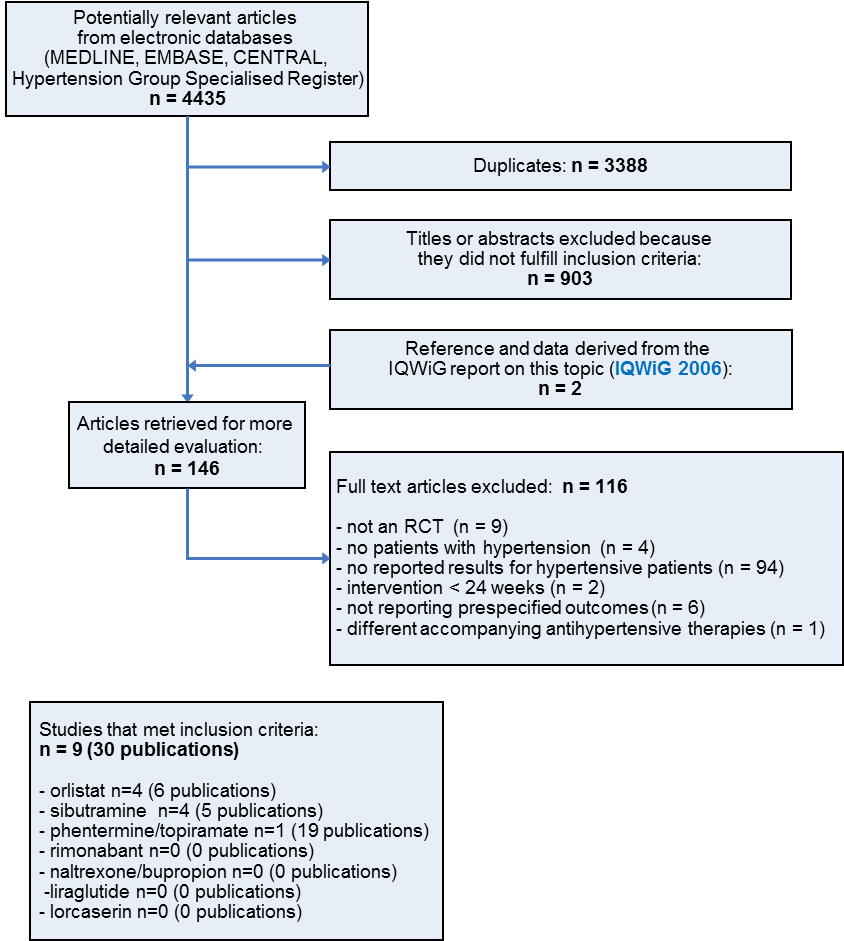
Study flow diagram
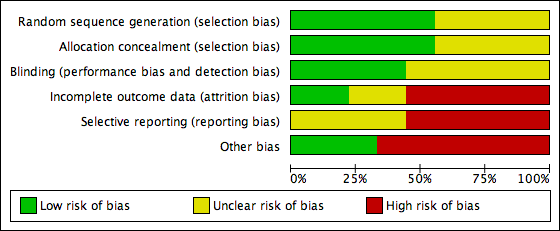
Risk of bias graph: review authors' judgements about each risk of bias item presented as percentages across all included studies.

Risk of bias summary: review authors' judgements about each risk of bias item for each included study.
![Forest plot of comparison: 1 Orlistat versus placebo, outcome: 1.1 Change in systolic blood pressure from baseline to endpoint [mm Hg].](/es/cdsr/doi/10.1002/14651858.CD007654.pub4/media/CDSR/CD007654/rel0004/CD007654/image_n/nCD007654-AFig-FIG04.png)
Forest plot of comparison: 1 Orlistat versus placebo, outcome: 1.1 Change in systolic blood pressure from baseline to endpoint [mm Hg].
![Forest plot of comparison: 1 Orlistat versus placebo, outcome: 1.2 Change in diastolic blood pressure from baseline to endpoint [mm Hg].](/es/cdsr/doi/10.1002/14651858.CD007654.pub4/media/CDSR/CD007654/rel0004/CD007654/image_n/nCD007654-AFig-FIG05.png)
Forest plot of comparison: 1 Orlistat versus placebo, outcome: 1.2 Change in diastolic blood pressure from baseline to endpoint [mm Hg].
![Forest plot of comparison: 1 Orlistat versus placebo, outcome: 1.3 Change in body weight from baseline to endpoint [kg].](/es/cdsr/doi/10.1002/14651858.CD007654.pub4/media/CDSR/CD007654/rel0004/CD007654/image_n/nCD007654-AFig-FIG06.png)
Forest plot of comparison: 1 Orlistat versus placebo, outcome: 1.3 Change in body weight from baseline to endpoint [kg].
![Forest plot of comparison: 2 Sibutramine versus placebo, outcome: 2.1 Change in diastolic blood pressure from baseline to endpoint [mm Hg].](/es/cdsr/doi/10.1002/14651858.CD007654.pub4/media/CDSR/CD007654/rel0004/CD007654/image_n/nCD007654-AFig-FIG07.png)
Forest plot of comparison: 2 Sibutramine versus placebo, outcome: 2.1 Change in diastolic blood pressure from baseline to endpoint [mm Hg].
![Forest plot of comparison: 2 Sibutramine versus placebo, outcome: 2.2 Change in body weight from baseline to endpoint [kg].](/es/cdsr/doi/10.1002/14651858.CD007654.pub4/media/CDSR/CD007654/rel0004/CD007654/image_n/nCD007654-AFig-FIG08.png)
Forest plot of comparison: 2 Sibutramine versus placebo, outcome: 2.2 Change in body weight from baseline to endpoint [kg].

Comparison 1 Orlistat versus placebo, Outcome 1 Change in systolic blood pressure from baseline to endpoint.

Comparison 1 Orlistat versus placebo, Outcome 2 Change in diastolic blood pressure from baseline to endpoint.

Comparison 1 Orlistat versus placebo, Outcome 3 Change in body weight from baseline to endpoint.

Comparison 2 Sibutramine versus placebo, Outcome 1 Change in diastolic blood pressure from baseline to endpoint.

Comparison 2 Sibutramine versus placebo, Outcome 2 Change in body weight from baseline to endpoint.
| Orlistat compared with placebo for weight reduction | |||||
| Patient or population: Men and non‐pregnant women ≥ 18 years old with essential hypertension Intervention: Orlistat Comparison: Placebo | |||||
| Outcomes | Illustrative comparative risks (per 1000 patients) | Effect estimate | No of Participants | Quality of the evidence | Comments |
| Change in systolic blood pressure as compared to placebo [mm Hg] from baseline to end of study | Not applicable | MD ‐2.46 [‐4.01, ‐0.90] | 2058 | ⊕⊕⊝⊝ | ‐ |
| Change in diastolic blood pressure as compared to placebo [mm Hg] from baseline to end of study | Not applicable | MD ‐1.92 [‐2.99, ‐0.85] | 2058 | ⊕⊕⊝⊝ | ‐ |
| Change in body weight as compared to placebo [kg] from baseline to end of study | Not applicable | MD ‐3.73 [‐4.65, ‐2.80] | 2080 | ⊕⊕⊕⊝ | ‐ |
| CI: confidence interval; MD: mean difference | |||||
| GRADE Working Group grades of evidence | |||||
| 1High risk of bias in included studies. 2Wide confidence intervals include non‐clinically important effect. | |||||
| Sibutramine compared with placebo for weight reduction | |||||
| Patient or population: Men and non‐pregnant women ≥ 18 years old with essential hypertension Intervention: Sibutramine Comparison: Placebo | |||||
| Outcomes | Illustrative comparative risks (per 1000 patients) | Effect estimates | No of Participants | Quality of the evidence | Comments |
| Change in systolic blood pressure as compared to placebo [mm Hg] from baseline to end of study | Not applicable | Not estimable | See comment | See comment | Variability measurements not available; |
| Change in diastolic blood pressure as compared to placebo [mm Hg] from baseline to end of study | Not applicable | MD 3.16 [1.40, 4.92] | 428 | ⊕⊕⊝⊝ | ‐ |
| Change in body weight as compared to placebo [kg] from baseline to end of study | Not applicable | MD ‐3.74 [‐4.84, ‐2.64] | 574 | ⊕⊕⊝⊝ | ‐ |
| CI: confidence interval; MD: mean difference | |||||
| GRADE Working Group grades of evidence | |||||
| 1High risk of bias in included studies. 2Small number of participants and studies. | |||||
| Study | Adverse events | Results |
| Orlistat vs placebo | ||
| Bakris 2002 | total thereof leading to withdrawal serious gastrointestinal thereof leading to withdrawal musculoskeletal | 89% of P [O] vs 71% of P [P], P < 0.001 7% [O] vs 7% [P] 14 P (12%) [O] vs 15 P (9%) [P] 200 P (73%) [O] vs 120 P (44%) [P], P < 0.001 15 P (8%) [O] vs 6 P (5%) [P] 23% of P [O] vs 16% [P], P < 0.05 |
| Cocco 2005 | total serious gastrointestinal | nr 0 P [O] vs 0 P [P] 16 P (36%) [O]a vs 11 P (24%) [P]a |
| Guy‐Grand 2004 | total serious | nrb nrb |
| XENDOS 2001‐2006 | total leading to withdrawal serious gastrointestinal musculoskeletal nervous system dermatological vascular | 99% of P [OD] vs 96% of P [PD] 99% of P [OS] vs 97% of P [PS] 9% of P [OD] vs 4% of P [PD] 9% of P [OS] vs 4% of P [PS] 18% of P [OD] vs 12% of P [PD] 18% of P [OS] vs 12% of P [PS] 93% of P [OD] vs 70% of P [PD] 93% of P [OS] vs 71% of P [PS] 65% of P [OD] vs 62% of P [PD] 65% of P [OS] vs 63% of P [PS] 39% of P [OD] vs 39% of P [PD] 40% of P [OS] vs 37% of P [PS] 20% of P [OD] vs 17% of P [PD] 22% of P [OS] vs 17% of P [PS] 17% of P [OD] vs 19% of P [PD] 17% of P [OS] vs 19% of P [PS] |
| Sibutramine vs placebo | ||
| Fanghaenel 2003 | total constipation dizziness dry mouth headache insomnia restlessness | 14 P (21 E) [S] vs 13 P (20 E) [P] 4 P [S] vs 2 P [P] 1 P [S] vs 1 P [P] 4 P [S] vs 2 P [P] 5 P [S] vs 2 P [P] 1 P [S] vs 1 P [P] 1 P [S] vs 0 P [P] |
| Faria 2002‐2005 | total dry mouth arthralgia | nr 37% of P [S] vs 9% of P [P], P < 0.005 16% of P [S] vs 2% of P [P], P = 0.03 |
| McMahon 2002 | total serious treatment related leading to withdrawal (mostly hypertension) dry mouth headache | 141 P (97%) [S] vs 65 P (88%) [P] 9 P (6%) [S] vs 5 P (7%) [P] 2 E [S] vs 0 E [P] 23 P (16%) [S] vs 4 P (5%) [P] 30 P (21%) [S] vs 0 P [P] 41 P (28%) [S] vs 17 P (23%) [P] |
| McMahon 2000 | total leading to withdrawal (mostly hypertension) dry mouth headache constipation rash | nr 30 P (20%) [S] vs 8 P (11%) [P] 29 P (19%) [S] vs 2 P (3%) [P], P < 0.05 37 P (25%) [S] vs 21 P (28%) [P] 25 P (17%) [S] vs 2 P (3%) [P], P < 0.05 16 P (11%) [S] vs 2 P (3%) [P] |
| Phentermine/topiramate vs placebo | ||
| CONQUER 2013 | total leading to withdrawal serious cardiac adverse events dry mouth paresthaesia constipation upper respiratory tract infection nasopharyngitis dysgeusia insomnia headache dizziness sinusitis | 85.4% vs 88.8% vs 77.3% 11.9% vs 19.8% vs 9.7% 3.4% (Phen/Top [LD]) vs 3.7% (Phen/Top [HD]) vs 4.2% [P] 0.8% vs 1.2% vs 0.6% 14.2% (Phen/Top [LD]) vs 22.7% (Phen/Top [HD]) vs 2.3% [P] 14.2% (Phen/Top [LD]) vs 22.3% (Phen/Top [HD]) vs 2.3% [P] 15.7% (Phen/Top [LD]) vs 18.1% (Phen/Top [HD]) vs 5.5% [P] 12.6% (Phen/Top [LD]) vs 12.1% (Phen/Top [HD]) vs 11.8% [P] 10.3% (Phen/Top [LD]) vs 10.2% (Phen/Top [HD]) vs 8.8% [P] 7.7% (Phen/Top [LD]) vs 11.0% (Phen/Top [HD]) vs 0.8% [P] 5.7% (Phen/Top [LD]) vs 11.0% (Phen/Top [HD]) vs 4.8% [P] 5.0% (Phen/Top [LD]) vs 10.8% (Phen/Top [HD]) vs 8.4% [P] 6.5% (Phen/Top [LD]) vs 12.1% (Phen/Top [HD]) vs 3.1% [P] 5.4% (Phen/Top [LD]) vs 8.3% (Phen/Top [HD]) vs 6.5% [P] |
| E: events. nr: not reported. [O]: orlistat. [OD]: orlistat and diastolic blood pressure ≥ 90 mm Hg. [OS]: orlistat and systolic blood pressure ≥ 140 mm Hg. P: participants. [P]: placebo. Phen/Top [HD]: phentermine/topiramate high dose (15 mg/92 mg). Phen/Top [LD]: phentermine/topiramate low dose (7.5 mg/46 mg). [PD]: placebo and diastolic blood pressure ≥ 90 mm Hg. [PS]: placebo and systolic blood pressure ≥ 140 mm Hg. [S]: sibutramine. aNo data on adverse events were reported for the whole study duration. The data above refer to 4 and 3 weeks of treatment in the orlistat and placebo group, respectively. After 3 months, the number of participants with events decreased to 5(11%)[O] with flatulence and mild abdominal cramps versus 6(13%)[P] with nausea and hunger feeling. bData were not available for the hypertensive subgroup, only for the whole study population (withdrawal due to defecation troubles in 10 [O] versus 2 [P] participants). | ||
| Study | Baselinea | 6 moa | 12 moa | 48 moa | Change from baseline to endpointa |
| Orlistat vs placebo | |||||
| Bakris 2002b Orlistat Placebo | 101 (1)c 102 (1)c | nr nr | nr nr | ‐ ‐ | P < 0.001 ‐5.4 (6.4) ‐2.7 (6.4) |
| Cocco 2005 Orlistat Placebo | 107 (6) 106 (6) | 102 (4) 104 (5) | ‐ ‐ | ‐ ‐ | P < 0.001 ‐5.4d ‐2.5d |
| Guy‐Grand 2004 Orlistat Placebo | 94 (1)c 94 (1)c | nr nr | ‐ ‐ | ‐ ‐ | P < 0.0001 ‐5.8 (0.3) ‐1.8 (0.2) |
| XENDOS 2001‐2006 Orlistat [OD] Placebo [PD] Orlistat [OS] Placebo [PS] | 117 (18) 115 (18) 117 (17) 116 (18) | 106 (17) 108 (18) 106 (17) 109 (18) | 105 (18) 108 (19) 105 (17) 110 (19) | 110 (19) 111 (20) 110 (18) 113 (19) | P < 0.001 ‐6.6 (8.6) ‐3.8 (7.8) P < 0.001 ‐6.8 (8.7) ‐3.2 (7.4) |
| Sibutramine vs placebo | |||||
| Fanghaenel 2003 Sibutramine Placebo | 75 (10) 78 (9) | 70 (10) 75 (9) | ‐ ‐ | ‐ ‐ | significant ‐5.5 (‐3.8; ‐7.1)e ‐3.4 (‐1.9; ‐5.0)e |
| Faria 2002‐2005 Sibutramine Placebo | 100 (19) 97 (14) | 93 (18) 94 (15) | ‐ ‐ | ‐ ‐ | P < 0.001 ‐6.8 (2.3) ‐2.4 (4.2) |
| McMahon 2002 Sibutramine Placebo | 97 (16) 99 (14) | nr nr | nr nr | ‐ ‐ | P < 0.05 ‐4.5 ‐0.4 |
| McMahon 2000 Sibutramine Placebo | 97 (13) 96 (17) | nr nr | nr nr | ‐ ‐ | P < 0.05 ‐4.4 ‐0.5 |
| Phentermine/topiramate vs placebo | |||||
| CONQUER 2013 Phen/Top [LD] Phen/Top [HD] Placebo | 104 (18)f | nr nr nr | nr nr nr | ‐ ‐ ‐ | P < 0.0001g ‐8.1% ‐10.1% ‐1.9% |
| Mo: months. nr: not reported. [O]: orlistat. [OD]: orlistat and diastolic blood pressure ≥ 90 mm Hg. [OS]: orlistat and systolic blood pressure ≥ 140 mm Hg. P: participants. [P]: placebo. Phen/Top [HD]: phentermine/topiramate high dose (15 mg/92 mg). Phen/Top [LD]: phentermine/topiramate low dose (7.5 mg/46 mg). [PD]: placebo and diastolic blood pressure ≥ 90 mm Hg. [PS]: placebo and systolic blood pressure ≥ 140 mm Hg. [S]: sibutramine. SD: standard deviation. aMean kg (SD), unless otherwise indicated. bData are reported for 267 of 278 [O] and 265 of 276 [P] participants only. cReported as being the standard deviation but probably the standard error due to its small number. dPublished values are different, but data were corrected after personal communication with the author. e95% confidence interval. fReported only combined for all three study groups. gFor each intervention group versus placebo. | |||||
| Study | Baselinea | 6 moa | 12 moa | 48 moa | Change from baseline to endpointa |
| Orlistat vs placebo | |||||
| Bakris 2002b Orlistat Placebo | 154 (13) 151 (13) | nr nr | nr nr | ‐ ‐ | ns ‐13.3 (15.2) ‐11.0 (15.0) |
| Cocco 2005 Orlistat Placebo | 146 (10) 142 (6) | 142 (13) 141 (9) | ‐ ‐ | ‐ ‐ | P = 0.025 ‐4.3 ‐0.9 |
| Guy‐Grand 2004 Orlistat Placebo | 150 (1)c 152 (1)c | nr nr | ‐ ‐ | ‐ ‐ | ns ‐9.8 (1) ‐9.8 (1) |
| XENDOS 2001‐2006 Orlistat [OD]d Placebo [PD]d Orlistat [OS]d Placebo [PS]d | 146 (13) 146 (12) 149 (10) 149 (8) | 135 (14) 136 (15) 125 (14) 138 (14) | 135 (14) 138 (16) 135 (14) 140 (14) | 137 (15) 139 (16) 138 (15) 140 (15) | P = 0.024 ‐8.8 (14.8) ‐6.4 (15.1) P < 0.002 ‐11.5 (14.9) ‐8.6 (14.3) |
| Sibutramine vs placebo | |||||
| Fanghaenel 2003e Sibutramine Placebo | 139 (9) 139 (13) | 125 (9) 123 (10) | ‐ ‐ | ‐ ‐ | ns ‐13.9f ‐16.5f |
| Faria 2002‐2005 Sibutramine Placebo | 150 (18) 150 (15) | 146 (15) 149 (22) | ‐ ‐ | ‐ ‐ | ns ‐4.6f ‐0.6f |
| McMahon 2002 Sibutramine Placebo | 129 (11) 129 (11) | nr nr | 133 130 | ‐ ‐ | P = 0.0497 3.8 1.1 |
| McMahon 2000 Sibutramine Placebo | 134 (10) 134 (11) | nr nr | nr nr | ‐ ‐ | ns 2.7 1.5 |
| Phentermine/topiramate vs placebo | |||||
| CONQUER 2013 Phen/Top [LD] Phen/Top [HD] Placebo | 134 (nr) 133 (nr) 135 (nr) | nr nr nr | nr nr nr | ‐ ‐ ‐ | P = 0.0475 [LD] P < 0.0001 [HD] ‐6.9 ‐9.1 ‐4.9 |
| Mo: months. nr: not reported. [O]: orlistat. [OD]: orlistat and diastolic blood pressure ≥ 90 mm Hg. [OS]: orlistat and systolic blood pressure ≥ 140 mm Hg. P: participants. [P]: placebo. Phen/Top [HD]: phentermine/topiramate high dose (15 mg/92 mg). Phen/Top [LD]: phentermine/topiramate low dose (7.5 mg/46 mg). [PD]: placebo and diastolic blood pressure ≥ 90 mm Hg. [PS]: placebo and systolic blood pressure ≥ 140 mm Hg. [S]: sibutramine. SD: standard deviation. aMean mm Hg (SD), unless otherwise indicated. bData are reported for 267 of 278 [O] and 265 of 276 [P] participants only. cReported as being the standard deviation but probably the standard error due to its small number. dBased on last observation carried forward data on 399 [OD], 423 [PD], 493 [OS], and 504 [PS] participants. eData at baseline were recorded after a two‐week wash‐out period of antihypertensive drugs for diagnostic confirmation of hypertension. fCalculated. | |||||
| Study | Baselinea | 6 moa | 12 moa | 48 moa | Change from baseline to endpointa |
| Orlistat vs placebo | |||||
| Bakris 2002b Orlistat Placebo | 98 (4) 98 (4)c | nr nr | nr nr | ‐ ‐ | P = 0.002 ‐11.4 (8.3) ‐9.2 (8.4) |
| Cocco 2005 Orlistat Placebo | 88 (7) 85 (6) | 84 (9) 85 (7) | ‐ ‐ | ‐ ‐ | P = 0.012 ‐3.6 ‐0.8 |
| Guy‐Grand 2004 Orlistat Placebo | 97 (0)d 97 (0)d | nr nr | ‐ ‐ | ‐ ‐ | ns ‐7.5 (0.6) ‐7.3 (0.6) |
| XENDOS 2001‐2006 Orlistat [OD]e Placebo [PD]e Orlistat [OS]e Placebo [PS]e | 95 (6) 95 (5) 91 (9) 91 (8) | 86 (8) 88 (9) 84 (9) 87 (9) | 86 (8) 88 (10) 85 (9) 88 (10) | 87 (9) 89 (10) 86 (9) 88 (10) | P < 0.006 ‐8.1 (9.3) ‐6.2 (9.9) P < 0.001 ‐5.0 (9.9) ‐3.0 (10.4) |
| Sibutramine vs placebo | |||||
| Fanghaenel 2003f Sibutramine Placebo | 93 (7) 92 (8) | 82 (5) 80 (5) | ‐ ‐ | ‐ ‐ | ns ‐11.4g ‐11.7g |
| Faria 2002‐2005 Sibutramine Placebo | 91 (12) 94 (12) | 92 (13) 92 (14) | ‐ ‐ | ‐ ‐ | ns 1.0g ‐2.06g |
| McMahon 2002 Sibutramine Placebo | 82 (6) 83 (6) | nr nr | 86 83 | ‐ ‐ | P = 0.004 3.0 ‐0.1 |
| McMahon 2000 Sibutramine Placebo | 84 (5) 84 (6) | nr nr | nr nr | ‐ ‐ | P < 0.05 2.0 ‐1.3 |
| Phentermine/topiramate vs placebo | |||||
| CONQUER 2013 Phen/Top [LD] Phen/Top [HD] Placebo | 83 (nr) 83 (nr) 85 (nr) | nr nr nr | nr nr nr | ‐ ‐ ‐ | P = 0.0400 [LD] P = 0.0003 [HD] ‐5.2 ‐5.8 ‐3.9 |
| Mo: months. nr: not reported. [O]: orlistat. [OD]: orlistat and diastolic blood pressure ≥ 90 mm Hg. [OS]: orlistat and systolic blood pressure ≥ 140 mm Hg. P: participants. [P]: placebo. Phen/Top [HD]: phentermine/topiramate high dose (15 mg/92 mg). Phen/Top [LD]: phentermine/topiramate low dose (7.5 mg/46 mg). [PD]: placebo and diastolic blood pressure ≥ 90 mm Hg. [PS]: placebo and systolic blood pressure ≥ 140 mm Hg. [S]: sibutramine. SD: standard deviation. aMean mm Hg (SD), unless otherwise indicated. bData are reported for 267 of 278 [O] and 265 of 276 [P] participants only. cThe standard deviation was published as being 35 but should probably be 3.5. dReported as being the standard deviation but probably the standard error due to its small number. eBased on last observation carried forward data on 399 [OD], 423 [PD], 493 [OS], and 504 [PS] participants. fData at baseline were recorded after a two‐week wash‐out period of antihypertensive drugs for diagnostic confirmation of hypertension. gCalculated. | |||||
| Outcome or subgroup title | No. of studies | No. of participants | Statistical method | Effect size |
| 1 Change in systolic blood pressure from baseline to endpoint Show forest plot | 4 | 2058 | Mean Difference (IV, Random, 95% CI) | ‐2.46 [‐4.01, ‐0.90] |
| 2 Change in diastolic blood pressure from baseline to endpoint Show forest plot | 4 | 2058 | Mean Difference (IV, Random, 95% CI) | ‐1.92 [‐2.99, ‐0.85] |
| 3 Change in body weight from baseline to endpoint Show forest plot | 4 | 2080 | Mean Difference (IV, Random, 95% CI) | ‐3.73 [‐4.65, ‐2.80] |
| Outcome or subgroup title | No. of studies | No. of participants | Statistical method | Effect size |
| 1 Change in diastolic blood pressure from baseline to endpoint Show forest plot | 2 | 428 | Mean Difference (IV, Fixed, 95% CI) | 3.16 [1.40, 4.92] |
| 2 Change in body weight from baseline to endpoint Show forest plot | 4 | 574 | Mean Difference (IV, Fixed, 95% CI) | ‐3.74 [‐4.84, ‐2.64] |