Kesan jangka panjang ubat penurun berat badan dalam kalangan orang dengan hipertensi
Abstract
Background
This is the third update of this review, first published in July 2009. All major guidelines on treatment of hypertension recommend weight loss; anti‐obesity drugs may be able to help in this respect.
Objectives
Primary objectives:
To assess the long‐term effects of pharmacologically‐induced reduction in body weight in adults with essential hypertension on all‐cause mortality, cardiovascular morbidity, and adverse events (including total serious adverse events, withdrawal due to adverse events, and total non‐serious adverse events)..
Secondary objectives:
To assess the long‐term effects of pharmacologically‐induced reduction in body weight in adults with essential hypertension on change from baseline in systolic and diastolic blood pressure, and on body weight reduction.
Search methods
For this updated review, the Cochrane Hypertension Information Specialist searched the following databases for randomised controlled trials up to March 2020: the Cochrane Hypertension Specialised Register, CENTRAL, MEDLINE (from 1946), Embase (from 1974), the World Health Organization International Clinical Trials Registry Platform, and ClinicalTrials.gov. The searches had no language restrictions. We contacted authors of relevant papers about further published and unpublished work.
Selection criteria
Randomised controlled trials of at least 24 weeks' duration in adults with hypertension that compared approved long‐term weight‐loss medications to placebo.
Data collection and analysis
Two review authors independently selected studies, assessed risks of bias, and extracted data. Where appropriate and in the absence of significant heterogeneity between studies (P > 0.1), we pooled studies using a fixed‐effect meta‐analysis. When heterogeneity was present, we used the random‐effects method and investigated the cause of the heterogeneity.
Main results
This third update of the review added one new trial, investigating the combination of naltrexone/bupropion versus placebo. Two medications, which were included in the previous versions of this review (rimonabant and sibutramine) are no longer considered relevant for this update, since their marketing approval was withdrawn in 2010 and 2009, respectively. The number of included studies in this review update is therefore six (12,724 participants in total): four RCTs comparing orlistat to placebo, involving a total of 3132 participants with high blood pressure and a mean age of 46 to 55 years; one trial comparing phentermine/topiramate to placebo, involving 1305 participants with high blood pressure and a mean age of 53 years; and one trial comparing naltrexone/bupropion to placebo, involving 8283 participants with hypertension and a mean age of 62 years. We judged the risks of bias to be unclear for the trials investigating orlistat or naltrexone/bupropion. and low for the trial investigating phentermine/topiramate. Only the study of naltrexone/bupropion included cardiovascular mortality and morbidity as predefined outcomes.
There were no differences in the rates of all‐cause or cardiovascular mortality, major cardiovascular events, or serious adverse events between naltrexone/bupropion and placebo. The incidence of overall adverse events was significantly higher in participants treated with naltrexone/bupropion. For orlistat, the incidence of gastrointestinal side effects was consistently higher compared to placebo. The most frequent side effects with phentermine/topiramate were dry mouth and paraesthesia. After six to 12 months, orlistat reduced systolic blood pressure compared to placebo by mean difference (MD) −2.6 mm Hg (95% confidence interval (CI) −3.8 to −1.4 mm Hg; 4 trials, 2058 participants) and diastolic blood pressure by MD −2.0 mm Hg (95% CI −2.7 to −1.2 mm Hg; 4 trials, 2058 participants). After 13 months of follow‐up, phentermine/topiramate decreased systolic blood pressure compared to placebo by −2.0 to −4.2 mm Hg (1 trial, 1030 participants) (depending on drug dosage), and diastolic blood pressure by −1.3 to −1.9 mm Hg (1 trial, 1030 participants) (depending on drug dosage). There was no difference in the change in systolic or diastolic blood pressure between naltrexone/bupropion and placebo (1 trial, 8283 participants). We identified no relevant studies investigating liraglutide or lorcaserin in people with hypertension.
Authors' conclusions
In people with elevated blood pressure, orlistat, phentermine/topiramate and naltrexone/bupropion reduced body weight; the magnitude of the effect was greatest with phentermine/topiramate. In the same trials, orlistat and phentermine/topiramate, but not naltrexone/bupropion, reduced blood pressure. One RCT of naltrexone/bupropion versus placebo showed no differences in all‐cause mortality or cardiovascular mortality or morbidity after two years. The European Medicines Agency refused marketing authorisation for phentermine/topiramate due to safety concerns, while for lorcaserin the application for European marketing authorisation was withdrawn due to a negative overall benefit/risk balance. In 2020 lorcaserin was also withdrawn from the US market. Two other medications (rimonabant and sibutramine) had already been withdrawn from the market in 2009 and 2010, respectively.
PICO
Ringkasan bahasa mudah
Adakah ubat untuk menurunkan berat badan mempengaruhi tekanan darah, dan mengurangkan kesan tekanan darah tinggi (hipertensi)?
Apakah tekanan darah tinggi (hipertensi)?
Tekanan darah adalah ukuran kekuatan yang digunakan jantung anda untuk mengepam darah ke seluruh badan anda. Ia biasanya ditunjukkan sebagai dua perkara: tekanan ketika jantung anda menolak keluar darah (tekanan sistole), dan tekanan ketika jantung anda berehat di antara denyutan (tekanan diastole). Tekanan darah dianggap tinggi apabila tekanan sistole melebihi 140 dan/atau tekanan diastole melebihi 90, sering ditulis sebagai ‘140 atas 90’ dan diukur dalam milimeter merkuri (mm Hg). Risiko mengalami tekanan darah tinggi meningkat apabila usia anda semakin meningkat.
Hipertensi boleh meningkatkan risiko seseorang mengalami masalah kesihatan jangka panjang yang serius, seperti serangan jantung atau angin ahmar. Penurunan tekanan darah dalam orang dengan hipertensi mengurangkan jumlah orang mengalami penyakit jantung dan saluran darah (penyakit kardiovaskular), yang menyebabkan kurang kematian dan masalah kardiovaskular.
Berat badan dan hipertensi
Garis panduan rawatan hipertensi mengesyorkan pengekakalan berat badan yang sihat dan penurunan berat badan apabila diperlukan. Sebilangan orang mungkin mengambil ubat untuk menurunkan berat badan mereka.
Mengapakah pengulas melakukan Ulasan Cochrane ini
Ubat yang dilesenkan untuk digunakan dalam penurunan berat badan di AS dan Eropah termasuk orlistat dan naltrexone digabungkan dengan bupropion. Kombinasi yang lain, phentermine dengan topiramate, dilesenkan di AS sahaja. Pengulas ingin mengetahui jika ubat penurun berat badan mempunyai kesan jangka panjang terhadap tekanan darah, dan sama ada ia boleh mengurangkan kesan tekanan darah tinggi yang tidak diingini terhadap kesihatan seseorang.
Apa yang pengulas lakukan?
Pengulas mencari kajian mengenai kesan pengambilan ubat penurun berat badan dalam orang dengan tekanan darah tinggi. Pengulas berminat dengan cara ubat ini mempengaruhi tekanan darah dan berat badan. Pengulas juga ingin mengetahui seramai mana orang mengalami sebarang kesan yang tidak diingini, seramai mana orang mengalami penyakit kardiovaskular, dan jika ada orang yang mati.
Pengulas mencari kajian rawak terkawal, dengan keadaan rawatan yang diterima orang ditentukan secara rawak. Kajian jenis ini biasanya memberikan bukti yang paling boleh dipercayai mengenai kesan rawatan.
Pengulas menilai kebolehpercayaan bukti yang mereka temui. Pengulas mempertimbangkan faktor‐faktor seperti: bagaimana kajian itu dijalankan, berapa ramai orang yang terlibat, dan sama ada penemuan mereka konsisten sepanjang kajian.
Tarikh carian: Pengulas menyertakan bukti yang diterbitkan sehingga Mac 2020.
Apa yang pengulas temui
Pengulas menemui enam kajian yang melibatkan 12,724 orang dengan tekanan darah tinggi (purata usia 46 hingga 62 tahun). Kajian‐kajian itu dijalankan di AS (3 kajian) dan Eropah (3 kajian), dan berlangsung dari 6 bulan ke 28 bulan.
Semua kajian membandingkan kesan pengambilan ubat penurun berat badan dengan kesan‐kesan pengambilan ubat palsu (plasebo).
Apakah keputusan ulasan mereka?
Orlistat mungkin menurunkan berat badan dan mungkin juga mengurangkan tekanan darah (4 kajian; 2058 orang).
Phentermine ditambah topiramate mungkin menurunkan berat badan dan mungkin mengurangkan tekanan darah (1 kajian; 1305 orang).
Naltrexone ditambah bupropion mungkin menurunkan berat badan tetapi mungkin tidak mengurangkan tekanan darah (1 kajian; 8283 orang).
Satu kajian melihat kepada risiko kematian dan kesan‐kesan kardiovaskular utama yang tidak diingini; ia menunjukkan tiada perbezaan dia antara rawatan naltrexone ditambah bupropion dan plasebo selepas dua tahun.
Orang yang mengambil ubat penurun berat badan melaporkan lebih banyak kesan tidak diingini daripada mereka yang mengambil plasebo. Kesan tidak diingini yang paling lazim adalah masalah penghadaman (untuk orlistat, dan phentermine ditambah topiramate), mulut kering dan rasa sesemut atau kekebasan pada kulit (untuk naltrexone ditambah bupropion).
Bolehkah keputusan ini dipercayai?
Keputusan adalah daripada jumlah kajian yang kecil. Dalam beberapa kajian, terdapat sedikit kejadian untuk beberapa ukuran yang mearik minat pengulas.
Pengulas berkeyakinan sederhana mengenai cara orlistat dan naltrexone ditambah bupropion memberi kesan terhadap penurunan berat badan dan tekanan darah. Walau bagaimanapun, keputusan mungkin berubah jika lebih banyak bukti tersedia.
Pengulas kurang yakin mengenai kesan phentermine ditambah topiramate; kesan orlistat yang tidak diingini, dan risiko kejadian kardiovaskular tidak diingini yang berkaitan dengan naltrexone ditambah bupropion. Keputusan berkemungkinan berubah jika lebih banyak bukti tersedia.
Kesimpulan
Beberapa ubat penurun berat badan mengurangkan berat badan dan tekanan darah dalam orang dengan tekanan darah tinggi, tetapi mungkin menyebabkan kesan yang tidak diingini. Pengulas tidak menemui bukti yang mencukupi sama ada mengambil ubat penurun berat badan untuk menurunkan berat badan dapat mengurangkan kematian dan penyakit kardiovaskular.
Authors' conclusions
Summary of findings
| Orlistat compared with placebo for weight reduction | ||||||
| Patient or population: Men and non‐pregnant women ≥ 18 years old with essential hypertension Intervention: Orlistat Comparison: Placebo | ||||||
| Outcomes | Anticipated absolute effects (95% CI) | Relative effect | No of Participants | Quality of the evidence | Comments | |
|---|---|---|---|---|---|---|
| Risk with placebo | Risk with orlistat | |||||
| Total mortality Follow‐up: 24 ‐ 208 weeks | 2 deaths (OD subgroup) and 1 death (OS subgroup) with orlistat, and no deaths with placebo in 1 trial; no deaths with orlistat or placebo in 2 other trials | ‐ | 1488 (3 studies) | ⊕⊕⊝⊝ | Very low event rate. | |
| Cardiovascular morbidity Follow‐up: 24 weeks | see comment | ‐ | 1811 (3 studies) | ⊕⊝⊝⊝ very lowb | Reporting of results too diverse to allow a meta‐analysis and small number of events. The effects of orlistat compared with placebo for this outcome are uncertain. | |
| Serious adverse events Follow‐up: 24 ‐ 208 weeks | 101 per 1000 | 146 per 1000 (111 to 192) | RR 1.45 (1.10 to 1.91) | 1476 (3 studies) | ⊕⊕⊕⊝ | ‐ |
| All adverse events Follow‐up: 24‐208 weeks | 865 per 1000 | 977 per 1000 (727 to 1000) | RR 1.13 (0.84 to 1.54) | 1386 (2 studies) | ⊕⊝⊝⊝ | 98% heterogeneity |
| Change in systolic blood pressure compared to placebo (mm Hg) from baseline to end of study Follow‐up: 24 ‐ 52 weeks | Reduction of systolic blood pressure ranged across control groups from 0.9 to 11.0 mm Hg | MD 2.58 mm Hg lower (3.78 lower to 1.37 lower) | ‐ | 2058 | ⊕⊕⊕⊝ | ‐ |
| Change in diastolic blood pressure compared to placebo (mm Hg) from baseline to end of study Follow‐up: 24 ‐ 52 weeks | Reduction of diastolic blood pressure ranged across control groups from 0.8 to 9.2 mm Hg | MD 1.97 mm Hg lower (2.72 lower to 1.22 lower) | ‐ | 2058 | ⊕⊕⊕⊝ | ‐ |
| Change in body weight compared to placebo (kg) from baseline to end of study Follow‐up: 24 ‐ 52 weeks | Reduction of body weight ranged across control groups from 1.8 to 6.93 kg | MD 3.74 kg lower (4.70 lower to 2.78 lower) | ‐ | 2080 | ⊕⊕⊝⊝ | ‐ |
| CI: confidence interval; MD: mean difference; OD: orlistat and diastolic blood pressure ≥ 90 mm Hg; OS: orlistat and systolic blood pressure ≥ 140 mm Hg; RR: risk ratio | ||||||
| GRADE Working Group grades of evidence | ||||||
| aDowngraded by two levels because of serious imprecision (small number of trials, very low event rates) ‐ see Appendix 1. | ||||||
| Phentermine/topiramate compared with placebo for weight reduction | ||||||
| Patient or population: Men and non‐pregnant women ≥ 18 years old with essential hypertension Intervention: Phentermine/topiramate Comparison: Placebo | ||||||
| Outcomes | Anticipated absolute effects (95% CI) | Relative effect | No of Participants | Quality of the evidence | Comments | |
|---|---|---|---|---|---|---|
| Risk with placebo | Risk with phentermine/topiramate | |||||
| Total mortality Follow‐up: 56 weeks | see comment | ‐ | 1305 (1 study) | ⊕⊕⊝⊝ | No death occurred in the hypertensive subgroup of the only included RCT. | |
| Cardiovascular morbidity Follow‐up: 56 weeks | see comment | ‐ | 1305 (1 study) | ⊕⊝⊝⊝ very lowb | 2.3% of the hypertensive participants in the low‐dose phen/top group, 3.7% in the high‐dose phen/top group, and 1.7% in the placebo group experienced treatment‐emergent cardiovascular adverse events. | |
| Serious adverse events Follow‐up: 56 weeks | 42 per 1000 | 36 per 1000 (21 to 62) | RR 0.85 (0.49 to 1.48) | 1305 (1 study) | ⊕⊕⊝⊝ | ‐ |
| All adverse events Follow‐up: 56 weeks | 773 per 1000 | 873 per 1000 (835 to 927) | RR 1.13 (1.08 to 1.20) | 1305 (1 study) | ⊕⊕⊝⊝ | ‐ |
| Change in systolic blood pressure compared to placebo (mm Hg) from baseline to end of study Follow‐up: 56 weeks | Reduction of systolic blood pressure was −4.9 mm Hg | Low dose: MD 2.0 mm Hg lower (3.97 lower to 0.03 lower) | ‐ | 772 (1 study) | ⊕⊕⊝⊝ | ‐ |
| High dose: MD 4.2 mm Hg lower (5.85 lower to 2.55 lower) | ‐ | 1030 (1 study) | ⊕⊕⊝⊝ | ‐ | ||
| Change in diastolic blood pressure compared to placebo (mm Hg) from baseline to end of study Follow‐up: 56 weeks | Reduction of diastolic blood pressure was −4.9 mm Hg | Low dose: MD 1.3 mm Hg lower (2.6 lower to 0.0 lower) | ‐ | 772 (1 study) | ⊕⊕⊝⊝ | ‐ |
| High dose: MD 1.9 mm Hg lower (2.88 lower to 0.92 lower) | ‐ | 1030 (1 study) | ⊕⊕⊝⊝ | ‐ | ||
| Change in body weight as compared to placebo (%) from baseline to end of study Follow‐up: 56 weeks | Reduction of body weight was −1.9 % | Low dose: MD 6.3 % lower (7.37 lower to 5.23 lower) | ‐ | 772 (1 study) | ⊕⊕⊝⊝ | Percentage change from initial body weight. |
| High dose: MD 8.2 % lower (9.09 lower to 7.31 lower) | ‐ | 1030 (1 study) | ⊕⊕⊝⊝ | Percentage change from initial body weight. | ||
| CI: confidence interval; MD: mean difference; RR: risk ratio | ||||||
| GRADE Working Group grades of evidence | ||||||
| aDowngraded by two levels because of serious imprecision (single study) ‐ see Appendix 2. | ||||||
| Naltrexone/bupropion compared with placebo for weight reduction | ||||||
| Patient or population: Men and non‐pregnant women ≥ 18 years old with essential hypertension Intervention: Naltrexone/bupropion Comparison: Placebo | ||||||
| Outcomes | Anticipated absolute effects (95% CI) | Relative effect | No of Participants | Quality of the evidence | Comments | |
|---|---|---|---|---|---|---|
| Risk with placebo | Risk with naltrexone/bupropion | |||||
| Total mortality Follow‐up: 121 weeks | 15 per 1000 | 15 per 1000 (11 to 21) | RR 0.99 (0.70 to 1.40) | 8283 (1 study) | ⊕⊕⊕⊝ | ‐ |
| Cardiovascular morbidity Follow‐up: 121 weeks | 29 per 1000 | 32 per 1000 (25 to 40) | RR 1.11 (0.87 to 1.41) | 8283 (1 study) | ⊕⊕⊝⊝ | MI, stroke + hospitalisation for unstable angina. |
| Serious adverse events Follow‐up: 121 weeks | 205 per 1000 | 215 per 1000 (196 to 233) | RR 1.05 (0.96 to 1.14) | 8283 (1 study) | ⊕⊕⊕⊝ | ‐ |
| All adverse events Follow‐up: 121 weeks | 256 per 1000 | 432 per 1000 (404 to 460) | RR 1.69 (1.58 to 1.80) | 8283 (1 study) | ⊕⊕⊕⊝ | ‐ |
| Change in systolic blood pressure as compared to placebo (mm Hg) from baseline to end of study Follow‐up: 56 weeks | Increase of systolic blood pressure was 2.2 mm Hg | MD 0.0 mm Hg higher (0.6 lower to 0.6 higher) | ‐ | 8283 (1 study) | ⊕⊕⊕⊕⊝ | ‐ |
| Change in diastolic blood pressure as compared to placebo (mm Hg) from baseline to end of study Follow‐up: 121 weeks | Increase of diastolic blood pressure was 1.1 mm Hg | MD 0.3 mm Hg higher (0.08 lower to 0.68 higher) | ‐ | 8283 (1 study) | ⊕⊕⊕⊝ | ‐ |
| Change in body weight as compared to placebo (kg) from baseline to end of study Follow‐up: 121 weeks | Reduction of body weight was 0.0 kg | MD 1.9 kg lower (2.07 lower to 1.73 lower) | ‐ | 8283 (1 study) | ⊕⊕⊕⊝ | ‐ |
| CI: confidence interval; MD: mean difference; RR: risk ratio | ||||||
| GRADE Working Group grades of evidence | ||||||
| aDowngraded by one level because of imprecision (single study). | ||||||
Background
Description of the condition
Hypertension is a chronic condition associated with an increased risk of cardiovascular mortality and morbidity. It is estimated that raised blood pressure affects 1.13 billion people worldwide and leads to over 9 million deaths each year (WHO 2013). Lowering blood pressure levels in hypertensive people has been shown to be an effective means of reducing cardiovascular morbidity and mortality.
Epidemiological investigations have consistently found an association between high blood pressure and different lifestyles, one of them being excess body weight. Major guidelines recommend weight reduction as a first‐step intervention in the therapy of hypertensive people (Hypertension Canada 2018; ACC/AHA 2017; ESC/ESH 2018; NICE 2019). Body weight may be reduced by lifestyle modifications as well as pharmacological and invasive interventions.
Description of the intervention
For a select group of overweight or obese people for whom lifestyle interventions are unsuccessful, anti‐obesity drugs may be an option to help reduce body weight. Orlistat, sibutramine, and rimonabant were formerly the most commonly used anti‐obesity drugs, but only orlistat, which was approved in 1998, still has market approval for the long‐term treatment of obesity. Since 2012, four additional drugs (lorcaserin, liraglutide, phentermine/topiramate, and naltrexone/bupropion) have been approved by the US Food and Drug Administration (FDA) for obese (body mass index (BMI) ≥ 30 kg/m2) and overweight (BMI ≥ 27 kg/m2) people with at least one obesity‐related comorbidity (FDA 2012a; FDA 2012b; FDA 2014a; FDA 2014b). These medications have been quoted in guidelines for the long‐term pharmacological treatment of obesity (Apovian 2015). In Europe, liraglutide, which has also been approved for the treatment of diabetes mellitus type 2, and naltrexone/bupropion were approved for weight management in March 2015 by the European Medicines Agency (EMA) (EMA 2015a; EMA 2015b). In 2013, the manufacturer of lorcaserin withdrew its application to the EMA after the Committee for Medicinal Products for Human Use raised safety concerns (EMA 2013a), while the EMA refused marketing authorisation for phentermine/topiramate due to safety concerns (EMA 2013c).
Sibutramine and rimonabant both lost their marketing approval about 10 years ago.Sibutramine was approved by the FDA in 1997 and by the EMA in 1999. Preliminary results of the Sibutramine Cardiovascular Outcomes Trial (SCOUT 2010), presented in October 2009, showed an increased risk of serious cardiovascular events (such as heart attack or stroke) among people with known cardiovascular disease who were taking sibutramine. This led the FDA and EMA to recommend suspension of the marketing authorisation (EMA 2010a; EMA 2010b; FDA 2010a). In January 2010, Abbot Laboratories agreed to voluntarily withdraw sibutramine from the European market (Abbott 2010), and in October 2010 from the US market (FDA 2010b). Rimonabant received regulatory approval in several European countries in 2006, but failed to receive FDA approval after preclinical and clinical data raised concerns about an association between rimonabant intake and the increased incidence of psychiatric adverse events, including suicidality, an ill‐defined constellation of neurological signs and symptoms, and seizures (FDA 2007). In October 2008, the EMA recommended the suspension of rimonabant from the market because of newly‐available post‐marketing analyses demonstrating detrimental effects compared with placebo (EMA 2008a; EMA 2008b). In January 2009, the European Commission decided to withdraw market authorisation for rimonabant in all countries of the European Union (EMA 2009a). In February 2020, lorcaserin was withdrawn from the US market by the manufacturer after a request by the FDA (Eisai Inc. 2020). This action was taken after an FDA analysis of data from a safety clinical trial showed an increased occurrence of cancer in participants treated with lorcaserin (FDA 2020).
How the intervention might work
Anti‐obesity drugs aim to reduce body weight and to maintain the weight reduction over a longer period. Orlistat is a gastric and pancreatic lipase inhibitor that blocks the absorption of about 30% of dietary fat (Padwal 2007). Liraglutide, a glucagon‐like peptide 1 (GLP‐1) receptor agonist, appears to regulate appetite by increasing feelings of satiety (Russell‐Jones 2009). The combination of phentermine, a neurostabiliser, and topiramate, an antiseizure medication, appears to have an additive effect on weight reduction (Aronne 2013). In combination with naltrexone, bupropion, a dopamine and norepinephrine reuptake inhibitor, reduces appetite and increases energy expenditure (Caixas 2014). The mechanisms by which these three medications cause weight loss are not yet fully understood. Lorcaserin is a selective serotonin receptor agonist and increases the sense of fullness (Taylor 2013). Dietary‐intervention studies in hypertensive people have shown a positive association between weight loss and blood pressure reduction (Horvath 2008). It therefore seems reasonable to suppose that medical weight‐reducing treatment may also lead to a fall in blood pressure.
Why it is important to do this review
For overweight or obese people with established hypertension, blood pressure should first be managed with non‐pharmacological interventions such as weight reduction (Hypertension Canada 2018; ACC/AHA 2017; ESC/ESH 2018; NICE 2019). Since anti‐obesity drugs may support the efforts of people to reduce body weight, it is important that the physician be informed about the efficacy and potential harms of these drugs before prescribing them.
Systematic reviews and meta‐analyses have shown that pharmacological weight‐reducing interventions with orlistat, lorcaserin, phentermine/topiramate,and liraglutide reduce both blood pressure and body weight (Chan 2013; Khera 2018; LeBlanc 2018; Zhang 2015). Treatment with naltrexone/bupropion reduced body weight but did not lower blood pressure (Caixas 2014; Khera 2018, LeBlanc 2018). None of these reviews investigated the efficacy and safety of weight‐reducing drugs in the subgroup of overweight or obese people with hypertension. Furthermore, only limited data were available on the question of whether pharmacological weight reduction lowers the risk of mortality and other patient‐relevant endpoints. Results from a few RCTs showed no beneficial effect on cardiovascular events for liraglutide or phentermine/topiramate compared to placebo (LeBlanc 2018). Two studies examining clinical endpoints for rimonabant (CRESCENDO 2010) and sibutramine (SCOUT 2010) have resulted in the drugs being withdrawn from the market. Neither sibutramine nor rimonabant are therefore considered relevant for this review update.This currently leaves orlistat, liraglutide and naltrexone/bupropion as approved for the long‐term treatment of obesity in Europe and the USA, and lorcaserin and phentermine/topiramate as approved for the long‐term treatment of obesity in the USA only.
This is an update of a previously‐published Cochrane Review (Siebenhofer 2016).
Objectives
Primary objectives:
To assess the long‐term effects of pharmacologically‐induced reduction in body weight in adults with essential hypertension on all‐cause mortality, cardiovascular morbidity, and adverse events (including total serious adverse events, withdrawal due to adverse events, and total non‐serious adverse events).
Secondary objectives:
To assess the long‐term effects of pharmacologically‐induced reduction in body weight in adults with essential hypertension on change from baseline in systolic blood pressure, change from baseline in diastolic blood pressure, and body weight reduction.
Methods
Criteria for considering studies for this review
Types of studies
The study design must meet the following criteria: all randomised controlled trials (RCTs) comparing pharmacologic interventions approved for long‐term weight management versus placebo, with a follow‐up of at least 24 weeks. The reason for including only studies with a follow‐up of at least 24 weeks is that studies of shorter duration cannot show long‐term effects. Any additional active care (for example, antihypertensive medication) must have been applied to the active treatment group and to the control group.
Types of participants
Men and non‐pregnant women aged 18 years or older with essential hypertension (i.e. a baseline blood pressure of at least 140 mm Hg systolic or a diastolic blood pressure of at least 90 mm Hg, or both, or people on antihypertensive treatment), for whom at least one of the following outcomes was reported: mortality, cardiovascular outcomes, adverse events, or blood pressure.
Types of interventions
Monotherapy with drugs for long‐term weight management (orlistat, phentermine/topiramate, lorcaserin, naltrexone/bupropion, or liraglutide).
Types of outcome measures
We included the following outcomes:
Primary outcomes
-
Total mortality
-
Cardiovascular morbidity
-
Adverse events (withdrawals due to adverse events, adverse events related to a particular anti‐obesity drug)
Secondary outcomes
-
Change in systolic blood pressure
-
Change in diastolic blood pressure
-
Change in body weight
Search methods for identification of studies
Electronic searches
The Cochrane Hypertension Information Specialist searched the following databases, without language, publication year or publication status restrictions:
-
the Cochrane Hypertension Specialised Register via the Cochrane Register of Studies (CRS‐Web) (searched 20 March 2020);
-
the Cochrane Central Register of Controlled Trials (CENTRAL) via the Cochrane Register of Studies (CRS‐Web; searched 17 March 2020);
-
MEDLINE Ovid (from 1946 onwards), MEDLINE Ovid Epub Ahead of Print, and MEDLINE Ovid In‐Process & Other Non‐Indexed Citations (searched 17 March 2020);
-
Embase Ovid (from 1974 onwards) (searched 17 March 2020);
-
ClinicalTrials.gov (www.clinicaltrials.gov); (searched 17 March 2020);
-
World Health Organization International Clinical Trials Registry Platform (www.who.it.trialsearch); (searched 17 March 2020).
The Information Specialist modelled subject strategies for databases on the search strategy designed for MEDLINE. Where appropriate, they were combined with subject strategy adaptations of the highly sensitive search strategy designed by Cochrane for identifying randomised controlled trials (as described in the Cochrane Handbook for Systematic Reviews of Interventions Version 6 (Handbook 2019; Lefebvre 2019)). We present search strategies for major databases in Appendix 4.
The search strategy used in the previous review versions is documented in Appendix 5, Appendix 6 and Appendix 7.
Searching other resources
-
The Cochrane Hypertension Information Specialist searched the Hypertension Specialised Register segment (which includes searches of MEDLINE, Embase, and Epistemonikos for systematic reviews) to retrieve existing reviews relevant to this systematic review, so that we could scan their reference lists for additional trials. The Specialised Register also includes searches for controlled trials in the Allied and Complementary Medicine Database (AMED), CAB Abstracts & Global Health, CINAHL, ProQuest Dissertations & Theses and Web of Science.
-
We checked the bibliographies of included studies and any relevant systematic reviews identified for further references to relevant trials.
-
Where necessary, we contacted authors of key papers and abstracts to request additional information about their trials
Data collection and analysis
Selection of studies
Two review authors (from SW, TS, KH, KJ) independently screened the title and abstract of each reference identified by the search and applied the inclusion criteria. We retrieved potentially relevant studies in full, and again two review authors (SW, TS) independently decided whether they met the inclusion criteria. In case of disagreement, we also obtained the full article and the two review authors inspected it independently, resolving differences in opinion by recourse to a third party. If a resolution of the disagreement was not possible, we classified the article as 'awaiting assessment' and contacted the authors of the study for clarification.
Data extraction and management
Two review authors (from SW, TS, KH, KJ, CK) independently extracted data using a data extraction form. We resolved differences in data extraction by consensus, referring back to the original article. We sought information from the authors of the primary studies if necessary. We extracted, checked, and recorded the following data.
1. General information
This included all publications of a single trial, the sponsor of the trial (specified, known or unknown), and the country in which the trial was conducted.
2. Methods section
The information on the methods summarised the characteristics of the trial, participants, and interventions, and the outcome measures used and reported in the publication.
2.1. Characteristics of the trial
The reported items included the design and duration of the trial, randomisation (and method), allocation concealment (and method), blinding (participants, people administering treatment, outcome assessors), and checking of blinding.
2.2. Characteristics of participants
This included the number of participants in each group, how the participants were selected (random, convenience), the exclusion criteria used, and their demographic characteristics (for example, age, gender, nationality, ethnicity). We extracted disease‐related information about duration of hypertension. We checked the similarity of groups at baseline as well as reports about withdrawals and losses to follow‐up (reasons/description), and described them in the 'Risk of bias' tables in Characteristics of included studies. If subgroups were analysed, we noted and reported the reasons and methods.
2.3. Characteristics of interventions
The relevant information to be extracted was the duration of the intervention, length of follow‐up (in months), the type of anti‐obesity drug (orlistat, lorcaserin, phentermine/topiramate, naltrexone/bupropion, or liraglutide), the dose, and the administration route.
2.4. Characteristics of outcome measures
We reported the measures mentioned in the outcome section and any other outcomes measured in the study.
3. Data from clinical trial registers
If data from included trials were available as study results in clinical trial registers such as ClinicalTrials.gov or similar sources, we made full use of this information and extracted the data. If there was also a full publication of the trial, we collated and critically appraised all available data. If an included trial was marked as a completed study in a clinical trial register but no additional information (study results, publication or both) was available, we added this trial to the table Characteristics of excluded studies.
Assessment of risk of bias in included studies
Two review authors (from SW, TS, KH, KJ, CK) independently assessed trials fulfilling the inclusion criteria in order to evaluate methodological quality, resolving any differences in opinion by discussion with a third review author (from TS, KH, KJ). We assessed all trials using the 'Risk of bias' assessment tool (Higgins 2019), and we judged the 'Risk of bias' criteria as having low, high or unclear risk. We evaluated individual bias items as described in the Cochrane Handbook for Systematic Reviews of Interventions according to the categories: adequate sequence generation, allocation concealment, blinding, incomplete outcome data, selective reporting, and other potential biases. We evaluated the risk of bias for the categories of blinding and incomplete outcome data separately for each outcome (Hróbjartsson 2013). We noted whether endpoints were self‐reported, investigator‐assessed or adjudicated outcome measures.
Measures of treatment effect
When at least two included trials were available for a comparison and a given outcome, we tried to express dichotomous data as a risk ratio (RR) with a 95% confidence interval (CI). For continuous outcomes (changes in blood pressure and body weight), we estimated the intervention effect using the mean difference with a 95% CI.
Unit of analysis issues
We intended to consider the level at which randomisation occurred, such as cross‐over trials, cluster‐randomised trials and multiple observations for the same outcome. If more than one comparison from the same trial was eligible for inclusion in the same meta‐analysis, we either combined groups to create a single pair‐wise comparison or appropriately reduced the sample size so that the same participants did not contribute more than once (splitting the 'shared' group into two or more groups). While the latter approach offers some solution to adjusting the precision of the comparison, it does not account for correlation arising because the same set of participants was included in multiple comparisons (Deeks 2019).
Dealing with missing data
We obtained relevant missing data from authors and from the Institute for Quality and Efficiency in Health Care report (IQWiG 2006). We evaluated important numerical data such as screened, eligible, and randomised participants as well as intention‐to‐treat (ITT) and per‐protocol (PP) populations. We investigated attrition rates, for example dropouts, losses to follow‐up, and withdrawals. We critically appraised issues of missing data, ITT, and PP and, if available, compared them to the specification of primary outcome parameters and power calculations.
Assessment of heterogeneity
We assessed heterogeneity using Higgins I2.
Assessment of reporting biases
If we included 10 or more trials that investigated a particular outcome, we assessed publication bias and small‐study effects using the funnel plot. Several explanations may account for funnel plot asymmetry, including true heterogeneity of effect with respect to trial size, poor methodological design (and hence bias of small trials) and publication bias. We therefore interpreted the results cautiously (Sterne 2011).
Data synthesis
We summarised data statistically when they were available, sufficiently similar, and of sufficient quality. We performed analyses separately for each drug. We performed statistical analysis according to the statistical guidelines referenced in the current version of the Cochrane Handbook for Systematic Reviews of Interventions (Deeks 2019). We considered fixed‐effect and random‐effects models for the meta‐analyses. In case of between‐study variability, we present the results of the random‐effects model. If standard deviations were unavailable, we approximated them on the basis of P values and sample sizes.
Subgroup analysis and investigation of heterogeneity
We performed subgroup analyses where appropriate. Heterogeneity among participants could be related to, for example, sex, age, body mass index, concomitant diseases, ethnicity, blood pressure at baseline, blood pressure goals, concomitant antihypertensive therapy, and socioeconomic status.
Sensitivity analysis
We tested the robustness of our results where appropriate, using several sensitivity analyses (for example, study quality or PP versus ITT analyses, studies with large dropout rates and losses to follow‐up). In case of substantial heterogeneity (I2 greater than 50%), we planned to perform sensitivity analyses for the following items: study quality, PP versus ITT analyses, sex, age, body mass index, concomitant diseases, ethnicity, blood pressure at baseline, blood pressure goals, concomitant antihypertensive therapy, and socioeconomic status.
Summary of findings and assessment of the certainty of the evidence
We used the GRADE approach to assess the certainty of the evidence (Guyatt 2011). We present the main results of the review, including a summary of the data, the magnitude of the effect and the overall certainty of the evidence, for each type of weight‐reducing drug separately in summary of findings Table 1, summary of findings Table 2, and summary of findings Table 3.
We include all primary and secondary outcomes in the 'Summary of findings' tables, listed according to priority:
-
Total mortality
-
Cardiovascular morbidity
-
Adverse events
-
Change in systolic blood pressure
-
Change in diastolic blood pressure
-
Change in body weight
Results
Description of studies
See: Characteristics of included studies; Characteristics of excluded studies.
Results of the search
Our search of the electronic databases for this third update in 2020 yielded 739 records after correcting for duplication. The consensus was that on the basis of their abstracts, 649 of these were not relevant to the question under study and should be excluded. We identified no further studies from the reference lists of the included trials nor from relevant systematic reviews and meta‐analyses. We therefore identified 90 publications for further examination.
In the previous version of the review (Siebenhofer 2016) we retrieved 146 articles for full‐text evaluation. Among them was a report from the German Institute for Quality and Efficiency in Health Care (IQWiG), which provided data for an unpublished subgroup analysis of hypertensive people in the Xenical in the Prevention of Diabetes in Obese Subjects (XENDOS) study (IQWiG 2006; XENDOS 2001‐2006).
In summary, we identified 236 publications for further examination. After screening the full text of these selected publications and after contacting authors of potentially relevant studies, we excluded 198 articles. We also excluded five publications (four studies) from the previous version of this review that investigated the effect of sibutramine, since this drug is no longer considered relevant for the current update. Finally, three additional publications referring to the CONQUER 2013 trial (which had been included in the previous version of the review), and five articles referring to one new trial could be included from the 2020 update search. Together with the remaining 25 publications (five studies) from the previous version of the review (Siebenhofer 2016), we include in this third update 33 publications describing six completed studies (see Figure 1 for details of the PRISMA statement; PRISMA 2009).

Study flow diagram.
All relevant studies were published after the year 2000 and were written in English, except for the report from the Institute for Quality and Efficiency in Health Care (IQWiG 2006), which was published in German.
Included studies
We have provided details of the included studies in the Characteristics of included studies table and in Table 1; Table 2; Table 3. The following gives a brief overview of the comparisons between orlistat and placebo (four RCTs), naltrexone/bupropion and placebo (one RCT), and phentermine/topiramate and placebo (one RCT). We found no relevant studies investigating liraglutide or lorcaserin, since no results for participants with hypertension were available.
| Study | Intervention(s) and comparator(s) | Description of power and sample size calculation | Randomised | Safety (N) | ITT | Finishing trial | Randomised finishing trial | Follow‐up | |
|---|---|---|---|---|---|---|---|---|---|
| Orlistat vs placebo | |||||||||
| Orlistat | The sample size determination for the present trial was based on a 2‐sample t‐test (2‐tailed). Since there were 2 primary efficacy parameters in this trial, body weight reduction and sitting diastolic BP reduction, Holm’s sequential rejection procedure was used to project the overall type I error rate 0.05, and α = 0.025 was chosen for the calculation of sample size for each parameter. A mean body weight change of 2.1 kg and a within‐group standard deviation of 6.1 kg would require 161 participants per group to provide a power of 0.8 at α = 0.025. A mean change of 3.0 mm Hg in sitting diastolic BP with a within‐group standard deviation of 8.5 mm Hg would require 153 participants per group to provide power of 0.8 with α = 0.025. Based on these calculations, and assuming a dropout rate of 35%, 496 participants (248 participants per group) had to be enrolled to ensure an adequate statistical power of at least 80% in either of the 2 primary efficacy parameters. | 278 | nr | 267 | 162 | 58 | 24 weeks | ||
| Placebo | 276 | nr | 265 | 108 | 36 | ||||
| Orlistat | nr | 45 | 45 | 45 | 45 | 100 | 24 weeks | ||
| Placebo | 45 | 45 | 45 | 45 | 100 | ||||
| Orlistat | Power calculations indicated that, with a power of 80% at the 0.05 significance level, 408 participants were needed to detect a 2.5 mm Hg difference in diastolic BP, 152 participants were needed to detect a 0.05% difference in HbA1c. 140 participants were needed to detect a 0.35 mmol/l difference in LDL‐cholesterol. | 499 (HT: 304) | nr | 499 (HT: 304) | 458 (HT: nr) | 91.6% (HT: nr) | 24 weeks | ||
| Placebo | 505 (HT: 310) | nr | 505 (HT: 310) | 458 (HT: nr) | 90.7% (HT: nr) | ||||
| Orlistat (DBP ≥ 90 mm Hg) [OD] | A 2‐sided log‐rank test would require a minimum of ~ 95 primary cases of type 2 diabetes in both study groups combined to have 90% power of detecting a significant outcome at α = 0.05. With this event‐based design, 3305 participants were randomised and followed until sufficient events occurred. As a consequence of the design, study power would be unaffected by dropout rate. | 1650 | (HT: 408) | nr | 1640 (HT: nr) | (HT: 386) | 94.6 | 208 weeks | |
| Orlistat (SBP ≥ 140mm Hg) [OS] | (HT: 516) | nr | (HT: 491) | 95.2 | |||||
| Placebo (DBP ≥ 90 mm Hg) [PD] | 1655 | (HT: 441) | nr | 1637 (HT: nr) | (HT: 421) | 95.5 | |||
| Placebo (SBP ≥ 140 mm Hg) [PS] | (HT: 509) | nr | (HT: 487) | 95.7 | |||||
| Phentermine/topiramate vs placebo | |||||||||
| Phen/Top [LD] | Power analysis based on data from a previous study suggested that 250 participants in each group would provide > 95% power to detect a difference of 4.4% in weight loss between placebo and active treatments at a significance level of 0.05. To enhance the power for detecting differences in safety outcomes, we planned to enrol about 2500 participants. | 498 (HT: 261) | 398 (HT: 261) | 488 (HT: 261) | 374 (HT: 256) | 75.1 (HT: 98.1) | 56 weeks | ||
| Phen/Top [HD] | 995 (HT: 520) | 994 (HT: 520) | 981 (HT: 520) | 733 (HT: 514) | 73.7 (HT: 98.8) | ||||
| Placebo | 994 (HT: 524) | 993 (HT: 524) | 976 (HT: 524) | 616 (HT: 516) | 61.9 (HT: 98.5) | ||||
| Naltrexone/bupropion vs placebo | |||||||||
| Nal/Bup | The trial was designed to provide 90% power to rule out the 1.4 margin (i.e. the upper limit of the confidence interval would not exceed 1.4) when the true HR is 1.0, which required 378 primary events. The early pre‐approval analysis to rule out the 2.0 margin required 87 primary events to provide 90% power when the true HR is 1.0. In both settings, a 1‐sided type I error (α) of 2.5% was used. To obtain sample sizes, an annualised rate of primary events of 1.5% in the placebo group was assumed. The recruitment was assumed to take 1.5 years, with maximum participant follow‐up of 4 years. It was assumed that 7% of the study population would discontinue during the lead‐in period, with a loss–to–follow‐up rate of 1.2% annually. | 4456 (HT: 4164) | 4455 (HT: 4164) | 4455 (HT: 4164) | 705 (HT: nr) | 15.8% (HT: nr) | 121 weeks | ||
| Placebo | 4454 (HT: 4123) | 4450 (HT: 4119) | 4450 (HT: 4119) | 275 (HT: nr) | 6.2% (HT: nr) | ||||
DBD: diastolic blood pressure; HR: hazard ratio; HT: hypertensive subgroup; ITT: intention‐to‐treat; nr: not reported; [OD]: orlistat and diastolic blood pressure ≥ 90 mm Hg; [OS]: orlistat and systolic blood pressure ≥ 140 mm Hg; Phen/Top [HD]: phentermine/topiramate high dose (15 mg/92 mg); Phen/Top [LD]: phentermine/topiramate low dose (7.5 mg/46 mg); [PD]: placebo and diastolic blood pressure ≥ 90 mm Hg; [PS]: placebo and systolic blood pressure ≥ 140 mm Hg; SBD: systolic blood pressure.
| Study | Intervention(s) and comparator(s) | Description of participants | Nationality | Setting | Ethnic groups (%) | Duration of disease (mean years (SD)) | Antihypertensive treatment (%) |
|---|---|---|---|---|---|---|---|
| Orlistat vs placebo | |||||||
| Orlistat | Obese individuals with insufficiently controlled hypertension | USA | Outpatient clinic | White (85) African American (11) Hispanic (4) Other (0) | nr | Antihypertensive‐treatment at trial onset: 95% ACE‐inhibitor (27) Ca‐antagonists (29) β‐blocker (27) Diuretic (19) AT‐II‐receptor antagonists (6) α‐blocker (10) Other (11), | |
| Placebo | White (86) African American (12) Hispanic (1) Other (1) | nr | antihypertensive‐treatment at trial onset: 94% ACE‐inhibitor (35) Ca‐antagonist (30) β‐blocker (26) Diuretic (14) AT‐II‐receptor antagonists (10) α‐blocker (8) Other (9) | ||||
| Orlistat | Obese individuals with metabolic syndrome, diabetes type 2, hypertension, mostly with coronary heart disease (77%) and concomitant cardiac dysfunction | Switzerland | Outpatient clinic | White (100) | nr | Antihypertensive‐treatment at trial onset: 100% ACE‐inhibitor (36) Ca‐antagonist (18) β‐blocker (49) Diuretic (low‐dose hydrochlorothiazide) (60) AT‐II‐receptor antagonists (49) | |
| Placebo | |||||||
| Orlistat | Obese individuals with diabetes type 2, hypertension or hypercholesterolaemia | France | Private practices (endocrinologists) | nr | nr | Antihypertensive‐treatment at trial onset: 70% | |
| Placebo | |||||||
| Orlistat (DBP ≥ 90 mm Hg) [OD] | Obese individuals with normal or impaired glucose tolerancea | Sweden | Medical centres | nr | nr | ACE‐inhibitors (7) Ca‐antagonists (6) β‐blockers (17) Diuretics (7) AT‐II‐receptor antagonists (2) | |
| Orlistat (SBP ≥ 140 mm Hg) [OS] | ACE‐inhibitors (6) Ca‐antagonists (6) β‐blockers (14) Diuretics (8) AT‐II‐receptor antagonists (2) | ||||||
| Placebo (DBP ≥ 90 mm Hg) [PD] | ACE‐inhibitors (7) Ca‐antagonists (7) β‐blockers (13) Diuretics (11) AT‐II‐receptor antagonists (1) | ||||||
| Placebo (SBP ≥ 140 mm Hg) [PS] | ACE‐inhibitors (8) Ca‐antagonists (8) β‐blockers (13) Diuretics (10) AT‐II‐receptor antagonists (2) | ||||||
| Phentermine/topiramate vs placebo | |||||||
| Phen/Top [LD] | Obese or overweight individuals with 2 or more comorbidities (hypertension, dyslipidaemia, diabetes or prediabetes, or abdominal obesity)a | USA | Outpatient clinic | White (83) African American (15) Hispanic or Latino (10) | nr | ACE inhibitors alone (26.9) β‐blockers alone (24.1) AT‐II‐receptor antagonists alone (15.5) ACE inhibitors + diuretics (5.8) ACE inhibitors + Ca‐antagonists (3.5), AT‐II‐receptor antagonists + diuretics (12.4) AT‐II‐receptor antagonists + Ca‐antagonists (0.9) | |
| Phen/Top [HD] | |||||||
| Placebo | |||||||
| Naltrexone/bupropion vs placebo | |||||||
| Nal/Bup | Overweight or obese people at increased risk of adverse cardiovascular outcomes | USA | Medical sites | White (83.3) Black (15.3) Other (1.4) | 12.2 (9.40) | 97.1 | |
| Placebo | White (82.3) Black (15.3) Other (2.4) | 11.6 (9.03) | 97.2 | ||||
a only data for the predefined subgroup of hypertensive participants are reported here.
ACE inhibitors: angiotensin‐converting enzyme inhibitors; AT‐II‐receptor antagonists: angiotensin II‐receptor antagonists; DBP: diastolic blood pressure; nr: not reported; [OD]: orlistat and diastolic blood pressure ≥ 90 mm Hg; [OS]: orlistat and systolic blood pressure ≥ 140 mm Hg; Phen/Top; [HD]: phentermine/topiramate high dose (15 mg/92 mg); Phen/Top [LD]: phentermine/topiramate low dose (7.5 mg/46 mg); [PD]: placebo and diastolic blood pressure ≥ 90 mm Hg; [PS]: placebo and systolic blood pressure ≥ 140 mm Hg; SBD: systolic blood pressure; SD: standard deviation.
| Study | Intervention(s) and comparator(s) | Age (mean years (SD)) | Sex | BMI | Body weight (mean kg (SD)) | Sitting systolic blood pressure (mean mm Hg (SD)) | Sitting diastolic blood pressure (mean mm Hg (SD)) | Comorbid conditions (%) |
|---|---|---|---|---|---|---|---|---|
| Orlistat vs placebo | ||||||||
| Orlistat | 53.2 (0.5) | 63 | 35.8 (3.9) | 101.2 (1.0) | 154.2 (13.4) | 98.4 (3.7) | diabetes (8) | |
| Placebo | 52.5 (0.5) | 59 | 35.4 (4.0) | 101.5 (1.0) | 150.8 (12.7) | 98.3 (35) | diabetes (8) | |
| Orlistat | 54.9 (5.1) | 51 | 36.5 (1.9) | 107.0 (5.7) | 145.8 (9.8) | 87.8 (7.3) | metabolic syndrome (100) coronary heart disease (77) myocardial infarction (47) | |
| Placebo | 54.5 (4.5) | 51 | 36.1 (1.8) | 106.0 (5.9) | 142.1 (6.2) | 85.3 (5.6) | ||
| Orlistat | 49.1 (0.6) | 69 | 34.3 (0.2) | 93.9 (0.8) | 150.0 (0.8) | 96.9 (0.3) | nr | |
| Placebo | 49.5 (0.5) | 65 | 33.9 (0.2) | 93.5 (0.8) | 152.2 (0.9) | 97.0 (0.3) | nr | |
| Orlistat (DBP ≥ 90 mm Hg) [OD] | 46 (7) | 3862 | nr | 116 (17) | 146 (13) | 95 (5) | nr | |
| Orlistat (SBP ≥ 140mm Hg) [OS] | 47(7) | 42 | nr | 116 (17) | 149 (10) | 91 (9) | nr | |
| Placebo (DBP ≥ 90 mm Hg) [PD] | 46 (7) | 4456 | nr | 114 (18) | 142 (126) | 95 (5) | nr | |
| Placebo (SBP ≥ 140 mm Hg) [PS] | 47(7) | 42 | nr | 115 (18) | 149 (8) | 91 (8) | nr | |
| Phentermine/topiramate vs placebo | ||||||||
| Phen/Top [LD] | 53.0 (9.8) | 65.9% | 36.7 (4.6) | 104.4 (18.4) | 134.2 (13.0) | 83.7 (9.1) | nr | |
| Phen/Top [HD] | ||||||||
| Placebo | ||||||||
| Naltrexone/bupropion vs placebo | ||||||||
| Nal/Bup | 61.8 (7.27) | 54.5 | 37.1 (5.27) | 106 (19.09) | 126.1 (12.55) | 74.5 (9.01) | History of cardiovascular disease (30.3) History of Type 2 diabetes (86.4) History of dyslipidaemia (92.4) History of low LDL (27.8) Current smoker (8.4) | |
| Placebo | 61.6 (7.38) | 54.4 | 37.3 (5.42) | 106.6 (19.17) | 125.7 (12.62) | 74.4 (9.14) | History of cardiovascular disease (31.3) History of type 2 diabetes (86.9) History of dyslipidemia (92.1) History of low LDL (28.2) Current smoker (8.5) | |
BMI: body mass index; LDL: low‐density lipoprotein; nr: not reported; [OD]: orlistat and diastolic blood pressure ≥ 90 mm Hg; [OS]: orlistat and systolic blood pressure ≥ 140 mm Hg; Phen/Top [HD]: phentermine/topiramate high dose (15 mg/92 mg); Phen/Top [LD]: phentermine/topiramate low dose (7.5 mg/46 mg); [PD]: placebo and diastolic blood pressure ≥ 90 mm Hg; [PS]: placebo and systolic blood pressure ≥ 140 mm Hg; SBD: systolic blood pressure; SD: standard deviation.
Orlistat versus placebo
All four included studies had a parallel, double‐blind design (Bakris 2002; Cocco 2005; Guy‐Grand 2004; XENDOS 2001‐2006). Only Cocco 2005 did not mention any industry sponsorship, and it was the only study that was performed as a single‐centre trial.
Participants and duration
The four included studies involved a total of 3132 hypertensive participants with a mean age of 46 to 55 years, a baseline systolic blood pressure (BP) of 142 to 154 mm Hg and a baseline diastolic BP of 85 to 98 mm Hg. Mean treatment duration was 6 to 48 months. All participants in Bakris 2002 and Cocco 2005 were overweight and hypertensive. In Cocco 2005 all participants also had diabetes mellitus type 2. One trial (Guy‐Grand 2004) included overweight people with diabetes mellitus type 2, hypercholesterolaemia or hypertension, and reported results for the predefined subgroup of participants with hypertension. XENDOS 2001‐2006 included both normotensive and hypertensive obese participants. Data are available for two predefined subgroups of hypertensive participants (first subgroup: diastolic BP at baseline ≥ 90 mm Hg; second subgroup: systolic BP at baseline ≥ 140 mm Hg). Participants in one subgroup may also be included in the other subgroup. We present the data for the two subgroups separately in this review. For meta‐analyses we used the results of the subgroup with participants having a diastolic BP of ≥ 90 mm Hg at baseline.
Interventions
Participants received either 120 mg orlistat three times daily or placebo in all studies. In Bakris 2002, Cocco 2005 and XENDOS 2001‐2006, participants in all study groups were also encouraged to modify their lifestyle and increase physical activity.
Outcomes
Primary outcomes
No study included mortality or cardiovascular morbidity as predefined outcomes. All studies reported adverse events.
Secondary outcomes
All studies described the mean change in systolic and diastolic BP and the mean change in body weight.
Phentermine/topiramate versus placebo
The only included study was multicentre, with 93 study sites in the USA (CONQUER 2013). The study had a parallel, double‐blind design and the industry sponsor was mentioned.
Participants and duration
The included study involved 2487 obese or overweight people with two or more comorbidities (hypertension, dyslipidaemia, diabetes or prediabetes, or abdominal obesity). The hypertensive subgroup included 1305 participants with a mean age of 53 years, a mean baseline systolic BP of 134 mm Hg and a mean baseline diastolic BP of 84 mm Hg. About 90% of the included participants were taking antihypertensive medication. Among the hypertensive subgroup, 216 participants had uncontrolled hypertension at baseline. The treatment duration was 56 weeks.
Interventions
The study compared two different dose regimens of phentermine/topiramate once daily versus placebo. All participants in the active groups received an initial dose of 7.5 mg phentermine and 23 mg topiramate. During an initial four‐week titration period, doses were increased weekly (3.75 mg phentermine and 23 mg topiramate) until the assigned dosages of 7.5 mg phentermine/46.0 mg topiramate (group low dose) or 15 mg phentermine/92.0 mg topiramate (group high dose) were achieved. The assigned dosages were maintained for 52 weeks. In addition, all participants received a standardised counselling for diet (to reduce caloric intake by 500 kcal/day) and lifestyle modification.
Outcomes
Primary outcomes
The study did not include mortality or cardiovascular morbidity as predefined outcomes. Adverse events were reported.
Secondary outcomes
The study described the mean change in systolic and diastolic BP and the mean percentage change in body weight.
Naltrexone/bupropion versus placebo
The included trial was a parallel, double‐blind placebo‐controlled multicentre trial with 266 study sites in the USA (Nissen 2016). The trial was funded by Orexigen Therapeutics Inc. and Takeda Pharmaceuticals International.
Participants and duration
The trial involved 8910 obese or overweight people aged at least 45 years (men) or 50 years (women), with an increased risk of adverse cardiovascular events. Results for the subgroup of participants with hypertension were provided by the authors upon request. The hypertensive subgroup included 8287 participants (93% of the total study population), with a mean age of 62 years, a mean baseline systolic BP of 126 mm Hg and a mean baseline diastolic BP of 75 mm Hg. About 97% of the included participants were taking antihypertensive medication. Among the hypertensive subgroup, about 87% of the participants had diabetes mellitus type 2 and about 30% had cardiovascular disease. The median duration of follow‐up was 121 weeks (interquartile range,114 to 128 weeks).
Interventions
The participants received either a fixed‐dose combination of naltrexone (8 mg) and bupropion (90 mg) or placebo once or twice a day. During an initial four‐week titration period, the number of tablets were increased weekly (one tablet a day during the first week, two tablets a day during week two, three tablets a day during week three, and four tablets a day during week four and thereafter). All participants also received an internet‐based weight management programme focused on healthy eating and physical activity.
Outcomes
Primary outcomes
All‐cause mortality was reported as an additional outcome. Cardiovascular death, fatal or nonfatal stroke, fatal or nonfatal myocardial infarction were reported as primary and secondary outcomes.
Secondary outcomes
The study described the mean change in systolic and diastolic BP and the mean change in body weight.
Excluded studies
Full‐text evaluation in the study selection process of this review resulted in the exclusion of 124 studies (203 publications/records). The main reason for exclusion was a lack of data for the hypertensive subgroup in studies including normotensive as well as hypertensive participants. Other reasons for exclusion were not describing a randomised controlled trial, not including participants with essential hypertension, having a duration of intervention of less than 24 weeks, or including different accompanying antihypertensive therapies in the study groups. We provide reasons for excluding each trial in the Characteristics of excluded studies table.
Risk of bias in included studies
The judgements of the risk of bias for all included studies are shown in the 'Risk of bias' summary figures (Figure 2; Figure 3). For details see the 'Risk of bias' tables in Characteristics of included studies. The following provides a brief overview.

Risk of bias graph: review authors' judgements about each risk of bias item presented as percentages across all included studies.

Risk of bias summary: review authors' judgements about each risk of bias item for each included study.
Allocation
Orlistat versus placebo
All included studies were randomised controlled trials involving randomised individuals. For method of randomisation, we judged three trials (Cocco 2005; Guy‐Grand 2004; XENDOS 2001‐2006) to have a low risk of bias based on the information from journal publications or the IQWIG report (IQWiG 2006). In one study the method of randomisation was not reported and therefore unclear (Bakris 2002). The method of allocation concealment was adequate in two studies (Guy‐Grand 2004; XENDOS 2001‐2006), while it was unclear in the other two studies (Bakris 2002; Cocco 2005).
Phentermine/topiramate versus placebo
The included study adequately described the method of randomisation and concealment (CONQUER 2013).
Naltrexone/bupropion versus placebo
The study adequately described the method of randomisation and concealment (Nissen 2016).
Blinding
Orlistat versus placebo
While all included trials were described as double‐blind, three trials provided too little information, and the blinding of participants and key study personnel was uncertain (Bakris 2002; Cocco 2005; Guy‐Grand 2004). Based on the authors' information, we can only assume that blinding took place throughout the duration of one study (Cocco 2005).
Phentermine/topiramate versus placebo
The included study was described as double‐blind. The investigators, participants, and study sponsors were masked to treatment assignment, and all study drugs were administered as capsules that were identical in size and appearance (CONQUER 2013).
Naltrexone/bupropion versus placebo
The included study was described as double‐blind. The investigators and participants were masked to treatment assignment. A blinded independent clinical events committee adjudicated clinical outcomes, including cardiovascular death, nonfatal myocardial infarction, nonfatal stroke, hospitalisation for unstable angina, and all‐cause mortality (Nissen 2016).
Incomplete outcome data
Orlistat versus placebo
In two studies, the outcome data description was complete for total mortality, adverse events, change in blood pressure and change in body weight: Cocco 2005 had no losses to follow‐up, and Bakris 2002 described all reasons for withdrawals and losses to follow‐up. Cardiovascular morbidity was reported only in the context of adverse events in these two RCTs, so the completeness of the information is unclear. For this endpoint we judged the risk of bias to be high.
In Guy‐Grand 2004, withdrawals were only reported for the whole study population and not for the hypertensive subgroup, and in XENDOS 2001‐2006 the reasons for withdrawals were incompletely reported. We rated the risk of bias for these two studies as unclear for all reported outcomes. Cardiovascular morbidity was reported only in the context of adverse events in the XENDOS 2001‐2006, so the completeness of the information is unclear. For this endpoint we judged the risk of bias to be high.
Phentermine/topiramate versus placebo
The total number of withdrawals was only reported for the whole study population and not for the hypertensive subgroup of the study (CONQUER 2013). For the hypertensive subgroup, only the number of withdrawals due to adverse events was reported, so the reasons for withdrawals were incompletely reported. We therefore judged the risk of bias to be unclear for all reported outcomes, except for cardiovascular morbidity. Cardiovascular morbidity was reported only in the context of treatment‐emergent adverse events, so the completeness of the information is unclear. For this endpoint we judged the risk of bias to be high.
Naltrexone/bupropion versus placebo
All primary analyses were performed for the intention‐to‐treat (ITT) population, defined as participants who underwent randomisation into the treatment period and were dispensed study medication. No imputation was performed for missing data. The number of withdrawals and reasons were only reported for the whole study population, but not for the subset of participants with hypertension (Nissen 2016).
Selective reporting
Orlistat versus placebo
As either no study protocol was provided (Bakris 2002; Cocco 2005; Guy‐Grand 2004), or no full publication was obtainable (XENDOS 2001‐2006), or more outcomes were reported than were prespecified (Bakris 2002), we classified the risk of bias for selective reporting as uncertain for all studies.
Phentermine/topiramate versus placebo
No study protocol was available for CONQUER 2013. We therefore classified the risk of bias for selective reporting as uncertain.
Naltrexone/bupropion versus placebo
A study protocol was provided and all prespecified outcomes were reported. The study was terminated prematurely after the unplanned release of the 25% interim data, which was judged as compromising the scientific integrity of the ongoing study. Outcome measures data based on the 50% interim analysis were designated as the primary analysis. Safety data were based on all available data at the time of database lock, which occurred after the 50% interim analysis (Nissen 2016).
Other potential sources of bias
Orlistat versus placebo
No trial included in the review reported any significant differences between groups in the main characteristics of participants at baseline. However, in Bakris 2002 and XENDOS 2001‐2006, the combination of a high withdrawal rate and the unknown length of involvement of participants in the trial increases the risk of bias, even when last observation carried forward (LOCF) analysis is used. In addition, within Bakris 2002 there were inconsistencies between the text and flowchart for numbers of participants who finished the study.
Phentermine/topiramate versus placebo
We could identify no other potential source of bias in the included study (CONQUER 2013).
Naltrexone/bupropion versus placebo
There were no significance differences between groups in the main characteristics of participants at baseline. There was an increased risk of bias because of very high withdrawal rates (84% and 94%, respectively), without imputation for missing data (Nissen 2016).
Effects of interventions
See: Summary of findings 1 Orlistat versus placebo for weight reduction; Summary of findings 2 Phentermine/topiramate versus placebo for weight reduction; Summary of findings 3 Naltrexone/bupropion versus placebo for weight reduction
1. Orlistat versus placebo
See: summary of findings Table 1.
Primary outcomes
For details on primary outcome data see Table 4 and Table 5.
| Study | Intervention(s) and comparator(s) | Randomised/Safety (N) | Death (n (%)) | All adverse events (n (%)) | Leading to withdrawal (n (%)) | Serious adverse events (n (%)) |
|---|---|---|---|---|---|---|
| Orlistat vs placebo | ||||||
| Orlistat | 278/268a | 0 (0) | 239 (89) | 18 (6.7) | 31 (11.7) | |
| Placebo | 276/274a | 0 (0) | 195 (71) | 20 (7.3) | 24 (8.6) | |
| Orlistat | 45/45 | 0 (0) | nr | nr | 0 (0) | |
| Placebo | 45/45 | 0 (0) | nr | nr | 0 (0) | |
| Orlistat | 304/304 | nr | nr | nr | nr | |
| Placebo | 310/310 | nr | nr | nr | nr | |
| Orlistat (DBP ≥ 90 mm Hg) [OD] | 408/407 | 2 (0.5) | 403 (99) | 37 (9) | 73 (18) | |
| Orlistat (SBP ≥ 140mm Hg) [OS] | 516/513 | 1 (0.2) | 508 (99) | 46 (9) | 92 (18) | |
| Placebo (DBP ≥ 90 mm Hg) [PD] | 441/437 | 0 (0) | 420 (96) | 17 (4) | 52 (12) | |
| Placebo (SBP ≥ 140 mm Hg) [PS] | 509/508 | 0 (0) | 493 (97) | 20 (4) | 60 (12) | |
| Phentermine/topiramate vs placebo | ||||||
| Phen/Top [LD] | 261/261 | 0 (0) | 223 (85.4) | 31 (11.9) | 9 (3.4) | |
| Phen/Top [HD] | 520/520 | 0 (0) | 462 (88.8) | 103 (19.8) | 19 (3.7) | |
| Placebo | 524/524 | 0 (0) | 405 (77.3) | 51 (9.7) | 22 (4.2) | |
| Naltrexone/bupropion vs placebo | ||||||
| Nal/Bup | 4164/4164 | 63 (1.5) / P = 0.916 | 1796 (43.1) / P < 0.001 | 1273 (30.6) / P < 0.001 | 891 (21.4) / P = 0.297 | |
| Placebo | 4119/4119 | 63 (1,5) | 1053 (25.6) | 379 (9.2) | 843 (20.5) | |
aCalculated from percentage rates
DBP: diastolic blood pressure; nr: not reported; [OD]: orlistat and diastolic blood pressure ≥ 90 mm Hg; [OS]: orlistat and systolic blood pressure ≥ 140 mm Hg; Phen/Top [HD]: phentermine/topiramate high dose (15 mg/92 mg); Phen/Top [LD]: phentermine/topiramate low dose (7.5 mg/46 mg); [PD]: placebo and diastolic blood pressure ≥ 90 mm Hg; [PS]: placebo and systolic blood pressure ≥ 140 mm Hg; SBD: systolic blood pressure.
| Study | Intervention(s) and comparator(s) | Randomised/Safety /N) | Gastrointestinal AE (n (%)) | Musculoskeletal AE (n (%)) | Dermatological AE (n (%)) | Vascular AE (n (%)) | Cardiac AE (n (%)) | Nervous system AE (n (%)) | Respiratory AE (n (%)) |
|---|---|---|---|---|---|---|---|---|---|
| Orlistat vs placebo | |||||||||
| Orlistat | 278/nr | 200 (72.5) | nr (22.8) | nr | nr | 5 (nr)a | nr | nr | |
| Placebo | 276/nr | 120 (43.6) | nr (15.5) | nr | nr | 5 (nr)a | nr | nr | |
| Orlistat | 45/45 | 16 (35.6)b | nr | nr | nr | nr | nr | nr | |
| Placebo | 45/45 | 11 (24.4)b | nr | nr | nr | nr | nr | nr | |
| Orlistat | 304/304 | nr | nr | nr | nr | nr | nr | nr | |
| Placebo | 310/310 | nr | nr | nr | nr | nr | nr | nr | |
| Orlistat (DBP ≥ 90 mm Hg) [OD] | 408/407 | 379 (93) | 265 (65) | 81 (20) | 69 (17) | nr | 159 (39) | nr | |
| Orlistat (SBP ≥ 140mm Hg) [OS] | 516/513 | 477 (93) | 333 (65) | 113 (22) | 87 (17) | nr | 205 (40) | nr | |
| Placebo (DBP ≥ 90 mm Hg) [PD] | 441/437 | 306 (70) | 271 (62) | 74 (17) | 83 (19) | nr | 170 (39) | nr | |
| Placebo (SBP ≥ 140 mm Hg) [PS] | 509/508 | 361 (71) | 320 (63) | 86 (17) | 97 (19) | nr | 188 (37) | nr | |
| Phentermine/topiramate vs placebo | |||||||||
| Phen/Top [LD] | 261/261 | Constipation: 41 (15.7) | nr | nr | nr | 6 (2.3) | Dry mouth: 37 (14.2) Paresthesia: 37 (14.2) Dysgeusia: 20 (7.7) Insomnia: 15 (5.7) Headache: 13 (5.0) Dizziness: 17 (6.5) | Upper respiratory tract infection: 33 (12.6) Nasopharyngitis: 27 (10.3) Sinusitis: 14 (5.4) | |
| Phen/Top [HD] | 520/520 | Constipation: 94 (18.1) | nr | nr | nr | 19 (3.7) | Dry mouth: 118 (22.7) Paresthesia: 116 (22.3) Dysgeusia: 57 (11.0) Insomnia: 57 (11.0) Headache: 56 (10.8) Dizziness: 63 (12.1) | Upper respiratory tract infection: 63 (12.1) Nasopharyngitis: 53 (10.2) Sinusitis: 43 (8.3) | |
| Placebo | 524/524 | Constipation: 29 (5.5) | nr | nr | nr | 9 (1.7) | Dry mouth: 12 (2.3) Paresthesia: 12 (2.3) Dysgeusia: 4 (0.8) Insomnia: 25 (4.8) Headache: 44 (8.4) Dizziness: 16 (3.1) | Upper respiratory tract infection: 62 (11.8) Nasopharyngitis: 46 (8.8) Sinusitis: 34 (6.5) | |
| Naltrexone/bupropion vs placebo | |||||||||
| Nal/Bup | 4164/4164 | 718 (17.2) / P < 0.001 | 181 (4.3) / P = 0.749 | 45 (1.1) / P = 0.002 | 158 (3.8)c / P = 0.978 | 313 (7.5) / P < 0.001 | 74 (1.8) / P = 0.947 | ||
| Placebo | 4119/4119 | 142 (3.4) | 185 (4.5) | 20 (0.5) | 155 (3.8)c | 111 (2.7) | 74 (1.8) | ||
aOnly serious cardiac events.
bNo data on adverse events were reported for the whole study duration. The data above refer to 4 and 3 weeks of treatment in the orlistat and placebo group, respectively. After 3 months, the number of participants with events decreased to 5 (11%) [O] with flatulence and mild abdominal cramps versus 6 (13%) [P] with nausea and hunger feeling.
c Major adverse cardiovascular events (cardiovascular death, non‐fatal stroke, non‐fatal myocardial infarction) + hospitalisation for unstable angina.
AE: adverse events; DBP: diastolic blood pressure; nr: not reported; [OD]: orlistat and diastolic blood pressure ≥ 90 mm Hg; [OS]: orlistat and systolic blood pressure ≥ 140 mm Hg; Phen/Top [HD]: phentermine/topiramate high dose (15 mg/92 mg); Phen/Top [LD]: phentermine/topiramate low dose (7.5 mg/46 mg); [PD]: placebo and diastolic blood pressure ≥ 90 mm Hg; [PS]: placebo and systolic blood pressure ≥ 140 mm Hg; SBD: systolic blood pressure.
Total mortality
Three of four studies reported on mortality. No deaths were reported in either Bakris 2002 or Cocco 2005. In XENDOS 2001‐2006, there were two deaths in the orlistat‐treated group in the first subgroup analysis (diastolic BP ≥ 90 mm Hg) and one death in the orlistat group in the second subgroup analysis (systolic BP ≥ 140 mm Hg); no deaths occurred in the placebo group.
Cardiovascular morbidity
Three studies presented data on cardiovascular morbidity. In Bakris 2002, two participants in the orlistat group suffered a myocardial infarction, two had chest pain, and one had an episode of atrial fibrillation. In the placebo group, one participant had a myocardial infarction, one had worsening atherosclerotic coronary artery disease, and two had an episode of chest pain. Cocco 2005 reported that in participants with resting left ventricular ejection fraction (LVEF) below 50% at baseline, LVEF did not change with placebo (0.6%), but was increased by 4.3% in the orlistat group (P < 0.001). In XENDOS 2001‐2006, vascular complications were reported in the context of adverse events. In both subgroups (diastolic BP ≥ 90 mm Hg and systolic BP ≥ 140 mm Hg), 17% of the participants treated with orlistat and 19% treated with placebo reported a vascular adverse event.
Adverse events
Data on serious adverse events (SAEs) were available from three trials (Bakris 2002; Cocco 2005; XENDOS 2001‐2006), with significantly more SAEs in participants treated with orlistat compared to those who received placebo: RR 1.45 (95% CI 1.10 to 1.91; 3 trials, 1476 participants; Analysis 1.1). Overall adverse events were reported in two RCTs (Bakris 2002; XENDOS 2001‐2006), with no significant difference between the orlistat and the placebo group: RR 1.13 (95% CI 0.84 to 1.54; 2 trials, 1386 participants; Analysis 1.2).
Bakris 2002: At least one adverse event was reported by significantly more participants in the orlistat‐treated group (89%) than in the placebo‐treated group (71%), with a P value < 0.001. Of those, 7% of participants in the orlistat group versus 7% of participants in the placebo group withdrew. Twelve per cent of all adverse events in the orlistat‐treated group versus 9% in the placebo‐treated group were classified as serious adverse events, and none was classified as being related to study medication. Gastrointestinal side effects were significantly higher in the orlistat‐treated group than in the placebo group (73% versus 44%; P < 0.001); 8% of those participants in the orlistat group and 5% in the placebo group stopped taking the medication for this reason. Musculoskeletal side effects were also reported significantly more often in the orlistat versus the placebo group (23% versus 16%; P < 0.05).
Cocco 2005: As reported by the authors, side effects were mild. No overall adverse events were reported. Gastrointestinal side effects were the most common adverse events and were described for 24% of the placebo group within the first three weeks and for 36% of the orlistat group within the first four weeks.
Guy‐Grand 2004: Data were only presented for the whole study group, with no information provided on the hypertensive subgroup.
XENDOS 2001‐2006:
First subgroup (diastolic BP ≥ 90 mm Hg): Side effects were reported in 99% of participants in the orlistat and 96% of participants in the placebo group. Eighteen per cent of participants in the orlistat group and 12% of participants in the placebo group experienced severe adverse events. Gastrointestinal side effects were more common in the orlistat (93%) versus the placebo group (70%). Musculoskeletal, nervous, dermatological, and vascular events were comparable in both treatment groups. Nine per cent withdrew due to side effects in the orlistat versus 4% in the placebo group, but it is not clear whether the reported side effects were study drug‐related.
Second subgroup (systolic BP ≥ 140 mm Hg): Side effects were reported in 99% of participants in the orlistat and 97% of participants in the placebo group. Eighteen per cent of participants in the orlistat group and 12% of participants in the placebo group experienced severe adverse events. Gastrointestinal side effects were more common in the orlistat (93%) versus the placebo group (71%). Musculoskeletal, nervous, dermatological, and vascular events were comparable in both treatment groups. Nine per cent withdrew due to side effects in the orlistat versus 4% in the placebo group. It is not clear whether the reported side effects were study drug‐related.
Secondary outcomes
For details on secondary outcome data see Table 6 (body weight), Table 7 (systolic blood pressure), and Table 8 (diastolic blood pressure). For XENDOS 2001‐2006, we used the results after 12 months study duration for the subgroup of participants with diastolic BP ≥ 90 mm Hg at baseline for the meta‐analyses. Due to between‐study variability, we have presented results from random‐effects models in the analysis of body weight.
| Study | Intervention(s) and comparator(s) | Baselinea | 6 moa | 12 moa | 48 moa | Change from baseline to endpointa |
|---|---|---|---|---|---|---|
| Orlistat vs placebo | ||||||
| Orlistat | 101.2 (1.0)c | nr | nr | na | −5.4 (6.4) / P < 0.001 (after 12 months) | |
| Placebo | 101.5 (1.0)c | nr | nr | na | −2.7 (6.4) (after 12 months) | |
| Orlistat | 106.9 (5.7) | 101.6(4.5) | na | na | −5.4c /P < 0.001 (after 6 months) | |
| Placebo | 105.9 (5.9) | 103.5 (5.3) | na | na | −2.5c (after 6 months) | |
| Orlistat | 93.9 (0.8)d | nr | na | na | −5.8 (0.3) / P < 0.0001 (after 6 months) | |
| Placebo | 93.5 (0.8)d | nr | na | na | −1.8 (0.2) (after 6 months) | |
| Orlistat (DBP ≥ 90 mm Hg) [OD]e | 117 (18) | 106 (17) | 105 (18) | 110 (19) | −11.9 (8.2) / P = nr (after 12 months)f −6.6 (8.6) / P < 0.001 (after 48 months) | |
| Orlistat (SBP ≥ 140mm Hg ) [OS]e | 117 (17) | 106 (17) | 105 (17) | 110 (18) | −6.8 (8.7) / P < 0.001 (after 48 months) | |
| Placebo (DBP ≥ 90 mm Hg) [PD]e | 115 (18 | 108 (18) | 108 (19) | 111 (20) | −6.9 (7.6) (after 12 months)f −3.8 (7.8) (after 48 months) | |
| Placebo (SBP ≥ 140 mm Hg) [PS]e | 116 (18) | 109 (18) | 110 (19) | 113 (19) | −3.2 (7.4) (after 48 months) | |
| Phentermine/topiramate vs placebo | ||||||
| CONQUER 2013 | Phen/Top [LD] | 104 (18)g | nr | nr | na | −8.2% (95% CI 7.3; 9.0) / P < 0.0001 (after 13 months) |
| Phen/Top [HD] | nr | nr | na | −10.1% (95% CI 9.5; 10.7) / P < 0.0001 (after 13 months) | ||
| Placebo | nr | nr | na | −1.9% (95% CI 1.3; 2.6) (after 13 months) | ||
| Naltrexone/bupropion vs placebo | ||||||
| Nissen 2016 | Nal/Bup | 106 (19.09) | nr | nr | nr | −1.9 (4.26) / P < 0.001 (after 28 months) |
| Placebo | 106.6 (19.17) | nr | nr | nr | −0.0 (3.50) (after 13 months) | |
aMean kg (SD), unless otherwise indicated.
bData are reported for 267 of 278 [O] and 265 of 276 [P] participants only.
cPublished values are different, but data were corrected after personal communication with the author.
dReported as being the standard deviation but probably the standard error due to its small number.
eBased on data of 407 [OD], 437 [PD], 513 [OS], and 508 [PS] participants.
f12 months results used for meta‐analysis.
gReported only combined for all three study groups.
CI: confidence interval; DBP: diastolic blood pressure; mo: months; na: not applicable; nr: not reported; [OD]: orlistat and diastolic blood pressure ≥ 90 mm Hg; [OS]: orlistat and systolic blood pressure ≥ 140 mm Hg; Phen/Top [HD]: phentermine/topiramate high dose (15 mg/92 mg); Phen/Top [LD]: phentermine/topiramate low dose (7.5 mg/46 mg); [PD]: placebo and diastolic blood pressure ≥ 90 mm Hg; [PS]: placebo and systolic blood pressure ≥ 140 mm Hg; SBD: systolic blood pressure; SD: standard deviation.
| Study | Intervention(s) and comparator(s) | Baselinea | 6 moa | 12 moa | 48 moa | Change from baseline to endpointa |
|---|---|---|---|---|---|---|
| Orlistat vs placebo | ||||||
| Orlistat | 154 (13) | nr | nr | na | −13.3 (15.2) / ns (after 12 months) | |
| Placebo | 151 (13) | nr | nr | na | −11.0 (15.0) (after 12 months) | |
| Orlistat | 145.8 (9.8) | 141.5 (12.5) | na | na | −4.3 / P = 0.025 (after 6 months) | |
| Placebo | 142.1 (6.2) | 141.2 (8.8) | na | na | −0.9 (after 6 months) | |
| Orlistat | 150.0 (0.8)c | nr | na | na | −9.8 (1) / ns (after 6 months) | |
| Placebo | 152.2 (0.9)c | nr | na | na | −9.8 (1) (after 6 months) | |
| Orlistat (DBP ≥ 90 mm Hg) [OD]d | 146 (13) | 135 (14) | 135 (14) | 137 (15) | −11.2 (13.5) / P = nr (after 12 months)e −8.8 (14.8) / P = 0.024 (after 48 months) | |
| Orlistat (SBP ≥ 140mm Hg) [OS]d | 149 (10) | 125 (14) | 135 (14) | 138 (15) | −11.5 (14.9) / P < 0.002 (after 48 months) | |
| Placebo (DBP ≥ 90 mm Hg) [PD]d | 146 (12) | 136 (15) | 138 (16) | 139 (16) | −7.7 (13.8) (after 12 months)e −6.4 (15.1) (after 48 months) | |
| Placebo (SBP ≥ 140 mm Hg) [PS]d | 149 (8) | 138 (14) | 140 (14) | 140 (15) | −8.6 (14.3) (after 48 months) | |
| Phentermine/topiramate vs placebo | ||||||
| Phen/Top [LD] | 134.3 (nr) | nr | nr | na | −6.9 (95% CI 5.3; 8.5) / P = 0.0475 (after 13 months) | |
| Phen/Top [HD] | 133.1 (nr) | nr | nr | na | −9.1 (95% CI 7.9; 10.3) / P < 0.001 (after 13 months) | |
| Placebo | 135.2 (nr) | nr | nr | na | −4.9 (95% CI 3.7; 6.1) (after 13 months) | |
| Naltrexone/bupropion vs placebo | ||||||
| Nal/Bup | 126.1 (12.55) | nr | nr | nr | −2.2 (14.45) / P = 0.706 (after 28 months) | |
| Placebo | 125.7 (12.62) | nr | nr | nr | −2.2 (13.51) (after 28 months) | |
aMean mm Hg (SD), unless otherwise indicated.
bData are reported for 267 of 278 [O] and 265 of 276 [P] participants only.
cReported as being the standard deviation but probably the standard error due to its small number.
dBased on last observation carried forward data on 399 [OD], 423 [PD], 493 [OS], and 504 [PS] participants.
e12 months results used for meta‐analysis.
DBP: diastolic blood pressure; mo: months; na: not applicable; nr: not reported; [OD]: orlistat and diastolic blood pressure ≥ 90 mm Hg; [OS]: orlistat and systolic blood pressure ≥ 140 mm Hg; Phen/Top [HD]: phentermine/topiramate high dose (15 mg/92 mg); Phen/Top [LD]: phentermine/topiramate low dose (7.5 mg/46 mg); [PD]: placebo and diastolic blood pressure ≥ 90 mm Hg; [PS]: placebo and systolic blood pressure ≥ 140 mm Hg; SBD: systolic blood pressure; SD: standard deviation.
| Study | Intervention(s) and comparator(s) | Baselinea | 6 moa | 12 moa | 48 moa | Change from baseline to endpointa |
|---|---|---|---|---|---|---|
| Orlistat vs placebo | ||||||
| Orlistat | 98.4 (3.7) | nr | nr | na | −11.4 (8.3) / P = 0.002 (after 12 months) | |
| Placebo | 98.3 (3.5)c | nr | nr | na | −9.2 (8.4) (after 12 months) | |
| Orlistat | 87.8 (7.3) | 84.2 (8.6) | na | na | −3.6 / P = 0.012 (after 6 months) | |
| Placebo | 85.3 (5.6) | 84.5 (7.3) | na | na | −0.8 (after 6 months) | |
| Orlistat | 96.9 (0.3)d | nr | na | na | −7.5 (0.6) / ns (after 6 months) | |
| Placebo | 97.0 (0.3)d | nr | na | na | −7.3 (0.6) (after 6 months) | |
| Orlistat (DBP ≥ 90 mm Hg) [OD]e | 95 (6) | 86 (8) | 86 (8) | 87 (9) | −9.1 (7.9) / P = nr (after 12 months)f −8.1 (9.3) / P < 0.006 (after 48 months) | |
| Orlistat (SBP ≥ 140mm Hg) [OS]e | 91 (9) | 84 (9) | 85 (9) | 86 (9) | −5.0 (9.9) / P < 0.001 (after 48 months) | |
| Placebo (DBP ≥ 90 mm Hg) [PD]e | 95 (5) | 88 (9) | 88 (10) | 89 (10) | −6.7 (9.6) (after 12 months)f −6.2 (9.9) (after 48 months) | |
| Placebo (SBP ≥ 140 mm Hg) [PS]e | 91 (8) | 87 (9) | 88 (10) | 88 (10) | −3.0 (10.4) (after 48 months) | |
| Phentermine/topiramate vs placebo | ||||||
| Phen/Top [LD] | 83.4 (nr) | nr | nr | na | −5.2 (95% CI 4.1; 6.3) / P = 0.04 (after 13 months) | |
| Phen/Top [HD] | 83.2 (nr) | nr | nr | na | −5.8 (95% CI 5.1; 6.5) / P = 0.0003 (after 13 months) | |
| Placebo | 84.5 (nr) | nr | nr | na | −3.9 (95% CI 3.2; 4.6) (after 13 months) | |
| Naltrexone/bupropion vs placebo | ||||||
| Nal/Bup | 74.5 (9.01) | nr | nr | na | 1.4 (9.05) / P = 0.326 (after 28 months) | |
| Placebo | 74.4 (9.14) | nr | nr | na | 1.1 (8.50) (after 28 months) | |
aMean mm Hg (SD), unless otherwise indicated.
bData are reported for 267 of 278 [O] and 265 of 276 [P] participants only.
cThe standard deviation was published as being 35 but should probably be 3.5.
dReported as being the standard deviation but probably the standard error due to its small number.
eBased on last observation carried forward data on 399 [OD], 423 [PD], 493 [OS], and 504 [PS] participants.
f12 months results used for meta‐analysis.
DBP: diastolic blood pressure; mo: months; na: not applicable; nr: not reported; [OD]: orlistat and diastolic blood pressure ≥ 90 mm Hg; [OS]: orlistat and systolic blood pressure ≥ 140 mm Hg; Phen/Top [HD]: phentermine/topiramate high dose (15 mg/92 mg); Phen/Top [LD]: phentermine/topiramate low dose (7.5 mg/46 mg); [PD]: placebo and diastolic blood pressure ≥ 90 mm Hg; [PS]: placebo and systolic blood pressure ≥ 140 mm Hg; SBD: systolic blood pressure; SD: standard deviation.
Body weight
Orlistat was found to lower body weight significantly more effectively than placebo in all studies. The meta‐analysis of orlistat studies yielded a MD of −3.7 kg (95% CI −4.7 to −2.8; 4 trials, 2080 participants; Analysis 1.3) after a study duration of six to 12 months. The test for heterogeneity gave a P value of 0.02 (I2 = 68%) (see Figure 4). Differences in study quality could not explain the heterogeneity. We could deduce no plausible explanation for heterogeneity from differences in study design, study duration, sample sizes, interventions, or characteristics of included participants. In XENDOS 2001‐2006, results after 48 months of follow‐up were reported for the subgroups of participants with diastolic BP ≥ 90 mm Hg at baseline and systolic BP ≥ 140 mm Hg, with a mean reduction in body weight with orlistat compared to placebo of −2.8 kg (95% CI −3.9 to −1.7) and −3.6 kg (95% CI −4.6 to −2.6), respectively.
![Forest plot of comparison: 1 Orlistat versus placebo, outcome: 1.3 Change in body weight from baseline to endpoint (6 to 12 months follow‐up) [kg].](/cdsr/doi/10.1002/14651858.CD007654.pub5/media/CDSR/CD007654/image_n/nCD007654-FIG-04.svg)
Forest plot of comparison: 1 Orlistat versus placebo, outcome: 1.3 Change in body weight from baseline to endpoint (6 to 12 months follow‐up) [kg].
Changes in systolic blood pressure
We could include all four studies in the meta‐analysis investigating the effects of orlistat on systolic BP. After six to 12 months, there was a significant reduction in systolic BP with a mean difference (MD) of −2.6 mm Hg (95% CI −3.8 to −1.4; 4 trials, 2058 participants; Analysis 1.4) in favour of orlistat. The test for heterogeneity gave a P value of 0.19 (I2 = 36%) (see Figure 5). Differences in study quality could not explain the heterogeneity. We could deduce no plausible explanation for heterogeneity from differences in study design, study duration, sample sizes, interventions, or characteristics of included participants. In XENDOS 2001‐2006, results after 48 months of follow‐up were reported for the subgroups of participants with diastolic BP ≥ 90 mm Hg at baseline and systolic BP ≥ 140 mm Hg, with a mean reduction in systolic BP with orlistat compared to placebo of −2.4 mm Hg (95% CI −4.4 to −0.4) and −2.9 mm Hg (95% CI −4.7 to −1.1), respectively.
![Forest plot of comparison: 1 Orlistat versus placebo, outcome: 1.4 Change in systolic blood pressure from baseline to endpoint (6 to 12 months follow‐up) [mm Hg].](/cdsr/doi/10.1002/14651858.CD007654.pub5/media/CDSR/CD007654/image_n/nCD007654-FIG-05.svg)
Forest plot of comparison: 1 Orlistat versus placebo, outcome: 1.4 Change in systolic blood pressure from baseline to endpoint (6 to 12 months follow‐up) [mm Hg].
Changes in diastolic blood pressure
We could include all four studies in the meta‐analysis investigating the effects of orlistat on diastolic BP. After six to 12 months, diastolic BP was also significantly reduced in participants treated with orlistat, with a MD of −2.0 mm Hg (95% CI −2.7 to −1.2; 4 trials, 2058 participants; Analysis 1.5). The test for heterogeneity gave a P value of 0.13 (I2 = 47%) (see Figure 6). Differences in study quality could not explain the heterogeneity. We could deduce no plausible explanation for heterogeneity from differences in study design, study duration, sample sizes, interventions, or characteristics of included participants. In XENDOS 2001‐2006, results after 48 months of follow‐up were reported for the subgroups of participants with diastolic BP ≥ 90 mm Hg at baseline and systolic BP ≥ 140 mm Hg, with a mean reduction in diastolic BP with orlistat compared to placebo of −1.9 mm Hg (95% CI −3.2 to −0.6) and −2.0 mm Hg (95% CI −3.3 to −0.7), respectively.
![Forest plot of comparison: 1 Orlistat versus placebo, outcome: 1.5 Change in diastolic blood pressure from baseline to endpoint (6 to 12 months follow‐up) [mm Hg].](/cdsr/doi/10.1002/14651858.CD007654.pub5/media/CDSR/CD007654/image_n/nCD007654-FIG-06.svg)
Forest plot of comparison: 1 Orlistat versus placebo, outcome: 1.5 Change in diastolic blood pressure from baseline to endpoint (6 to 12 months follow‐up) [mm Hg].
Subgroup analyses
Not performed due to lack of data.
Sensitivity analyses
Not performed due to lack of data.
Publication and small‐study bias
We did not draw funnel plots due to the limited number of trials (n = 4).
2. Phentermine/topiramate versus placebo
See summary of findings Table 2.
Primary outcomes
Total mortality
Only one participant in the placebo group in the dyslipidaemia subgroup died during the study. There were no deaths in the hypertensive subgroup (CONQUER 2013).
Cardiovascular morbidity
In CONQUER 2013, 2.3% of the hypertensive participants in the 7.5 mg phentermine/46 mg topiramate group, 3.7% in the 15 mg phentermine/92 mg topiramate group, and 1.7% of the placebo group experienced treatment‐emergent cardiovascular adverse events. Palpitations occurred in 0.8%, 1.2%, and 0.6% of the hypertensive participants, respectively. Serious adverse cardiac events occurred in six hypertensive participants and serious adverse vascular events in two hypertensive participants, but it was not reported to which treatment group these participants belonged.
Adverse events
In the hypertensive subgroup of CONQUER 2013, treatment‐emergent adverse events were reported in 85.4% of participants in the 7.5 mg/46 mg phentermine/topiramate group, 88.8% of participants in the 15 mg/92 mg phentermine/topiramate group and 77.3% of participants in the placebo group (1305 participants; Analysis 2.1). Serious adverse events occurred in 3.4% (7.5 mg/46 mg group) and 3.7% (15 mg/92 mg group) of the hypertensive participants treated with phentermine/topiramate, and in 4.2% of participants in the placebo group (1305 participants; Analysis 2.2). The most common treatment‐emergent adverse events in the phentermine/topiramate groups were dry mouth (14.2% (7.5 mg/46 mg group) and 22.7% (15 mg/92 mg group)) and paraesthesia (14.2% (7.5 mg/46 mg group) and 22.3%(15 mg/92 mg group)) when compared to placebo (2.3% for each outcome).
Secondary outcomes
For details on secondary outcome data see Table 6 (body weight), Table 7 (systolic blood pressure), and Table 8 (diastolic blood pressure).
Body weight
Compared to placebo, phentermine/topiramate produced a significantly greater percentage weight loss in participants with hypertension at baseline (−8.1%, −10.1%, and −1.9% for 7.5 mg/46 mg, 15 mg/92 mg, and placebo respectively, P < 0.001; 256, 514 and 516 participants respectively; Analysis 2.3; Analysis 2.4). In addition, significantly more participants in the hypertensive subgroup achieved weight loss of ≥ 5%, ≥ 10%, and ≥ 15% with phentermine/topiramate compared with placebo (CONQUER 2013).
Changes in systolic blood pressure
In hypertensive participants, greater reductions in systolic BP were noted in the phentermine/topiramate groups than in the placebo group (−6.9 mm Hg (7.5 mg/46 mg group) and −9.1 mm Hg (15 mg/92 mg group) versus −4.9 mm Hg; P = 0.047 and P < 0.0001 for comparisons; 256, 514 and 516 participants respectively; Analysis 2.5; Analysis 2.6). Compared with placebo, a greater percentage of phentermine/topiramate‐treated participants with uncontrolled hypertension at baseline (≥ 140/90 mm Hg; placebo n = 104; 7.5 mg/46 mg n = 40; 15 mg /92 mg n = 72) achieved the BP goal of 140/90 mm Hg by week 56: 52.9% in the placebo group, 62.5% in the 7.5 mg/46 mg group, and 75.0% in the 15 mg/92 mg group (P = 0.2996 for 7.5/46 versus placebo; P = 0.0034 for 15/92 versus placebo) (CONQUER 2013).
Changes in diastolic blood pressure
Both doses of phentermine/topiramate were associated with a significantly greater reduction in diastolic BP compared to placebo in hypertensive participants (−5.2 mm Hg (7.5 mg/46 mg group) and −5.8 mm Hg (15 mg/92 mg group) versus −3.9 mm Hg; P = 0.04 and < 0.001 for comparisons; 256, 514 and 516 participants respectively; Analysis 2.7; Analysis 2.8) (CONQUER 2013).
Heterogeneity
Only one study; no meta‐analysis performed.
Subgroup analyses
Only one study; no meta‐analysis performed.
Sensitivity analyses
Only one study; no meta‐analysis performed.
Publication and small‐study bias
Only one study; not applicable.
3. Naltrexone/bupropion versus placebo
See summary of findings Table 3.
Primary outcomes
Total mortality
During the study period, there were 63 deaths in the naltrexone/bupropion group (1.51%) and 63 deaths in the placebo group (1.53%) reported for the subgroup of participants with hypertension (8283 participants; Analysis 3.1; Nissen 2016). The number of cardiovascular death were 26 (0.62%) in the naltrexone/bupropion group and 37 (0.90%) in the placebo group.
Cardiovascular morbidity
There were 64 participants with hypertension who had a non‐fatal myocardial infarction (1.54%), 28 had a non‐fatal stroke (0.67%) and 49 participants were hospitalised for unstable angina (1.18%) in the naltrexone/bupropion group. In the placebo group the respective numbers were 61 non‐fatal myocardial infarctions (1.48%), 20 non‐fatal strokes (0.49%), and 45 hospitalisations for unstable angina (1.09%) (8283 participants; Analysis 3.2).
Adverse events
In the hypertensive subgroup, adverse events were reported in 43.1% of participants in the naltrexone/bupropion group and in 25.6% of participants in the placebo group (P < 0.001; 8283 participants; Analysis 3.3). Serious adverse events occurred in 21.4% of the hypertensive participants treated with naltrexone/bupropion and in 20.5% of participants in the placebo group (P = 0.3; 8283 participants; Analysis 3.4). Gastrointestinal adverse events were significantly higher in the naltrexone/bupropion group than in the placebo group (17.2% versus 3.4%; P < 0.001). Nervous system adverse events (7.5% versus 2.7%, P < 0.001) and dermatological adverse events (1.1% versus 0.5%, P = 0.002) were also reported significantly more often in the naltrexone/bupropion versus the placebo group. In addition, adverse events leading to withdrawal of study medication occurred significantly more often in the naltrexone/bupropion group than in the placebo group (30.6% versus 9.2%; P < 0.001).
Secondary outcomes
For details on secondary outcome data see Table 6 (body weight), Table 7 (systolic blood pressure), and Table 8 (diastolic blood pressure).
Body weight
Compared to placebo, naltrexone/bupropion led to a significantly greater reduction in body weight in participants with hypertension (−1.9 kg versus −0.0 kg, P < 0.001; 8283 participants; Analysis 3.5).
Changes in systolic blood pressure
In hypertensive participants, there was an increase in systolic BP in both study groups during the study period, with no difference between the naltrexone/bupropion group and the placebo group (+2.2 mm Hg versus +2.2 mm Hg; P = 0.1; 8283 participants; Analysis 3.6).
Changes in diastolic blood pressure
In hypertensive participants, there was an increase in diastolic BP in both study groups during the study period, with no difference between the naltrexone/bupropion group and the placebo group (+1.4 mm Hg versus +1.1 mm Hg, P = 0.12; 8283 participants; Analysis 3.7).
Heterogeneity
Only one study; no meta‐analysis performed.
Subgroup analyses
Only one study; no meta‐analysis performed.
Sensitivity analyses
Only one study; no meta‐analysis performed.
Publication and small‐study bias
Only one study; not applicable.
Discussion
Summary of main results
This updated systematic review attempted to determine the long‐term effects of weight loss through approved pharmacological intervention on patient‐relevant endpoints, namely death and cardiovascular complications, in the antihypertensive therapy of people with essential hypertension. We found no randomised controlled trials designed to answer this question. Our search revealed only studies focusing mainly on the evaluation of effects on body weight, blood pressure (BP), and adverse events. Four relevant trials investigating orlistat and one investigating the combination of phentermine/topiramate were already included in the previous version of our review. For this update we could include one additional RCT investigating the combination of naltrexone/bupropion versus placebo (Nissen 2016) and we identified three additional publications belonging to the included phentermine/topiramate study (CONQUER 2013), with none of them reporting any relevant new results for the subgroup of people with hypertension. We still could not include any study examining liraglutide or lorcaserin in this review, as all potentially relevant trials failed to present analyses of hypertensive participants. In addition, for this review update we exclude studies investigation sibutramine or rimonabant, since these two products lost their market approval nearly 10 years ago and are therefore no longer relevant for long‐term weight loss.
We found that of the four studies on the effects of orlistat that we include in our analyses, only one was considered to have major deficiencies in study quality. The meta‐analyses showed that participants on therapy with orlistat could reduce their weight and blood pressure levels to a statistically significantly greater degree than participants in the placebo group. While these results show that orlistat may be a helpful option in the antihypertensive therapy of obese hypertensive people, some questions still remain. First of all, participants undergoing orlistat therapy experienced substantial side effects, mainly gastrointestinal. This may limit the effectiveness of the medication in settings outside of scientific studies. Furthermore it remains unclear whether blood pressure levels will remain low over a longer period of time or once the medication is discontinued, since some investigations have found that body weight increased after one year, whether or not orlistat was continued (Davidson 1999; Sjöström 1998).
For the combination therapy of phentermine/topiramate we could include only one trial involving a hypertensive subgroup in our analysis (CONQUER 2013). An additional 56‐week trial compared two different doses of phentermine/topiramate to placebo in obese participants with blood pressure below 140/90 mm Hg (EQUIP 2012). In these trials, the mean weight loss with phentermine/topiramate was about 6 to 8 kg, which is higher than in the case of orlistat, while the antihypertensive effect of phentermine/topiramate is comparable with orlistat. After completion of the CONQUER trial, participants could take part in a further 52‐week extension trial (SEQUEL 2014). Since this extension trial did not report any results for the hypertensive subgroup, and enrolment in the study occurred at participants' request, we did not include the results in our analysis. Although there was significant sustained weight loss in the phentermine/topiramate groups compared to placebo, the reduction in blood pressure did not differ significantly between the groups after two years (SEQUEL 2014). Contrary to the USA, where the Food and Drug Administration (FDA) approved phentermine/topiramate for the long‐term pharmacological treatment of obesity in 2012 (FDA 2012a), the European Medicines Agency (EMA) refused approval in Europe on 21 February 2013, because of major concerns about the long‐term effects of the drug on the heart and blood vessels, and particularly because phentermine is known to increase heart rate. There were also concerns about long‐term psychiatric and cognitive effects related to the topiramate component (EMA 2013d).
Only one trial could be included for the combination of naltrexone/bupropion in our analysis, since the author provided results for the subgroup of participants with hypertension (Nissen 2016). The results in this study showed a modest weight reduction with naltrexone/bupropion compared to placebo, but blood pressure was slightly raised in both study groups. While there were no differences in the numbers of deaths or cardiovascular events between the naltrexone/bupropion and placebo groups, participants in the naltrexone/bupropion group experienced significantly more gastrointestinal, nervous system or dermatological adverse events. As well as this RCT, naltrexone/bupropion was also assessed in four 56‐week trials of the Contrave Obesity Research (COR) study programme, including 4536 overweight or obese people with or without hypertension, dyslipidaemia, or diabetes mellitus type 2. Results for the subgroup of participants with hypertension were not available. In two of the trials, the percentage of participants with hypertension at baseline was about 20% (COR‐I 2010; COR‐II 2013); in the other two trials it was not reported (COR‐BMOD 2011; COR‐Diabetes 2013). A statistically significant weight reduction of about 4 to 5 kg was reported for naltrexone/bupropion compared to placebo in addition to diet and exercise counselling (COR‐Diabetes 2013; COR‐I 2010; COR‐II 2013), or to an intensive behaviour modification programme (COR‐BMOD 2011). Blood pressure remained unchanged or was slightly reduced in the naltrexone/bupropion groups, but there was a larger reduction in the placebo groups. The group differences were significant for systolic BP in the COR‐I 2010, COR‐II 2013, and COR‐BMOD 2011 trials and for diastolic BP in the COR‐I 2010 and COR‐BMOD 2011 trials. None of these studies investigated the effects on patient‐related outcomes. The dropout rates in the four trials ranged from 42% to 50%. Nausea, dizziness, constipation, and tinnitus were the most common adverse events in the naltrexone/bupropion groups.
As for the two remaining drugs (lorcaserin and liraglutide) that are currently approved for long‐term weight reduction, most studies enrolled only overweight or obese people without hypertension or a mixed population of normo‐ and hypertensive people, without providing separate results for the hypertensive subgroup. We therefore excluded the results of these trials from our analysis and only briefly discuss them here.
Lorcaserin
Three large phase III trials assessed the efficacy and safety of lorcaserin in obese people with or without weight‐related comorbidities (BLOOM 2010; BLOOM‐DM 2012; BLOSSOM 2011). The Behavioral Modification and Lorcaserin Second Study for Obesity Management (BLOSSOM) trial enrolled 4008 participants who were randomly assigned to two different daily doses of lorcaserin or placebo (BLOSSOM 2011). About 24% of the participants were hypertensive. In the Behavioral Modification and Lorcaserin for Overweight and Obesity Management (BLOOM) study, 3182 overweight or obese normotensive participants received either 10 mg lorcaserin twice daily or placebo (BLOOM 2010), while the Behavioral Modification and Lorcaserin for Obesity and Overweight Management in Diabetes Mellitus (BLOOM‐DM) trial investigated the effect of two different daily doses of lorcaserin versus placebo in 604 overweight or obese people with diabetes mellitus type 2 (BLOOM‐DM 2012). In all three trials, the study medication was combined with a reduced‐calorie diet and increased physical activity. None of the studies were designed to assess the effects on patient‐relevant endpoints. In all the studies, the lorcaserin groups showed a significant mean weight loss of about 3 to 4 kg compared with the placebo groups after 52 weeks. In contrast, blood pressure did not change to a statistically significant degree in the BLOSSOM and the BLOOM‐DM trials. In the BLOOM trial, which included only normotensive participants, there was a significant reduction in systolic BP and diastolic BP in the lorcaserin groups compared to placebo (systolic BP: −0.6 mm Hg; diastolic BP: −0.5 mm Hg). The most common adverse events in the lorcaserin groups were headache, nasopharyngitis, and nausea. In addition, large discontinuation rates of up to 50% were reported in the trials (Taylor 2013). Although there was no difference in the incidence of valvulopathy between lorcaserin and placebo, the FDA has requested that a post‐approval trial be conducted to assess the long‐term cardiovascular effects of lorcaserin (Yanovski 2014). In January 2013, a Committee for Medicinal Products for Human Use review of the EMA described some concerns about the potential risk of psychiatric disorders and valvulopathy, and the potential risk of tumours, particularly when used over the long term, based on the results of laboratory tests (EMA 2013b). As a result of this negative overall benefit/risk balance for lorcaserin, the manufacturers withdrew their application for marketing approval in Europe (EMA 2013a). In 2018 results have been published on the cardiovascular safety of lorcaserin from another trial including 12,000 overweight or obese participants with cardiovascular risk factors (CAMELLIA‐TIMI 2018). About 90% of the participants were hypertensive. After one year, the lorcaserin group showed a significant mean weight loss of 1.9 kg and slight reductions in systolic and diastolic blood pressure compared with the placebo group. There were no differences in major cardiovascular events, cardiovascular death, or death from any cause between the two study groups. An FDA review of the study data found a numeric imbalance in the number of participants with malignancies, with one additional cancer observed per 470 persons treated with lorcaserin for one year. The FDA therefore concluded that the potential risks of lorcaserin outweigh its benefits and recommended its withdrawal from the market (FDA 2020). In February 2020, the manufacturers announced their voluntary withdrawal of lorcaserin from the US market (Eisai Inc. 2020).
Liraglutide
Liraglutide was first approved by the EMA in 2009 and by the FDA in 2010 to improve glycaemic control in adults with type 2 diabetes mellitus (EMA 2009b; FDA 2010c). A Cochrane Review of glucagon‐like peptide 1 (GLP‐1) receptor agonists for type 2 diabetes mellitus showed a significant weight reduction of 1.33 kg (P < 0.0001) and a marginally significant reduction in systolic BP of −2.42 mm Hg (P = 0.05) for 1.8 mg liraglutide compared to placebo after 24 weeks. No difference in diastolic BP was reported. The most common adverse events of liraglutide were gastrointestinal, such as nausea or vomiting (Shyangdan 2011). There were also more cases of pancreatitis among liraglutide users compared with comparators, and in 2011 the FDA issued a warning that liraglutide may cause pancreatitis and thyroid carcinoma (NEJM Journal Watch 2011). In 2016, the Liraglutide Effect and Action in Diabetes: Evaluation of cardiovascular outcome Results (LEADER) trial, a double‐blind, placebo‐controlled randomised controlled trial including 9340 participants with type 2 diabetes mellitus at high risk of cardiovascular disease, investigated the long‐term effects of 1.8 mg liraglutide in comparison to placebo on cardiovascular outcomes as well as on neoplasms and other adverse events (LEADER 2013). After a mean follow‐up of 3.8 years, the primary outcome, a composite endpoint including the first occurrence of death from cardiovascular causes, nonfatal myocardial infarction, or nonfatal stroke, occurred in significantly fewer participants in the liraglutide group compared to the placebo group. On the other hand, significantly more participants in the liraglutide group discontinued the study due to adverse events, and the rate of pancreatic carcinoma was twice as high in the liraglutide group as in the placebo group. In addition to glycaemic control, liraglutide was approved by the FDA and EMA at a dose of 3.0 mg for the treatment for obesity in 2014/2015 (EMA 2015b; FDA 2014b). It was investigated for this indication in the SCALE study programme, in which 5358 obese or overweight people with or without weight‐related comorbidities participated (SCALE diabetes 2014; SCALE maintenance 2013; SCALE obesity and prediabetes 2014; SCALE sleep apnoea 2014). Although the percentage of hypertensive participants was as high as 70% in these trials, no results for a hypertensive subgroup were reported. At the end of the studies (32 to 56 weeks), mean body weight was significantly reduced among liraglutide users compared to placebo (−3 to −6 kg). Systolic BP was also significantly reduced in all four trials (−3 mm Hg), while for diastolic BP only one trial showed a significant difference between liraglutide and placebo (−1 mm Hg) (SCALE obesity and prediabetes 2014). The dropout rates in the studies were about 23% to 34% and therefore lower than in other weight‐management trials. As in the glycaemic control trials, the most common adverse events were nausea, diarrhoea, and vomiting. Pancreatitis also occurred more frequently in the liraglutide group compared to placebo.
For this review update, we also excluded trials investigating sibutramine or rimonabant, since their marketing approval was withdrawn in 2010 and 2009, respectively. Results of trials investigating these two products are briefly discussed in the following paragraphs.
Sibutramine
Results for participants with hypertension were reported in four trials investigating sibutramine (Fanghänel 2003; Faria 2002; McMahon 2000; McMahon 2002). Results of clinical outcomes were sparse, with only one study reporting that no death occurred during the study period (McMahon 2002). In the four included studies, body weight was reduced by about 4 kg, which corresponds to the weight reduction with orlistat. However, sibutramine did not show the same beneficial effects on blood pressure. In two studies using a dosage of 20 mg a day, which is higher than the currently approved dosage (in Germany) of 10 to 15 mg a day, blood pressure actually rose in participants treated with sibutramine. This finding is further underlined by the result of a head–to‐head comparison of orlistat versus sibutramine (Derosa 2005). It was found that while in participants in the orlistat group (120 mg three times a day) a reduction of −8.4 kg body weight resulted in a reduction of systolic BP and diastolic BP of −4.0 and −3.0 mm Hg respectively, the same 8.3 kg decline in body weight in the sibutramine group did not lead to a change in BP in participants treated with 10 mg sibutramine a day (0.0 and 0.0 mm Hg respectively). In a meta‐analysis by Kim 2003. comparing sibutramine with placebo in participants with or without hypertension at baseline, a significant increase in systolic BP (+1.6 mm Hg) and diastolic BP (+1.8 mm Hg) were also found in the sibutramine‐treatment group despite a large effect on weight loss in this group. As there are safety concerns in hypertensive people, the EMA demanded a long‐term trial of people at high cardiovascular risk, and the Sibutramine Cardiovascular Outcome Trial (SCOUT) was initiated. This double‐blind, randomised, placebo‐controlled outcome trial in approximately 10,000 overweight/obese high‐risk cardiovascular participants started recruitment in December 2002 and was designed to determine the impact of weight loss in 10,742 participants (SCOUT 2010). After a mean duration of 3.5 years, 11.4% of participants in the sibutramine and 10.0% in the placebo group had a primary outcome event. These were either a non‐fatal myocardial infarction, a non‐fatal stroke, resuscitation after cardiac arrest, or cardiovascular death (hazard ratio 1.16, 95% CI 1.03 to 1.31; P = 0.02; number needed to treat for an additional harmful outcome: 71). As any observed loss in body weight was only modest, the FDA and EMA concluded that the risk of an adverse cardiovascular event outweighed any benefit resulting from taking sibutramine. Even though about one‐third of the study population was hypertensive, the SCOUT study is not included in our review, as no hypertensive subgroup analyses were presented. In addition, as marketing approval for sibutramine has been withdrawn, we did not attempt to contact the authors to obtain the necessary data for this subgroup.
Rimonabant
Four studies (the Rimonabant in Obesity (RIO) studies) investigated the effects of a daily therapy of 5 and 20 mg rimonabant in comparison to placebo in study populations including normo‐ and hypertensive (30% to 60%) participants (Despres 2005; Pi‐Sunyer 2006; Scheen 2006; Van Gaal 2005). None of the RIO studies were designed to assess the effects on patient‐relevant endpoints. Participants receiving treatment with rimonabant reduced their body weight to a statistically significantly greater degree than placebo participants, regardless of the dosage. Contrary to these findings, the studies yielded heterogeneous results for blood pressure changes. In particular, therapy with 5 mg rimonabant showed inconsistent results, with a higher reduction in blood pressure compared to placebo in some studies, but less of a reduction in others. Treatment with 20 mg rimonabant daily showed more uniform findings, with a higher reduction in systolic BP in all four studies (the difference was statistically significant in two). Furthermore, in three studies the reduction in diastolic BP was more pronounced in participants taking 20 mg rimonabant than in the placebo group (the difference was statistically significant in one), but slightly less pronounced in one study. Only the publication of the RIO Lipid study reported information on a hypertensive subgroup (Despres 2005). In hypertensive participants treated with 20 mg rimonabant, blood pressure was reduced to a statistically significantly greater degree than in participants in the placebo group (systolic BP: −5.9 mm Hg; diastolic BP: −3.9 mm Hg). Since no other information on the hypertensive subgroup is provided (the paper does not even report the percentage of participants with hypertension at baseline), the relevance of these findings remains unclear. In addition, it must be noted that rimonabant was never approved by the FDA because of serious safety concerns (FDA 2007). Original data analysis performed by the FDA showed that the incidence of suicidality was doubled in the rimonabant group versus placebo. Similarly, incidences of psychiatric adverse events, neurological adverse events, and seizures were consistently higher for 20 mg rimonabant compared to placebo. Rimonabant received marketing approval from the EMA on 19 June 2006. However, new data derived from post‐marketing experience and ongoing clinical trials led the EMA on 23 October 2008 to recommend suspension of the marketing authorisation for rimonabant in Europe as well (EMA 2008a; EMA 2008b). In January 2009, the European Commission issued a decision to withdraw the market authorisation for rimonabant in all EU countries (EMA 2009a). Many more results from long‐term data will have to be published before a decision on the usefulness of rimonabant can be made. The results of the Comprehensive Rimonabant Evaluation Study of Cardiovascular Endpoints and Outcomes (CRESCENDO) trial, published in 2010, did not change the recommendation made by EMA in 2009 (CRESCENDO 2010). This study was closed early in November 2008 due to high suicide rates and other psychiatric side effects related to rimonabant. It was a multicentre, double‐blind, placebo‐controlled trial with a mean follow‐up of 13.8 months, aimed at determining whether long‐term treatment with 20 mg rimonabant could potentially reduce the risk of cardiovascular events in 9314 participants with previously manifest or increased risk of vascular disease. Even though about 88% of participants were hypertensive, no hypertensive subgroup analyses were presented. The primary endpoints were cardiovascular death, myocardial infarction, or stroke, which occurred in 3.9% of participants assigned to rimonabant, compared with 4.0% of participants assigned to placebo (hazard ratio 0.97, 95% CI 0.84 to 1.12; P = 0.68). Among participants taking rimonabant, the incidence of gastrointestinal (33% versus 22%), neuropsychiatric (32% versus 21%), and serious psychiatric side effects (2.5% versus 1.3%) was significantly increased compared with placebo. Four participants in the rimonabant group and one in the placebo group committed suicide.
Overall completeness and applicability of evidence
We searched four electronic databases and the clinical trials registries ClinicalTrials.gov and WHO ICTRP up to March 2020 and examined the reference lists of included trials and relevant systematic reviews and meta‐analyses. We contacted authors of studies with mixed study populations (normo‐ and hypertensive participants) for further information about the subset of people with hypertension. We assessed each study's quality and summarised the results. The results of this review can therefore be taken to be complete and applicable. For full information please see details in the relevant sections.
Quality of the evidence
Of the four orlistat studies included in our analyses, we judged only one to have major deficiencies in study quality (Bakris 2002). We regarded the two included trials investigating phentermine/topiramate (CONQUER 2013) or naltrexone/bupropion (Nissen 2016) as having no major deficiencies in study quality. Full details are provided in the 'Risk of bias' tables in Characteristics of included studies.
Potential biases in the review process
A major limitation of this review is that due to insufficient information in the included studies, we can draw no conclusions on the effects of the different pharmaceutical weight‐loss interventions on patient‐relevant long‐term outcomes.
Agreements and disagreements with other studies or reviews
Systematic reviews on the long‐term effects of weight‐reducing drugs in people with hypertension are rare. One systematic review (Aucott 2005) reached the same conclusion as us, that only short‐term trials were available. The authors also warned "that extrapolation of short‐term blood pressure changes with weight loss to the longer term is potentially misleading. The weight/hypertension relationship is complex and needs well‐conducted studies with long‐term follow‐up to examine the effects of weight loss on hypertension outcomes". Systematic reviews on long‐term effects of weight‐reducing drugs in a mixed population of overweight or obese people with or without hypertension reported blood pressure‐reducing effects for orlistat, liraglutide, lorcaserin, and phentermine/topiramate, but not for naltrexone/bupropion (Khera 2018; LeBlanc 2018). Although LeBlanc 2018 could include more than 30 trials that addressed medications for weight loss, no reliable conclusions could be drawn about clinical outcomes. A recently‐published systematic review (Kane 2019) investigated the effect of pharmacological weight reduction versus placebo on all‐cause mortality and cardiovascular risk factors. The meta‐analyses, including up to seven RCTs with normo‐ and hypertensive participants, showed a significant benefit for the pharmacological weight‐loss interventions in cardiovascular mortality, but no effect on all‐cause mortality.
We were also involved in the preparation of the scientific report on the evaluation of the benefits and harms of non‐drug treatment strategies in people with essential hypertension (IQWiG 2006), and published a paper on this topic (Horvath 2008).We are aware of all major and relevant systematic reviews and studies, and can say with confidence that our findings are in good agreement with recently‐published reviews and studies.
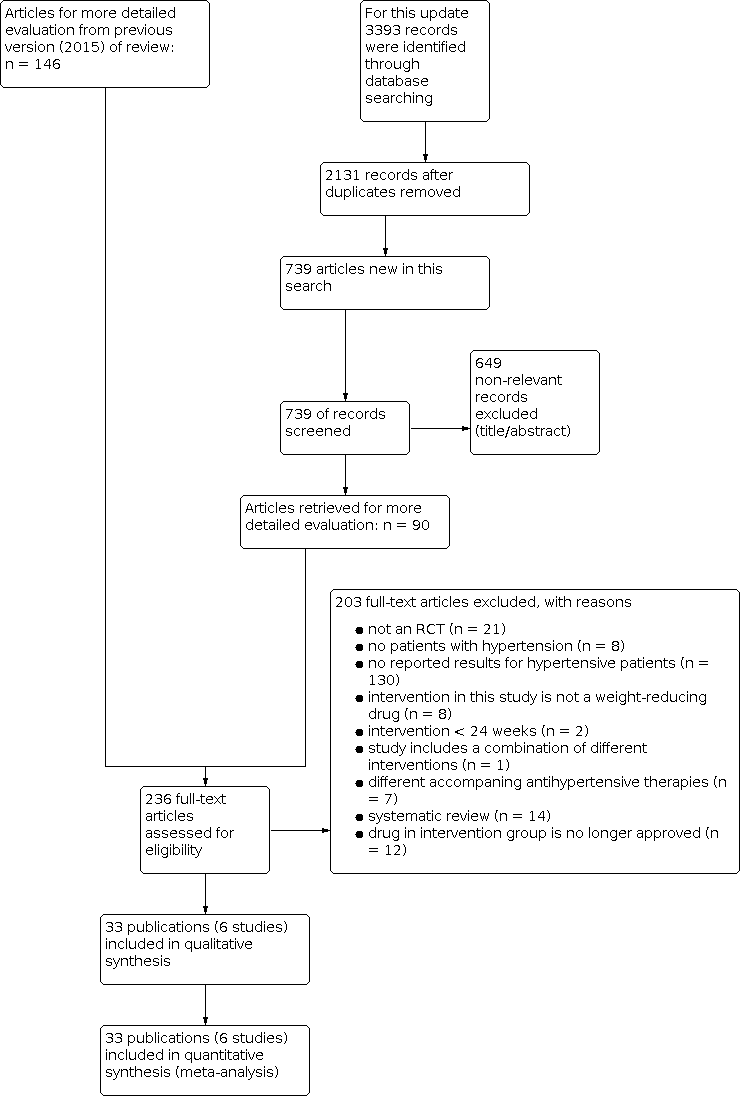
Study flow diagram.

Risk of bias graph: review authors' judgements about each risk of bias item presented as percentages across all included studies.

Risk of bias summary: review authors' judgements about each risk of bias item for each included study.
![Forest plot of comparison: 1 Orlistat versus placebo, outcome: 1.3 Change in body weight from baseline to endpoint (6 to 12 months follow‐up) [kg].](/es/cdsr/doi/10.1002/14651858.CD007654.pub5/media/CDSR/CD007654/image_n/nCD007654-FIG-04.svg)
Forest plot of comparison: 1 Orlistat versus placebo, outcome: 1.3 Change in body weight from baseline to endpoint (6 to 12 months follow‐up) [kg].
![Forest plot of comparison: 1 Orlistat versus placebo, outcome: 1.4 Change in systolic blood pressure from baseline to endpoint (6 to 12 months follow‐up) [mm Hg].](/es/cdsr/doi/10.1002/14651858.CD007654.pub5/media/CDSR/CD007654/image_n/nCD007654-FIG-05.svg)
Forest plot of comparison: 1 Orlistat versus placebo, outcome: 1.4 Change in systolic blood pressure from baseline to endpoint (6 to 12 months follow‐up) [mm Hg].
![Forest plot of comparison: 1 Orlistat versus placebo, outcome: 1.5 Change in diastolic blood pressure from baseline to endpoint (6 to 12 months follow‐up) [mm Hg].](/es/cdsr/doi/10.1002/14651858.CD007654.pub5/media/CDSR/CD007654/image_n/nCD007654-FIG-06.svg)
Forest plot of comparison: 1 Orlistat versus placebo, outcome: 1.5 Change in diastolic blood pressure from baseline to endpoint (6 to 12 months follow‐up) [mm Hg].

Comparison 1: Orlistat versus placebo, Outcome 1: Serious adverse events

Comparison 1: Orlistat versus placebo, Outcome 2: All adverse events

Comparison 1: Orlistat versus placebo, Outcome 3: Change in body weight from baseline to endpoint (6 to 12 months follow‐up)

Comparison 1: Orlistat versus placebo, Outcome 4: Change in systolic blood pressure from baseline to endpoint (6 to 12 months follow‐up)

Comparison 1: Orlistat versus placebo, Outcome 5: Change in diastolic blood pressure from baseline to endpoint (6 to 12 months follow‐up)

Comparison 2: Phentermine/topiramate versus placebo, Outcome 1: All adverse events

Comparison 2: Phentermine/topiramate versus placebo, Outcome 2: Serious adverse events

Comparison 2: Phentermine/topiramate versus placebo, Outcome 3: Change in body weight from baseline to endpoint: Phen/Top low dose (13 months follow‐up)

Comparison 2: Phentermine/topiramate versus placebo, Outcome 4: Change in body weight from baseline to endpoint: Phen/Top high dose (13 months follow‐up)

Comparison 2: Phentermine/topiramate versus placebo, Outcome 5: Change in systolic blood pressure from baseline to endpoint: Phen/Top low dose (13 months follow‐up)

Comparison 2: Phentermine/topiramate versus placebo, Outcome 6: Change in systolic blood pressure from baseline to endpoint: Phen/Top high dose (13 months follow‐up)

Comparison 2: Phentermine/topiramate versus placebo, Outcome 7: Change in diastolic blood pressure from baseline to endpoint: Phen/Top low dose (13 months follow‐up)

Comparison 2: Phentermine/topiramate versus placebo, Outcome 8: Change in diastolic blood pressure from baseline to endpoint: Phen/Top high dose (13 months follow‐up)

Comparison 3: Naltrexone/bupropion versus placebo, Outcome 1: Total mortality

Comparison 3: Naltrexone/bupropion versus placebo, Outcome 2: Cardiovascular morbidity

Comparison 3: Naltrexone/bupropion versus placebo, Outcome 3: All adverse events

Comparison 3: Naltrexone/bupropion versus placebo, Outcome 4: Serious adverse events

Comparison 3: Naltrexone/bupropion versus placebo, Outcome 5: Change in body weight from baseline to endpoint (28 months follow‐up)

Comparison 3: Naltrexone/bupropion versus placebo, Outcome 6: Change in systolic blood pressure from baseline to endpoint (28 months follow‐up)

Comparison 3: Naltrexone/bupropion versus placebo, Outcome 7: Change in diastolic blood pressure from baseline to endpoint (28 months follow‐up)
| Orlistat compared with placebo for weight reduction | ||||||
| Patient or population: Men and non‐pregnant women ≥ 18 years old with essential hypertension Intervention: Orlistat Comparison: Placebo | ||||||
| Outcomes | Anticipated absolute effects (95% CI) | Relative effect | No of Participants | Quality of the evidence | Comments | |
|---|---|---|---|---|---|---|
| Risk with placebo | Risk with orlistat | |||||
| Total mortality Follow‐up: 24 ‐ 208 weeks | 2 deaths (OD subgroup) and 1 death (OS subgroup) with orlistat, and no deaths with placebo in 1 trial; no deaths with orlistat or placebo in 2 other trials | ‐ | 1488 (3 studies) | ⊕⊕⊝⊝ | Very low event rate. | |
| Cardiovascular morbidity Follow‐up: 24 weeks | see comment | ‐ | 1811 (3 studies) | ⊕⊝⊝⊝ very lowb | Reporting of results too diverse to allow a meta‐analysis and small number of events. The effects of orlistat compared with placebo for this outcome are uncertain. | |
| Serious adverse events Follow‐up: 24 ‐ 208 weeks | 101 per 1000 | 146 per 1000 (111 to 192) | RR 1.45 (1.10 to 1.91) | 1476 (3 studies) | ⊕⊕⊕⊝ | ‐ |
| All adverse events Follow‐up: 24‐208 weeks | 865 per 1000 | 977 per 1000 (727 to 1000) | RR 1.13 (0.84 to 1.54) | 1386 (2 studies) | ⊕⊝⊝⊝ | 98% heterogeneity |
| Change in systolic blood pressure compared to placebo (mm Hg) from baseline to end of study Follow‐up: 24 ‐ 52 weeks | Reduction of systolic blood pressure ranged across control groups from 0.9 to 11.0 mm Hg | MD 2.58 mm Hg lower (3.78 lower to 1.37 lower) | ‐ | 2058 | ⊕⊕⊕⊝ | ‐ |
| Change in diastolic blood pressure compared to placebo (mm Hg) from baseline to end of study Follow‐up: 24 ‐ 52 weeks | Reduction of diastolic blood pressure ranged across control groups from 0.8 to 9.2 mm Hg | MD 1.97 mm Hg lower (2.72 lower to 1.22 lower) | ‐ | 2058 | ⊕⊕⊕⊝ | ‐ |
| Change in body weight compared to placebo (kg) from baseline to end of study Follow‐up: 24 ‐ 52 weeks | Reduction of body weight ranged across control groups from 1.8 to 6.93 kg | MD 3.74 kg lower (4.70 lower to 2.78 lower) | ‐ | 2080 | ⊕⊕⊝⊝ | ‐ |
| CI: confidence interval; MD: mean difference; OD: orlistat and diastolic blood pressure ≥ 90 mm Hg; OS: orlistat and systolic blood pressure ≥ 140 mm Hg; RR: risk ratio | ||||||
| GRADE Working Group grades of evidence | ||||||
| aDowngraded by two levels because of serious imprecision (small number of trials, very low event rates) ‐ see Appendix 1. | ||||||
| Phentermine/topiramate compared with placebo for weight reduction | ||||||
| Patient or population: Men and non‐pregnant women ≥ 18 years old with essential hypertension Intervention: Phentermine/topiramate Comparison: Placebo | ||||||
| Outcomes | Anticipated absolute effects (95% CI) | Relative effect | No of Participants | Quality of the evidence | Comments | |
|---|---|---|---|---|---|---|
| Risk with placebo | Risk with phentermine/topiramate | |||||
| Total mortality Follow‐up: 56 weeks | see comment | ‐ | 1305 (1 study) | ⊕⊕⊝⊝ | No death occurred in the hypertensive subgroup of the only included RCT. | |
| Cardiovascular morbidity Follow‐up: 56 weeks | see comment | ‐ | 1305 (1 study) | ⊕⊝⊝⊝ very lowb | 2.3% of the hypertensive participants in the low‐dose phen/top group, 3.7% in the high‐dose phen/top group, and 1.7% in the placebo group experienced treatment‐emergent cardiovascular adverse events. | |
| Serious adverse events Follow‐up: 56 weeks | 42 per 1000 | 36 per 1000 (21 to 62) | RR 0.85 (0.49 to 1.48) | 1305 (1 study) | ⊕⊕⊝⊝ | ‐ |
| All adverse events Follow‐up: 56 weeks | 773 per 1000 | 873 per 1000 (835 to 927) | RR 1.13 (1.08 to 1.20) | 1305 (1 study) | ⊕⊕⊝⊝ | ‐ |
| Change in systolic blood pressure compared to placebo (mm Hg) from baseline to end of study Follow‐up: 56 weeks | Reduction of systolic blood pressure was −4.9 mm Hg | Low dose: MD 2.0 mm Hg lower (3.97 lower to 0.03 lower) | ‐ | 772 (1 study) | ⊕⊕⊝⊝ | ‐ |
| High dose: MD 4.2 mm Hg lower (5.85 lower to 2.55 lower) | ‐ | 1030 (1 study) | ⊕⊕⊝⊝ | ‐ | ||
| Change in diastolic blood pressure compared to placebo (mm Hg) from baseline to end of study Follow‐up: 56 weeks | Reduction of diastolic blood pressure was −4.9 mm Hg | Low dose: MD 1.3 mm Hg lower (2.6 lower to 0.0 lower) | ‐ | 772 (1 study) | ⊕⊕⊝⊝ | ‐ |
| High dose: MD 1.9 mm Hg lower (2.88 lower to 0.92 lower) | ‐ | 1030 (1 study) | ⊕⊕⊝⊝ | ‐ | ||
| Change in body weight as compared to placebo (%) from baseline to end of study Follow‐up: 56 weeks | Reduction of body weight was −1.9 % | Low dose: MD 6.3 % lower (7.37 lower to 5.23 lower) | ‐ | 772 (1 study) | ⊕⊕⊝⊝ | Percentage change from initial body weight. |
| High dose: MD 8.2 % lower (9.09 lower to 7.31 lower) | ‐ | 1030 (1 study) | ⊕⊕⊝⊝ | Percentage change from initial body weight. | ||
| CI: confidence interval; MD: mean difference; RR: risk ratio | ||||||
| GRADE Working Group grades of evidence | ||||||
| aDowngraded by two levels because of serious imprecision (single study) ‐ see Appendix 2. | ||||||
| Naltrexone/bupropion compared with placebo for weight reduction | ||||||
| Patient or population: Men and non‐pregnant women ≥ 18 years old with essential hypertension Intervention: Naltrexone/bupropion Comparison: Placebo | ||||||
| Outcomes | Anticipated absolute effects (95% CI) | Relative effect | No of Participants | Quality of the evidence | Comments | |
|---|---|---|---|---|---|---|
| Risk with placebo | Risk with naltrexone/bupropion | |||||
| Total mortality Follow‐up: 121 weeks | 15 per 1000 | 15 per 1000 (11 to 21) | RR 0.99 (0.70 to 1.40) | 8283 (1 study) | ⊕⊕⊕⊝ | ‐ |
| Cardiovascular morbidity Follow‐up: 121 weeks | 29 per 1000 | 32 per 1000 (25 to 40) | RR 1.11 (0.87 to 1.41) | 8283 (1 study) | ⊕⊕⊝⊝ | MI, stroke + hospitalisation for unstable angina. |
| Serious adverse events Follow‐up: 121 weeks | 205 per 1000 | 215 per 1000 (196 to 233) | RR 1.05 (0.96 to 1.14) | 8283 (1 study) | ⊕⊕⊕⊝ | ‐ |
| All adverse events Follow‐up: 121 weeks | 256 per 1000 | 432 per 1000 (404 to 460) | RR 1.69 (1.58 to 1.80) | 8283 (1 study) | ⊕⊕⊕⊝ | ‐ |
| Change in systolic blood pressure as compared to placebo (mm Hg) from baseline to end of study Follow‐up: 56 weeks | Increase of systolic blood pressure was 2.2 mm Hg | MD 0.0 mm Hg higher (0.6 lower to 0.6 higher) | ‐ | 8283 (1 study) | ⊕⊕⊕⊕⊝ | ‐ |
| Change in diastolic blood pressure as compared to placebo (mm Hg) from baseline to end of study Follow‐up: 121 weeks | Increase of diastolic blood pressure was 1.1 mm Hg | MD 0.3 mm Hg higher (0.08 lower to 0.68 higher) | ‐ | 8283 (1 study) | ⊕⊕⊕⊝ | ‐ |
| Change in body weight as compared to placebo (kg) from baseline to end of study Follow‐up: 121 weeks | Reduction of body weight was 0.0 kg | MD 1.9 kg lower (2.07 lower to 1.73 lower) | ‐ | 8283 (1 study) | ⊕⊕⊕⊝ | ‐ |
| CI: confidence interval; MD: mean difference; RR: risk ratio | ||||||
| GRADE Working Group grades of evidence | ||||||
| aDowngraded by one level because of imprecision (single study). | ||||||
| Study | Intervention(s) and comparator(s) | Description of power and sample size calculation | Randomised | Safety (N) | ITT | Finishing trial | Randomised finishing trial | Follow‐up | |
|---|---|---|---|---|---|---|---|---|---|
| Orlistat vs placebo | |||||||||
| Orlistat | The sample size determination for the present trial was based on a 2‐sample t‐test (2‐tailed). Since there were 2 primary efficacy parameters in this trial, body weight reduction and sitting diastolic BP reduction, Holm’s sequential rejection procedure was used to project the overall type I error rate 0.05, and α = 0.025 was chosen for the calculation of sample size for each parameter. A mean body weight change of 2.1 kg and a within‐group standard deviation of 6.1 kg would require 161 participants per group to provide a power of 0.8 at α = 0.025. A mean change of 3.0 mm Hg in sitting diastolic BP with a within‐group standard deviation of 8.5 mm Hg would require 153 participants per group to provide power of 0.8 with α = 0.025. Based on these calculations, and assuming a dropout rate of 35%, 496 participants (248 participants per group) had to be enrolled to ensure an adequate statistical power of at least 80% in either of the 2 primary efficacy parameters. | 278 | nr | 267 | 162 | 58 | 24 weeks | ||
| Placebo | 276 | nr | 265 | 108 | 36 | ||||
| Orlistat | nr | 45 | 45 | 45 | 45 | 100 | 24 weeks | ||
| Placebo | 45 | 45 | 45 | 45 | 100 | ||||
| Orlistat | Power calculations indicated that, with a power of 80% at the 0.05 significance level, 408 participants were needed to detect a 2.5 mm Hg difference in diastolic BP, 152 participants were needed to detect a 0.05% difference in HbA1c. 140 participants were needed to detect a 0.35 mmol/l difference in LDL‐cholesterol. | 499 (HT: 304) | nr | 499 (HT: 304) | 458 (HT: nr) | 91.6% (HT: nr) | 24 weeks | ||
| Placebo | 505 (HT: 310) | nr | 505 (HT: 310) | 458 (HT: nr) | 90.7% (HT: nr) | ||||
| Orlistat (DBP ≥ 90 mm Hg) [OD] | A 2‐sided log‐rank test would require a minimum of ~ 95 primary cases of type 2 diabetes in both study groups combined to have 90% power of detecting a significant outcome at α = 0.05. With this event‐based design, 3305 participants were randomised and followed until sufficient events occurred. As a consequence of the design, study power would be unaffected by dropout rate. | 1650 | (HT: 408) | nr | 1640 (HT: nr) | (HT: 386) | 94.6 | 208 weeks | |
| Orlistat (SBP ≥ 140mm Hg) [OS] | (HT: 516) | nr | (HT: 491) | 95.2 | |||||
| Placebo (DBP ≥ 90 mm Hg) [PD] | 1655 | (HT: 441) | nr | 1637 (HT: nr) | (HT: 421) | 95.5 | |||
| Placebo (SBP ≥ 140 mm Hg) [PS] | (HT: 509) | nr | (HT: 487) | 95.7 | |||||
| Phentermine/topiramate vs placebo | |||||||||
| Phen/Top [LD] | Power analysis based on data from a previous study suggested that 250 participants in each group would provide > 95% power to detect a difference of 4.4% in weight loss between placebo and active treatments at a significance level of 0.05. To enhance the power for detecting differences in safety outcomes, we planned to enrol about 2500 participants. | 498 (HT: 261) | 398 (HT: 261) | 488 (HT: 261) | 374 (HT: 256) | 75.1 (HT: 98.1) | 56 weeks | ||
| Phen/Top [HD] | 995 (HT: 520) | 994 (HT: 520) | 981 (HT: 520) | 733 (HT: 514) | 73.7 (HT: 98.8) | ||||
| Placebo | 994 (HT: 524) | 993 (HT: 524) | 976 (HT: 524) | 616 (HT: 516) | 61.9 (HT: 98.5) | ||||
| Naltrexone/bupropion vs placebo | |||||||||
| Nal/Bup | The trial was designed to provide 90% power to rule out the 1.4 margin (i.e. the upper limit of the confidence interval would not exceed 1.4) when the true HR is 1.0, which required 378 primary events. The early pre‐approval analysis to rule out the 2.0 margin required 87 primary events to provide 90% power when the true HR is 1.0. In both settings, a 1‐sided type I error (α) of 2.5% was used. To obtain sample sizes, an annualised rate of primary events of 1.5% in the placebo group was assumed. The recruitment was assumed to take 1.5 years, with maximum participant follow‐up of 4 years. It was assumed that 7% of the study population would discontinue during the lead‐in period, with a loss–to–follow‐up rate of 1.2% annually. | 4456 (HT: 4164) | 4455 (HT: 4164) | 4455 (HT: 4164) | 705 (HT: nr) | 15.8% (HT: nr) | 121 weeks | ||
| Placebo | 4454 (HT: 4123) | 4450 (HT: 4119) | 4450 (HT: 4119) | 275 (HT: nr) | 6.2% (HT: nr) | ||||
| DBD: diastolic blood pressure; HR: hazard ratio; HT: hypertensive subgroup; ITT: intention‐to‐treat; nr: not reported; [OD]: orlistat and diastolic blood pressure ≥ 90 mm Hg; [OS]: orlistat and systolic blood pressure ≥ 140 mm Hg; Phen/Top [HD]: phentermine/topiramate high dose (15 mg/92 mg); Phen/Top [LD]: phentermine/topiramate low dose (7.5 mg/46 mg); [PD]: placebo and diastolic blood pressure ≥ 90 mm Hg; [PS]: placebo and systolic blood pressure ≥ 140 mm Hg; SBD: systolic blood pressure. | |||||||||
| Study | Intervention(s) and comparator(s) | Description of participants | Nationality | Setting | Ethnic groups (%) | Duration of disease (mean years (SD)) | Antihypertensive treatment (%) |
|---|---|---|---|---|---|---|---|
| Orlistat vs placebo | |||||||
| Orlistat | Obese individuals with insufficiently controlled hypertension | USA | Outpatient clinic | White (85) African American (11) Hispanic (4) Other (0) | nr | Antihypertensive‐treatment at trial onset: 95% ACE‐inhibitor (27) Ca‐antagonists (29) β‐blocker (27) Diuretic (19) AT‐II‐receptor antagonists (6) α‐blocker (10) Other (11), | |
| Placebo | White (86) African American (12) Hispanic (1) Other (1) | nr | antihypertensive‐treatment at trial onset: 94% ACE‐inhibitor (35) Ca‐antagonist (30) β‐blocker (26) Diuretic (14) AT‐II‐receptor antagonists (10) α‐blocker (8) Other (9) | ||||
| Orlistat | Obese individuals with metabolic syndrome, diabetes type 2, hypertension, mostly with coronary heart disease (77%) and concomitant cardiac dysfunction | Switzerland | Outpatient clinic | White (100) | nr | Antihypertensive‐treatment at trial onset: 100% ACE‐inhibitor (36) Ca‐antagonist (18) β‐blocker (49) Diuretic (low‐dose hydrochlorothiazide) (60) AT‐II‐receptor antagonists (49) | |
| Placebo | |||||||
| Orlistat | Obese individuals with diabetes type 2, hypertension or hypercholesterolaemia | France | Private practices (endocrinologists) | nr | nr | Antihypertensive‐treatment at trial onset: 70% | |
| Placebo | |||||||
| Orlistat (DBP ≥ 90 mm Hg) [OD] | Obese individuals with normal or impaired glucose tolerancea | Sweden | Medical centres | nr | nr | ACE‐inhibitors (7) Ca‐antagonists (6) β‐blockers (17) Diuretics (7) AT‐II‐receptor antagonists (2) | |
| Orlistat (SBP ≥ 140 mm Hg) [OS] | ACE‐inhibitors (6) Ca‐antagonists (6) β‐blockers (14) Diuretics (8) AT‐II‐receptor antagonists (2) | ||||||
| Placebo (DBP ≥ 90 mm Hg) [PD] | ACE‐inhibitors (7) Ca‐antagonists (7) β‐blockers (13) Diuretics (11) AT‐II‐receptor antagonists (1) | ||||||
| Placebo (SBP ≥ 140 mm Hg) [PS] | ACE‐inhibitors (8) Ca‐antagonists (8) β‐blockers (13) Diuretics (10) AT‐II‐receptor antagonists (2) | ||||||
| Phentermine/topiramate vs placebo | |||||||
| Phen/Top [LD] | Obese or overweight individuals with 2 or more comorbidities (hypertension, dyslipidaemia, diabetes or prediabetes, or abdominal obesity)a | USA | Outpatient clinic | White (83) African American (15) Hispanic or Latino (10) | nr | ACE inhibitors alone (26.9) β‐blockers alone (24.1) AT‐II‐receptor antagonists alone (15.5) ACE inhibitors + diuretics (5.8) ACE inhibitors + Ca‐antagonists (3.5), AT‐II‐receptor antagonists + diuretics (12.4) AT‐II‐receptor antagonists + Ca‐antagonists (0.9) | |
| Phen/Top [HD] | |||||||
| Placebo | |||||||
| Naltrexone/bupropion vs placebo | |||||||
| Nal/Bup | Overweight or obese people at increased risk of adverse cardiovascular outcomes | USA | Medical sites | White (83.3) Black (15.3) Other (1.4) | 12.2 (9.40) | 97.1 | |
| Placebo | White (82.3) Black (15.3) Other (2.4) | 11.6 (9.03) | 97.2 | ||||
| a only data for the predefined subgroup of hypertensive participants are reported here. ACE inhibitors: angiotensin‐converting enzyme inhibitors; AT‐II‐receptor antagonists: angiotensin II‐receptor antagonists; DBP: diastolic blood pressure; nr: not reported; [OD]: orlistat and diastolic blood pressure ≥ 90 mm Hg; [OS]: orlistat and systolic blood pressure ≥ 140 mm Hg; Phen/Top; [HD]: phentermine/topiramate high dose (15 mg/92 mg); Phen/Top [LD]: phentermine/topiramate low dose (7.5 mg/46 mg); [PD]: placebo and diastolic blood pressure ≥ 90 mm Hg; [PS]: placebo and systolic blood pressure ≥ 140 mm Hg; SBD: systolic blood pressure; SD: standard deviation. | |||||||
| Study | Intervention(s) and comparator(s) | Age (mean years (SD)) | Sex | BMI | Body weight (mean kg (SD)) | Sitting systolic blood pressure (mean mm Hg (SD)) | Sitting diastolic blood pressure (mean mm Hg (SD)) | Comorbid conditions (%) |
|---|---|---|---|---|---|---|---|---|
| Orlistat vs placebo | ||||||||
| Orlistat | 53.2 (0.5) | 63 | 35.8 (3.9) | 101.2 (1.0) | 154.2 (13.4) | 98.4 (3.7) | diabetes (8) | |
| Placebo | 52.5 (0.5) | 59 | 35.4 (4.0) | 101.5 (1.0) | 150.8 (12.7) | 98.3 (35) | diabetes (8) | |
| Orlistat | 54.9 (5.1) | 51 | 36.5 (1.9) | 107.0 (5.7) | 145.8 (9.8) | 87.8 (7.3) | metabolic syndrome (100) coronary heart disease (77) myocardial infarction (47) | |
| Placebo | 54.5 (4.5) | 51 | 36.1 (1.8) | 106.0 (5.9) | 142.1 (6.2) | 85.3 (5.6) | ||
| Orlistat | 49.1 (0.6) | 69 | 34.3 (0.2) | 93.9 (0.8) | 150.0 (0.8) | 96.9 (0.3) | nr | |
| Placebo | 49.5 (0.5) | 65 | 33.9 (0.2) | 93.5 (0.8) | 152.2 (0.9) | 97.0 (0.3) | nr | |
| Orlistat (DBP ≥ 90 mm Hg) [OD] | 46 (7) | 3862 | nr | 116 (17) | 146 (13) | 95 (5) | nr | |
| Orlistat (SBP ≥ 140mm Hg) [OS] | 47(7) | 42 | nr | 116 (17) | 149 (10) | 91 (9) | nr | |
| Placebo (DBP ≥ 90 mm Hg) [PD] | 46 (7) | 4456 | nr | 114 (18) | 142 (126) | 95 (5) | nr | |
| Placebo (SBP ≥ 140 mm Hg) [PS] | 47(7) | 42 | nr | 115 (18) | 149 (8) | 91 (8) | nr | |
| Phentermine/topiramate vs placebo | ||||||||
| Phen/Top [LD] | 53.0 (9.8) | 65.9% | 36.7 (4.6) | 104.4 (18.4) | 134.2 (13.0) | 83.7 (9.1) | nr | |
| Phen/Top [HD] | ||||||||
| Placebo | ||||||||
| Naltrexone/bupropion vs placebo | ||||||||
| Nal/Bup | 61.8 (7.27) | 54.5 | 37.1 (5.27) | 106 (19.09) | 126.1 (12.55) | 74.5 (9.01) | History of cardiovascular disease (30.3) History of Type 2 diabetes (86.4) History of dyslipidaemia (92.4) History of low LDL (27.8) Current smoker (8.4) | |
| Placebo | 61.6 (7.38) | 54.4 | 37.3 (5.42) | 106.6 (19.17) | 125.7 (12.62) | 74.4 (9.14) | History of cardiovascular disease (31.3) History of type 2 diabetes (86.9) History of dyslipidemia (92.1) History of low LDL (28.2) Current smoker (8.5) | |
| BMI: body mass index; LDL: low‐density lipoprotein; nr: not reported; [OD]: orlistat and diastolic blood pressure ≥ 90 mm Hg; [OS]: orlistat and systolic blood pressure ≥ 140 mm Hg; Phen/Top [HD]: phentermine/topiramate high dose (15 mg/92 mg); Phen/Top [LD]: phentermine/topiramate low dose (7.5 mg/46 mg); [PD]: placebo and diastolic blood pressure ≥ 90 mm Hg; [PS]: placebo and systolic blood pressure ≥ 140 mm Hg; SBD: systolic blood pressure; SD: standard deviation. | ||||||||
| Study | Intervention(s) and comparator(s) | Randomised/Safety (N) | Death (n (%)) | All adverse events (n (%)) | Leading to withdrawal (n (%)) | Serious adverse events (n (%)) |
|---|---|---|---|---|---|---|
| Orlistat vs placebo | ||||||
| Orlistat | 278/268a | 0 (0) | 239 (89) | 18 (6.7) | 31 (11.7) | |
| Placebo | 276/274a | 0 (0) | 195 (71) | 20 (7.3) | 24 (8.6) | |
| Orlistat | 45/45 | 0 (0) | nr | nr | 0 (0) | |
| Placebo | 45/45 | 0 (0) | nr | nr | 0 (0) | |
| Orlistat | 304/304 | nr | nr | nr | nr | |
| Placebo | 310/310 | nr | nr | nr | nr | |
| Orlistat (DBP ≥ 90 mm Hg) [OD] | 408/407 | 2 (0.5) | 403 (99) | 37 (9) | 73 (18) | |
| Orlistat (SBP ≥ 140mm Hg) [OS] | 516/513 | 1 (0.2) | 508 (99) | 46 (9) | 92 (18) | |
| Placebo (DBP ≥ 90 mm Hg) [PD] | 441/437 | 0 (0) | 420 (96) | 17 (4) | 52 (12) | |
| Placebo (SBP ≥ 140 mm Hg) [PS] | 509/508 | 0 (0) | 493 (97) | 20 (4) | 60 (12) | |
| Phentermine/topiramate vs placebo | ||||||
| Phen/Top [LD] | 261/261 | 0 (0) | 223 (85.4) | 31 (11.9) | 9 (3.4) | |
| Phen/Top [HD] | 520/520 | 0 (0) | 462 (88.8) | 103 (19.8) | 19 (3.7) | |
| Placebo | 524/524 | 0 (0) | 405 (77.3) | 51 (9.7) | 22 (4.2) | |
| Naltrexone/bupropion vs placebo | ||||||
| Nal/Bup | 4164/4164 | 63 (1.5) / P = 0.916 | 1796 (43.1) / P < 0.001 | 1273 (30.6) / P < 0.001 | 891 (21.4) / P = 0.297 | |
| Placebo | 4119/4119 | 63 (1,5) | 1053 (25.6) | 379 (9.2) | 843 (20.5) | |
| aCalculated from percentage rates DBP: diastolic blood pressure; nr: not reported; [OD]: orlistat and diastolic blood pressure ≥ 90 mm Hg; [OS]: orlistat and systolic blood pressure ≥ 140 mm Hg; Phen/Top [HD]: phentermine/topiramate high dose (15 mg/92 mg); Phen/Top [LD]: phentermine/topiramate low dose (7.5 mg/46 mg); [PD]: placebo and diastolic blood pressure ≥ 90 mm Hg; [PS]: placebo and systolic blood pressure ≥ 140 mm Hg; SBD: systolic blood pressure. | ||||||
| Study | Intervention(s) and comparator(s) | Randomised/Safety /N) | Gastrointestinal AE (n (%)) | Musculoskeletal AE (n (%)) | Dermatological AE (n (%)) | Vascular AE (n (%)) | Cardiac AE (n (%)) | Nervous system AE (n (%)) | Respiratory AE (n (%)) |
|---|---|---|---|---|---|---|---|---|---|
| Orlistat vs placebo | |||||||||
| Orlistat | 278/nr | 200 (72.5) | nr (22.8) | nr | nr | 5 (nr)a | nr | nr | |
| Placebo | 276/nr | 120 (43.6) | nr (15.5) | nr | nr | 5 (nr)a | nr | nr | |
| Orlistat | 45/45 | 16 (35.6)b | nr | nr | nr | nr | nr | nr | |
| Placebo | 45/45 | 11 (24.4)b | nr | nr | nr | nr | nr | nr | |
| Orlistat | 304/304 | nr | nr | nr | nr | nr | nr | nr | |
| Placebo | 310/310 | nr | nr | nr | nr | nr | nr | nr | |
| Orlistat (DBP ≥ 90 mm Hg) [OD] | 408/407 | 379 (93) | 265 (65) | 81 (20) | 69 (17) | nr | 159 (39) | nr | |
| Orlistat (SBP ≥ 140mm Hg) [OS] | 516/513 | 477 (93) | 333 (65) | 113 (22) | 87 (17) | nr | 205 (40) | nr | |
| Placebo (DBP ≥ 90 mm Hg) [PD] | 441/437 | 306 (70) | 271 (62) | 74 (17) | 83 (19) | nr | 170 (39) | nr | |
| Placebo (SBP ≥ 140 mm Hg) [PS] | 509/508 | 361 (71) | 320 (63) | 86 (17) | 97 (19) | nr | 188 (37) | nr | |
| Phentermine/topiramate vs placebo | |||||||||
| Phen/Top [LD] | 261/261 | Constipation: 41 (15.7) | nr | nr | nr | 6 (2.3) | Dry mouth: 37 (14.2) Paresthesia: 37 (14.2) Dysgeusia: 20 (7.7) Insomnia: 15 (5.7) Headache: 13 (5.0) Dizziness: 17 (6.5) | Upper respiratory tract infection: 33 (12.6) Nasopharyngitis: 27 (10.3) Sinusitis: 14 (5.4) | |
| Phen/Top [HD] | 520/520 | Constipation: 94 (18.1) | nr | nr | nr | 19 (3.7) | Dry mouth: 118 (22.7) Paresthesia: 116 (22.3) Dysgeusia: 57 (11.0) Insomnia: 57 (11.0) Headache: 56 (10.8) Dizziness: 63 (12.1) | Upper respiratory tract infection: 63 (12.1) Nasopharyngitis: 53 (10.2) Sinusitis: 43 (8.3) | |
| Placebo | 524/524 | Constipation: 29 (5.5) | nr | nr | nr | 9 (1.7) | Dry mouth: 12 (2.3) Paresthesia: 12 (2.3) Dysgeusia: 4 (0.8) Insomnia: 25 (4.8) Headache: 44 (8.4) Dizziness: 16 (3.1) | Upper respiratory tract infection: 62 (11.8) Nasopharyngitis: 46 (8.8) Sinusitis: 34 (6.5) | |
| Naltrexone/bupropion vs placebo | |||||||||
| Nal/Bup | 4164/4164 | 718 (17.2) / P < 0.001 | 181 (4.3) / P = 0.749 | 45 (1.1) / P = 0.002 | 158 (3.8)c / P = 0.978 | 313 (7.5) / P < 0.001 | 74 (1.8) / P = 0.947 | ||
| Placebo | 4119/4119 | 142 (3.4) | 185 (4.5) | 20 (0.5) | 155 (3.8)c | 111 (2.7) | 74 (1.8) | ||
| aOnly serious cardiac events. AE: adverse events; DBP: diastolic blood pressure; nr: not reported; [OD]: orlistat and diastolic blood pressure ≥ 90 mm Hg; [OS]: orlistat and systolic blood pressure ≥ 140 mm Hg; Phen/Top [HD]: phentermine/topiramate high dose (15 mg/92 mg); Phen/Top [LD]: phentermine/topiramate low dose (7.5 mg/46 mg); [PD]: placebo and diastolic blood pressure ≥ 90 mm Hg; [PS]: placebo and systolic blood pressure ≥ 140 mm Hg; SBD: systolic blood pressure. | |||||||||
| Study | Intervention(s) and comparator(s) | Baselinea | 6 moa | 12 moa | 48 moa | Change from baseline to endpointa |
|---|---|---|---|---|---|---|
| Orlistat vs placebo | ||||||
| Orlistat | 101.2 (1.0)c | nr | nr | na | −5.4 (6.4) / P < 0.001 (after 12 months) | |
| Placebo | 101.5 (1.0)c | nr | nr | na | −2.7 (6.4) (after 12 months) | |
| Orlistat | 106.9 (5.7) | 101.6(4.5) | na | na | −5.4c /P < 0.001 (after 6 months) | |
| Placebo | 105.9 (5.9) | 103.5 (5.3) | na | na | −2.5c (after 6 months) | |
| Orlistat | 93.9 (0.8)d | nr | na | na | −5.8 (0.3) / P < 0.0001 (after 6 months) | |
| Placebo | 93.5 (0.8)d | nr | na | na | −1.8 (0.2) (after 6 months) | |
| Orlistat (DBP ≥ 90 mm Hg) [OD]e | 117 (18) | 106 (17) | 105 (18) | 110 (19) | −11.9 (8.2) / P = nr (after 12 months)f −6.6 (8.6) / P < 0.001 (after 48 months) | |
| Orlistat (SBP ≥ 140mm Hg ) [OS]e | 117 (17) | 106 (17) | 105 (17) | 110 (18) | −6.8 (8.7) / P < 0.001 (after 48 months) | |
| Placebo (DBP ≥ 90 mm Hg) [PD]e | 115 (18 | 108 (18) | 108 (19) | 111 (20) | −6.9 (7.6) (after 12 months)f −3.8 (7.8) (after 48 months) | |
| Placebo (SBP ≥ 140 mm Hg) [PS]e | 116 (18) | 109 (18) | 110 (19) | 113 (19) | −3.2 (7.4) (after 48 months) | |
| Phentermine/topiramate vs placebo | ||||||
| CONQUER 2013 | Phen/Top [LD] | 104 (18)g | nr | nr | na | −8.2% (95% CI 7.3; 9.0) / P < 0.0001 (after 13 months) |
| Phen/Top [HD] | nr | nr | na | −10.1% (95% CI 9.5; 10.7) / P < 0.0001 (after 13 months) | ||
| Placebo | nr | nr | na | −1.9% (95% CI 1.3; 2.6) (after 13 months) | ||
| Naltrexone/bupropion vs placebo | ||||||
| Nissen 2016 | Nal/Bup | 106 (19.09) | nr | nr | nr | −1.9 (4.26) / P < 0.001 (after 28 months) |
| Placebo | 106.6 (19.17) | nr | nr | nr | −0.0 (3.50) (after 13 months) | |
| aMean kg (SD), unless otherwise indicated. CI: confidence interval; DBP: diastolic blood pressure; mo: months; na: not applicable; nr: not reported; [OD]: orlistat and diastolic blood pressure ≥ 90 mm Hg; [OS]: orlistat and systolic blood pressure ≥ 140 mm Hg; Phen/Top [HD]: phentermine/topiramate high dose (15 mg/92 mg); Phen/Top [LD]: phentermine/topiramate low dose (7.5 mg/46 mg); [PD]: placebo and diastolic blood pressure ≥ 90 mm Hg; [PS]: placebo and systolic blood pressure ≥ 140 mm Hg; SBD: systolic blood pressure; SD: standard deviation. | ||||||
| Study | Intervention(s) and comparator(s) | Baselinea | 6 moa | 12 moa | 48 moa | Change from baseline to endpointa |
|---|---|---|---|---|---|---|
| Orlistat vs placebo | ||||||
| Orlistat | 154 (13) | nr | nr | na | −13.3 (15.2) / ns (after 12 months) | |
| Placebo | 151 (13) | nr | nr | na | −11.0 (15.0) (after 12 months) | |
| Orlistat | 145.8 (9.8) | 141.5 (12.5) | na | na | −4.3 / P = 0.025 (after 6 months) | |
| Placebo | 142.1 (6.2) | 141.2 (8.8) | na | na | −0.9 (after 6 months) | |
| Orlistat | 150.0 (0.8)c | nr | na | na | −9.8 (1) / ns (after 6 months) | |
| Placebo | 152.2 (0.9)c | nr | na | na | −9.8 (1) (after 6 months) | |
| Orlistat (DBP ≥ 90 mm Hg) [OD]d | 146 (13) | 135 (14) | 135 (14) | 137 (15) | −11.2 (13.5) / P = nr (after 12 months)e −8.8 (14.8) / P = 0.024 (after 48 months) | |
| Orlistat (SBP ≥ 140mm Hg) [OS]d | 149 (10) | 125 (14) | 135 (14) | 138 (15) | −11.5 (14.9) / P < 0.002 (after 48 months) | |
| Placebo (DBP ≥ 90 mm Hg) [PD]d | 146 (12) | 136 (15) | 138 (16) | 139 (16) | −7.7 (13.8) (after 12 months)e −6.4 (15.1) (after 48 months) | |
| Placebo (SBP ≥ 140 mm Hg) [PS]d | 149 (8) | 138 (14) | 140 (14) | 140 (15) | −8.6 (14.3) (after 48 months) | |
| Phentermine/topiramate vs placebo | ||||||
| Phen/Top [LD] | 134.3 (nr) | nr | nr | na | −6.9 (95% CI 5.3; 8.5) / P = 0.0475 (after 13 months) | |
| Phen/Top [HD] | 133.1 (nr) | nr | nr | na | −9.1 (95% CI 7.9; 10.3) / P < 0.001 (after 13 months) | |
| Placebo | 135.2 (nr) | nr | nr | na | −4.9 (95% CI 3.7; 6.1) (after 13 months) | |
| Naltrexone/bupropion vs placebo | ||||||
| Nal/Bup | 126.1 (12.55) | nr | nr | nr | −2.2 (14.45) / P = 0.706 (after 28 months) | |
| Placebo | 125.7 (12.62) | nr | nr | nr | −2.2 (13.51) (after 28 months) | |
| aMean mm Hg (SD), unless otherwise indicated. DBP: diastolic blood pressure; mo: months; na: not applicable; nr: not reported; [OD]: orlistat and diastolic blood pressure ≥ 90 mm Hg; [OS]: orlistat and systolic blood pressure ≥ 140 mm Hg; Phen/Top [HD]: phentermine/topiramate high dose (15 mg/92 mg); Phen/Top [LD]: phentermine/topiramate low dose (7.5 mg/46 mg); [PD]: placebo and diastolic blood pressure ≥ 90 mm Hg; [PS]: placebo and systolic blood pressure ≥ 140 mm Hg; SBD: systolic blood pressure; SD: standard deviation. | ||||||
| Study | Intervention(s) and comparator(s) | Baselinea | 6 moa | 12 moa | 48 moa | Change from baseline to endpointa |
|---|---|---|---|---|---|---|
| Orlistat vs placebo | ||||||
| Orlistat | 98.4 (3.7) | nr | nr | na | −11.4 (8.3) / P = 0.002 (after 12 months) | |
| Placebo | 98.3 (3.5)c | nr | nr | na | −9.2 (8.4) (after 12 months) | |
| Orlistat | 87.8 (7.3) | 84.2 (8.6) | na | na | −3.6 / P = 0.012 (after 6 months) | |
| Placebo | 85.3 (5.6) | 84.5 (7.3) | na | na | −0.8 (after 6 months) | |
| Orlistat | 96.9 (0.3)d | nr | na | na | −7.5 (0.6) / ns (after 6 months) | |
| Placebo | 97.0 (0.3)d | nr | na | na | −7.3 (0.6) (after 6 months) | |
| Orlistat (DBP ≥ 90 mm Hg) [OD]e | 95 (6) | 86 (8) | 86 (8) | 87 (9) | −9.1 (7.9) / P = nr (after 12 months)f −8.1 (9.3) / P < 0.006 (after 48 months) | |
| Orlistat (SBP ≥ 140mm Hg) [OS]e | 91 (9) | 84 (9) | 85 (9) | 86 (9) | −5.0 (9.9) / P < 0.001 (after 48 months) | |
| Placebo (DBP ≥ 90 mm Hg) [PD]e | 95 (5) | 88 (9) | 88 (10) | 89 (10) | −6.7 (9.6) (after 12 months)f −6.2 (9.9) (after 48 months) | |
| Placebo (SBP ≥ 140 mm Hg) [PS]e | 91 (8) | 87 (9) | 88 (10) | 88 (10) | −3.0 (10.4) (after 48 months) | |
| Phentermine/topiramate vs placebo | ||||||
| Phen/Top [LD] | 83.4 (nr) | nr | nr | na | −5.2 (95% CI 4.1; 6.3) / P = 0.04 (after 13 months) | |
| Phen/Top [HD] | 83.2 (nr) | nr | nr | na | −5.8 (95% CI 5.1; 6.5) / P = 0.0003 (after 13 months) | |
| Placebo | 84.5 (nr) | nr | nr | na | −3.9 (95% CI 3.2; 4.6) (after 13 months) | |
| Naltrexone/bupropion vs placebo | ||||||
| Nal/Bup | 74.5 (9.01) | nr | nr | na | 1.4 (9.05) / P = 0.326 (after 28 months) | |
| Placebo | 74.4 (9.14) | nr | nr | na | 1.1 (8.50) (after 28 months) | |
| aMean mm Hg (SD), unless otherwise indicated. DBP: diastolic blood pressure; mo: months; na: not applicable; nr: not reported; [OD]: orlistat and diastolic blood pressure ≥ 90 mm Hg; [OS]: orlistat and systolic blood pressure ≥ 140 mm Hg; Phen/Top [HD]: phentermine/topiramate high dose (15 mg/92 mg); Phen/Top [LD]: phentermine/topiramate low dose (7.5 mg/46 mg); [PD]: placebo and diastolic blood pressure ≥ 90 mm Hg; [PS]: placebo and systolic blood pressure ≥ 140 mm Hg; SBD: systolic blood pressure; SD: standard deviation. | ||||||
| Outcome or subgroup title | No. of studies | No. of participants | Statistical method | Effect size |
| 1.1 Serious adverse events Show forest plot | 3 | 1476 | Risk Ratio (M‐H, Fixed, 95% CI) | 1.45 [1.10, 1.91] |
| 1.2 All adverse events Show forest plot | 2 | 1386 | Risk Ratio (M‐H, Random, 95% CI) | 1.13 [0.84, 1.54] |
| 1.3 Change in body weight from baseline to endpoint (6 to 12 months follow‐up) Show forest plot | 4 | 2080 | Mean Difference (IV, Random, 95% CI) | ‐3.74 [‐4.70, ‐2.78] |
| 1.4 Change in systolic blood pressure from baseline to endpoint (6 to 12 months follow‐up) Show forest plot | 4 | 2058 | Mean Difference (IV, Fixed, 95% CI) | ‐2.58 [‐3.78, ‐1.37] |
| 1.5 Change in diastolic blood pressure from baseline to endpoint (6 to 12 months follow‐up) Show forest plot | 4 | 2058 | Mean Difference (IV, Fixed, 95% CI) | ‐1.97 [‐2.72, ‐1.22] |
| Outcome or subgroup title | No. of studies | No. of participants | Statistical method | Effect size |
| 2.1 All adverse events Show forest plot | 1 | 1305 | Risk Ratio (M‐H, Fixed, 95% CI) | 1.13 [1.08, 1.20] |
| 2.2 Serious adverse events Show forest plot | 1 | 1305 | Risk Ratio (M‐H, Fixed, 95% CI) | 0.85 [0.49, 1.48] |
| 2.3 Change in body weight from baseline to endpoint: Phen/Top low dose (13 months follow‐up) Show forest plot | 1 | 772 | Mean Difference (IV, Fixed, 95% CI) | ‐6.30 [‐7.37, ‐5.23] |
| 2.4 Change in body weight from baseline to endpoint: Phen/Top high dose (13 months follow‐up) Show forest plot | 1 | 1030 | Mean Difference (IV, Fixed, 95% CI) | ‐8.20 [‐9.09, ‐7.31] |
| 2.5 Change in systolic blood pressure from baseline to endpoint: Phen/Top low dose (13 months follow‐up) Show forest plot | 1 | 772 | Mean Difference (IV, Fixed, 95% CI) | ‐2.00 [‐3.97, ‐0.03] |
| 2.6 Change in systolic blood pressure from baseline to endpoint: Phen/Top high dose (13 months follow‐up) Show forest plot | 1 | 1030 | Mean Difference (IV, Fixed, 95% CI) | ‐4.20 [‐5.85, ‐2.55] |
| 2.7 Change in diastolic blood pressure from baseline to endpoint: Phen/Top low dose (13 months follow‐up) Show forest plot | 1 | 772 | Mean Difference (IV, Random, 95% CI) | ‐1.30 [‐2.60, 0.00] |
| 2.8 Change in diastolic blood pressure from baseline to endpoint: Phen/Top high dose (13 months follow‐up) Show forest plot | 1 | 1030 | Mean Difference (IV, Fixed, 95% CI) | ‐1.90 [‐2.88, ‐0.92] |
| Outcome or subgroup title | No. of studies | No. of participants | Statistical method | Effect size |
| 3.1 Total mortality Show forest plot | 1 | 8283 | Risk Ratio (M‐H, Fixed, 95% CI) | 0.99 [0.70, 1.40] |
| 3.2 Cardiovascular morbidity Show forest plot | 1 | 8283 | Risk Ratio (M‐H, Fixed, 95% CI) | 1.11 [0.87, 1.41] |
| 3.3 All adverse events Show forest plot | 1 | 8283 | Risk Ratio (M‐H, Fixed, 95% CI) | 1.69 [1.58, 1.80] |
| 3.4 Serious adverse events Show forest plot | 1 | 8283 | Risk Ratio (M‐H, Fixed, 95% CI) | 1.05 [0.96, 1.14] |
| 3.5 Change in body weight from baseline to endpoint (28 months follow‐up) Show forest plot | 1 | 8283 | Mean Difference (IV, Fixed, 95% CI) | ‐1.90 [‐2.07, ‐1.73] |
| 3.6 Change in systolic blood pressure from baseline to endpoint (28 months follow‐up) Show forest plot | 1 | 8283 | Mean Difference (IV, Fixed, 95% CI) | 0.00 [‐0.60, 0.60] |
| 3.7 Change in diastolic blood pressure from baseline to endpoint (28 months follow‐up) Show forest plot | 1 | 8283 | Mean Difference (IV, Fixed, 95% CI) | 0.30 [‐0.08, 0.68] |