Kesan jangka panjang ubat penurun berat badan dalam kalangan orang dengan hipertensi
Información
- DOI:
- https://doi.org/10.1002/14651858.CD007654.pub5Copiar DOI

- Base de datos:
-
- Cochrane Database of Systematic Reviews
- Versión publicada:
-
- 17 enero 2021see what's new
- Tipo:
-
- Intervention
- Etapa:
-
- Review
- Grupo Editorial Cochrane:
-
Grupo Cochrane de Hipertensión
- Copyright:
-
- Copyright © 2021 The Cochrane Collaboration. Published by John Wiley & Sons, Ltd.
Cifras del artículo
Altmetric:
Citado por:
Autores
Contributions of authors
Andrea Siebenhofer: protocol development, quality assessment of trials, data extraction, development of final review and review update, corresponding author.
Klaus Jeitler: protocol development, searching for trials, quality assessment of trials, data extraction, development of review update.
Karl Horvath: protocol development, quality assessment of trials, data extraction, development of final review and review update.
Andrea Berghold: statistical analysis, development of final review and review update.
Sebastian Winterholer: selection of studies, quality assessment of trials, data extraction, development of review update.
Cornelia Krenn: selection of studies, quality assessment of trials, data extraction, development of review update.
Thomas Semlitsch: searching for trials, selection of studies, quality assessment of trials, data extraction, development of review update.
Sources of support
Internal sources
-
Medical University of Graz, Austria
Salary, office space, computer support, library resources
External sources
-
No sources of support supplied
Declarations of interest
Andrea Siebenhofer, Klaus Jeitler, and Karl Horvath were involved in the preparation of a report on the evaluation of the benefits and harms of non‐drug treatment strategies in people with essential hypertension: weight reduction for the Institute for Quality and Efficiency in Health Care (iqwig.de/).
Andrea Berghold: none known.
Sebastian Winterholer: none known.
Cornelia Krenn: none known.
Thomas Semlitsch: none known.
Acknowledgements
We would like to thank Douglas Salzwedel for helping to update the literature search, Phillip Elliott for the final editing of the manuscript, Ulrich Siering for assisting in the development of the original review, and Nicole Posch and Jutta Meschik for assisting in the development of the previous update of the review. We also thank Prof. Le Roux, Dr. Kolotkin, Dr. Finkelstein, Dr. Fidler, Dr. Wadden, Dr. Greenway, Mr. Quesenberry and Mr. Gould from Currax Pharmaceuticals, and Mrs. Olsen from Novo Nordisk Pharmaceuticals for replying to our information requests, and Dr. Cocco, Dr. Nissen and Mrs. Wolski for providing additional data with relevance to our review.
Version history
| Published | Title | Stage | Authors | Version |
| 2021 Jan 17 | Long‐term effects of weight‐reducing drugs in people with hypertension | Review | Andrea Siebenhofer, Sebastian Winterholer, Klaus Jeitler, Karl Horvath, Andrea Berghold, Cornelia Krenn, Thomas Semlitsch | |
| 2016 Mar 02 | Long‐term effects of weight‐reducing drugs in people with hypertension | Review | Andrea Siebenhofer, Klaus Jeitler, Karl Horvath, Andrea Berghold, Nicole Posch, Jutta Meschik, Thomas Semlitsch | |
| 2013 Mar 28 | Long‐term effects of weight‐reducing drugs in hypertensive patients | Review | Andrea Siebenhofer, Klaus Jeitler, Karl Horvath, Andrea Berghold, Ulrich Siering, Thomas Semlitsch | |
| 2009 Jul 08 | Long‐term effects of weight‐reducing drugs in hypertensive patients | Review | Andrea Siebenhofer, Karl Horvath, Klaus Jeitler, Andrea Berghold, Anne K Stich, Eva Matyas, Nicole Pignitter, Ulrich Siering | |
| 2009 Jan 21 | Long‐term effects of weight‐reducing drugs in hypertensive patients | Protocol | Andrea Siebenhofer, Karl Horvath, Klaus Jeitler, Andrea Berghold, Anne K Stich, Eva Matyas, Nicole Pignitter, Ulrich Siering | |
Differences between protocol and review
Two review authors (Anne Stich and Eva Matyas) did not contribute to the 2013 update of this review and were removed from the list of authors.
Thomas Semlitsch joined the team of review authors for the 2013 version of this review and provided substantive intellectual contributions that justify his inclusion as author.
Ulrich Siering did not contribute to the 2015 update of this review and was removed from the list of authors.
Jutta Meschik joined the team of review authors for the 2015 version of this review and provided substantive intellectual contributions that justify her inclusion as author.
Nicole Posch and Jutta Meschik did not contribute to the 2020 update of this review and were removed from the list of authors.
Sebastian Winterholer and Cornelia Krenn joined the team of review authors for the 2020 version of this review and provided substantive intellectual contributions that justify their inclusion as authors.
Since current guidelines for the pharmacological management of obesity quote four additional medications (liraglutide, lorcaserin, phentermine/topiramate, or naltrexone/bupropion) for long‐term weight reduction, we extended the search to include these drugs in the 2015 version of this review.
Since the market approvals of rimonabant and sibutramine have been withdrawn since 2009 and 2010, respectively, these two drugs were no longer considered as relevant for long‐term weight management and were therefore excluded from the 2020 version of this review.
Keywords
MeSH
Medical Subject Headings (MeSH) Keywords
- Anti-Obesity Agents [*adverse effects, therapeutic use];
- Appetite Depressants [*adverse effects, therapeutic use];
- Bias;
- Blood Pressure [drug effects];
- Body Weight [drug effects];
- Bupropion [adverse effects, therapeutic use];
- Diet, Reducing;
- Drug Combinations;
- Fructose [adverse effects, analogs & derivatives, therapeutic use];
- Hypertension [*drug therapy, mortality];
- Lactones [adverse effects, therapeutic use];
- Naltrexone [adverse effects, therapeutic use];
- Orlistat [adverse effects, therapeutic use];
- Phentermine [adverse effects, therapeutic use];
- Piperidines [adverse effects, therapeutic use];
- Pyrazoles [adverse effects, therapeutic use];
- Randomized Controlled Trials as Topic;
- Safety-Based Drug Withdrawals;
- Time;
- Topiramate [adverse effects, therapeutic use];
Medical Subject Headings Check Words
Adult; Female; Humans; Male; Middle Aged;
PICO
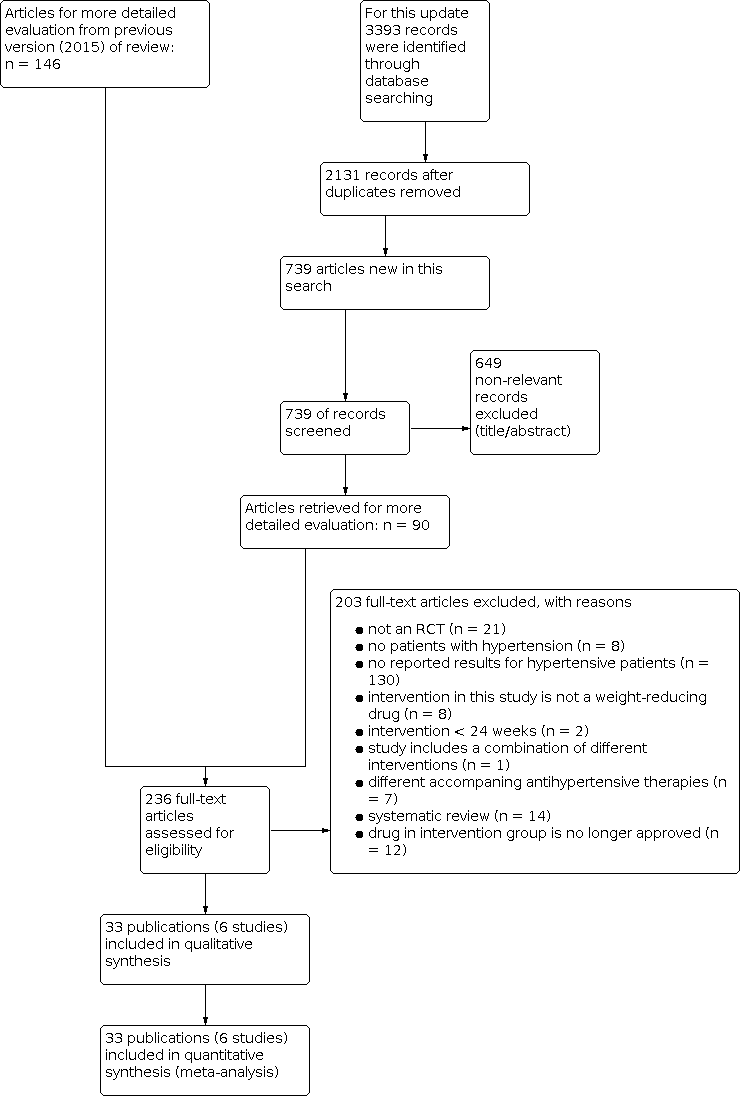
Study flow diagram.

Risk of bias graph: review authors' judgements about each risk of bias item presented as percentages across all included studies.

Risk of bias summary: review authors' judgements about each risk of bias item for each included study.
![Forest plot of comparison: 1 Orlistat versus placebo, outcome: 1.3 Change in body weight from baseline to endpoint (6 to 12 months follow‐up) [kg].](/es/cdsr/doi/10.1002/14651858.CD007654.pub5/media/CDSR/CD007654/image_n/nCD007654-FIG-04.svg)
Forest plot of comparison: 1 Orlistat versus placebo, outcome: 1.3 Change in body weight from baseline to endpoint (6 to 12 months follow‐up) [kg].
![Forest plot of comparison: 1 Orlistat versus placebo, outcome: 1.4 Change in systolic blood pressure from baseline to endpoint (6 to 12 months follow‐up) [mm Hg].](/es/cdsr/doi/10.1002/14651858.CD007654.pub5/media/CDSR/CD007654/image_n/nCD007654-FIG-05.svg)
Forest plot of comparison: 1 Orlistat versus placebo, outcome: 1.4 Change in systolic blood pressure from baseline to endpoint (6 to 12 months follow‐up) [mm Hg].
![Forest plot of comparison: 1 Orlistat versus placebo, outcome: 1.5 Change in diastolic blood pressure from baseline to endpoint (6 to 12 months follow‐up) [mm Hg].](/es/cdsr/doi/10.1002/14651858.CD007654.pub5/media/CDSR/CD007654/image_n/nCD007654-FIG-06.svg)
Forest plot of comparison: 1 Orlistat versus placebo, outcome: 1.5 Change in diastolic blood pressure from baseline to endpoint (6 to 12 months follow‐up) [mm Hg].

Comparison 1: Orlistat versus placebo, Outcome 1: Serious adverse events

Comparison 1: Orlistat versus placebo, Outcome 2: All adverse events

Comparison 1: Orlistat versus placebo, Outcome 3: Change in body weight from baseline to endpoint (6 to 12 months follow‐up)

Comparison 1: Orlistat versus placebo, Outcome 4: Change in systolic blood pressure from baseline to endpoint (6 to 12 months follow‐up)

Comparison 1: Orlistat versus placebo, Outcome 5: Change in diastolic blood pressure from baseline to endpoint (6 to 12 months follow‐up)

Comparison 2: Phentermine/topiramate versus placebo, Outcome 1: All adverse events

Comparison 2: Phentermine/topiramate versus placebo, Outcome 2: Serious adverse events

Comparison 2: Phentermine/topiramate versus placebo, Outcome 3: Change in body weight from baseline to endpoint: Phen/Top low dose (13 months follow‐up)

Comparison 2: Phentermine/topiramate versus placebo, Outcome 4: Change in body weight from baseline to endpoint: Phen/Top high dose (13 months follow‐up)

Comparison 2: Phentermine/topiramate versus placebo, Outcome 5: Change in systolic blood pressure from baseline to endpoint: Phen/Top low dose (13 months follow‐up)

Comparison 2: Phentermine/topiramate versus placebo, Outcome 6: Change in systolic blood pressure from baseline to endpoint: Phen/Top high dose (13 months follow‐up)

Comparison 2: Phentermine/topiramate versus placebo, Outcome 7: Change in diastolic blood pressure from baseline to endpoint: Phen/Top low dose (13 months follow‐up)

Comparison 2: Phentermine/topiramate versus placebo, Outcome 8: Change in diastolic blood pressure from baseline to endpoint: Phen/Top high dose (13 months follow‐up)

Comparison 3: Naltrexone/bupropion versus placebo, Outcome 1: Total mortality

Comparison 3: Naltrexone/bupropion versus placebo, Outcome 2: Cardiovascular morbidity

Comparison 3: Naltrexone/bupropion versus placebo, Outcome 3: All adverse events

Comparison 3: Naltrexone/bupropion versus placebo, Outcome 4: Serious adverse events

Comparison 3: Naltrexone/bupropion versus placebo, Outcome 5: Change in body weight from baseline to endpoint (28 months follow‐up)

Comparison 3: Naltrexone/bupropion versus placebo, Outcome 6: Change in systolic blood pressure from baseline to endpoint (28 months follow‐up)

Comparison 3: Naltrexone/bupropion versus placebo, Outcome 7: Change in diastolic blood pressure from baseline to endpoint (28 months follow‐up)
| Orlistat compared with placebo for weight reduction | ||||||
| Patient or population: Men and non‐pregnant women ≥ 18 years old with essential hypertension Intervention: Orlistat Comparison: Placebo | ||||||
| Outcomes | Anticipated absolute effects (95% CI) | Relative effect | No of Participants | Quality of the evidence | Comments | |
|---|---|---|---|---|---|---|
| Risk with placebo | Risk with orlistat | |||||
| Total mortality Follow‐up: 24 ‐ 208 weeks | 2 deaths (OD subgroup) and 1 death (OS subgroup) with orlistat, and no deaths with placebo in 1 trial; no deaths with orlistat or placebo in 2 other trials | ‐ | 1488 (3 studies) | ⊕⊕⊝⊝ | Very low event rate. | |
| Cardiovascular morbidity Follow‐up: 24 weeks | see comment | ‐ | 1811 (3 studies) | ⊕⊝⊝⊝ very lowb | Reporting of results too diverse to allow a meta‐analysis and small number of events. The effects of orlistat compared with placebo for this outcome are uncertain. | |
| Serious adverse events Follow‐up: 24 ‐ 208 weeks | 101 per 1000 | 146 per 1000 (111 to 192) | RR 1.45 (1.10 to 1.91) | 1476 (3 studies) | ⊕⊕⊕⊝ | ‐ |
| All adverse events Follow‐up: 24‐208 weeks | 865 per 1000 | 977 per 1000 (727 to 1000) | RR 1.13 (0.84 to 1.54) | 1386 (2 studies) | ⊕⊝⊝⊝ | 98% heterogeneity |
| Change in systolic blood pressure compared to placebo (mm Hg) from baseline to end of study Follow‐up: 24 ‐ 52 weeks | Reduction of systolic blood pressure ranged across control groups from 0.9 to 11.0 mm Hg | MD 2.58 mm Hg lower (3.78 lower to 1.37 lower) | ‐ | 2058 | ⊕⊕⊕⊝ | ‐ |
| Change in diastolic blood pressure compared to placebo (mm Hg) from baseline to end of study Follow‐up: 24 ‐ 52 weeks | Reduction of diastolic blood pressure ranged across control groups from 0.8 to 9.2 mm Hg | MD 1.97 mm Hg lower (2.72 lower to 1.22 lower) | ‐ | 2058 | ⊕⊕⊕⊝ | ‐ |
| Change in body weight compared to placebo (kg) from baseline to end of study Follow‐up: 24 ‐ 52 weeks | Reduction of body weight ranged across control groups from 1.8 to 6.93 kg | MD 3.74 kg lower (4.70 lower to 2.78 lower) | ‐ | 2080 | ⊕⊕⊝⊝ | ‐ |
| CI: confidence interval; MD: mean difference; OD: orlistat and diastolic blood pressure ≥ 90 mm Hg; OS: orlistat and systolic blood pressure ≥ 140 mm Hg; RR: risk ratio | ||||||
| GRADE Working Group grades of evidence | ||||||
| aDowngraded by two levels because of serious imprecision (small number of trials, very low event rates) ‐ see Appendix 1. | ||||||
| Phentermine/topiramate compared with placebo for weight reduction | ||||||
| Patient or population: Men and non‐pregnant women ≥ 18 years old with essential hypertension Intervention: Phentermine/topiramate Comparison: Placebo | ||||||
| Outcomes | Anticipated absolute effects (95% CI) | Relative effect | No of Participants | Quality of the evidence | Comments | |
|---|---|---|---|---|---|---|
| Risk with placebo | Risk with phentermine/topiramate | |||||
| Total mortality Follow‐up: 56 weeks | see comment | ‐ | 1305 (1 study) | ⊕⊕⊝⊝ | No death occurred in the hypertensive subgroup of the only included RCT. | |
| Cardiovascular morbidity Follow‐up: 56 weeks | see comment | ‐ | 1305 (1 study) | ⊕⊝⊝⊝ very lowb | 2.3% of the hypertensive participants in the low‐dose phen/top group, 3.7% in the high‐dose phen/top group, and 1.7% in the placebo group experienced treatment‐emergent cardiovascular adverse events. | |
| Serious adverse events Follow‐up: 56 weeks | 42 per 1000 | 36 per 1000 (21 to 62) | RR 0.85 (0.49 to 1.48) | 1305 (1 study) | ⊕⊕⊝⊝ | ‐ |
| All adverse events Follow‐up: 56 weeks | 773 per 1000 | 873 per 1000 (835 to 927) | RR 1.13 (1.08 to 1.20) | 1305 (1 study) | ⊕⊕⊝⊝ | ‐ |
| Change in systolic blood pressure compared to placebo (mm Hg) from baseline to end of study Follow‐up: 56 weeks | Reduction of systolic blood pressure was −4.9 mm Hg | Low dose: MD 2.0 mm Hg lower (3.97 lower to 0.03 lower) | ‐ | 772 (1 study) | ⊕⊕⊝⊝ | ‐ |
| High dose: MD 4.2 mm Hg lower (5.85 lower to 2.55 lower) | ‐ | 1030 (1 study) | ⊕⊕⊝⊝ | ‐ | ||
| Change in diastolic blood pressure compared to placebo (mm Hg) from baseline to end of study Follow‐up: 56 weeks | Reduction of diastolic blood pressure was −4.9 mm Hg | Low dose: MD 1.3 mm Hg lower (2.6 lower to 0.0 lower) | ‐ | 772 (1 study) | ⊕⊕⊝⊝ | ‐ |
| High dose: MD 1.9 mm Hg lower (2.88 lower to 0.92 lower) | ‐ | 1030 (1 study) | ⊕⊕⊝⊝ | ‐ | ||
| Change in body weight as compared to placebo (%) from baseline to end of study Follow‐up: 56 weeks | Reduction of body weight was −1.9 % | Low dose: MD 6.3 % lower (7.37 lower to 5.23 lower) | ‐ | 772 (1 study) | ⊕⊕⊝⊝ | Percentage change from initial body weight. |
| High dose: MD 8.2 % lower (9.09 lower to 7.31 lower) | ‐ | 1030 (1 study) | ⊕⊕⊝⊝ | Percentage change from initial body weight. | ||
| CI: confidence interval; MD: mean difference; RR: risk ratio | ||||||
| GRADE Working Group grades of evidence | ||||||
| aDowngraded by two levels because of serious imprecision (single study) ‐ see Appendix 2. | ||||||
| Naltrexone/bupropion compared with placebo for weight reduction | ||||||
| Patient or population: Men and non‐pregnant women ≥ 18 years old with essential hypertension Intervention: Naltrexone/bupropion Comparison: Placebo | ||||||
| Outcomes | Anticipated absolute effects (95% CI) | Relative effect | No of Participants | Quality of the evidence | Comments | |
|---|---|---|---|---|---|---|
| Risk with placebo | Risk with naltrexone/bupropion | |||||
| Total mortality Follow‐up: 121 weeks | 15 per 1000 | 15 per 1000 (11 to 21) | RR 0.99 (0.70 to 1.40) | 8283 (1 study) | ⊕⊕⊕⊝ | ‐ |
| Cardiovascular morbidity Follow‐up: 121 weeks | 29 per 1000 | 32 per 1000 (25 to 40) | RR 1.11 (0.87 to 1.41) | 8283 (1 study) | ⊕⊕⊝⊝ | MI, stroke + hospitalisation for unstable angina. |
| Serious adverse events Follow‐up: 121 weeks | 205 per 1000 | 215 per 1000 (196 to 233) | RR 1.05 (0.96 to 1.14) | 8283 (1 study) | ⊕⊕⊕⊝ | ‐ |
| All adverse events Follow‐up: 121 weeks | 256 per 1000 | 432 per 1000 (404 to 460) | RR 1.69 (1.58 to 1.80) | 8283 (1 study) | ⊕⊕⊕⊝ | ‐ |
| Change in systolic blood pressure as compared to placebo (mm Hg) from baseline to end of study Follow‐up: 56 weeks | Increase of systolic blood pressure was 2.2 mm Hg | MD 0.0 mm Hg higher (0.6 lower to 0.6 higher) | ‐ | 8283 (1 study) | ⊕⊕⊕⊕⊝ | ‐ |
| Change in diastolic blood pressure as compared to placebo (mm Hg) from baseline to end of study Follow‐up: 121 weeks | Increase of diastolic blood pressure was 1.1 mm Hg | MD 0.3 mm Hg higher (0.08 lower to 0.68 higher) | ‐ | 8283 (1 study) | ⊕⊕⊕⊝ | ‐ |
| Change in body weight as compared to placebo (kg) from baseline to end of study Follow‐up: 121 weeks | Reduction of body weight was 0.0 kg | MD 1.9 kg lower (2.07 lower to 1.73 lower) | ‐ | 8283 (1 study) | ⊕⊕⊕⊝ | ‐ |
| CI: confidence interval; MD: mean difference; RR: risk ratio | ||||||
| GRADE Working Group grades of evidence | ||||||
| aDowngraded by one level because of imprecision (single study). | ||||||
| Study | Intervention(s) and comparator(s) | Description of power and sample size calculation | Randomised | Safety (N) | ITT | Finishing trial | Randomised finishing trial | Follow‐up | |
|---|---|---|---|---|---|---|---|---|---|
| Orlistat vs placebo | |||||||||
| Orlistat | The sample size determination for the present trial was based on a 2‐sample t‐test (2‐tailed). Since there were 2 primary efficacy parameters in this trial, body weight reduction and sitting diastolic BP reduction, Holm’s sequential rejection procedure was used to project the overall type I error rate 0.05, and α = 0.025 was chosen for the calculation of sample size for each parameter. A mean body weight change of 2.1 kg and a within‐group standard deviation of 6.1 kg would require 161 participants per group to provide a power of 0.8 at α = 0.025. A mean change of 3.0 mm Hg in sitting diastolic BP with a within‐group standard deviation of 8.5 mm Hg would require 153 participants per group to provide power of 0.8 with α = 0.025. Based on these calculations, and assuming a dropout rate of 35%, 496 participants (248 participants per group) had to be enrolled to ensure an adequate statistical power of at least 80% in either of the 2 primary efficacy parameters. | 278 | nr | 267 | 162 | 58 | 24 weeks | ||
| Placebo | 276 | nr | 265 | 108 | 36 | ||||
| Orlistat | nr | 45 | 45 | 45 | 45 | 100 | 24 weeks | ||
| Placebo | 45 | 45 | 45 | 45 | 100 | ||||
| Orlistat | Power calculations indicated that, with a power of 80% at the 0.05 significance level, 408 participants were needed to detect a 2.5 mm Hg difference in diastolic BP, 152 participants were needed to detect a 0.05% difference in HbA1c. 140 participants were needed to detect a 0.35 mmol/l difference in LDL‐cholesterol. | 499 (HT: 304) | nr | 499 (HT: 304) | 458 (HT: nr) | 91.6% (HT: nr) | 24 weeks | ||
| Placebo | 505 (HT: 310) | nr | 505 (HT: 310) | 458 (HT: nr) | 90.7% (HT: nr) | ||||
| Orlistat (DBP ≥ 90 mm Hg) [OD] | A 2‐sided log‐rank test would require a minimum of ~ 95 primary cases of type 2 diabetes in both study groups combined to have 90% power of detecting a significant outcome at α = 0.05. With this event‐based design, 3305 participants were randomised and followed until sufficient events occurred. As a consequence of the design, study power would be unaffected by dropout rate. | 1650 | (HT: 408) | nr | 1640 (HT: nr) | (HT: 386) | 94.6 | 208 weeks | |
| Orlistat (SBP ≥ 140mm Hg) [OS] | (HT: 516) | nr | (HT: 491) | 95.2 | |||||
| Placebo (DBP ≥ 90 mm Hg) [PD] | 1655 | (HT: 441) | nr | 1637 (HT: nr) | (HT: 421) | 95.5 | |||
| Placebo (SBP ≥ 140 mm Hg) [PS] | (HT: 509) | nr | (HT: 487) | 95.7 | |||||
| Phentermine/topiramate vs placebo | |||||||||
| Phen/Top [LD] | Power analysis based on data from a previous study suggested that 250 participants in each group would provide > 95% power to detect a difference of 4.4% in weight loss between placebo and active treatments at a significance level of 0.05. To enhance the power for detecting differences in safety outcomes, we planned to enrol about 2500 participants. | 498 (HT: 261) | 398 (HT: 261) | 488 (HT: 261) | 374 (HT: 256) | 75.1 (HT: 98.1) | 56 weeks | ||
| Phen/Top [HD] | 995 (HT: 520) | 994 (HT: 520) | 981 (HT: 520) | 733 (HT: 514) | 73.7 (HT: 98.8) | ||||
| Placebo | 994 (HT: 524) | 993 (HT: 524) | 976 (HT: 524) | 616 (HT: 516) | 61.9 (HT: 98.5) | ||||
| Naltrexone/bupropion vs placebo | |||||||||
| Nal/Bup | The trial was designed to provide 90% power to rule out the 1.4 margin (i.e. the upper limit of the confidence interval would not exceed 1.4) when the true HR is 1.0, which required 378 primary events. The early pre‐approval analysis to rule out the 2.0 margin required 87 primary events to provide 90% power when the true HR is 1.0. In both settings, a 1‐sided type I error (α) of 2.5% was used. To obtain sample sizes, an annualised rate of primary events of 1.5% in the placebo group was assumed. The recruitment was assumed to take 1.5 years, with maximum participant follow‐up of 4 years. It was assumed that 7% of the study population would discontinue during the lead‐in period, with a loss–to–follow‐up rate of 1.2% annually. | 4456 (HT: 4164) | 4455 (HT: 4164) | 4455 (HT: 4164) | 705 (HT: nr) | 15.8% (HT: nr) | 121 weeks | ||
| Placebo | 4454 (HT: 4123) | 4450 (HT: 4119) | 4450 (HT: 4119) | 275 (HT: nr) | 6.2% (HT: nr) | ||||
| DBD: diastolic blood pressure; HR: hazard ratio; HT: hypertensive subgroup; ITT: intention‐to‐treat; nr: not reported; [OD]: orlistat and diastolic blood pressure ≥ 90 mm Hg; [OS]: orlistat and systolic blood pressure ≥ 140 mm Hg; Phen/Top [HD]: phentermine/topiramate high dose (15 mg/92 mg); Phen/Top [LD]: phentermine/topiramate low dose (7.5 mg/46 mg); [PD]: placebo and diastolic blood pressure ≥ 90 mm Hg; [PS]: placebo and systolic blood pressure ≥ 140 mm Hg; SBD: systolic blood pressure. | |||||||||
| Study | Intervention(s) and comparator(s) | Description of participants | Nationality | Setting | Ethnic groups (%) | Duration of disease (mean years (SD)) | Antihypertensive treatment (%) |
|---|---|---|---|---|---|---|---|
| Orlistat vs placebo | |||||||
| Orlistat | Obese individuals with insufficiently controlled hypertension | USA | Outpatient clinic | White (85) African American (11) Hispanic (4) Other (0) | nr | Antihypertensive‐treatment at trial onset: 95% ACE‐inhibitor (27) Ca‐antagonists (29) β‐blocker (27) Diuretic (19) AT‐II‐receptor antagonists (6) α‐blocker (10) Other (11), | |
| Placebo | White (86) African American (12) Hispanic (1) Other (1) | nr | antihypertensive‐treatment at trial onset: 94% ACE‐inhibitor (35) Ca‐antagonist (30) β‐blocker (26) Diuretic (14) AT‐II‐receptor antagonists (10) α‐blocker (8) Other (9) | ||||
| Orlistat | Obese individuals with metabolic syndrome, diabetes type 2, hypertension, mostly with coronary heart disease (77%) and concomitant cardiac dysfunction | Switzerland | Outpatient clinic | White (100) | nr | Antihypertensive‐treatment at trial onset: 100% ACE‐inhibitor (36) Ca‐antagonist (18) β‐blocker (49) Diuretic (low‐dose hydrochlorothiazide) (60) AT‐II‐receptor antagonists (49) | |
| Placebo | |||||||
| Orlistat | Obese individuals with diabetes type 2, hypertension or hypercholesterolaemia | France | Private practices (endocrinologists) | nr | nr | Antihypertensive‐treatment at trial onset: 70% | |
| Placebo | |||||||
| Orlistat (DBP ≥ 90 mm Hg) [OD] | Obese individuals with normal or impaired glucose tolerancea | Sweden | Medical centres | nr | nr | ACE‐inhibitors (7) Ca‐antagonists (6) β‐blockers (17) Diuretics (7) AT‐II‐receptor antagonists (2) | |
| Orlistat (SBP ≥ 140 mm Hg) [OS] | ACE‐inhibitors (6) Ca‐antagonists (6) β‐blockers (14) Diuretics (8) AT‐II‐receptor antagonists (2) | ||||||
| Placebo (DBP ≥ 90 mm Hg) [PD] | ACE‐inhibitors (7) Ca‐antagonists (7) β‐blockers (13) Diuretics (11) AT‐II‐receptor antagonists (1) | ||||||
| Placebo (SBP ≥ 140 mm Hg) [PS] | ACE‐inhibitors (8) Ca‐antagonists (8) β‐blockers (13) Diuretics (10) AT‐II‐receptor antagonists (2) | ||||||
| Phentermine/topiramate vs placebo | |||||||
| Phen/Top [LD] | Obese or overweight individuals with 2 or more comorbidities (hypertension, dyslipidaemia, diabetes or prediabetes, or abdominal obesity)a | USA | Outpatient clinic | White (83) African American (15) Hispanic or Latino (10) | nr | ACE inhibitors alone (26.9) β‐blockers alone (24.1) AT‐II‐receptor antagonists alone (15.5) ACE inhibitors + diuretics (5.8) ACE inhibitors + Ca‐antagonists (3.5), AT‐II‐receptor antagonists + diuretics (12.4) AT‐II‐receptor antagonists + Ca‐antagonists (0.9) | |
| Phen/Top [HD] | |||||||
| Placebo | |||||||
| Naltrexone/bupropion vs placebo | |||||||
| Nal/Bup | Overweight or obese people at increased risk of adverse cardiovascular outcomes | USA | Medical sites | White (83.3) Black (15.3) Other (1.4) | 12.2 (9.40) | 97.1 | |
| Placebo | White (82.3) Black (15.3) Other (2.4) | 11.6 (9.03) | 97.2 | ||||
| a only data for the predefined subgroup of hypertensive participants are reported here. ACE inhibitors: angiotensin‐converting enzyme inhibitors; AT‐II‐receptor antagonists: angiotensin II‐receptor antagonists; DBP: diastolic blood pressure; nr: not reported; [OD]: orlistat and diastolic blood pressure ≥ 90 mm Hg; [OS]: orlistat and systolic blood pressure ≥ 140 mm Hg; Phen/Top; [HD]: phentermine/topiramate high dose (15 mg/92 mg); Phen/Top [LD]: phentermine/topiramate low dose (7.5 mg/46 mg); [PD]: placebo and diastolic blood pressure ≥ 90 mm Hg; [PS]: placebo and systolic blood pressure ≥ 140 mm Hg; SBD: systolic blood pressure; SD: standard deviation. | |||||||
| Study | Intervention(s) and comparator(s) | Age (mean years (SD)) | Sex | BMI | Body weight (mean kg (SD)) | Sitting systolic blood pressure (mean mm Hg (SD)) | Sitting diastolic blood pressure (mean mm Hg (SD)) | Comorbid conditions (%) |
|---|---|---|---|---|---|---|---|---|
| Orlistat vs placebo | ||||||||
| Orlistat | 53.2 (0.5) | 63 | 35.8 (3.9) | 101.2 (1.0) | 154.2 (13.4) | 98.4 (3.7) | diabetes (8) | |
| Placebo | 52.5 (0.5) | 59 | 35.4 (4.0) | 101.5 (1.0) | 150.8 (12.7) | 98.3 (35) | diabetes (8) | |
| Orlistat | 54.9 (5.1) | 51 | 36.5 (1.9) | 107.0 (5.7) | 145.8 (9.8) | 87.8 (7.3) | metabolic syndrome (100) coronary heart disease (77) myocardial infarction (47) | |
| Placebo | 54.5 (4.5) | 51 | 36.1 (1.8) | 106.0 (5.9) | 142.1 (6.2) | 85.3 (5.6) | ||
| Orlistat | 49.1 (0.6) | 69 | 34.3 (0.2) | 93.9 (0.8) | 150.0 (0.8) | 96.9 (0.3) | nr | |
| Placebo | 49.5 (0.5) | 65 | 33.9 (0.2) | 93.5 (0.8) | 152.2 (0.9) | 97.0 (0.3) | nr | |
| Orlistat (DBP ≥ 90 mm Hg) [OD] | 46 (7) | 3862 | nr | 116 (17) | 146 (13) | 95 (5) | nr | |
| Orlistat (SBP ≥ 140mm Hg) [OS] | 47(7) | 42 | nr | 116 (17) | 149 (10) | 91 (9) | nr | |
| Placebo (DBP ≥ 90 mm Hg) [PD] | 46 (7) | 4456 | nr | 114 (18) | 142 (126) | 95 (5) | nr | |
| Placebo (SBP ≥ 140 mm Hg) [PS] | 47(7) | 42 | nr | 115 (18) | 149 (8) | 91 (8) | nr | |
| Phentermine/topiramate vs placebo | ||||||||
| Phen/Top [LD] | 53.0 (9.8) | 65.9% | 36.7 (4.6) | 104.4 (18.4) | 134.2 (13.0) | 83.7 (9.1) | nr | |
| Phen/Top [HD] | ||||||||
| Placebo | ||||||||
| Naltrexone/bupropion vs placebo | ||||||||
| Nal/Bup | 61.8 (7.27) | 54.5 | 37.1 (5.27) | 106 (19.09) | 126.1 (12.55) | 74.5 (9.01) | History of cardiovascular disease (30.3) History of Type 2 diabetes (86.4) History of dyslipidaemia (92.4) History of low LDL (27.8) Current smoker (8.4) | |
| Placebo | 61.6 (7.38) | 54.4 | 37.3 (5.42) | 106.6 (19.17) | 125.7 (12.62) | 74.4 (9.14) | History of cardiovascular disease (31.3) History of type 2 diabetes (86.9) History of dyslipidemia (92.1) History of low LDL (28.2) Current smoker (8.5) | |
| BMI: body mass index; LDL: low‐density lipoprotein; nr: not reported; [OD]: orlistat and diastolic blood pressure ≥ 90 mm Hg; [OS]: orlistat and systolic blood pressure ≥ 140 mm Hg; Phen/Top [HD]: phentermine/topiramate high dose (15 mg/92 mg); Phen/Top [LD]: phentermine/topiramate low dose (7.5 mg/46 mg); [PD]: placebo and diastolic blood pressure ≥ 90 mm Hg; [PS]: placebo and systolic blood pressure ≥ 140 mm Hg; SBD: systolic blood pressure; SD: standard deviation. | ||||||||
| Study | Intervention(s) and comparator(s) | Randomised/Safety (N) | Death (n (%)) | All adverse events (n (%)) | Leading to withdrawal (n (%)) | Serious adverse events (n (%)) |
|---|---|---|---|---|---|---|
| Orlistat vs placebo | ||||||
| Orlistat | 278/268a | 0 (0) | 239 (89) | 18 (6.7) | 31 (11.7) | |
| Placebo | 276/274a | 0 (0) | 195 (71) | 20 (7.3) | 24 (8.6) | |
| Orlistat | 45/45 | 0 (0) | nr | nr | 0 (0) | |
| Placebo | 45/45 | 0 (0) | nr | nr | 0 (0) | |
| Orlistat | 304/304 | nr | nr | nr | nr | |
| Placebo | 310/310 | nr | nr | nr | nr | |
| Orlistat (DBP ≥ 90 mm Hg) [OD] | 408/407 | 2 (0.5) | 403 (99) | 37 (9) | 73 (18) | |
| Orlistat (SBP ≥ 140mm Hg) [OS] | 516/513 | 1 (0.2) | 508 (99) | 46 (9) | 92 (18) | |
| Placebo (DBP ≥ 90 mm Hg) [PD] | 441/437 | 0 (0) | 420 (96) | 17 (4) | 52 (12) | |
| Placebo (SBP ≥ 140 mm Hg) [PS] | 509/508 | 0 (0) | 493 (97) | 20 (4) | 60 (12) | |
| Phentermine/topiramate vs placebo | ||||||
| Phen/Top [LD] | 261/261 | 0 (0) | 223 (85.4) | 31 (11.9) | 9 (3.4) | |
| Phen/Top [HD] | 520/520 | 0 (0) | 462 (88.8) | 103 (19.8) | 19 (3.7) | |
| Placebo | 524/524 | 0 (0) | 405 (77.3) | 51 (9.7) | 22 (4.2) | |
| Naltrexone/bupropion vs placebo | ||||||
| Nal/Bup | 4164/4164 | 63 (1.5) / P = 0.916 | 1796 (43.1) / P < 0.001 | 1273 (30.6) / P < 0.001 | 891 (21.4) / P = 0.297 | |
| Placebo | 4119/4119 | 63 (1,5) | 1053 (25.6) | 379 (9.2) | 843 (20.5) | |
| aCalculated from percentage rates DBP: diastolic blood pressure; nr: not reported; [OD]: orlistat and diastolic blood pressure ≥ 90 mm Hg; [OS]: orlistat and systolic blood pressure ≥ 140 mm Hg; Phen/Top [HD]: phentermine/topiramate high dose (15 mg/92 mg); Phen/Top [LD]: phentermine/topiramate low dose (7.5 mg/46 mg); [PD]: placebo and diastolic blood pressure ≥ 90 mm Hg; [PS]: placebo and systolic blood pressure ≥ 140 mm Hg; SBD: systolic blood pressure. | ||||||
| Study | Intervention(s) and comparator(s) | Randomised/Safety /N) | Gastrointestinal AE (n (%)) | Musculoskeletal AE (n (%)) | Dermatological AE (n (%)) | Vascular AE (n (%)) | Cardiac AE (n (%)) | Nervous system AE (n (%)) | Respiratory AE (n (%)) |
|---|---|---|---|---|---|---|---|---|---|
| Orlistat vs placebo | |||||||||
| Orlistat | 278/nr | 200 (72.5) | nr (22.8) | nr | nr | 5 (nr)a | nr | nr | |
| Placebo | 276/nr | 120 (43.6) | nr (15.5) | nr | nr | 5 (nr)a | nr | nr | |
| Orlistat | 45/45 | 16 (35.6)b | nr | nr | nr | nr | nr | nr | |
| Placebo | 45/45 | 11 (24.4)b | nr | nr | nr | nr | nr | nr | |
| Orlistat | 304/304 | nr | nr | nr | nr | nr | nr | nr | |
| Placebo | 310/310 | nr | nr | nr | nr | nr | nr | nr | |
| Orlistat (DBP ≥ 90 mm Hg) [OD] | 408/407 | 379 (93) | 265 (65) | 81 (20) | 69 (17) | nr | 159 (39) | nr | |
| Orlistat (SBP ≥ 140mm Hg) [OS] | 516/513 | 477 (93) | 333 (65) | 113 (22) | 87 (17) | nr | 205 (40) | nr | |
| Placebo (DBP ≥ 90 mm Hg) [PD] | 441/437 | 306 (70) | 271 (62) | 74 (17) | 83 (19) | nr | 170 (39) | nr | |
| Placebo (SBP ≥ 140 mm Hg) [PS] | 509/508 | 361 (71) | 320 (63) | 86 (17) | 97 (19) | nr | 188 (37) | nr | |
| Phentermine/topiramate vs placebo | |||||||||
| Phen/Top [LD] | 261/261 | Constipation: 41 (15.7) | nr | nr | nr | 6 (2.3) | Dry mouth: 37 (14.2) Paresthesia: 37 (14.2) Dysgeusia: 20 (7.7) Insomnia: 15 (5.7) Headache: 13 (5.0) Dizziness: 17 (6.5) | Upper respiratory tract infection: 33 (12.6) Nasopharyngitis: 27 (10.3) Sinusitis: 14 (5.4) | |
| Phen/Top [HD] | 520/520 | Constipation: 94 (18.1) | nr | nr | nr | 19 (3.7) | Dry mouth: 118 (22.7) Paresthesia: 116 (22.3) Dysgeusia: 57 (11.0) Insomnia: 57 (11.0) Headache: 56 (10.8) Dizziness: 63 (12.1) | Upper respiratory tract infection: 63 (12.1) Nasopharyngitis: 53 (10.2) Sinusitis: 43 (8.3) | |
| Placebo | 524/524 | Constipation: 29 (5.5) | nr | nr | nr | 9 (1.7) | Dry mouth: 12 (2.3) Paresthesia: 12 (2.3) Dysgeusia: 4 (0.8) Insomnia: 25 (4.8) Headache: 44 (8.4) Dizziness: 16 (3.1) | Upper respiratory tract infection: 62 (11.8) Nasopharyngitis: 46 (8.8) Sinusitis: 34 (6.5) | |
| Naltrexone/bupropion vs placebo | |||||||||
| Nal/Bup | 4164/4164 | 718 (17.2) / P < 0.001 | 181 (4.3) / P = 0.749 | 45 (1.1) / P = 0.002 | 158 (3.8)c / P = 0.978 | 313 (7.5) / P < 0.001 | 74 (1.8) / P = 0.947 | ||
| Placebo | 4119/4119 | 142 (3.4) | 185 (4.5) | 20 (0.5) | 155 (3.8)c | 111 (2.7) | 74 (1.8) | ||
| aOnly serious cardiac events. AE: adverse events; DBP: diastolic blood pressure; nr: not reported; [OD]: orlistat and diastolic blood pressure ≥ 90 mm Hg; [OS]: orlistat and systolic blood pressure ≥ 140 mm Hg; Phen/Top [HD]: phentermine/topiramate high dose (15 mg/92 mg); Phen/Top [LD]: phentermine/topiramate low dose (7.5 mg/46 mg); [PD]: placebo and diastolic blood pressure ≥ 90 mm Hg; [PS]: placebo and systolic blood pressure ≥ 140 mm Hg; SBD: systolic blood pressure. | |||||||||
| Study | Intervention(s) and comparator(s) | Baselinea | 6 moa | 12 moa | 48 moa | Change from baseline to endpointa |
|---|---|---|---|---|---|---|
| Orlistat vs placebo | ||||||
| Orlistat | 101.2 (1.0)c | nr | nr | na | −5.4 (6.4) / P < 0.001 (after 12 months) | |
| Placebo | 101.5 (1.0)c | nr | nr | na | −2.7 (6.4) (after 12 months) | |
| Orlistat | 106.9 (5.7) | 101.6(4.5) | na | na | −5.4c /P < 0.001 (after 6 months) | |
| Placebo | 105.9 (5.9) | 103.5 (5.3) | na | na | −2.5c (after 6 months) | |
| Orlistat | 93.9 (0.8)d | nr | na | na | −5.8 (0.3) / P < 0.0001 (after 6 months) | |
| Placebo | 93.5 (0.8)d | nr | na | na | −1.8 (0.2) (after 6 months) | |
| Orlistat (DBP ≥ 90 mm Hg) [OD]e | 117 (18) | 106 (17) | 105 (18) | 110 (19) | −11.9 (8.2) / P = nr (after 12 months)f −6.6 (8.6) / P < 0.001 (after 48 months) | |
| Orlistat (SBP ≥ 140mm Hg ) [OS]e | 117 (17) | 106 (17) | 105 (17) | 110 (18) | −6.8 (8.7) / P < 0.001 (after 48 months) | |
| Placebo (DBP ≥ 90 mm Hg) [PD]e | 115 (18 | 108 (18) | 108 (19) | 111 (20) | −6.9 (7.6) (after 12 months)f −3.8 (7.8) (after 48 months) | |
| Placebo (SBP ≥ 140 mm Hg) [PS]e | 116 (18) | 109 (18) | 110 (19) | 113 (19) | −3.2 (7.4) (after 48 months) | |
| Phentermine/topiramate vs placebo | ||||||
| CONQUER 2013 | Phen/Top [LD] | 104 (18)g | nr | nr | na | −8.2% (95% CI 7.3; 9.0) / P < 0.0001 (after 13 months) |
| Phen/Top [HD] | nr | nr | na | −10.1% (95% CI 9.5; 10.7) / P < 0.0001 (after 13 months) | ||
| Placebo | nr | nr | na | −1.9% (95% CI 1.3; 2.6) (after 13 months) | ||
| Naltrexone/bupropion vs placebo | ||||||
| Nissen 2016 | Nal/Bup | 106 (19.09) | nr | nr | nr | −1.9 (4.26) / P < 0.001 (after 28 months) |
| Placebo | 106.6 (19.17) | nr | nr | nr | −0.0 (3.50) (after 13 months) | |
| aMean kg (SD), unless otherwise indicated. CI: confidence interval; DBP: diastolic blood pressure; mo: months; na: not applicable; nr: not reported; [OD]: orlistat and diastolic blood pressure ≥ 90 mm Hg; [OS]: orlistat and systolic blood pressure ≥ 140 mm Hg; Phen/Top [HD]: phentermine/topiramate high dose (15 mg/92 mg); Phen/Top [LD]: phentermine/topiramate low dose (7.5 mg/46 mg); [PD]: placebo and diastolic blood pressure ≥ 90 mm Hg; [PS]: placebo and systolic blood pressure ≥ 140 mm Hg; SBD: systolic blood pressure; SD: standard deviation. | ||||||
| Study | Intervention(s) and comparator(s) | Baselinea | 6 moa | 12 moa | 48 moa | Change from baseline to endpointa |
|---|---|---|---|---|---|---|
| Orlistat vs placebo | ||||||
| Orlistat | 154 (13) | nr | nr | na | −13.3 (15.2) / ns (after 12 months) | |
| Placebo | 151 (13) | nr | nr | na | −11.0 (15.0) (after 12 months) | |
| Orlistat | 145.8 (9.8) | 141.5 (12.5) | na | na | −4.3 / P = 0.025 (after 6 months) | |
| Placebo | 142.1 (6.2) | 141.2 (8.8) | na | na | −0.9 (after 6 months) | |
| Orlistat | 150.0 (0.8)c | nr | na | na | −9.8 (1) / ns (after 6 months) | |
| Placebo | 152.2 (0.9)c | nr | na | na | −9.8 (1) (after 6 months) | |
| Orlistat (DBP ≥ 90 mm Hg) [OD]d | 146 (13) | 135 (14) | 135 (14) | 137 (15) | −11.2 (13.5) / P = nr (after 12 months)e −8.8 (14.8) / P = 0.024 (after 48 months) | |
| Orlistat (SBP ≥ 140mm Hg) [OS]d | 149 (10) | 125 (14) | 135 (14) | 138 (15) | −11.5 (14.9) / P < 0.002 (after 48 months) | |
| Placebo (DBP ≥ 90 mm Hg) [PD]d | 146 (12) | 136 (15) | 138 (16) | 139 (16) | −7.7 (13.8) (after 12 months)e −6.4 (15.1) (after 48 months) | |
| Placebo (SBP ≥ 140 mm Hg) [PS]d | 149 (8) | 138 (14) | 140 (14) | 140 (15) | −8.6 (14.3) (after 48 months) | |
| Phentermine/topiramate vs placebo | ||||||
| Phen/Top [LD] | 134.3 (nr) | nr | nr | na | −6.9 (95% CI 5.3; 8.5) / P = 0.0475 (after 13 months) | |
| Phen/Top [HD] | 133.1 (nr) | nr | nr | na | −9.1 (95% CI 7.9; 10.3) / P < 0.001 (after 13 months) | |
| Placebo | 135.2 (nr) | nr | nr | na | −4.9 (95% CI 3.7; 6.1) (after 13 months) | |
| Naltrexone/bupropion vs placebo | ||||||
| Nal/Bup | 126.1 (12.55) | nr | nr | nr | −2.2 (14.45) / P = 0.706 (after 28 months) | |
| Placebo | 125.7 (12.62) | nr | nr | nr | −2.2 (13.51) (after 28 months) | |
| aMean mm Hg (SD), unless otherwise indicated. DBP: diastolic blood pressure; mo: months; na: not applicable; nr: not reported; [OD]: orlistat and diastolic blood pressure ≥ 90 mm Hg; [OS]: orlistat and systolic blood pressure ≥ 140 mm Hg; Phen/Top [HD]: phentermine/topiramate high dose (15 mg/92 mg); Phen/Top [LD]: phentermine/topiramate low dose (7.5 mg/46 mg); [PD]: placebo and diastolic blood pressure ≥ 90 mm Hg; [PS]: placebo and systolic blood pressure ≥ 140 mm Hg; SBD: systolic blood pressure; SD: standard deviation. | ||||||
| Study | Intervention(s) and comparator(s) | Baselinea | 6 moa | 12 moa | 48 moa | Change from baseline to endpointa |
|---|---|---|---|---|---|---|
| Orlistat vs placebo | ||||||
| Orlistat | 98.4 (3.7) | nr | nr | na | −11.4 (8.3) / P = 0.002 (after 12 months) | |
| Placebo | 98.3 (3.5)c | nr | nr | na | −9.2 (8.4) (after 12 months) | |
| Orlistat | 87.8 (7.3) | 84.2 (8.6) | na | na | −3.6 / P = 0.012 (after 6 months) | |
| Placebo | 85.3 (5.6) | 84.5 (7.3) | na | na | −0.8 (after 6 months) | |
| Orlistat | 96.9 (0.3)d | nr | na | na | −7.5 (0.6) / ns (after 6 months) | |
| Placebo | 97.0 (0.3)d | nr | na | na | −7.3 (0.6) (after 6 months) | |
| Orlistat (DBP ≥ 90 mm Hg) [OD]e | 95 (6) | 86 (8) | 86 (8) | 87 (9) | −9.1 (7.9) / P = nr (after 12 months)f −8.1 (9.3) / P < 0.006 (after 48 months) | |
| Orlistat (SBP ≥ 140mm Hg) [OS]e | 91 (9) | 84 (9) | 85 (9) | 86 (9) | −5.0 (9.9) / P < 0.001 (after 48 months) | |
| Placebo (DBP ≥ 90 mm Hg) [PD]e | 95 (5) | 88 (9) | 88 (10) | 89 (10) | −6.7 (9.6) (after 12 months)f −6.2 (9.9) (after 48 months) | |
| Placebo (SBP ≥ 140 mm Hg) [PS]e | 91 (8) | 87 (9) | 88 (10) | 88 (10) | −3.0 (10.4) (after 48 months) | |
| Phentermine/topiramate vs placebo | ||||||
| Phen/Top [LD] | 83.4 (nr) | nr | nr | na | −5.2 (95% CI 4.1; 6.3) / P = 0.04 (after 13 months) | |
| Phen/Top [HD] | 83.2 (nr) | nr | nr | na | −5.8 (95% CI 5.1; 6.5) / P = 0.0003 (after 13 months) | |
| Placebo | 84.5 (nr) | nr | nr | na | −3.9 (95% CI 3.2; 4.6) (after 13 months) | |
| Naltrexone/bupropion vs placebo | ||||||
| Nal/Bup | 74.5 (9.01) | nr | nr | na | 1.4 (9.05) / P = 0.326 (after 28 months) | |
| Placebo | 74.4 (9.14) | nr | nr | na | 1.1 (8.50) (after 28 months) | |
| aMean mm Hg (SD), unless otherwise indicated. DBP: diastolic blood pressure; mo: months; na: not applicable; nr: not reported; [OD]: orlistat and diastolic blood pressure ≥ 90 mm Hg; [OS]: orlistat and systolic blood pressure ≥ 140 mm Hg; Phen/Top [HD]: phentermine/topiramate high dose (15 mg/92 mg); Phen/Top [LD]: phentermine/topiramate low dose (7.5 mg/46 mg); [PD]: placebo and diastolic blood pressure ≥ 90 mm Hg; [PS]: placebo and systolic blood pressure ≥ 140 mm Hg; SBD: systolic blood pressure; SD: standard deviation. | ||||||
| Outcome or subgroup title | No. of studies | No. of participants | Statistical method | Effect size |
| 1.1 Serious adverse events Show forest plot | 3 | 1476 | Risk Ratio (M‐H, Fixed, 95% CI) | 1.45 [1.10, 1.91] |
| 1.2 All adverse events Show forest plot | 2 | 1386 | Risk Ratio (M‐H, Random, 95% CI) | 1.13 [0.84, 1.54] |
| 1.3 Change in body weight from baseline to endpoint (6 to 12 months follow‐up) Show forest plot | 4 | 2080 | Mean Difference (IV, Random, 95% CI) | ‐3.74 [‐4.70, ‐2.78] |
| 1.4 Change in systolic blood pressure from baseline to endpoint (6 to 12 months follow‐up) Show forest plot | 4 | 2058 | Mean Difference (IV, Fixed, 95% CI) | ‐2.58 [‐3.78, ‐1.37] |
| 1.5 Change in diastolic blood pressure from baseline to endpoint (6 to 12 months follow‐up) Show forest plot | 4 | 2058 | Mean Difference (IV, Fixed, 95% CI) | ‐1.97 [‐2.72, ‐1.22] |
| Outcome or subgroup title | No. of studies | No. of participants | Statistical method | Effect size |
| 2.1 All adverse events Show forest plot | 1 | 1305 | Risk Ratio (M‐H, Fixed, 95% CI) | 1.13 [1.08, 1.20] |
| 2.2 Serious adverse events Show forest plot | 1 | 1305 | Risk Ratio (M‐H, Fixed, 95% CI) | 0.85 [0.49, 1.48] |
| 2.3 Change in body weight from baseline to endpoint: Phen/Top low dose (13 months follow‐up) Show forest plot | 1 | 772 | Mean Difference (IV, Fixed, 95% CI) | ‐6.30 [‐7.37, ‐5.23] |
| 2.4 Change in body weight from baseline to endpoint: Phen/Top high dose (13 months follow‐up) Show forest plot | 1 | 1030 | Mean Difference (IV, Fixed, 95% CI) | ‐8.20 [‐9.09, ‐7.31] |
| 2.5 Change in systolic blood pressure from baseline to endpoint: Phen/Top low dose (13 months follow‐up) Show forest plot | 1 | 772 | Mean Difference (IV, Fixed, 95% CI) | ‐2.00 [‐3.97, ‐0.03] |
| 2.6 Change in systolic blood pressure from baseline to endpoint: Phen/Top high dose (13 months follow‐up) Show forest plot | 1 | 1030 | Mean Difference (IV, Fixed, 95% CI) | ‐4.20 [‐5.85, ‐2.55] |
| 2.7 Change in diastolic blood pressure from baseline to endpoint: Phen/Top low dose (13 months follow‐up) Show forest plot | 1 | 772 | Mean Difference (IV, Random, 95% CI) | ‐1.30 [‐2.60, 0.00] |
| 2.8 Change in diastolic blood pressure from baseline to endpoint: Phen/Top high dose (13 months follow‐up) Show forest plot | 1 | 1030 | Mean Difference (IV, Fixed, 95% CI) | ‐1.90 [‐2.88, ‐0.92] |
| Outcome or subgroup title | No. of studies | No. of participants | Statistical method | Effect size |
| 3.1 Total mortality Show forest plot | 1 | 8283 | Risk Ratio (M‐H, Fixed, 95% CI) | 0.99 [0.70, 1.40] |
| 3.2 Cardiovascular morbidity Show forest plot | 1 | 8283 | Risk Ratio (M‐H, Fixed, 95% CI) | 1.11 [0.87, 1.41] |
| 3.3 All adverse events Show forest plot | 1 | 8283 | Risk Ratio (M‐H, Fixed, 95% CI) | 1.69 [1.58, 1.80] |
| 3.4 Serious adverse events Show forest plot | 1 | 8283 | Risk Ratio (M‐H, Fixed, 95% CI) | 1.05 [0.96, 1.14] |
| 3.5 Change in body weight from baseline to endpoint (28 months follow‐up) Show forest plot | 1 | 8283 | Mean Difference (IV, Fixed, 95% CI) | ‐1.90 [‐2.07, ‐1.73] |
| 3.6 Change in systolic blood pressure from baseline to endpoint (28 months follow‐up) Show forest plot | 1 | 8283 | Mean Difference (IV, Fixed, 95% CI) | 0.00 [‐0.60, 0.60] |
| 3.7 Change in diastolic blood pressure from baseline to endpoint (28 months follow‐up) Show forest plot | 1 | 8283 | Mean Difference (IV, Fixed, 95% CI) | 0.30 [‐0.08, 0.68] |