Efectos a largo plazo de los fármacos para reducir el peso en los pacientes con hipertensión
Información
- DOI:
- https://doi.org/10.1002/14651858.CD007654.pub4Copiar DOI

- Base de datos:
-
- Cochrane Database of Systematic Reviews
- Versión publicada:
-
- 02 marzo 2016see what's new
- Tipo:
-
- Intervention
- Etapa:
-
- Review
- Grupo Editorial Cochrane:
-
Grupo Cochrane de Hipertensión
- Copyright:
-
- Copyright © 2016 The Cochrane Collaboration. Published by John Wiley & Sons, Ltd.
Cifras del artículo
Altmetric:
Citado por:
Autores
Contributions of authors
Andrea Siebenhofer: protocol development, quality assessment of trials, data extraction, development of final review and review update, corresponding author
Klaus Jeitler: protocol development, searching for trials, quality assessment of trials, data extraction, development of review update
Karl Horvath: protocol development, quality assessment of trials, data extraction, development of final review and review update
Andrea Berghold: statistical analysis, development of final review and review update
Nicole Posch: selection of studies, development of review update
Jutta Meschik: selection of studies, development of review update
Thomas Semlitsch: searching for trials, selection of studies, quality assessment of trials, data extraction, development of review update
Sources of support
Internal sources
-
No sources of support supplied
External sources
-
Medical University of Graz, Austria.
Declarations of interest
Andrea Siebenhofer, Klaus Jeitler, and Karl Horvath were involved in the preparation of a report on the evaluation of the benefits and harms of non‐drug treatment strategies in people with essential hypertension: weight reduction for the Institute for Quality and Efficiency in Health Care (http://iqwig.de/).
Andrea Berghold: none known
Nicole Posch: none known
Jutta Meschik: none known
Thomas Semlitsch: none known
Acknowledgements
We would like to thank Douglas Salzwedel for helping to update the literature search, Phillip Elliott for the final editing of the manuscript, and Ulrich Siering for assisting in the development of the original review.
Version history
| Published | Title | Stage | Authors | Version |
| 2021 Jan 17 | Long‐term effects of weight‐reducing drugs in people with hypertension | Review | Andrea Siebenhofer, Sebastian Winterholer, Klaus Jeitler, Karl Horvath, Andrea Berghold, Cornelia Krenn, Thomas Semlitsch | |
| 2016 Mar 02 | Long‐term effects of weight‐reducing drugs in people with hypertension | Review | Andrea Siebenhofer, Klaus Jeitler, Karl Horvath, Andrea Berghold, Nicole Posch, Jutta Meschik, Thomas Semlitsch | |
| 2013 Mar 28 | Long‐term effects of weight‐reducing drugs in hypertensive patients | Review | Andrea Siebenhofer, Klaus Jeitler, Karl Horvath, Andrea Berghold, Ulrich Siering, Thomas Semlitsch | |
| 2009 Jul 08 | Long‐term effects of weight‐reducing drugs in hypertensive patients | Review | Andrea Siebenhofer, Karl Horvath, Klaus Jeitler, Andrea Berghold, Anne K Stich, Eva Matyas, Nicole Pignitter, Ulrich Siering | |
| 2009 Jan 21 | Long‐term effects of weight‐reducing drugs in hypertensive patients | Protocol | Andrea Siebenhofer, Karl Horvath, Klaus Jeitler, Andrea Berghold, Anne K Stich, Eva Matyas, Nicole Pignitter, Ulrich Siering | |
Differences between protocol and review
Two authors (Anne Stich and Eva Matyas) did not contribute to the 2013 update of this review and were removed from the list of authors.
Thomas Semlitsch joined the team of review authors for the 2013 version of this review and provided substantive intellectual contributions that justify his inclusion as authors.
Ulrich Siering did not contribute to the 2015 update of this review and was removed from the list of authors.
Jutta Meschik joined the team of review authors for the 2015 version of this review and provided substantive intellectual contributions that justify her inclusion as authors.
Since current guidelines for the pharmacological management of obesity quote four additional medications (liraglutide, lorcaserin, phentermine/topiramate, or naltrexone/bupropion) for long‐term weight reduction, the search was extended to include these drugs in the 2015 version of this review.
Keywords
MeSH
Medical Subject Headings (MeSH) Keywords
- Anti-Obesity Agents [*adverse effects, therapeutic use];
- Appetite Depressants [*adverse effects, therapeutic use];
- Bias;
- Blood Pressure [drug effects];
- Body Weight [drug effects];
- Bupropion [adverse effects, therapeutic use];
- Diet, Reducing;
- Drug Combinations;
- Fructose [adverse effects, analogs & derivatives, therapeutic use];
- Hypertension [*drug therapy, mortality];
- Lactones [adverse effects, therapeutic use];
- Naltrexone [adverse effects, therapeutic use];
- Orlistat [adverse effects, therapeutic use];
- Phentermine [adverse effects, therapeutic use];
- Piperidines [adverse effects, therapeutic use];
- Pyrazoles [adverse effects, therapeutic use];
- Randomized Controlled Trials as Topic;
- Safety-Based Drug Withdrawals;
- Time;
- Topiramate [adverse effects, therapeutic use];
Medical Subject Headings Check Words
Adult; Female; Humans; Male; Middle Aged;
PICO
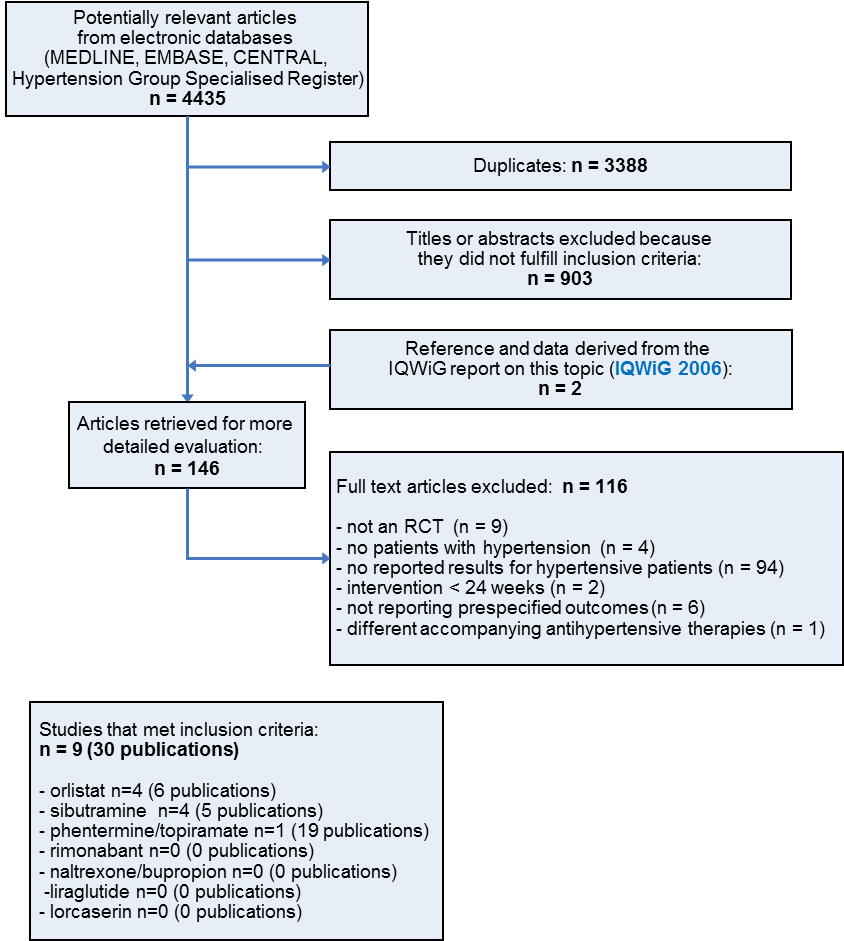
Study flow diagram
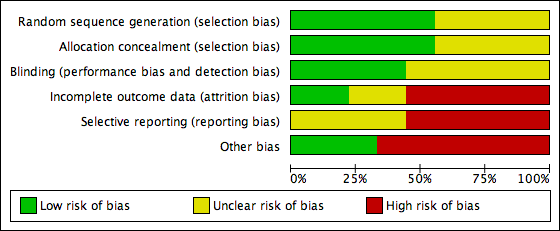
Risk of bias graph: review authors' judgements about each risk of bias item presented as percentages across all included studies.

Risk of bias summary: review authors' judgements about each risk of bias item for each included study.
![Forest plot of comparison: 1 Orlistat versus placebo, outcome: 1.1 Change in systolic blood pressure from baseline to endpoint [mm Hg].](/es/cdsr/doi/10.1002/14651858.CD007654.pub4/media/CDSR/CD007654/rel0004/CD007654/image_n/nCD007654-AFig-FIG04.png)
Forest plot of comparison: 1 Orlistat versus placebo, outcome: 1.1 Change in systolic blood pressure from baseline to endpoint [mm Hg].
![Forest plot of comparison: 1 Orlistat versus placebo, outcome: 1.2 Change in diastolic blood pressure from baseline to endpoint [mm Hg].](/es/cdsr/doi/10.1002/14651858.CD007654.pub4/media/CDSR/CD007654/rel0004/CD007654/image_n/nCD007654-AFig-FIG05.png)
Forest plot of comparison: 1 Orlistat versus placebo, outcome: 1.2 Change in diastolic blood pressure from baseline to endpoint [mm Hg].
![Forest plot of comparison: 1 Orlistat versus placebo, outcome: 1.3 Change in body weight from baseline to endpoint [kg].](/es/cdsr/doi/10.1002/14651858.CD007654.pub4/media/CDSR/CD007654/rel0004/CD007654/image_n/nCD007654-AFig-FIG06.png)
Forest plot of comparison: 1 Orlistat versus placebo, outcome: 1.3 Change in body weight from baseline to endpoint [kg].
![Forest plot of comparison: 2 Sibutramine versus placebo, outcome: 2.1 Change in diastolic blood pressure from baseline to endpoint [mm Hg].](/es/cdsr/doi/10.1002/14651858.CD007654.pub4/media/CDSR/CD007654/rel0004/CD007654/image_n/nCD007654-AFig-FIG07.png)
Forest plot of comparison: 2 Sibutramine versus placebo, outcome: 2.1 Change in diastolic blood pressure from baseline to endpoint [mm Hg].
![Forest plot of comparison: 2 Sibutramine versus placebo, outcome: 2.2 Change in body weight from baseline to endpoint [kg].](/es/cdsr/doi/10.1002/14651858.CD007654.pub4/media/CDSR/CD007654/rel0004/CD007654/image_n/nCD007654-AFig-FIG08.png)
Forest plot of comparison: 2 Sibutramine versus placebo, outcome: 2.2 Change in body weight from baseline to endpoint [kg].

Comparison 1 Orlistat versus placebo, Outcome 1 Change in systolic blood pressure from baseline to endpoint.

Comparison 1 Orlistat versus placebo, Outcome 2 Change in diastolic blood pressure from baseline to endpoint.

Comparison 1 Orlistat versus placebo, Outcome 3 Change in body weight from baseline to endpoint.

Comparison 2 Sibutramine versus placebo, Outcome 1 Change in diastolic blood pressure from baseline to endpoint.

Comparison 2 Sibutramine versus placebo, Outcome 2 Change in body weight from baseline to endpoint.
| Orlistat compared with placebo for weight reduction | |||||
| Patient or population: Men and non‐pregnant women ≥ 18 years old with essential hypertension Intervention: Orlistat Comparison: Placebo | |||||
| Outcomes | Illustrative comparative risks (per 1000 patients) | Effect estimate | No of Participants | Quality of the evidence | Comments |
| Change in systolic blood pressure as compared to placebo [mm Hg] from baseline to end of study | Not applicable | MD ‐2.46 [‐4.01, ‐0.90] | 2058 | ⊕⊕⊝⊝ | ‐ |
| Change in diastolic blood pressure as compared to placebo [mm Hg] from baseline to end of study | Not applicable | MD ‐1.92 [‐2.99, ‐0.85] | 2058 | ⊕⊕⊝⊝ | ‐ |
| Change in body weight as compared to placebo [kg] from baseline to end of study | Not applicable | MD ‐3.73 [‐4.65, ‐2.80] | 2080 | ⊕⊕⊕⊝ | ‐ |
| CI: confidence interval; MD: mean difference | |||||
| GRADE Working Group grades of evidence | |||||
| 1High risk of bias in included studies. 2Wide confidence intervals include non‐clinically important effect. | |||||
| Sibutramine compared with placebo for weight reduction | |||||
| Patient or population: Men and non‐pregnant women ≥ 18 years old with essential hypertension Intervention: Sibutramine Comparison: Placebo | |||||
| Outcomes | Illustrative comparative risks (per 1000 patients) | Effect estimates | No of Participants | Quality of the evidence | Comments |
| Change in systolic blood pressure as compared to placebo [mm Hg] from baseline to end of study | Not applicable | Not estimable | See comment | See comment | Variability measurements not available; |
| Change in diastolic blood pressure as compared to placebo [mm Hg] from baseline to end of study | Not applicable | MD 3.16 [1.40, 4.92] | 428 | ⊕⊕⊝⊝ | ‐ |
| Change in body weight as compared to placebo [kg] from baseline to end of study | Not applicable | MD ‐3.74 [‐4.84, ‐2.64] | 574 | ⊕⊕⊝⊝ | ‐ |
| CI: confidence interval; MD: mean difference | |||||
| GRADE Working Group grades of evidence | |||||
| 1High risk of bias in included studies. 2Small number of participants and studies. | |||||
| Study | Adverse events | Results |
| Orlistat vs placebo | ||
| Bakris 2002 | total thereof leading to withdrawal serious gastrointestinal thereof leading to withdrawal musculoskeletal | 89% of P [O] vs 71% of P [P], P < 0.001 7% [O] vs 7% [P] 14 P (12%) [O] vs 15 P (9%) [P] 200 P (73%) [O] vs 120 P (44%) [P], P < 0.001 15 P (8%) [O] vs 6 P (5%) [P] 23% of P [O] vs 16% [P], P < 0.05 |
| Cocco 2005 | total serious gastrointestinal | nr 0 P [O] vs 0 P [P] 16 P (36%) [O]a vs 11 P (24%) [P]a |
| Guy‐Grand 2004 | total serious | nrb nrb |
| XENDOS 2001‐2006 | total leading to withdrawal serious gastrointestinal musculoskeletal nervous system dermatological vascular | 99% of P [OD] vs 96% of P [PD] 99% of P [OS] vs 97% of P [PS] 9% of P [OD] vs 4% of P [PD] 9% of P [OS] vs 4% of P [PS] 18% of P [OD] vs 12% of P [PD] 18% of P [OS] vs 12% of P [PS] 93% of P [OD] vs 70% of P [PD] 93% of P [OS] vs 71% of P [PS] 65% of P [OD] vs 62% of P [PD] 65% of P [OS] vs 63% of P [PS] 39% of P [OD] vs 39% of P [PD] 40% of P [OS] vs 37% of P [PS] 20% of P [OD] vs 17% of P [PD] 22% of P [OS] vs 17% of P [PS] 17% of P [OD] vs 19% of P [PD] 17% of P [OS] vs 19% of P [PS] |
| Sibutramine vs placebo | ||
| Fanghaenel 2003 | total constipation dizziness dry mouth headache insomnia restlessness | 14 P (21 E) [S] vs 13 P (20 E) [P] 4 P [S] vs 2 P [P] 1 P [S] vs 1 P [P] 4 P [S] vs 2 P [P] 5 P [S] vs 2 P [P] 1 P [S] vs 1 P [P] 1 P [S] vs 0 P [P] |
| Faria 2002‐2005 | total dry mouth arthralgia | nr 37% of P [S] vs 9% of P [P], P < 0.005 16% of P [S] vs 2% of P [P], P = 0.03 |
| McMahon 2002 | total serious treatment related leading to withdrawal (mostly hypertension) dry mouth headache | 141 P (97%) [S] vs 65 P (88%) [P] 9 P (6%) [S] vs 5 P (7%) [P] 2 E [S] vs 0 E [P] 23 P (16%) [S] vs 4 P (5%) [P] 30 P (21%) [S] vs 0 P [P] 41 P (28%) [S] vs 17 P (23%) [P] |
| McMahon 2000 | total leading to withdrawal (mostly hypertension) dry mouth headache constipation rash | nr 30 P (20%) [S] vs 8 P (11%) [P] 29 P (19%) [S] vs 2 P (3%) [P], P < 0.05 37 P (25%) [S] vs 21 P (28%) [P] 25 P (17%) [S] vs 2 P (3%) [P], P < 0.05 16 P (11%) [S] vs 2 P (3%) [P] |
| Phentermine/topiramate vs placebo | ||
| CONQUER 2013 | total leading to withdrawal serious cardiac adverse events dry mouth paresthaesia constipation upper respiratory tract infection nasopharyngitis dysgeusia insomnia headache dizziness sinusitis | 85.4% vs 88.8% vs 77.3% 11.9% vs 19.8% vs 9.7% 3.4% (Phen/Top [LD]) vs 3.7% (Phen/Top [HD]) vs 4.2% [P] 0.8% vs 1.2% vs 0.6% 14.2% (Phen/Top [LD]) vs 22.7% (Phen/Top [HD]) vs 2.3% [P] 14.2% (Phen/Top [LD]) vs 22.3% (Phen/Top [HD]) vs 2.3% [P] 15.7% (Phen/Top [LD]) vs 18.1% (Phen/Top [HD]) vs 5.5% [P] 12.6% (Phen/Top [LD]) vs 12.1% (Phen/Top [HD]) vs 11.8% [P] 10.3% (Phen/Top [LD]) vs 10.2% (Phen/Top [HD]) vs 8.8% [P] 7.7% (Phen/Top [LD]) vs 11.0% (Phen/Top [HD]) vs 0.8% [P] 5.7% (Phen/Top [LD]) vs 11.0% (Phen/Top [HD]) vs 4.8% [P] 5.0% (Phen/Top [LD]) vs 10.8% (Phen/Top [HD]) vs 8.4% [P] 6.5% (Phen/Top [LD]) vs 12.1% (Phen/Top [HD]) vs 3.1% [P] 5.4% (Phen/Top [LD]) vs 8.3% (Phen/Top [HD]) vs 6.5% [P] |
| E: events. nr: not reported. [O]: orlistat. [OD]: orlistat and diastolic blood pressure ≥ 90 mm Hg. [OS]: orlistat and systolic blood pressure ≥ 140 mm Hg. P: participants. [P]: placebo. Phen/Top [HD]: phentermine/topiramate high dose (15 mg/92 mg). Phen/Top [LD]: phentermine/topiramate low dose (7.5 mg/46 mg). [PD]: placebo and diastolic blood pressure ≥ 90 mm Hg. [PS]: placebo and systolic blood pressure ≥ 140 mm Hg. [S]: sibutramine. aNo data on adverse events were reported for the whole study duration. The data above refer to 4 and 3 weeks of treatment in the orlistat and placebo group, respectively. After 3 months, the number of participants with events decreased to 5(11%)[O] with flatulence and mild abdominal cramps versus 6(13%)[P] with nausea and hunger feeling. bData were not available for the hypertensive subgroup, only for the whole study population (withdrawal due to defecation troubles in 10 [O] versus 2 [P] participants). | ||
| Study | Baselinea | 6 moa | 12 moa | 48 moa | Change from baseline to endpointa |
| Orlistat vs placebo | |||||
| Bakris 2002b Orlistat Placebo | 101 (1)c 102 (1)c | nr nr | nr nr | ‐ ‐ | P < 0.001 ‐5.4 (6.4) ‐2.7 (6.4) |
| Cocco 2005 Orlistat Placebo | 107 (6) 106 (6) | 102 (4) 104 (5) | ‐ ‐ | ‐ ‐ | P < 0.001 ‐5.4d ‐2.5d |
| Guy‐Grand 2004 Orlistat Placebo | 94 (1)c 94 (1)c | nr nr | ‐ ‐ | ‐ ‐ | P < 0.0001 ‐5.8 (0.3) ‐1.8 (0.2) |
| XENDOS 2001‐2006 Orlistat [OD] Placebo [PD] Orlistat [OS] Placebo [PS] | 117 (18) 115 (18) 117 (17) 116 (18) | 106 (17) 108 (18) 106 (17) 109 (18) | 105 (18) 108 (19) 105 (17) 110 (19) | 110 (19) 111 (20) 110 (18) 113 (19) | P < 0.001 ‐6.6 (8.6) ‐3.8 (7.8) P < 0.001 ‐6.8 (8.7) ‐3.2 (7.4) |
| Sibutramine vs placebo | |||||
| Fanghaenel 2003 Sibutramine Placebo | 75 (10) 78 (9) | 70 (10) 75 (9) | ‐ ‐ | ‐ ‐ | significant ‐5.5 (‐3.8; ‐7.1)e ‐3.4 (‐1.9; ‐5.0)e |
| Faria 2002‐2005 Sibutramine Placebo | 100 (19) 97 (14) | 93 (18) 94 (15) | ‐ ‐ | ‐ ‐ | P < 0.001 ‐6.8 (2.3) ‐2.4 (4.2) |
| McMahon 2002 Sibutramine Placebo | 97 (16) 99 (14) | nr nr | nr nr | ‐ ‐ | P < 0.05 ‐4.5 ‐0.4 |
| McMahon 2000 Sibutramine Placebo | 97 (13) 96 (17) | nr nr | nr nr | ‐ ‐ | P < 0.05 ‐4.4 ‐0.5 |
| Phentermine/topiramate vs placebo | |||||
| CONQUER 2013 Phen/Top [LD] Phen/Top [HD] Placebo | 104 (18)f | nr nr nr | nr nr nr | ‐ ‐ ‐ | P < 0.0001g ‐8.1% ‐10.1% ‐1.9% |
| Mo: months. nr: not reported. [O]: orlistat. [OD]: orlistat and diastolic blood pressure ≥ 90 mm Hg. [OS]: orlistat and systolic blood pressure ≥ 140 mm Hg. P: participants. [P]: placebo. Phen/Top [HD]: phentermine/topiramate high dose (15 mg/92 mg). Phen/Top [LD]: phentermine/topiramate low dose (7.5 mg/46 mg). [PD]: placebo and diastolic blood pressure ≥ 90 mm Hg. [PS]: placebo and systolic blood pressure ≥ 140 mm Hg. [S]: sibutramine. SD: standard deviation. aMean kg (SD), unless otherwise indicated. bData are reported for 267 of 278 [O] and 265 of 276 [P] participants only. cReported as being the standard deviation but probably the standard error due to its small number. dPublished values are different, but data were corrected after personal communication with the author. e95% confidence interval. fReported only combined for all three study groups. gFor each intervention group versus placebo. | |||||
| Study | Baselinea | 6 moa | 12 moa | 48 moa | Change from baseline to endpointa |
| Orlistat vs placebo | |||||
| Bakris 2002b Orlistat Placebo | 154 (13) 151 (13) | nr nr | nr nr | ‐ ‐ | ns ‐13.3 (15.2) ‐11.0 (15.0) |
| Cocco 2005 Orlistat Placebo | 146 (10) 142 (6) | 142 (13) 141 (9) | ‐ ‐ | ‐ ‐ | P = 0.025 ‐4.3 ‐0.9 |
| Guy‐Grand 2004 Orlistat Placebo | 150 (1)c 152 (1)c | nr nr | ‐ ‐ | ‐ ‐ | ns ‐9.8 (1) ‐9.8 (1) |
| XENDOS 2001‐2006 Orlistat [OD]d Placebo [PD]d Orlistat [OS]d Placebo [PS]d | 146 (13) 146 (12) 149 (10) 149 (8) | 135 (14) 136 (15) 125 (14) 138 (14) | 135 (14) 138 (16) 135 (14) 140 (14) | 137 (15) 139 (16) 138 (15) 140 (15) | P = 0.024 ‐8.8 (14.8) ‐6.4 (15.1) P < 0.002 ‐11.5 (14.9) ‐8.6 (14.3) |
| Sibutramine vs placebo | |||||
| Fanghaenel 2003e Sibutramine Placebo | 139 (9) 139 (13) | 125 (9) 123 (10) | ‐ ‐ | ‐ ‐ | ns ‐13.9f ‐16.5f |
| Faria 2002‐2005 Sibutramine Placebo | 150 (18) 150 (15) | 146 (15) 149 (22) | ‐ ‐ | ‐ ‐ | ns ‐4.6f ‐0.6f |
| McMahon 2002 Sibutramine Placebo | 129 (11) 129 (11) | nr nr | 133 130 | ‐ ‐ | P = 0.0497 3.8 1.1 |
| McMahon 2000 Sibutramine Placebo | 134 (10) 134 (11) | nr nr | nr nr | ‐ ‐ | ns 2.7 1.5 |
| Phentermine/topiramate vs placebo | |||||
| CONQUER 2013 Phen/Top [LD] Phen/Top [HD] Placebo | 134 (nr) 133 (nr) 135 (nr) | nr nr nr | nr nr nr | ‐ ‐ ‐ | P = 0.0475 [LD] P < 0.0001 [HD] ‐6.9 ‐9.1 ‐4.9 |
| Mo: months. nr: not reported. [O]: orlistat. [OD]: orlistat and diastolic blood pressure ≥ 90 mm Hg. [OS]: orlistat and systolic blood pressure ≥ 140 mm Hg. P: participants. [P]: placebo. Phen/Top [HD]: phentermine/topiramate high dose (15 mg/92 mg). Phen/Top [LD]: phentermine/topiramate low dose (7.5 mg/46 mg). [PD]: placebo and diastolic blood pressure ≥ 90 mm Hg. [PS]: placebo and systolic blood pressure ≥ 140 mm Hg. [S]: sibutramine. SD: standard deviation. aMean mm Hg (SD), unless otherwise indicated. bData are reported for 267 of 278 [O] and 265 of 276 [P] participants only. cReported as being the standard deviation but probably the standard error due to its small number. dBased on last observation carried forward data on 399 [OD], 423 [PD], 493 [OS], and 504 [PS] participants. eData at baseline were recorded after a two‐week wash‐out period of antihypertensive drugs for diagnostic confirmation of hypertension. fCalculated. | |||||
| Study | Baselinea | 6 moa | 12 moa | 48 moa | Change from baseline to endpointa |
| Orlistat vs placebo | |||||
| Bakris 2002b Orlistat Placebo | 98 (4) 98 (4)c | nr nr | nr nr | ‐ ‐ | P = 0.002 ‐11.4 (8.3) ‐9.2 (8.4) |
| Cocco 2005 Orlistat Placebo | 88 (7) 85 (6) | 84 (9) 85 (7) | ‐ ‐ | ‐ ‐ | P = 0.012 ‐3.6 ‐0.8 |
| Guy‐Grand 2004 Orlistat Placebo | 97 (0)d 97 (0)d | nr nr | ‐ ‐ | ‐ ‐ | ns ‐7.5 (0.6) ‐7.3 (0.6) |
| XENDOS 2001‐2006 Orlistat [OD]e Placebo [PD]e Orlistat [OS]e Placebo [PS]e | 95 (6) 95 (5) 91 (9) 91 (8) | 86 (8) 88 (9) 84 (9) 87 (9) | 86 (8) 88 (10) 85 (9) 88 (10) | 87 (9) 89 (10) 86 (9) 88 (10) | P < 0.006 ‐8.1 (9.3) ‐6.2 (9.9) P < 0.001 ‐5.0 (9.9) ‐3.0 (10.4) |
| Sibutramine vs placebo | |||||
| Fanghaenel 2003f Sibutramine Placebo | 93 (7) 92 (8) | 82 (5) 80 (5) | ‐ ‐ | ‐ ‐ | ns ‐11.4g ‐11.7g |
| Faria 2002‐2005 Sibutramine Placebo | 91 (12) 94 (12) | 92 (13) 92 (14) | ‐ ‐ | ‐ ‐ | ns 1.0g ‐2.06g |
| McMahon 2002 Sibutramine Placebo | 82 (6) 83 (6) | nr nr | 86 83 | ‐ ‐ | P = 0.004 3.0 ‐0.1 |
| McMahon 2000 Sibutramine Placebo | 84 (5) 84 (6) | nr nr | nr nr | ‐ ‐ | P < 0.05 2.0 ‐1.3 |
| Phentermine/topiramate vs placebo | |||||
| CONQUER 2013 Phen/Top [LD] Phen/Top [HD] Placebo | 83 (nr) 83 (nr) 85 (nr) | nr nr nr | nr nr nr | ‐ ‐ ‐ | P = 0.0400 [LD] P = 0.0003 [HD] ‐5.2 ‐5.8 ‐3.9 |
| Mo: months. nr: not reported. [O]: orlistat. [OD]: orlistat and diastolic blood pressure ≥ 90 mm Hg. [OS]: orlistat and systolic blood pressure ≥ 140 mm Hg. P: participants. [P]: placebo. Phen/Top [HD]: phentermine/topiramate high dose (15 mg/92 mg). Phen/Top [LD]: phentermine/topiramate low dose (7.5 mg/46 mg). [PD]: placebo and diastolic blood pressure ≥ 90 mm Hg. [PS]: placebo and systolic blood pressure ≥ 140 mm Hg. [S]: sibutramine. SD: standard deviation. aMean mm Hg (SD), unless otherwise indicated. bData are reported for 267 of 278 [O] and 265 of 276 [P] participants only. cThe standard deviation was published as being 35 but should probably be 3.5. dReported as being the standard deviation but probably the standard error due to its small number. eBased on last observation carried forward data on 399 [OD], 423 [PD], 493 [OS], and 504 [PS] participants. fData at baseline were recorded after a two‐week wash‐out period of antihypertensive drugs for diagnostic confirmation of hypertension. gCalculated. | |||||
| Outcome or subgroup title | No. of studies | No. of participants | Statistical method | Effect size |
| 1 Change in systolic blood pressure from baseline to endpoint Show forest plot | 4 | 2058 | Mean Difference (IV, Random, 95% CI) | ‐2.46 [‐4.01, ‐0.90] |
| 2 Change in diastolic blood pressure from baseline to endpoint Show forest plot | 4 | 2058 | Mean Difference (IV, Random, 95% CI) | ‐1.92 [‐2.99, ‐0.85] |
| 3 Change in body weight from baseline to endpoint Show forest plot | 4 | 2080 | Mean Difference (IV, Random, 95% CI) | ‐3.73 [‐4.65, ‐2.80] |
| Outcome or subgroup title | No. of studies | No. of participants | Statistical method | Effect size |
| 1 Change in diastolic blood pressure from baseline to endpoint Show forest plot | 2 | 428 | Mean Difference (IV, Fixed, 95% CI) | 3.16 [1.40, 4.92] |
| 2 Change in body weight from baseline to endpoint Show forest plot | 4 | 574 | Mean Difference (IV, Fixed, 95% CI) | ‐3.74 [‐4.84, ‐2.64] |