உயர் இரத்த அழுத்தம் கொண்டவர்களில் உடல் எடை‐குறைக்கும் உணவுத் திட்டமுறைகளின் நீண்ட‐கால விளைவுகள்
Abstract
Background
All major guidelines on antihypertensive therapy recommend weight loss; anti‐obesity drugs may be able to help in this respect.
Objectives
Primary objectives:
To assess the long‐term effects of pharmacologically induced reduction in body weight in adults with essential hypertension on all‐cause mortality, cardiovascular morbidity, and adverse events (including total serious adverse events, withdrawal due to adverse events, and total non‐serious adverse events).
Secondary objectives:
To assess the long‐term effects of pharmacologically induced reduction in body weight in adults with essential hypertension on change from baseline in systolic blood pressure, change from baseline in diastolic blood pressure, and body weight reduction.
Search methods
We obtained studies using computerised searches of the Cochrane Hypertension Group Specialised Register, the Cochrane Central Register of Controlled Trials (CENTRAL), Ovid MEDLINE, Ovid EMBASE, the clinical trials registry ClinicalTrials.gov, and from handsearches in reference lists and systematic reviews (status as of 13 April 2015).
Selection criteria
Randomised controlled trials in hypertensive adults of at least 24 weeks' duration that compared long‐term pharmacologic interventions for weight loss with placebo.
Data collection and analysis
Two review authors independently selected studies, assessed risk of bias, and extracted data. Where appropriate and in the absence of significant heterogeneity between studies (P > 0.1), we pooled studies using fixed‐effect meta‐analysis. When heterogeneity was present, we used the random‐effects method and investigated the cause of heterogeneity.
Main results
After updating the literature search, which was extended to include four new weight‐reducing drugs, we identified one additional study of phentermine/topiramate, bringing the total number of studies to nine that compare orlistat, sibutramine, or phentermine/topiramate to placebo and thus fulfil our inclusion criteria. We identified no relevant studies investigating rimonabant, liraglutide, lorcaserin, or naltrexone/bupropion. No study included mortality and cardiovascular morbidity as predefined outcomes. Incidence of gastrointestinal side effects was consistently higher in those participants treated with orlistat versus those treated with placebo. The most frequent side effects were dry mouth, constipation, and headache with sibutramine, and dry mouth and paresthaesia with phentermine/topiramate. In participants assigned to orlistat, sibutramine, or phentermine/topiramate body weight was reduced more effectively than in participants in the usual‐care/placebo groups. Orlistat reduced systolic blood pressure as compared to placebo by ‐2.5 mm Hg (mean difference (MD); 95% confidence interval (CI): ‐4.0 to ‐0.9 mm Hg) and diastolic blood pressure by ‐1.9 mm Hg (MD; 95% CI: ‐3.0 to ‐0.9 mm Hg). Sibutramine increased diastolic blood pressure compared to placebo by +3.2 mm Hg (MD; 95% CI: +1.4 to +4.9 mm Hg). The one trial that investigated phentermine/topiramate suggested it lowered blood pressure.
Authors' conclusions
In people with elevated blood pressure, orlistat and sibutramine reduced body weight to a similar degree, while phentermine/topiramate reduced body weight to a greater extent. In the same trials, orlistat and phentermine/topiramate reduced blood pressure, while sibutramine increased it. We could include no trials investigating rimonabant, liraglutide, lorcaserin, or naltrexone/bupropion in people with elevated blood pressure. Long‐term trials assessing the effect of orlistat, liraglutide, lorcaserin, phentermine/topiramate, or naltrexone/bupropion on mortality and morbidity are unavailable and needed. Rimonabant and sibutramine have been withdrawn from the market, after long‐term trials on mortality and morbidity have confirmed concerns about the potential severe side effects of these two drugs. The European Medicines Agency refused marketing authorisation for phentermine/topiramate due to safety concerns, while the application for European marketing authorisation for lorcaserin was withdrawn by the manufacturer after the Committee for Medicinal Products for Human Use judged the overall benefit/risk balance to be negative.
PICO
எளியமொழிச் சுருக்கம்
உயர் இரத்த அழுத்தம் கொண்டவர்களில் உடல் எடை‐குறைக்கும் உணவுத் திட்டமுறைகளின் நீண்ட‐கால விளைவுகள்
மருத்துவர்கள், உயர் இரத்த அழுத்தம் கொண்ட அதிக எடையுடைய நோயாளிகளுக்கு உடல் எடையை குறைக்க பொதுவாக பரிந்துரைப்பர். சில நேரங்களில் உடல் எடை மற்றும் இரத்த அழுத்த குறைவிற்கு உறுதுணையாக உடற் பருமன் ‐போக்கி மருந்துகளை எடுத்துக்கொள்ளும்படி பரிந்துரைப்பதும் இதில் அடங்கும். இரண்டு செயல்படு கலவைபொருட்கள் (சிபுட்ராமின் (sibutramine) மற்றும் ரிமோனபான்ட் (rimonabant)) முறையே 2009 மற்றும் 2010 ஆண்டுகளில் சந்தையிலிருந்து திரும்பப் பெறப்பட்டன. உடல் பருமனுக்கான மருந்து மேலாண்மையில் நீண்டகால எடை குறைப்புக்கு, அமெரிக்க உணவு மற்றும் மருந்து நிர்வாகத்தால் அங்கீகரிக்கப்பட்ட ஐந்து மருந்தளிப்புகளை ( ஒர்லிஸ்டேட் (orlistat), லோர்காசெரின் (lorcaserin), ஃபென்டர்மைன்/ டோபிரமேட் (phentermine/topiramate, நல்ட்ரிக்சோன் / ப்யுரோபியோன் (naltrexone/bupropion) மற்றும் லிராகுளுடைடு (liraglutide) ) தற்போதைய வழிகாட்டுதல்கள் வழங்கியுள்ளன. ஆனாலும் இவற்றில் இரண்டு மருந்துகளுக்கு (ஃபென்டர்மைன்/ டோபிரமேட் (phentermine/topiramate) மற்றும் லோர்காசெரின்(lorcaserin)) ஐரோப்பாவில் ஒப்புதல் பெறப்படவில்லை.
ஒர்லிஸ்டேட் (orlistat), சிபுட்ராமின் (sibutramine), மற்றும் ஃபென்டர்மைன்/ டோபிரமேட் (phentermine/topiramate) போன்ற மருந்துகள் மிதமான அளவு இடையை குறைக்கும் என்பதற்கான ஆதாரங்களை நாங்கள் கண்டறிந்தோம். ஒர்லிஸ்டாட் மற்றும் ஃபென்டர்மைன்/ டோபிரமேட் (phentermine/topiramate) இரத்த அழுத்தத்தைக் குறைத்தது. ஆனால் சிபுட்ராமின் (sibutramine) இரத்த அழுத்தத்தை உயர்த்தியது. உயர் இரத்த அழுத்தம் உள்ளவர்களில் ரிமோனபான்ட் (rimonabant), லோர்காசெரின்(lorcaserin), லிராகுளுடைடு (liraglutide), அல்லது நல்ட்ரிக்சோன் / ப்யுரோபியோன் (naltrexone/bupropion) போன்ற மருந்துகளை ஆராய்ந்த ஆய்வுகள் எதையும் நாங்கள் கண்டறியவில்லை. மரணம் அல்லது நோய் பாதிப்பு அளவில் இந்த மருந்துகளின் விளைவுகளுக்கு எந்த ஆதாரமும் கிடைக்கப் பெறவில்லை. ஒர்லிஸ்டாட்‐ற்கு இரைப்பை‐குடல்வழி பாதிப்பும், சிபுட்ராமின்‐ற்கு உலர்ந்த வாய், மலச்சிக்கல் மற்றும் தலைவலி ஆகியவையும் ஃபென்டர்மைன்/ டோபிரமேட் (phentermine/topiramat க்கு உலர்ந்த வாய், அசாதாரண‐உணர்வுகள் போன்றவையும் பொதுவாக நிகழும் பக்க விளைவுகள்ஆகும்.
Authors' conclusions
Summary of findings
| Orlistat compared with placebo for weight reduction | |||||
| Patient or population: Men and non‐pregnant women ≥ 18 years old with essential hypertension Intervention: Orlistat Comparison: Placebo | |||||
| Outcomes | Illustrative comparative risks (per 1000 patients) | Effect estimate | No of Participants | Quality of the evidence | Comments |
| Change in systolic blood pressure as compared to placebo [mm Hg] from baseline to end of study | Not applicable | MD ‐2.46 [‐4.01, ‐0.90] | 2058 | ⊕⊕⊝⊝ | ‐ |
| Change in diastolic blood pressure as compared to placebo [mm Hg] from baseline to end of study | Not applicable | MD ‐1.92 [‐2.99, ‐0.85] | 2058 | ⊕⊕⊝⊝ | ‐ |
| Change in body weight as compared to placebo [kg] from baseline to end of study | Not applicable | MD ‐3.73 [‐4.65, ‐2.80] | 2080 | ⊕⊕⊕⊝ | ‐ |
| CI: confidence interval; MD: mean difference | |||||
| GRADE Working Group grades of evidence | |||||
| 1High risk of bias in included studies. 2Wide confidence intervals include non‐clinically important effect. | |||||
| Sibutramine compared with placebo for weight reduction | |||||
| Patient or population: Men and non‐pregnant women ≥ 18 years old with essential hypertension Intervention: Sibutramine Comparison: Placebo | |||||
| Outcomes | Illustrative comparative risks (per 1000 patients) | Effect estimates | No of Participants | Quality of the evidence | Comments |
| Change in systolic blood pressure as compared to placebo [mm Hg] from baseline to end of study | Not applicable | Not estimable | See comment | See comment | Variability measurements not available; |
| Change in diastolic blood pressure as compared to placebo [mm Hg] from baseline to end of study | Not applicable | MD 3.16 [1.40, 4.92] | 428 | ⊕⊕⊝⊝ | ‐ |
| Change in body weight as compared to placebo [kg] from baseline to end of study | Not applicable | MD ‐3.74 [‐4.84, ‐2.64] | 574 | ⊕⊕⊝⊝ | ‐ |
| CI: confidence interval; MD: mean difference | |||||
| GRADE Working Group grades of evidence | |||||
| 1High risk of bias in included studies. 2Small number of participants and studies. | |||||
Background
Description of the condition
Hypertension is a chronic condition associated with an increased risk of cardiovascular mortality and morbidity. It is estimated that high blood pressure leads to over 9 million deaths each year (WHO 2013). Lowering blood pressure levels in hypertensive people has been shown to be an effective means of reducing cardiovascular morbidity and mortality.
Epidemiological investigations have consistently found an association between high blood pressure and different lifestyles, one of them being excess body weight. Major guidelines recommend weight reduction as a first‐step intervention in the therapy of hypertensive people (CHEP 2014; ESH‐ESC 2013; JNC 2014; NICE 2011; WHO 2005). Body weight may be reduced by lifestyle modifications as well as pharmacological and invasive interventions.
Description of the intervention
For a select group of people for whom lifestyle interventions are unsuccessful, anti‐obesity drugs may be an option to help reduce body weight. Orlistat, sibutramine, and rimonabant were formerly the most commonly used anti‐obesity drugs, but only orlistat still has market approval for the long‐term treatment of obesity. Sibutramine was approved by the US Food and Drug Administration (FDA) in 1997 and by the European Medicines Agency (EMA) in 1999. However, preliminary results of the Sibutramine Cardiovascular Outcomes Trial (SCOUT 2010), presented in October 2009, showed an increased risk of serious cardiovascular events (such as heart attack or stroke) among people with known cardiovascular disease who were taking sibutramine. This led the FDA and EMA to recommend suspension of the marketing authorisation (EMA 2010; EMA 2010a; FDA 2010). In January 2010, Abbot Laboratories agreed to voluntarily withdraw sibutramine from the European market (Abbott 2010), and in October 2010 from the US market (FDA 2010a). Rimonabant received regulatory approval in several European countries in 2006, but failed to receive FDA approval after preclinical and clinical data raised concerns about an association between rimonabant intake and the increased incidence of psychiatric adverse events, including suicidality, an ill‐defined constellation of neurological signs and symptoms, and seizures (FDA 2007). In October 2008, the EMA recommended the suspension of rimonabant from the market because of newly available postmarketing analyses demonstrating detrimental effects versus placebo (EMA 2008; EMA 2008a). In January 2009, the European Commission decided to withdraw market authorisation for rimonabant in all countries of the European Union (EMA 2009). Since 2012, four new drugs (lorcaserin, liraglutide, phentermine/topiramate, and naltrexone/bupropion) have been approved by the FDA for obese (body mass index (BMI) ≥ 30 kg/m2) and overweight (BMI ≥ 27 kg/m2) people with at least one obesity‐related comorbidity. These medications have recently been quoted in guidelines for the long‐term pharmacological treatment of obesity (Apovian 2015). In Europe, liraglutide, which has also been approved for the treatment of diabetes mellitus type 2, and naltrexone/bupropion were approved for weight management in March 2015 by the EMA (EMA 2015; EMA 2015a). In 2013, the manufacturer of lorcaserin withdrew its application to the EMA after the Committee for Medicinal Products for Human Use raised safety concerns (EMA 2013), while the EMA refused marketing authorisation for phentermine/topiramate due to safety concerns (EMA 2013b).
How the intervention might work
Anti‐obesity drugs aim to reduce body weight and to maintain the weight reduction over a longer period. Orlistat is a gastric and pancreatic lipase inhibitor; sibutramine is a centrally acting monoamine‐reuptake inhibitor; and rimonabant is an endocannabinoid receptor antagonist (Padwal 2007). Liraglutide, a glucagon‐like peptide 1 (GLP‐1) receptor agonist, appears to regulate appetite by increasing feelings of satiety (Russell‐Jones 2009). The combination of phentermine, a neurostabiliser, and topiramate, an antiseizure medication, appears to have an additive effect on weight reduction (Aronne 2013). In combination with naltrexone, bupropion, a dopamine and norepinephrine reuptake inhibitor, reduces appetite and increases energy expenditure (Caixas 2014). The mechanisms by which these three medications cause weight loss are not yet fully understood. Lorcaserin is a selective serotonin receptor agonist and increases the sense of fullness (Taylor 2013). Dietary‐intervention studies in hypertensive people have shown a positive association between weight loss and blood pressure reduction (Horvath 2008). It therefore seems reasonable to suppose that medical weight‐reducing treatment may also lead to a fall in blood pressure.
Why it is important to do this review
For overweight or obese people with established hypertension, blood pressure should first be managed via non‐pharmacological interventions such as weight reduction (CHEP 2014; ESH‐ESC 2013; JNC 2014; NICE 2011; WHO 2005). Since anti‐obesity drugs may support the efforts of patients to reduce body weight, it is important that the physician be informed about the efficacy and potential harms of these drugs before prescribing them.
Systematic reviews and meta‐analyses have shown that pharmacological weight‐reducing interventions with orlistat, Horvath 2008 and Rucker 2007, rimonabant, Rucker 2007, lorcaserin, Chan 2013, and liraglutide, Zhang 2015, reduce both blood pressure and body weight. Treatment with sibutramine, Horvath 2008, Rucker 2007, and Kim 2003, and naltrexone/bupropion, Caixas 2014, reduced body weight but did not lower blood pressure. None of these reviews provided data that could answer the question of whether pharmacological weight reduction lowers the risk of mortality and other patient‐relevant endpoints. Two studies examining clinical endpoints for rimonabant, CRESCENDO 2010, and sibutramine, SCOUT 2010, have resulted in the drugs being withdrawn from the market. This left only orlistat as approved for the long‐term treatment of obesity in the last updated version of this review. Since then, the FDA has approved four new drugs (lorcaserin, phentermine/topiramate, naltrexone/bupropion, and liraglutide) for the long‐term treatment of obesity.
This systematic review is an update of the previously published Cochrane review (Siebenhofer 2013).
Objectives
Primary objectives:
To assess the long‐term effects of pharmacologically induced reduction in body weight in adults with essential hypertension on all‐cause mortality, cardiovascular morbidity, and adverse events (including total serious adverse events, withdrawal due to adverse events, and total non‐serious adverse events).
Secondary objectives:
To assess the long‐term effects of pharmacologically induced reduction in body weight in adults with essential hypertension on change from baseline in systolic blood pressure, change from baseline in diastolic blood pressure, and body weight reduction.
Methods
Criteria for considering studies for this review
Types of studies
The study design must meet the following criteria: all randomised controlled trials comparing pharmacologic interventions approved for long‐term weight management with placebo with a follow‐up of at least 24 weeks. The reason for including only studies with a follow‐up of at least 24 weeks was that studies of shorter duration cannot show long‐term effects. Any additional active care (for example antihypertensive medication) must have been applied to the active treatment group and control group.
Types of participants
Men and non‐pregnant women 18 years of age or older with essential hypertension (baseline blood pressure of at least 140 mm Hg systolic and/or a diastolic blood pressure of at least 90 mm Hg or people on antihypertensive treatment), for whom at least one of the following outcomes was reported: mortality, cardiovascular outcomes, adverse events, or blood pressure.
Types of interventions
Monotherapy with drugs for long‐term weight management (orlistat, sibutramine, rimonabant, phentermine/topiramate, lorcaserin, naltrexone/bupropion, or liraglutide).
Types of outcome measures
Primary outcomes
The primary outcomes were total mortality, cardiovascular morbidity, and adverse events (withdrawals due to adverse events, adverse events related to a certain anti‐obesity drug).
Secondary outcomes
Secondary outcomes were changes in systolic blood pressure, diastolic blood pressure, and body weight.
Search methods for identification of studies
Electronic searches
For the update of the review we searched the following electronic databases until 13 April 2015 to identify randomised, placebo‐controlled trials of orlistat, sibutramine, rimonabant, lorcaserin, phentermine/topiramate, naltrexone/bupropion, or liraglutide:
-
Cochrane Hypertension Specialised Register (up to April 2015)
-
Cochrane Central Register of Controlled Trials (CENTRAL) (2015, Issue 4) via the Cochrane Register of Studies Online
-
Ovid MEDLINE and MEDLINE In‐Process (1946 to April 2015)
-
Ovid EMBASE (1980 to April 2015)
The protocol stated that we considered only published papers for inclusion in this review. We also considered relevant data from one randomised controlled trial that had not yet been published for inclusion, as a manufacturing company (Hoffmann‐La Roche AG) provided relevant additional information for the Institute for Quality and Efficiency in Health Care report (IQWiG 2006). The Cochrane Hypertension Specialised Register includes searches of the WHO International Clinical Trials Registry Platform. We also searched the clinical trials registry ClinicalTrials.gov and reference lists of included trials and relevant systematic reviews and meta‐analyses.
The updated searches were based on a combination of subject headings and text words as documented in Appendix 1. The search strategy used in the previous review versions is documented in Appendix 2 and Appendix 3.
Searching other resources
We searched the reference lists of all relevant studies and systematic reviews for additional studies. We contacted authors of included studies to request information about any other relevant unpublished or ongoing studies.
Data collection and analysis
Selection of studies
Two review authors independently screened the title and abstract of each reference identified by the search and applied the inclusion criteria. Potentially relevant studies were retrieved in full and again two review authors independently decided, whether these studies met the inclusion criteria. In case of disagreement, we also obtained the full article and the two review authors inspected it independently. Differences in opinion were resolved by a third party. If a resolution of the disagreement was not possible, we classified the article as 'awaiting assessment' and contacted the authors of the study for clarification.
Data extraction and management
Two review authors independently extracted data using a data extraction form. Differences in data extraction were resolved by consensus, referring back to the original article. We sought information from the authors of the primary studies if necessary. We extracted, checked, and recorded the following data.
1. General information
The general information included all publications of a single trial, the sponsor of the trial (specified, known or unknown), and the country of publication.
2. Methods section
The information on the methods summarised the characteristics of the trial, participants, and interventions and the outcome measures used and reported in the publication.
2.1. Characteristics of the trial
The reported items included the design and duration of the trial, randomisation (and method), allocation concealment (and method), blinding (participants, people administering treatment, outcome assessors), and the check of blinding.
2.2. Characteristics of participants
This information included the number of participants in each group, how the participants were selected (random, convenience), the exclusion criteria used, and the general characteristics (for example age, gender, nationality, ethnicity). We extracted disease‐related information concerning duration of hypertension. We checked the similarity of groups at baseline as well as reports about withdrawals and losses to follow‐up (reasons/description), describing these in the 'Risk of bias' tables in Characteristics of included studies. If subgroups were analysed, the reported reasons and the method were noted.
2.3. Characteristics of interventions
The relevant information to be extracted was the duration of the intervention, length of follow‐up (in months), the type of anti‐obesity drug (orlistat, sibutramine, rimonabant, lorcaserin, phentermine/topiramate, naltrexone/bupropion, or liraglutide), the dose, and the administration route.
2.4. Characteristics of outcome measures
We reported the measures mentioned in the outcome section and any other outcomes measured in the study.
Assessment of risk of bias in included studies
Two review authors independently assessed trials fulfilling the inclusion criteria in order to evaluate methodological quality. Any differences in opinion were resolved by discussion with a third review author. We assessed all trials using the 'Risk of bias' assessment tool under the categories adequate sequence generation, allocation concealment, blinding, incomplete outcome data, selective reporting, and other biases (Higgins 2011).
Measures of treatment effect
We calculated mean differences for changes in blood pressure and body weight. We considered fixed‐effect and random‐effects models for the meta‐analyses. In case of between‐study variability, we presented the results of the random‐effects model. If standard deviations were unavailable, we approximated them on the basis of P values and sample sizes.
Dealing with missing data
We obtained relevant missing data from authors and from the Institute for Quality and Efficiency in Health Care report (IQWiG 2006). We evaluated important numerical data such as screened, eligible, and randomised patients as well as intention‐to‐treat (ITT) and per‐protocol (PP) population. We investigated attrition rates, for example dropouts, losses to follow‐up, and withdrawals. Issues of missing data, ITT, and PP were critically appraised and, if available, compared to the specification of primary outcome parameters and power calculations.
Assessment of heterogeneity
We assessed heterogeneity using Higgins I2. In case of substantial heterogeneity (I2 greater than 50%), we planned to perform sensitivity analyses and subgroup analyses for the following items: study quality, PP versus ITT analyses, sex, age, body mass index, concomitant diseases, ethnicity, blood pressure at baseline, blood pressure goals, concomitant antihypertensive therapy, and socioeconomic status.
Assessment of reporting biases
We assessed publication bias and small‐study effects in general using the funnel plot or other corrective analytical methods depending on the number of trials included in the systematic review.
Data synthesis
We summarised data statistically when they were available, sufficiently similar, and of sufficient quality. We performed analyses separately for each drug. We performed statistical analysis according to the statistical guidelines referenced in the newest version of the Cochrane Handbook for Systematic Reviews of Interventions (Higgins 2011).
Results
Description of studies
See: Characteristics of included studies; Characteristics of excluded studies
Results of the search
Our search of the electronic databases yielded 1047 records after correcting for duplication. The consensus was that on the basis of their abstracts, 903 of these were not relevant to the question under study and should be excluded.
The Institute for Quality and Efficiency in Health Care report provided data of an unpublished subgroup analysis of hypertensive people in the Xenical in the Prevention of Diabetes in Obese Subjects (XENDOS) study (IQWiG 2006; XENDOS 2001‐2006). We included the results section of this report and one corresponding citation as two additional publications of potential relevance. We identified no further studies from the reference lists of the included trials and relevant systematic reviews and meta‐analyses. We therefore identified 146 publications for further examination.
Thirty publications describing nine studies finally met the inclusion criteria after screening the full text of the selected publications (see Figure 1 for details of the PRISMA (Preferred Reporting Items for Systematic Reviews and Meta‐Analyses) statement ) (PRISMA 2009). Five publications on a potentially relevant ongoing trial were also among the excluded items because they only described the rationale for conducting the trial and its design (LEADER 2013). For details see Characteristics of ongoing studies.

Study flow diagram
All relevant studies were published after the year 2000 and were written in English, except the report from the Institute for Quality and Efficiency in Health Care, which was published in German.
Included studies
We have provided details of the characteristics of the included studies in the Characteristics of included studies table. The following gives a brief overview of the comparisons between orlistat and placebo, sibutramine and placebo, and phentermine/topiramate and placebo. No relevant study investigating rimonabant, liraglutide, lorcaserin, or naltrexone/bupropion was available for inclusion.
Orlistat vs placebo
All four included studies had a parallel, double‐blind design (Bakris 2002; Cocco 2005; Guy‐Grand 2004; XENDOS 2001‐2006). Only Cocco 2005 did not mention any industry sponsoring, and it was the only study that was performed as a single‐centre trial.
Participants and duration
The four included studies involved a total of 3132 hypertensive participants with a mean age of 46 to 55 years, a baseline systolic blood pressure (BP) of 142 to 154 mm Hg and a baseline diastolic BP of 85 to 98 mm Hg. Mean treatment duration was 6 to 48 months.
Interventions
Participants received either 120 mg orlistat three times daily or placebo in all studies.
Outcomes
Primary outcomes
No study included mortality and cardiovascular morbidity as predefined outcomes. All studies reported adverse events.
Secondary outcomes
All studies described the mean change in systolic and diastolic BP and the mean change in body weight.
Sibutramine vs placebo (marketing approval withdrawn)
All four included studies had a parallel, double‐blind design and mentioned industry sponsorship (Fanghänel 2003; Faria 2002; McMahon 2000; McMahon 2002). Two studies were performed as single‐centre studies (Fanghänel 2003; Faria 2002); the two multicentre studies did not provide information on the numbers of study centres (McMahon 2000; McMahon 2002).
Participants and duration
The four included studies involved a total of 619 hypertensive participants with a mean age of 46 to 53 years, a baseline systolic BP of 129 to 150 mm Hg and a baseline diastolic BP of 82 to 94 mm Hg. Mean treatment duration was 6 to 12 months.
Interventions
Two studies compared 10 mg sibutramine versus placebo once daily (Fanghänel 2003; Faria 2002). In the two other studies (McMahon 2000; McMahon 2002), the initial dose of 5 mg of sibutramine was titrated up to 20 mg once daily within the first eight weeks.
Outcomes
Primary outcomes
No study included mortality and cardiovascular morbidity as predefined outcomes. All studies reported on adverse events.
Secondary outcomes
All studies described the mean change in systolic and diastolic BP and the mean change in body weight.
Phentermine/topiramate vs placebo
The new included study was a multicentre study with 93 study sites in the US (CONQUER 2013). The study had a parallel, double‐blind design and the industry sponsor was mentioned.
Participants and duration
The included study involved a total of 1305 participants in the hypertensive subgroup with a mean age of 53 years, a mean baseline systolic BP of 134 mm Hg and a mean baseline diastolic BP of 84 mm Hg. Among the hypertensive subgroup, 216 participants had uncontrolled hypertension at baseline. The treatment duration was 56 weeks.
Interventions
The study compared two different dose regimens of phentermine/topiramate once daily versus placebo. All participants in the active groups received an initial dose of 7.5 mg phentermine and 23 mg topiramate. During an initial four‐week titration period, doses were increased weekly (3.75 mg phentermine and 23 mg topiramate) until the assigned dosages of 7.5 mg phentermine/46.0 mg topiramate (group low dose) or 15 mg phentermine/92.0 mg topiramate (group high dose) were achieved. The assigned dosages were maintained for 52 weeks.
Outcomes
Primary outcomes
The study did not include mortality and cardiovascular morbidity as predefined outcomes. Adverse events were reported.
Secondary outcomes
The study described the mean change in systolic and diastolic BP and the mean percentage change in body weight.
Excluded studies
The main reason for exclusion was a lack of data for the hypertensive subgroup in studies including normotensive as well as hypertensive participants. Other reasons for exclusion were not describing a randomised controlled trial, not including participants with essential hypertension, having a duration of intervention less than 24 weeks, reporting outcomes that were not relevant for this review, or including different accompanying antihypertensive therapies in the study groups. Reasons for excluding each trial are provided in the Characteristics of excluded studies table.
Risk of bias in included studies
The judgements of the risk of bias for all included studies are shown in the 'Risk of bias' summary figures (Figure 2; Figure 3). For details see the 'Risk of bias' tables in Characteristics of included studies. The following provides a brief overview.

Risk of bias graph: review authors' judgements about each risk of bias item presented as percentages across all included studies.

Risk of bias summary: review authors' judgements about each risk of bias item for each included study.
Allocation
Orlistat vs placebo
In one study the method of randomisation was not reported (Bakris 2002), and in two studies the method of concealment was not described (Bakris 2002; Cocco 2005).
Sibutramine vs placebo (marketing approval withdrawn)
Only one study adequately described the method of randomisation and concealment (Fanghänel 2003).
Phentermine/topiramate vs placebo
The included study adequately described the method of randomisation and concealment (CONQUER 2013).
Blinding
Orlistat vs placebo
While all included trials were described as double blind, three trials provided too little information, and the blinding of participants and key study personnel was uncertain (Bakris 2002; Cocco 2005; Guy‐Grand 2004). Based on the authors' information, we can only assume that blinding took place throughout the duration of one study (Cocco 2005).
Sibutramine vs placebo (marketing approval withdrawn)
While all included trials were described as double blind, two trials provided too little information, and the blinding of participants and key study personnel was uncertain (McMahon 2000; McMahon 2002). In the other studies, we can assume that blinding occurred throughout the study duration for participants and study personnel, but no information was available on the blinding of outcome assessors.
Phentermine/topiramate vs placebo
The included study was described as double blind. The investigators, participants, and study sponsors were masked to treatment assignment, and all study drugs were administered as capsules that were identical in size and appearance (CONQUER 2013).
Incomplete outcome data
Orlistat vs placebo
In two studies, the outcome data description was complete: Cocco 2005 had no losses to follow‐up, and Bakris 2002 described all reasons for withdrawals and losses to follow‐up.
In Guy‐Grand 2004, withdrawals were only reported for the whole study population and not for the hypertensive subgroup, and in XENDOS 2001‐2006, the documentation of reasons for withdrawals was incomplete.
Sibutramine vs placebo (marketing approval withdrawn)
In none of the studies were outcome data adequately assessed. In Fanghänel 2003, 14% of randomised participants were not analysed, and Faria 2002 presented only a completers analysis. In both McMahon studies (McMahon 2000; McMahon 2002), some reasons for participants’ withdrawal from the study were not reported.
Phentermine/topiramate vs placebo
The total number of withdrawals was only reported for the whole study population and not for the hypertensive subgroup of the study (CONQUER 2013). For the hypertensive subgroup, only the number of withdrawals due to adverse events was reported, therefore the documentation of reasons for withdrawals was incomplete.
Selective reporting
Orlistat vs placebo
As either no study protocol was provided (Bakris 2002; Cocco 2005; Guy‐Grand 2004), or no full publication was obtainable (XENDOS 2001‐2006), or more outcomes were reported than were prespecified (Bakris 2002), we classified the risk of bias for selective reporting as uncertain for all studies.
Sibutramine vs placebo (marketing approval withdrawn)
In none of the trials was a study protocol available. In addition, one study showed inconsistencies between different publications (Faria 2002), and another study had an inconsistent participant flow (Fanghänel 2003). We thus classified the risk of bias for selective reporting as uncertain for all studies.
Phentermine/topiramate vs placebo
No study protocol was available for the study (CONQUER 2013). We thus classified the risk of bias for selective reporting as uncertain.
Other potential sources of bias
Orlistat vs placebo
No trial included in the review reported any significant differences between groups in the main characteristics of participants at baseline. However, in Bakris 2002 and XENDOS 2001‐2006, the combination of a high withdrawal rate and the unknown length of involvement of participants in the trial increases the risk of bias, even when last observation carried forward (LOCF) analysis is used.
Sibutramine vs placebo (marketing approval withdrawn)
Two studies provided only completers analyses with a high withdrawal rate (Fanghänel 2003; Faria 2002). In the two other trials, the unknown length of involvement of participants in the trial increases risk of bias, even when LOCF analysis is used (McMahon 2000; McMahon 2002).
Phentermine/topiramate vs placebo
We could identify no other potential source of bias in the included study (CONQUER 2013).
Effects of interventions
See: Summary of findings for the main comparison Summary of findings for orlistat versus placebo; Summary of findings 2 Summary of findings for sibutramine versus placebo
Orlistat vs placebo
See: summary of findings Table for the main comparison
Primary outcomes
Mortality
Three of four studies reported on mortality. No deaths were reported in either Bakris 2002 or Cocco 2005. In XENDOS 2001‐2006, there were two deaths in the orlistat‐treated group in the first subgroup analysis (diastolic BP ≥ 90 mm Hg) and one death in the orlistat group in the second subgroup analysis (systolic BP ≥ 140 mm Hg).
Cardiovascular morbidity
Two studies presented data on cardiovascular morbidity. In Bakris 2002, two participants in the orlistat group suffered a myocardial infarction, two had chest pain, and one had an episode of atrial fibrillation. In the placebo group, one participant had a myocardial infarction, one had worsening atherosclerotic coronary artery disease, and two had an episode of chest pain. Cocco 2005 reported that in participants with resting left ventricular ejection fraction (LVEF) below 50% at baseline, LVEF did not change with placebo (0.6%), but was increased by 4.3% in the orlistat group (P < 0.001).
Adverse events
For details on adverse events see Table 1.
| Study | Adverse events | Results |
| Orlistat vs placebo | ||
| Bakris 2002 | total thereof leading to withdrawal serious gastrointestinal thereof leading to withdrawal musculoskeletal | 89% of P [O] vs 71% of P [P], P < 0.001 7% [O] vs 7% [P] 14 P (12%) [O] vs 15 P (9%) [P] 200 P (73%) [O] vs 120 P (44%) [P], P < 0.001 15 P (8%) [O] vs 6 P (5%) [P] 23% of P [O] vs 16% [P], P < 0.05 |
| Cocco 2005 | total serious gastrointestinal | nr 0 P [O] vs 0 P [P] 16 P (36%) [O]a vs 11 P (24%) [P]a |
| Guy‐Grand 2004 | total serious | nrb nrb |
| XENDOS 2001‐2006 | total leading to withdrawal serious gastrointestinal musculoskeletal nervous system dermatological vascular | 99% of P [OD] vs 96% of P [PD] 99% of P [OS] vs 97% of P [PS] 9% of P [OD] vs 4% of P [PD] 9% of P [OS] vs 4% of P [PS] 18% of P [OD] vs 12% of P [PD] 18% of P [OS] vs 12% of P [PS] 93% of P [OD] vs 70% of P [PD] 93% of P [OS] vs 71% of P [PS] 65% of P [OD] vs 62% of P [PD] 65% of P [OS] vs 63% of P [PS] 39% of P [OD] vs 39% of P [PD] 40% of P [OS] vs 37% of P [PS] 20% of P [OD] vs 17% of P [PD] 22% of P [OS] vs 17% of P [PS] 17% of P [OD] vs 19% of P [PD] 17% of P [OS] vs 19% of P [PS] |
| Sibutramine vs placebo | ||
| Fanghaenel 2003 | total constipation dizziness dry mouth headache insomnia restlessness | 14 P (21 E) [S] vs 13 P (20 E) [P] 4 P [S] vs 2 P [P] 1 P [S] vs 1 P [P] 4 P [S] vs 2 P [P] 5 P [S] vs 2 P [P] 1 P [S] vs 1 P [P] 1 P [S] vs 0 P [P] |
| Faria 2002‐2005 | total dry mouth arthralgia | nr 37% of P [S] vs 9% of P [P], P < 0.005 16% of P [S] vs 2% of P [P], P = 0.03 |
| McMahon 2002 | total serious treatment related leading to withdrawal (mostly hypertension) dry mouth headache | 141 P (97%) [S] vs 65 P (88%) [P] 9 P (6%) [S] vs 5 P (7%) [P] 2 E [S] vs 0 E [P] 23 P (16%) [S] vs 4 P (5%) [P] 30 P (21%) [S] vs 0 P [P] 41 P (28%) [S] vs 17 P (23%) [P] |
| McMahon 2000 | total leading to withdrawal (mostly hypertension) dry mouth headache constipation rash | nr 30 P (20%) [S] vs 8 P (11%) [P] 29 P (19%) [S] vs 2 P (3%) [P], P < 0.05 37 P (25%) [S] vs 21 P (28%) [P] 25 P (17%) [S] vs 2 P (3%) [P], P < 0.05 16 P (11%) [S] vs 2 P (3%) [P] |
| Phentermine/topiramate vs placebo | ||
| CONQUER 2013 | total leading to withdrawal serious cardiac adverse events dry mouth paresthaesia constipation upper respiratory tract infection nasopharyngitis dysgeusia insomnia headache dizziness sinusitis | 85.4% vs 88.8% vs 77.3% 11.9% vs 19.8% vs 9.7% 3.4% (Phen/Top [LD]) vs 3.7% (Phen/Top [HD]) vs 4.2% [P] 0.8% vs 1.2% vs 0.6% 14.2% (Phen/Top [LD]) vs 22.7% (Phen/Top [HD]) vs 2.3% [P] 14.2% (Phen/Top [LD]) vs 22.3% (Phen/Top [HD]) vs 2.3% [P] 15.7% (Phen/Top [LD]) vs 18.1% (Phen/Top [HD]) vs 5.5% [P] 12.6% (Phen/Top [LD]) vs 12.1% (Phen/Top [HD]) vs 11.8% [P] 10.3% (Phen/Top [LD]) vs 10.2% (Phen/Top [HD]) vs 8.8% [P] 7.7% (Phen/Top [LD]) vs 11.0% (Phen/Top [HD]) vs 0.8% [P] 5.7% (Phen/Top [LD]) vs 11.0% (Phen/Top [HD]) vs 4.8% [P] 5.0% (Phen/Top [LD]) vs 10.8% (Phen/Top [HD]) vs 8.4% [P] 6.5% (Phen/Top [LD]) vs 12.1% (Phen/Top [HD]) vs 3.1% [P] 5.4% (Phen/Top [LD]) vs 8.3% (Phen/Top [HD]) vs 6.5% [P] |
E: events. nr: not reported. [O]: orlistat. [OD]: orlistat and diastolic blood pressure ≥ 90 mm Hg. [OS]: orlistat and systolic blood pressure ≥ 140 mm Hg. P: participants. [P]: placebo. Phen/Top [HD]: phentermine/topiramate high dose (15 mg/92 mg). Phen/Top [LD]: phentermine/topiramate low dose (7.5 mg/46 mg). [PD]: placebo and diastolic blood pressure ≥ 90 mm Hg. [PS]: placebo and systolic blood pressure ≥ 140 mm Hg. [S]: sibutramine.
aNo data on adverse events were reported for the whole study duration. The data above refer to 4 and 3 weeks of treatment in the orlistat and placebo group, respectively. After 3 months, the number of participants with events decreased to 5(11%)[O] with flatulence and mild abdominal cramps versus 6(13%)[P] with nausea and hunger feeling.
bData were not available for the hypertensive subgroup, only for the whole study population (withdrawal due to defecation troubles in 10 [O] versus 2 [P] participants).
At least one adverse event was reported by significantly more participants in the orlistat‐treated group (89%) than in the placebo‐treated group (71%) with a P value of < 0.001. Of those, 7% of participants in the orlistat group versus 7% of participants in the placebo group withdrew. Twelve per cent of all adverse events in the orlistat‐treated group versus 9% in the placebo‐treated group were classified as serious adverse events, and none was classified as being related to study medication. Gastrointestinal side effects were significantly higher in the orlistat‐treated group than in the placebo group (73% versus 44%; P < 0.001); 8% of those participants in the orlistat group and 5% in the placebo group stopped taking the medication for this reason. Musculoskeletal side effects were also reported significantly more often in the orlistat versus the placebo group (23% versus 16%, P < 0.05).
As reported by the authors, side effects were mild. No overall adverse events were reported. Gastrointestinal side effects were the most common adverse events and were described for 24% of the placebo group within the first three weeks and for 36% of the orlistat group within the first four weeks.
Data were only presented for the whole study group, no information on the hypertensive subgroup was provided.
First subgroup (diastolic BP ≥ 90 mm Hg): Side effects were reported in 99% of participants in the orlistat and 96% of participants in the placebo group. Eighteen per cent of participants in the orlistat group and 12% of participants in the placebo group experienced severe adverse events. Gastrointestinal side effects were more common in the orlistat versus the placebo group (93% versus 70%). Musculoskeletal, nervous, dermatological, and vascular events were comparable in both treatment groups. Nine per cent withdrew due to side effects in the orlistat versus 4% in the placebo group, but it is not clear whether the reported side effects were study drug related.
Second subgroup (systolic BP ≥ 140 mm Hg): Side effects were reported in 99% of participants in the orlistat and 97% of participants in the placebo group. Eighteen per cent of participants in the orlistat group and 12% of participants in the placebo group experienced severe adverse events. Gastrointestinal side effects were more common in the orlistat versus the placebo group (93% versus 71%). Musculoskeletal, nervous, dermatological, and vascular events were comparable in both treatment groups. Nine per cent withdrew due to side effects in the orlistat versus 4% in the placebo group. It is not clear whether the reported side effects were study drug related.
Secondary outcomes
For details on secondary outcome data see Table 2, Table 3, Table 4. Due to between‐study variability, we have presented results from random‐effects models in the following analyses.
| Study | Baselinea | 6 moa | 12 moa | 48 moa | Change from baseline to endpointa |
| Orlistat vs placebo | |||||
| Bakris 2002b Orlistat Placebo | 101 (1)c 102 (1)c | nr nr | nr nr | ‐ ‐ | P < 0.001 ‐5.4 (6.4) ‐2.7 (6.4) |
| Cocco 2005 Orlistat Placebo | 107 (6) 106 (6) | 102 (4) 104 (5) | ‐ ‐ | ‐ ‐ | P < 0.001 ‐5.4d ‐2.5d |
| Guy‐Grand 2004 Orlistat Placebo | 94 (1)c 94 (1)c | nr nr | ‐ ‐ | ‐ ‐ | P < 0.0001 ‐5.8 (0.3) ‐1.8 (0.2) |
| XENDOS 2001‐2006 Orlistat [OD] Placebo [PD] Orlistat [OS] Placebo [PS] | 117 (18) 115 (18) 117 (17) 116 (18) | 106 (17) 108 (18) 106 (17) 109 (18) | 105 (18) 108 (19) 105 (17) 110 (19) | 110 (19) 111 (20) 110 (18) 113 (19) | P < 0.001 ‐6.6 (8.6) ‐3.8 (7.8) P < 0.001 ‐6.8 (8.7) ‐3.2 (7.4) |
| Sibutramine vs placebo | |||||
| Fanghaenel 2003 Sibutramine Placebo | 75 (10) 78 (9) | 70 (10) 75 (9) | ‐ ‐ | ‐ ‐ | significant ‐5.5 (‐3.8; ‐7.1)e ‐3.4 (‐1.9; ‐5.0)e |
| Faria 2002‐2005 Sibutramine Placebo | 100 (19) 97 (14) | 93 (18) 94 (15) | ‐ ‐ | ‐ ‐ | P < 0.001 ‐6.8 (2.3) ‐2.4 (4.2) |
| McMahon 2002 Sibutramine Placebo | 97 (16) 99 (14) | nr nr | nr nr | ‐ ‐ | P < 0.05 ‐4.5 ‐0.4 |
| McMahon 2000 Sibutramine Placebo | 97 (13) 96 (17) | nr nr | nr nr | ‐ ‐ | P < 0.05 ‐4.4 ‐0.5 |
| Phentermine/topiramate vs placebo | |||||
| CONQUER 2013 Phen/Top [LD] Phen/Top [HD] Placebo | 104 (18)f | nr nr nr | nr nr nr | ‐ ‐ ‐ | P < 0.0001g ‐8.1% ‐10.1% ‐1.9% |
Mo: months. nr: not reported. [O]: orlistat. [OD]: orlistat and diastolic blood pressure ≥ 90 mm Hg. [OS]: orlistat and systolic blood pressure ≥ 140 mm Hg. P: participants. [P]: placebo. Phen/Top [HD]: phentermine/topiramate high dose (15 mg/92 mg). Phen/Top [LD]: phentermine/topiramate low dose (7.5 mg/46 mg). [PD]: placebo and diastolic blood pressure ≥ 90 mm Hg. [PS]: placebo and systolic blood pressure ≥ 140 mm Hg. [S]: sibutramine. SD: standard deviation.
aMean kg (SD), unless otherwise indicated.
bData are reported for 267 of 278 [O] and 265 of 276 [P] participants only.
cReported as being the standard deviation but probably the standard error due to its small number.
dPublished values are different, but data were corrected after personal communication with the author.
e95% confidence interval.
fReported only combined for all three study groups.
gFor each intervention group versus placebo.
| Study | Baselinea | 6 moa | 12 moa | 48 moa | Change from baseline to endpointa |
| Orlistat vs placebo | |||||
| Bakris 2002b Orlistat Placebo | 154 (13) 151 (13) | nr nr | nr nr | ‐ ‐ | ns ‐13.3 (15.2) ‐11.0 (15.0) |
| Cocco 2005 Orlistat Placebo | 146 (10) 142 (6) | 142 (13) 141 (9) | ‐ ‐ | ‐ ‐ | P = 0.025 ‐4.3 ‐0.9 |
| Guy‐Grand 2004 Orlistat Placebo | 150 (1)c 152 (1)c | nr nr | ‐ ‐ | ‐ ‐ | ns ‐9.8 (1) ‐9.8 (1) |
| XENDOS 2001‐2006 Orlistat [OD]d Placebo [PD]d Orlistat [OS]d Placebo [PS]d | 146 (13) 146 (12) 149 (10) 149 (8) | 135 (14) 136 (15) 125 (14) 138 (14) | 135 (14) 138 (16) 135 (14) 140 (14) | 137 (15) 139 (16) 138 (15) 140 (15) | P = 0.024 ‐8.8 (14.8) ‐6.4 (15.1) P < 0.002 ‐11.5 (14.9) ‐8.6 (14.3) |
| Sibutramine vs placebo | |||||
| Fanghaenel 2003e Sibutramine Placebo | 139 (9) 139 (13) | 125 (9) 123 (10) | ‐ ‐ | ‐ ‐ | ns ‐13.9f ‐16.5f |
| Faria 2002‐2005 Sibutramine Placebo | 150 (18) 150 (15) | 146 (15) 149 (22) | ‐ ‐ | ‐ ‐ | ns ‐4.6f ‐0.6f |
| McMahon 2002 Sibutramine Placebo | 129 (11) 129 (11) | nr nr | 133 130 | ‐ ‐ | P = 0.0497 3.8 1.1 |
| McMahon 2000 Sibutramine Placebo | 134 (10) 134 (11) | nr nr | nr nr | ‐ ‐ | ns 2.7 1.5 |
| Phentermine/topiramate vs placebo | |||||
| CONQUER 2013 Phen/Top [LD] Phen/Top [HD] Placebo | 134 (nr) 133 (nr) 135 (nr) | nr nr nr | nr nr nr | ‐ ‐ ‐ | P = 0.0475 [LD] P < 0.0001 [HD] ‐6.9 ‐9.1 ‐4.9 |
Mo: months. nr: not reported. [O]: orlistat. [OD]: orlistat and diastolic blood pressure ≥ 90 mm Hg. [OS]: orlistat and systolic blood pressure ≥ 140 mm Hg. P: participants. [P]: placebo. Phen/Top [HD]: phentermine/topiramate high dose (15 mg/92 mg). Phen/Top [LD]: phentermine/topiramate low dose (7.5 mg/46 mg). [PD]: placebo and diastolic blood pressure ≥ 90 mm Hg. [PS]: placebo and systolic blood pressure ≥ 140 mm Hg. [S]: sibutramine. SD: standard deviation.
aMean mm Hg (SD), unless otherwise indicated.
bData are reported for 267 of 278 [O] and 265 of 276 [P] participants only.
cReported as being the standard deviation but probably the standard error due to its small number.
dBased on last observation carried forward data on 399 [OD], 423 [PD], 493 [OS], and 504 [PS] participants.
eData at baseline were recorded after a two‐week wash‐out period of antihypertensive drugs for diagnostic confirmation of hypertension.
fCalculated.
| Study | Baselinea | 6 moa | 12 moa | 48 moa | Change from baseline to endpointa |
| Orlistat vs placebo | |||||
| Bakris 2002b Orlistat Placebo | 98 (4) 98 (4)c | nr nr | nr nr | ‐ ‐ | P = 0.002 ‐11.4 (8.3) ‐9.2 (8.4) |
| Cocco 2005 Orlistat Placebo | 88 (7) 85 (6) | 84 (9) 85 (7) | ‐ ‐ | ‐ ‐ | P = 0.012 ‐3.6 ‐0.8 |
| Guy‐Grand 2004 Orlistat Placebo | 97 (0)d 97 (0)d | nr nr | ‐ ‐ | ‐ ‐ | ns ‐7.5 (0.6) ‐7.3 (0.6) |
| XENDOS 2001‐2006 Orlistat [OD]e Placebo [PD]e Orlistat [OS]e Placebo [PS]e | 95 (6) 95 (5) 91 (9) 91 (8) | 86 (8) 88 (9) 84 (9) 87 (9) | 86 (8) 88 (10) 85 (9) 88 (10) | 87 (9) 89 (10) 86 (9) 88 (10) | P < 0.006 ‐8.1 (9.3) ‐6.2 (9.9) P < 0.001 ‐5.0 (9.9) ‐3.0 (10.4) |
| Sibutramine vs placebo | |||||
| Fanghaenel 2003f Sibutramine Placebo | 93 (7) 92 (8) | 82 (5) 80 (5) | ‐ ‐ | ‐ ‐ | ns ‐11.4g ‐11.7g |
| Faria 2002‐2005 Sibutramine Placebo | 91 (12) 94 (12) | 92 (13) 92 (14) | ‐ ‐ | ‐ ‐ | ns 1.0g ‐2.06g |
| McMahon 2002 Sibutramine Placebo | 82 (6) 83 (6) | nr nr | 86 83 | ‐ ‐ | P = 0.004 3.0 ‐0.1 |
| McMahon 2000 Sibutramine Placebo | 84 (5) 84 (6) | nr nr | nr nr | ‐ ‐ | P < 0.05 2.0 ‐1.3 |
| Phentermine/topiramate vs placebo | |||||
| CONQUER 2013 Phen/Top [LD] Phen/Top [HD] Placebo | 83 (nr) 83 (nr) 85 (nr) | nr nr nr | nr nr nr | ‐ ‐ ‐ | P = 0.0400 [LD] P = 0.0003 [HD] ‐5.2 ‐5.8 ‐3.9 |
Mo: months. nr: not reported. [O]: orlistat. [OD]: orlistat and diastolic blood pressure ≥ 90 mm Hg. [OS]: orlistat and systolic blood pressure ≥ 140 mm Hg. P: participants. [P]: placebo. Phen/Top [HD]: phentermine/topiramate high dose (15 mg/92 mg). Phen/Top [LD]: phentermine/topiramate low dose (7.5 mg/46 mg). [PD]: placebo and diastolic blood pressure ≥ 90 mm Hg. [PS]: placebo and systolic blood pressure ≥ 140 mm Hg. [S]: sibutramine. SD: standard deviation.
aMean mm Hg (SD), unless otherwise indicated.
bData are reported for 267 of 278 [O] and 265 of 276 [P] participants only.
cThe standard deviation was published as being 35 but should probably be 3.5.
dReported as being the standard deviation but probably the standard error due to its small number.
eBased on last observation carried forward data on 399 [OD], 423 [PD], 493 [OS], and 504 [PS] participants.
fData at baseline were recorded after a two‐week wash‐out period of antihypertensive drugs for diagnostic confirmation of hypertension.
gCalculated.
Changes in systolic blood pressure
We could include all four studies investigating the effects of orlistat on systolic BP in the meta‐analysis. For the XENDOS study (XENDOS 2001‐2006), we used the results after 12 months’ study duration for the subgroup of participants with diastolic BP ≥ 90 mm Hg at baseline for the analysis. There was a significant reduction in systolic BP with a mean difference (MD) of ‐2.5 mm Hg (95% confidence interval (CI) ‐4.0 to ‐0.9) in favour of orlistat. The test of heterogeneity gave a P value of 0.2 (I2 = 36%) (see Analysis 1.1, Figure 4). Differences in study quality could not explain heterogeneity. We could deduce no plausible explanation for heterogeneity from differences in study design, study duration, sample sizes, interventions, or characteristics of included participants.
![Forest plot of comparison: 1 Orlistat versus placebo, outcome: 1.1 Change in systolic blood pressure from baseline to endpoint [mm Hg].](/cdsr/doi/10.1002/14651858.CD007654.pub4/media/CDSR/CD007654/rel0004/CD007654/image_n/nCD007654-AFig-FIG04.png)
Forest plot of comparison: 1 Orlistat versus placebo, outcome: 1.1 Change in systolic blood pressure from baseline to endpoint [mm Hg].
Changes in diastolic blood pressure
We could include all four studies investigating the effects of orlistat on diastolic BP in the meta‐analysis. For the XENDOS study (XENDOS 2001‐2006), we used the results for the subgroup of participants with diastolic BP ≥ 90 mm Hg at baseline (subgroup 1) after 12 months' study duration for the analysis. Diastolic BP was also significantly reduced in participants treated with orlistat with a MD of ‐1.9 mm Hg (95% CI ‐3.0 to ‐0.9). The test of heterogeneity gave a P value of 0.1 (I2 = 47%) (see Analysis 1.2, Figure 5). Differences in study quality could not explain heterogeneity. We could deduce no plausible explanation for heterogeneity from differences in study design, study duration, sample sizes, interventions, or characteristics of included participants.
![Forest plot of comparison: 1 Orlistat versus placebo, outcome: 1.2 Change in diastolic blood pressure from baseline to endpoint [mm Hg].](/cdsr/doi/10.1002/14651858.CD007654.pub4/media/CDSR/CD007654/rel0004/CD007654/image_n/nCD007654-AFig-FIG05.png)
Forest plot of comparison: 1 Orlistat versus placebo, outcome: 1.2 Change in diastolic blood pressure from baseline to endpoint [mm Hg].
Body weight
Orlistat was found to lower body weight significantly more effectively than placebo in all studies. The meta‐analysis of orlistat studies obtained a MD of ‐3.7 kg (95% CI ‐4.7 to ‐2.8). The test of heterogeneity gave a P value of 0.03 (I2 = 66%) (see Analysis 1.3, Figure 6). Differences in study quality could not explain heterogeneity. We could deduce no plausible explanation for heterogeneity from differences in study design, study duration, sample sizes, interventions, or characteristics of included participants.
![Forest plot of comparison: 1 Orlistat versus placebo, outcome: 1.3 Change in body weight from baseline to endpoint [kg].](/cdsr/doi/10.1002/14651858.CD007654.pub4/media/CDSR/CD007654/rel0004/CD007654/image_n/nCD007654-AFig-FIG06.png)
Forest plot of comparison: 1 Orlistat versus placebo, outcome: 1.3 Change in body weight from baseline to endpoint [kg].
Subgroup analyses
Not performed due to lack of data.
Sensitivity analyses
Not performed due to lack of data.
Publication and small‐study bias
A clear interpretation of the funnel plot was not possible, which we mainly attributed to the relatively small number of included studies.
Sibutramine vs placebo (marketing approval withdrawn)
See: summary of findings Table 2
Primary outcomes
Mortality
Only one study reported on mortality (McMahon 2002), and there were no deaths in either treatment group.
Cardiovascular morbidity
None of the four studies presented data on cardiovascular morbidity.
Adverse events
For details on adverse events see Table 1.
In the sibutramine group, 14 participants reported 21 adverse events. In the placebo group, 13 participants reported 20 adverse events. None of the adverse events were associated with withdrawals from treatment. The most common adverse events in the sibutramine group were constipation, headache, and dry mouth.
Overall numbers of adverse events were not reported. Dry mouth occurred significantly more often in the sibutramine group (37%) versus in the placebo group (9%) (P < 0.005). Participants also suffered significantly more often from arthralgia in the sibutramine group (16%) versus in the placebo group (2%) (P value = 0.03).
Side effects were reported in 97% of participants in the sibutramine group versus 88% of participants in the placebo group, which was not statistically significantly different. Sixteen per cent of participants in the sibutramine group versus 5% in the placebo group discontinued because of adverse events. The main reason for discontinuation was a protocol‐defined increase in blood pressure. The rates of withdrawal due to hypertension did not differ between the groups (P > 0.05). As absolute numbers were missing, we could not discern a trend in favour of either sibutramine or placebo. Headache and dry mouth were the most frequent side effects in the sibutramine group. The rates of serious adverse events of 6% in the sibutramine group versus 7% in the placebo group were comparable. Two events in the sibutramine group versus no events in the placebo group were possibly related to study drug.
Overall numbers of adverse events and serious adverse events were not reported. Twenty per cent of participants in the sibutramine group versus 11% in the placebo group discontinued because of adverse events. The main reason for discontinuation was high blood pressure, reported in 5% of participants in the sibutramine group versus 1% in the placebo group. Dry mouth (19% versus 3%) and constipation (17% versus 3%) were the most frequent side effects in the sibutramine group, with P < 0.05 for both comparisons.
Secondary outcomes
For details on secondary outcome data see Table 2, Table 3, Table 4.
Changes in systolic blood pressure
As variability measurements were not available, a meta‐analysis was not possible. In two studies blood pressure decreased until study end in both treatment arms (Fanghänel 2003; Faria 2002). In one of these studies, the decrease in the placebo group was greater than in the sibutramine group, without reaching statistical significance (Fanghänel 2003). In the other study, systolic BP decreased more in the sibutramine group without reaching statistical significance (Faria 2002). The other two studies found an increase in systolic BP between baseline and follow‐up. In one study, the mean increase in systolic BP between the treatment groups was statistically higher in the sibutramine group with a P value of 0.05 (McMahon 2002). The last study also showed a more pronounced increase in systolic BP in the sibutramine group versus the placebo group, but it was not statistically significant (McMahon 2000).
Changes in diastolic blood pressure
We could include two studies investigating the effects of sibutramine on diastolic BP in a meta‐analysis. For McMahon 2000 and McMahon 2002, we could calculate standard deviations from provided P values. No variability measurements were available for the other studies (Fanghänel 2003; Faria 2002).
A combined analysis for the diastolic BP of the remaining two studies by McMahon showed a statistically significant difference between sibutramine and placebo, with a detrimental effect in participants treated with sibutramine with a MD +3.2 mm Hg (95% CI +1.4 to +4.9) (McMahon 2000;McMahon 2002). The test of heterogeneity gave a P value of 0.9 (I2 = 0%) (see Analysis 2.1, Figure 7).
![Forest plot of comparison: 2 Sibutramine versus placebo, outcome: 2.1 Change in diastolic blood pressure from baseline to endpoint [mm Hg].](/cdsr/doi/10.1002/14651858.CD007654.pub4/media/CDSR/CD007654/rel0004/CD007654/image_n/nCD007654-AFig-FIG07.png)
Forest plot of comparison: 2 Sibutramine versus placebo, outcome: 2.1 Change in diastolic blood pressure from baseline to endpoint [mm Hg].
The other two studies showed the following results: One study reported a decrease in diastolic BP in both treatment groups (Fanghänel 2003), without any statistically significant difference between the groups. In the other study (Faria 2002), diastolic BP decreased in the placebo group only, whereas an increase in diastolic BP in the sibutramine group was observed. This difference was not statistically significantly different.
Body weight
Sibutramine was found to lower body weight significantly more effectively than placebo in all four studies. The meta‐analysis of sibutramine studies obtained a MD of ‐3.7 kg (95% CI ‐4.8 to ‐2.6). The test of heterogeneity gave a P value of 0.4 (I2 = 3%) (see Analysis 2.2, Figure 8).
![Forest plot of comparison: 2 Sibutramine versus placebo, outcome: 2.2 Change in body weight from baseline to endpoint [kg].](/cdsr/doi/10.1002/14651858.CD007654.pub4/media/CDSR/CD007654/rel0004/CD007654/image_n/nCD007654-AFig-FIG08.png)
Forest plot of comparison: 2 Sibutramine versus placebo, outcome: 2.2 Change in body weight from baseline to endpoint [kg].
Heterogeneity
The meta‐analysis performed provided homogeneous results.
Subgroup analyses
Not performed due to lack of data.
Sensitivity analyses
Not performed due to lack of data.
Publication and small‐study bias
A clear interpretation of the funnel plot was not possible, which we attributed to the small number of included studies.
Phentermine/topiramate vs placebo
Primary outcomes
Mortality
It was reported that only one participant in the placebo group in the dyslipidaemia subgroup died during the study. There were no deaths in the hypertensive subgroup (CONQUER 2013).
Cardiovascular morbidity
In CONQUER 2013, 2.3% of the hypertensive participants in the 7.5 mg phentermine/46 mg topiramate group, 3.7% in the 15 mg phentermine/92 mg topiramate group, and 1.7% of the placebo group experienced treatment‐emergent cardiovascular adverse events. Palpitations occurred in 0.8%, 1.2%, and 0.6% of the hypertensive participants, respectively. Serious adverse cardiac events occurred in six hypertensive participants and serious adverse vascular events in two hypertensive participants, but it was not reported which treatment group these participants belonged to.
Adverse events
For details on adverse events see Table 1.
In the hypertensive subgroup, treatment‐emergent adverse events were reported in 85.4% of participants in the 7.5 mg/46 mg phentermine/topiramate group, 88.8% of participants in the 15 mg/92 mg phentermine/topiramate group and 77.3% of participants in the placebo group. Serious adverse events occurred in 3.4% (7.5 mg/46 mg group) and 3.7% (15 mg/92 mg group) of the hypertensive participants treated with phentermine/topiramate and in 4.2% of participants in the placebo group. The most common treatment‐emergent adverse events in the phentermine/topiramate groups were dry mouth (14.2% (7.5 mg/46 mg group) and 22.7%(15 mg/92 mg group)) and paresthaesia (14.2% (7.5 mg/46 mg group) and 22.3%(15 mg/92 mg group)) when compared to placebo (2.3% for each outcome).
Secondary outcomes
For details on secondary outcome data see Table 2, Table 3, Table 4.
Changes in systolic blood pressure
In hypertensive participants, greater reductions in systolic BP were noted in the phentermine/topiramate groups than in the placebo group (‐6.9 mm Hg (7.5 mg/46 mg group) and ‐9.1 mm Hg (15 mg/92 mg group) versus ‐4.9 mm Hg; P = 0.047 and P < 0.0001 for comparisons). Compared with placebo, a greater percentage of phentermine/topiramate‐treated participants with uncontrolled hypertension at baseline (≥ 140/90 mm Hg; placebo n = 104; 7.5 mg/46 mg n = 40; 15 mg /92 mg n = 72) achieved the BP goal of 140/90 mm Hg by week 56: 52.9% in the placebo group, 62.5% in the 7.5 mg/46 mg group, and 75.0% in the 15 mg/92 mg group (P = 0.2996 for 7.5/46 versus placebo; P = 0.0034 for 15/92 versus placebo) (CONQUER 2013).
Changes in diastolic blood pressure
Both doses of phentermine/topiramate were associated with a significantly greater reduction in diastolic BP compared to placebo in hypertensive participants (‐5.2 mm Hg (7.5 mg/46 mg group) and ‐5.8 mm Hg (15 mg/92 mg group) versus ‐3.9 mm Hg; P = 0.04 and 0.0003 for comparisons) (CONQUER 2013).
Body weight
Compared to placebo, phentermine/topiramate produced a significantly greater percentage weight loss in participants with hypertension at baseline (‐8.1%, ‐10.1%, and ‐1.9%, for 7.5 mg/46 mg, 15 mg/92 mg, and placebo respectively, P < 0.0001). In addition, significantly more participants in the hypertensive subgroup achieved weight loss of ≥ 5%, ≥ 10%, and ≥ 15% with phentermine/topiramate compared with placebo (CONQUER 2013).
Heterogeneity
Only one study; no meta‐analysis performed.
Subgroup analyses
Only one study; no meta‐analysis performed.
Sensitivity analyses
Only one study; no meta‐analysis performed.
Publication and small‐study bias
Only one study; not applicable.
Discussion
Summary of main results
This updated systematic review attempted to determine the long‐term effects of weight loss through pharmacological intervention on patient‐relevant endpoints, namely death and cardiovascular complications, in the antihypertensive therapy of people with essential hypertension, but found no randomised controlled trials designed to answer this question. Our search revealed only studies focusing mainly on the evaluation of effects on body weight, blood pressure, and adverse events. In addition to the four relevant orlistat and four relevant sibutramine trials that were already part of our review, the update revealed one new study (investigating the combination of phentermine/topiramate). We could include no study examining rimonabant, liraglutide, lorcaserin, or naltrexone/bupropion in this review, as the only potentially relevant trial failed to present analyses of hypertensive participants.
We found that of the four studies on the effects of orlistat that were included in our analyses, only one was considered to have major deficiencies in study quality. The meta‐analyses showed that participants under therapy with orlistat could reduce their weight and blood pressure levels to a statistically significantly greater degree than participants in the placebo group. While these results show that orlistat may be a helpful option in the antihypertensive therapy of obese hypertensive people, some questions still remain. First of all, participants undergoing orlistat therapy experienced substantial side effects, mainly of a gastrointestinal nature. This may limit the effectiveness of the medication in settings outside of scientific studies. Furthermore it remains unclear whether blood pressure levels will remain low over a longer period of time or once the medication is discontinued, since some investigations found that body weight increased after one year, whether or not orlistat was continued (Davidson 1999; Sjostrom 1998).
Even though sibutramine reduced body weight to about the same degree as orlistat, it did not show the same beneficial effects on blood pressure. In two studies using a dosage of 20 mg per day, which is higher than the currently approved dosage (in Germany) of 10 to 15 mg per day, blood pressure actually rose in participants treated with sibutramine. This finding is further underlined by the result of a head–to‐head comparison of orlistat versus sibutramine (Derosa 2005). It was found that while in participants in the orlistat group (120 mg three times a day) a reduction of ‐8.4 kg body weight resulted in a reduction of systolic BP and diastolic BP of ‐4.0 and ‐3.0 mm Hg respectively, the same 8.3 kg decline in body weight in the sibutramine group did not lead to a change in BP in participants treated with 10 mg sibutramine per day (0.0 and 0.0 mm Hg respectively). In a meta‐analysis by Kim et al. comparing sibutramine with placebo in participants with or without hypertension at baseline (Kim 2003), a significant increase in systolic BP (+1.6 mm Hg) and diastolic BP (+1.8 mm Hg) was also found in the sibutramine treatment group despite a large effect on weight loss in this group. As there are safety concerns in hypertensive people, the European Medicines Agency (EMA) demanded a long‐term trial of people at high cardiovascular risk, and the Sibutramine Cardiovascular Outcome Trial (SCOUT) was initiated. This double‐blind, randomised, placebo‐controlled outcome trial in approximately 10,000 overweight/obese high‐risk cardiovascular participants started recruitment in December 2002 and has been designed to determine the impact of weight loss in 10,742 participants (SCOUT 2010). After a mean duration of 3.5 years, 11.4% of participants in the sibutramine and 10.0% in the placebo group had a primary outcome event. These were either a non‐fatal myocardial infarction, a non‐fatal stroke, resuscitation after cardiac arrest, or cardiovascular death (hazard ratio 1.16, 95% CI 1.03 to 1.31; P = 0.02; number needed to treat to harm: 71]. As any observed loss in body weight was only modest, the US Food and Drug Administration (FDA) and EMA concluded that the risk of an adverse cardiovascular event outweighed any benefit resulting from taking sibutramine. Even though about one‐third of the study population was hypertensive, the SCOUT study was not included in our review, as no hypertensive subgroup analyses were presented. In addition, as marketing approval for sibutramine has been withdrawn, we abstained from contacting the authors to obtain the necessary data for this subgroup.
For the combination therapy of phentermine/topiramate, we could include only one trial involving a hypertensive subgroup in our analysis (CONQUER 2013). An additional 56‐week trial compared two different doses of phentermine/topiramate to placebo in obese participants with blood pressure below 140/90 mm Hg (EQUIP 2012). In these trials, the mean weight loss with phentermine/topiramate was about 6 to 8 kg, which is higher than in the case of orlistat, while the antihypertensive effect of phentermine/topiramate is comparable with orlistat. After completion of the CONQUER trial, participants could take part in a further 52‐week extension trial (SEQUEL 2014). Since this extension trial did not report any results for the hypertensive subgroup, and enrolment in the study occurred at participants' request, we did not include the results in our analysis. Although there was significant, sustained weight loss in the phentermine/topiramate groups compared to placebo, the reduction in blood pressure did not differ significantly between the groups after two years (SEQUEL 2014). Contrary to the US, where the FDA approved phentermine/topiramate for the long‐term pharmacological treatment of obesity in 2012 (FDA 2012), the EMA refused approval in Europe on 21 February 2013, because of major concerns regarding the long‐term effects of the drug on the heart and blood vessels, and particularly because phentermine is known to increase heart rate. There were also concerns about long‐term psychiatric and cognitive effects related to the topiramate component (EMA 2013c).
As far as the four remaining drugs that have been approved for long‐term weight reduction by the FDA are concerned, most studies enrolled only overweight or obese people without hypertension or a mixed population of normo‐ and hypertensive people, without providing results for the hypertensive subgroup. We therefore excluded the results of these trials from our analysis and only briefly discuss them here.
Four studies (the Rimonabant in Obesity (RIO) studies) investigated the effects of a daily therapy of 5 and 20 mg rimonabant in comparison to placebo in study populations including normo‐ and hypertensive (30% to 60%) participants (Despres 2005; Pi‐Sunyer 2006; Scheen 2006; Van Gaal 2005). None of the RIO studies were designed to assess the effects on patient‐relevant endpoints. Participants receiving treatment with rimonabant, reduced their body weight to a statistically significantly greater degree than placebo participants, regardless of the dosage. Contrary to these findings, the studies yielded heterogeneous results concerning blood pressure changes. In particular, therapy with 5 mg rimonabant showed inconsistent results, with a higher reduction in blood pressure compared to placebo in some studies but less of a reduction in others. Treatment with 20 mg rimonabant daily showed more uniform findings, with a higher reduction in systolic BP in all four studies (the difference was statistically significant in two). Furthermore, in three studies, the reduction in diastolic BP was more pronounced in participants taking 20 mg rimonabant than in the placebo group (the difference was statistically significant in one), but slightly less pronounced in one study. Only the publication of the RIO Lipid study reported information on a hypertensive subgroup (Despres 2005). In hypertensive participants treated with 20 mg rimonabant, blood pressure was reduced to a statistically significantly greater degree than in participants in the placebo group (systolic BP: ‐5.9 mm Hg; diastolic BP: ‐3.9 mm Hg). Since no other information on the hypertensive subgroup is provided (the paper does not even report the percentage of participants with hypertension at baseline), the relevance of these findings remains unclear. In addition, it must be noted that rimonabant was never approved by the FDA because of serious safety concerns (FDA 2007). Original data analysis performed by the FDA showed that the incidence of suicidality was doubled in the rimonabant group versus placebo. Similarly, incidences of psychiatric adverse events, neurological adverse events, and seizures were consistently higher for 20 mg rimonabant compared to placebo. Rimonabant received marketing approval from the EMA on 19 June 2006. However, new data derived from post‐marketing experience and ongoing clinical trials led the EMA on 23 October 2008 to recommend suspension of the marketing authorisation for rimonabant in Europe as well (EMA 2008; EMA 2008a). In January 2009, the European Commission issued a decision to withdraw the market authorisation for rimonabant in all EU countries (EMA 2009). Many more results from long‐term data will have to be published before a decision on the usefulness of rimonabant can be made. The results of the Comprehensive Rimonabant Evaluation Study of Cardiovascular Endpoints and Outcomes (CRESCENDO) trial published in 2010 did not change the recommendation made by EMA in 2009 (CRESCENDO 2010). This study was closed early in November 2008 due to high suicide rates and other psychiatric side effects related to rimonabant. It was a multicentre, double‐blind, placebo‐controlled trial with a mean follow‐up of 13.8 months, aimed at determining whether long‐term treatment with 20 mg rimonabant could potentially reduce the risk of cardiovascular events in 9314 participants with previously manifest or increased risk of vascular disease. Even though about 88% of participants were hypertensive, no hypertensive subgroup analyses were presented. The primary endpoints were cardiovascular death, myocardial infarction, or stroke, which occurred in 3.9% of participants assigned to rimonabant, compared with 4.0% of participants assigned to placebo (hazard ratio 0.97, 95% CI 0.84 to 1.12; P = 0.68). Among participants taking rimonabant, the incidence of gastrointestinal (33% versus 22%), neuropsychiatric (32% versus 21%), and serious psychiatric side effects (2.5% versus 1.3%) was significantly increased compared with placebo. Four participants in the rimonabant group and one in the placebo group committed suicide.
Three large phase III trials assessed the efficacy and safety of lorcaserin in obese people with or without weight‐related comorbidities (BLOOM 2010; BLOOM‐DM 2012; Fidler 2011). The Behavioral Modification and Lorcaserin Second Study for Obesity Management (BLOSSOM) trial enrolled 4008 participants who were randomly assigned to two different daily doses of lorcaserin or placebo (Fidler 2011). About 24% of the participants were hypertensive. In the Behavioral Modification and Lorcaserin for Overweight and Obesity Management (BLOOM) study, 3182 overweight or obese, normotensive participants received either 10 mg lorcaserin twice daily or placebo (BLOOM 2010), while the Behavioral Modification and Lorcaserin for Obesity and Overweight Management in Diabetes Mellitus (BLOOM‐DM) trial investigated the effect of two different daily doses of lorcaserin versus placebo in 604 overweight or obese people with diabetes mellitus type 2 (BLOOM‐DM 2012). In all three trials, the study medication was combined with a reduced‐calorie diet and increased physical activity. None of the studies were designed to assess the effects on patient‐relevant endpoints. In all the studies, the lorcaserin groups showed a significant mean weight loss of about 3 to 4 kg compared with the placebo groups after 52 weeks. In contrast, blood pressure did not change to a statistically significant degree in the BLOSSOM and the BLOOM‐DM trials. In the BLOOM trial, which included only normotensive participants, there was a significant reduction in systolic BP and diastolic BP in the lorcaserin groups compared to placebo (systolic BP: ‐0.6 mm Hg; diastolic BP: ‐0.5 mm Hg). The most common adverse events in the lorcaserin groups were headache, nasopharyngitis, and nausea. In addition, large discontinuation rates of up to 50% were reported in the trials (Taylor 2013). Although there was no difference in the incidence of valvulopathy between lorcaserin and placebo, the FDA has requested that a postapproval trial be conducted to assess the long‐term cardiovascular effects of lorcaserin (Yanovski 2014). In January 2013, a Committee for Medicinal Products for Human Use review of the EMA described some concerns about the potential risk of psychiatric disorders and valvulopathy, and the potential risk of tumours, particularly when used over the long term, based on the results of laboratory tests (EMA 2013a). As a result of this negative overall benefit/risk balance for lorcaserin, the manufacturer withdrew its application for marketing approval in Europe (EMA 2013).
The combination of naltrexone/bupropion, which has been approved for weight management by the FDA and EMA (EMA 2015; FDA 2014), was assessed in the four 56‐week trials of the Contrave Obesity Research (COR) study program. Participating in this study were 4536 overweight or obese people with or without hypertension, dyslipidaemia, or diabetes mellitus type 2. In two of the trials, the percentage of participants with hypertension at baseline was about 20% (COR‐I 2010; COR‐II 2013); in the other two trials it was not reported (COR‐BMOD 2011; COR‐Diabetes 2013). A statistically significant weight reduction of about 4 to 5 kg was reported for naltrexone/bupropion compared to placebo in addition to diet and exercise counselling (COR‐Diabetes 2013; COR‐I 2010; COR‐II 2013), or to an intensive behaviour modification program (COR‐BMOD 2011). Blood pressure remained unchanged or was slightly reduced in the naltrexone/bupropion groups, but there was a larger reduction in the placebo groups. The group differences were significant for systolic BP in the COR‐I 2010, COR‐II 2013, and COR‐BMOD 2011 trials and for diastolic BP in the COR‐I 2010 and COR‐BMOD 2011 trials. None of these studies investigated the effects on patient‐related outcomes. The drop‐out rates in the four trials ranged from 42% to 50%. Nausea, dizziness, constipation, and tinnitus were the most common adverse events in the naltrexone/bupropion groups.
Liraglutide was first approved by the EMA in 2009 and the FDA in 2010 to improve glycaemic control in adults with type 2 diabetes mellitus (EMA 2009a; FDA 2010b). A Cochrane review of glucagon‐like peptide 1 (GLP‐1) receptor agonists for type 2 diabetes mellitus showed a significant weight reduction of 1.33 kg (P < 0.0001) and a marginally significant reduction in systolic BP of ‐2.42 mm Hg (P = 0.05) for 1.8 mg liraglutide compared to placebo after 24 weeks. No difference in diastolic BP was reported. The most common adverse events of liraglutide were gastrointestinal, such as nausea or vomiting (Shyangdan 2011). There were also more cases of pancreatitis among liraglutide users compared with comparators, and in 2011 the FDA issued a warning that liraglutide may cause pancreatitis and thyroid carcinoma (NEJM Journal Watch 2011). Currently the Liraglutide Effect and Action in Diabetes: Evaluation of cardiovascular outcome Results (LEADER) trial, a double‐blind, placebo‐controlled randomised controlled trial including 9340 participants with type 2 diabetes mellitus at high risk of cardiovascular disease, is investigating the long‐term effects of 1.8 mg liraglutide in comparison to placebo on cardiovascular outcomes as well as neoplasms and other adverse events (LEADER 2013). The study is scheduled to end in 2016. In addition to glycaemic control, liraglutide was approved by the FDA and EMA at a dose of 3.0 mg for the treatment for obesity in 2014/2015 (EMA 2015a; FDA 2014a). It was investigated for this indication in the SCALE study program, in which 5358 obese or overweight people with or without weight‐related comorbidities participated (SCALE diabetes 2014; SCALE maintenance 2013; SCALE obesity and prediabetes 2014; SCALE sleep apnoea 2014). Although the percentage of hypertensive participants was as high as 70% in these trials, no results for a hypertensive subgroup were reported. At the end of the studies (32 to 56 weeks), mean body weight was significantly reduced among liraglutide users compared to placebo (‐3 to ‐6 kg). Systolic BP was also significantly reduced in all four trials (‐3 mm Hg), while for diastolic BP only one trial showed a significant difference between liraglutide and placebo (‐1 mm Hg) (SCALE obesity and prediabetes 2014). The drop‐out rates in the studies were about 23% to 34% and therefore lower than in other weight management trials. As in the glycaemic control trials, the most common adverse events were nausea, diarrhoea, and vomiting. Pancreatitis also occurred more frequently in the liraglutide group compared to placebo.
Overall completeness and applicability of evidence
We searched four electronic databases and the clinical trials registry ClinicalTrials.gov until 13 April 2015 and examined the reference lists of included trials and relevant systematic reviews and meta‐analyses. Since four new drugs have recently been approved for long‐term pharmacological weight management, we extended the search terms accordingly. We assessed each study's quality and summarised the results. The results of this review can therefore be taken to be complete and applicable. For full information please see details in the relevant sections.
Quality of the evidence
Of the four orlistat studies included in our analyses, we judged only one to have major deficiencies in study quality (Bakris 2002). We assessed all of the sibutramine studies as having major deficiencies in study quality. We regarded the only included phentermine/topiramate study as having no major deficiencies in study quality. Full details are provided in the 'Risk of bias' tables in Characteristics of included studies.
Potential biases in the review process
A major limitation of this review is that due to insufficient information in the included studies, we can draw no conclusions on the effects of the different pharmaceutical weight loss interventions on patient‐relevant long‐term outcomes.
Agreements and disagreements with other studies or reviews
Systematic reviews on long‐term effects of weight‐reducing drugs on people with hypertension are rare. One systematic review published by Aucott 2005 reached the same conclusion, that only short‐term trials were available. The authors also warned "that extrapolation of short‐term blood pressure changes with weight loss to the longer term is potentially misleading. The weight/hypertension relationship is complex and needs well‐conducted studies with long‐term follow‐up to examine the effects of weight loss on hypertension outcomes."
In addition, we were also involved in the preparation of the scientific report on the evaluation of the benefits and harms of non‐drug treatment strategies in people with essential hypertension (IQWiG 2006), and published a paper on this topic in 2008 (Horvath 2008). Since our last search performed on 17 August 2012 (Siebenhofer 2013) for trials investigating pharmacologically induced reduction in body weight, four new drugs for long‐term weight management have been approved and were therefore included in the search for this update of the review. As a result, we identified and included one additional study addressing our research question in our updated analysis. We are aware of all major and relevant systematic reviews and studies and can say with confidence that our findings are in good agreement with recently published reviews and studies.
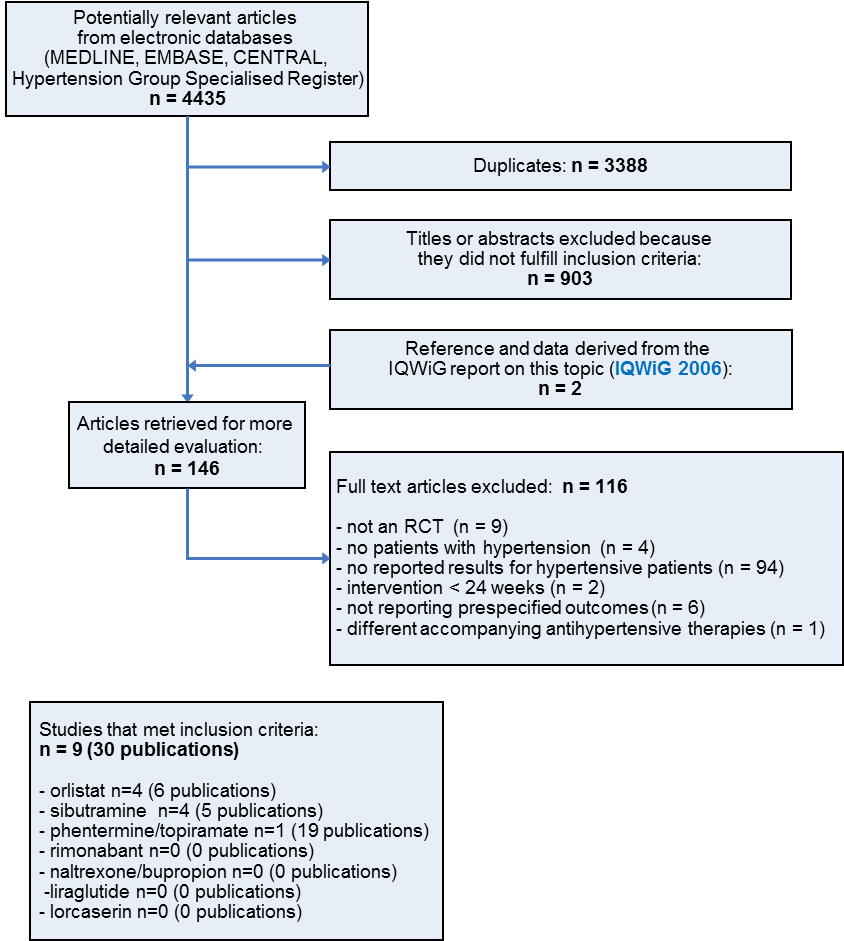
Study flow diagram
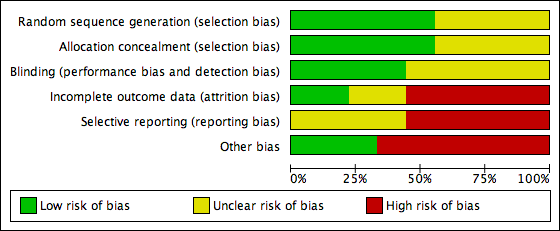
Risk of bias graph: review authors' judgements about each risk of bias item presented as percentages across all included studies.

Risk of bias summary: review authors' judgements about each risk of bias item for each included study.
![Forest plot of comparison: 1 Orlistat versus placebo, outcome: 1.1 Change in systolic blood pressure from baseline to endpoint [mm Hg].](/es/cdsr/doi/10.1002/14651858.CD007654.pub4/media/CDSR/CD007654/rel0004/CD007654/image_n/nCD007654-AFig-FIG04.png)
Forest plot of comparison: 1 Orlistat versus placebo, outcome: 1.1 Change in systolic blood pressure from baseline to endpoint [mm Hg].
![Forest plot of comparison: 1 Orlistat versus placebo, outcome: 1.2 Change in diastolic blood pressure from baseline to endpoint [mm Hg].](/es/cdsr/doi/10.1002/14651858.CD007654.pub4/media/CDSR/CD007654/rel0004/CD007654/image_n/nCD007654-AFig-FIG05.png)
Forest plot of comparison: 1 Orlistat versus placebo, outcome: 1.2 Change in diastolic blood pressure from baseline to endpoint [mm Hg].
![Forest plot of comparison: 1 Orlistat versus placebo, outcome: 1.3 Change in body weight from baseline to endpoint [kg].](/es/cdsr/doi/10.1002/14651858.CD007654.pub4/media/CDSR/CD007654/rel0004/CD007654/image_n/nCD007654-AFig-FIG06.png)
Forest plot of comparison: 1 Orlistat versus placebo, outcome: 1.3 Change in body weight from baseline to endpoint [kg].
![Forest plot of comparison: 2 Sibutramine versus placebo, outcome: 2.1 Change in diastolic blood pressure from baseline to endpoint [mm Hg].](/es/cdsr/doi/10.1002/14651858.CD007654.pub4/media/CDSR/CD007654/rel0004/CD007654/image_n/nCD007654-AFig-FIG07.png)
Forest plot of comparison: 2 Sibutramine versus placebo, outcome: 2.1 Change in diastolic blood pressure from baseline to endpoint [mm Hg].
![Forest plot of comparison: 2 Sibutramine versus placebo, outcome: 2.2 Change in body weight from baseline to endpoint [kg].](/es/cdsr/doi/10.1002/14651858.CD007654.pub4/media/CDSR/CD007654/rel0004/CD007654/image_n/nCD007654-AFig-FIG08.png)
Forest plot of comparison: 2 Sibutramine versus placebo, outcome: 2.2 Change in body weight from baseline to endpoint [kg].

Comparison 1 Orlistat versus placebo, Outcome 1 Change in systolic blood pressure from baseline to endpoint.

Comparison 1 Orlistat versus placebo, Outcome 2 Change in diastolic blood pressure from baseline to endpoint.

Comparison 1 Orlistat versus placebo, Outcome 3 Change in body weight from baseline to endpoint.

Comparison 2 Sibutramine versus placebo, Outcome 1 Change in diastolic blood pressure from baseline to endpoint.

Comparison 2 Sibutramine versus placebo, Outcome 2 Change in body weight from baseline to endpoint.
| Orlistat compared with placebo for weight reduction | |||||
| Patient or population: Men and non‐pregnant women ≥ 18 years old with essential hypertension Intervention: Orlistat Comparison: Placebo | |||||
| Outcomes | Illustrative comparative risks (per 1000 patients) | Effect estimate | No of Participants | Quality of the evidence | Comments |
| Change in systolic blood pressure as compared to placebo [mm Hg] from baseline to end of study | Not applicable | MD ‐2.46 [‐4.01, ‐0.90] | 2058 | ⊕⊕⊝⊝ | ‐ |
| Change in diastolic blood pressure as compared to placebo [mm Hg] from baseline to end of study | Not applicable | MD ‐1.92 [‐2.99, ‐0.85] | 2058 | ⊕⊕⊝⊝ | ‐ |
| Change in body weight as compared to placebo [kg] from baseline to end of study | Not applicable | MD ‐3.73 [‐4.65, ‐2.80] | 2080 | ⊕⊕⊕⊝ | ‐ |
| CI: confidence interval; MD: mean difference | |||||
| GRADE Working Group grades of evidence | |||||
| 1High risk of bias in included studies. 2Wide confidence intervals include non‐clinically important effect. | |||||
| Sibutramine compared with placebo for weight reduction | |||||
| Patient or population: Men and non‐pregnant women ≥ 18 years old with essential hypertension Intervention: Sibutramine Comparison: Placebo | |||||
| Outcomes | Illustrative comparative risks (per 1000 patients) | Effect estimates | No of Participants | Quality of the evidence | Comments |
| Change in systolic blood pressure as compared to placebo [mm Hg] from baseline to end of study | Not applicable | Not estimable | See comment | See comment | Variability measurements not available; |
| Change in diastolic blood pressure as compared to placebo [mm Hg] from baseline to end of study | Not applicable | MD 3.16 [1.40, 4.92] | 428 | ⊕⊕⊝⊝ | ‐ |
| Change in body weight as compared to placebo [kg] from baseline to end of study | Not applicable | MD ‐3.74 [‐4.84, ‐2.64] | 574 | ⊕⊕⊝⊝ | ‐ |
| CI: confidence interval; MD: mean difference | |||||
| GRADE Working Group grades of evidence | |||||
| 1High risk of bias in included studies. 2Small number of participants and studies. | |||||
| Study | Adverse events | Results |
| Orlistat vs placebo | ||
| Bakris 2002 | total thereof leading to withdrawal serious gastrointestinal thereof leading to withdrawal musculoskeletal | 89% of P [O] vs 71% of P [P], P < 0.001 7% [O] vs 7% [P] 14 P (12%) [O] vs 15 P (9%) [P] 200 P (73%) [O] vs 120 P (44%) [P], P < 0.001 15 P (8%) [O] vs 6 P (5%) [P] 23% of P [O] vs 16% [P], P < 0.05 |
| Cocco 2005 | total serious gastrointestinal | nr 0 P [O] vs 0 P [P] 16 P (36%) [O]a vs 11 P (24%) [P]a |
| Guy‐Grand 2004 | total serious | nrb nrb |
| XENDOS 2001‐2006 | total leading to withdrawal serious gastrointestinal musculoskeletal nervous system dermatological vascular | 99% of P [OD] vs 96% of P [PD] 99% of P [OS] vs 97% of P [PS] 9% of P [OD] vs 4% of P [PD] 9% of P [OS] vs 4% of P [PS] 18% of P [OD] vs 12% of P [PD] 18% of P [OS] vs 12% of P [PS] 93% of P [OD] vs 70% of P [PD] 93% of P [OS] vs 71% of P [PS] 65% of P [OD] vs 62% of P [PD] 65% of P [OS] vs 63% of P [PS] 39% of P [OD] vs 39% of P [PD] 40% of P [OS] vs 37% of P [PS] 20% of P [OD] vs 17% of P [PD] 22% of P [OS] vs 17% of P [PS] 17% of P [OD] vs 19% of P [PD] 17% of P [OS] vs 19% of P [PS] |
| Sibutramine vs placebo | ||
| Fanghaenel 2003 | total constipation dizziness dry mouth headache insomnia restlessness | 14 P (21 E) [S] vs 13 P (20 E) [P] 4 P [S] vs 2 P [P] 1 P [S] vs 1 P [P] 4 P [S] vs 2 P [P] 5 P [S] vs 2 P [P] 1 P [S] vs 1 P [P] 1 P [S] vs 0 P [P] |
| Faria 2002‐2005 | total dry mouth arthralgia | nr 37% of P [S] vs 9% of P [P], P < 0.005 16% of P [S] vs 2% of P [P], P = 0.03 |
| McMahon 2002 | total serious treatment related leading to withdrawal (mostly hypertension) dry mouth headache | 141 P (97%) [S] vs 65 P (88%) [P] 9 P (6%) [S] vs 5 P (7%) [P] 2 E [S] vs 0 E [P] 23 P (16%) [S] vs 4 P (5%) [P] 30 P (21%) [S] vs 0 P [P] 41 P (28%) [S] vs 17 P (23%) [P] |
| McMahon 2000 | total leading to withdrawal (mostly hypertension) dry mouth headache constipation rash | nr 30 P (20%) [S] vs 8 P (11%) [P] 29 P (19%) [S] vs 2 P (3%) [P], P < 0.05 37 P (25%) [S] vs 21 P (28%) [P] 25 P (17%) [S] vs 2 P (3%) [P], P < 0.05 16 P (11%) [S] vs 2 P (3%) [P] |
| Phentermine/topiramate vs placebo | ||
| CONQUER 2013 | total leading to withdrawal serious cardiac adverse events dry mouth paresthaesia constipation upper respiratory tract infection nasopharyngitis dysgeusia insomnia headache dizziness sinusitis | 85.4% vs 88.8% vs 77.3% 11.9% vs 19.8% vs 9.7% 3.4% (Phen/Top [LD]) vs 3.7% (Phen/Top [HD]) vs 4.2% [P] 0.8% vs 1.2% vs 0.6% 14.2% (Phen/Top [LD]) vs 22.7% (Phen/Top [HD]) vs 2.3% [P] 14.2% (Phen/Top [LD]) vs 22.3% (Phen/Top [HD]) vs 2.3% [P] 15.7% (Phen/Top [LD]) vs 18.1% (Phen/Top [HD]) vs 5.5% [P] 12.6% (Phen/Top [LD]) vs 12.1% (Phen/Top [HD]) vs 11.8% [P] 10.3% (Phen/Top [LD]) vs 10.2% (Phen/Top [HD]) vs 8.8% [P] 7.7% (Phen/Top [LD]) vs 11.0% (Phen/Top [HD]) vs 0.8% [P] 5.7% (Phen/Top [LD]) vs 11.0% (Phen/Top [HD]) vs 4.8% [P] 5.0% (Phen/Top [LD]) vs 10.8% (Phen/Top [HD]) vs 8.4% [P] 6.5% (Phen/Top [LD]) vs 12.1% (Phen/Top [HD]) vs 3.1% [P] 5.4% (Phen/Top [LD]) vs 8.3% (Phen/Top [HD]) vs 6.5% [P] |
| E: events. nr: not reported. [O]: orlistat. [OD]: orlistat and diastolic blood pressure ≥ 90 mm Hg. [OS]: orlistat and systolic blood pressure ≥ 140 mm Hg. P: participants. [P]: placebo. Phen/Top [HD]: phentermine/topiramate high dose (15 mg/92 mg). Phen/Top [LD]: phentermine/topiramate low dose (7.5 mg/46 mg). [PD]: placebo and diastolic blood pressure ≥ 90 mm Hg. [PS]: placebo and systolic blood pressure ≥ 140 mm Hg. [S]: sibutramine. aNo data on adverse events were reported for the whole study duration. The data above refer to 4 and 3 weeks of treatment in the orlistat and placebo group, respectively. After 3 months, the number of participants with events decreased to 5(11%)[O] with flatulence and mild abdominal cramps versus 6(13%)[P] with nausea and hunger feeling. bData were not available for the hypertensive subgroup, only for the whole study population (withdrawal due to defecation troubles in 10 [O] versus 2 [P] participants). | ||
| Study | Baselinea | 6 moa | 12 moa | 48 moa | Change from baseline to endpointa |
| Orlistat vs placebo | |||||
| Bakris 2002b Orlistat Placebo | 101 (1)c 102 (1)c | nr nr | nr nr | ‐ ‐ | P < 0.001 ‐5.4 (6.4) ‐2.7 (6.4) |
| Cocco 2005 Orlistat Placebo | 107 (6) 106 (6) | 102 (4) 104 (5) | ‐ ‐ | ‐ ‐ | P < 0.001 ‐5.4d ‐2.5d |
| Guy‐Grand 2004 Orlistat Placebo | 94 (1)c 94 (1)c | nr nr | ‐ ‐ | ‐ ‐ | P < 0.0001 ‐5.8 (0.3) ‐1.8 (0.2) |
| XENDOS 2001‐2006 Orlistat [OD] Placebo [PD] Orlistat [OS] Placebo [PS] | 117 (18) 115 (18) 117 (17) 116 (18) | 106 (17) 108 (18) 106 (17) 109 (18) | 105 (18) 108 (19) 105 (17) 110 (19) | 110 (19) 111 (20) 110 (18) 113 (19) | P < 0.001 ‐6.6 (8.6) ‐3.8 (7.8) P < 0.001 ‐6.8 (8.7) ‐3.2 (7.4) |
| Sibutramine vs placebo | |||||
| Fanghaenel 2003 Sibutramine Placebo | 75 (10) 78 (9) | 70 (10) 75 (9) | ‐ ‐ | ‐ ‐ | significant ‐5.5 (‐3.8; ‐7.1)e ‐3.4 (‐1.9; ‐5.0)e |
| Faria 2002‐2005 Sibutramine Placebo | 100 (19) 97 (14) | 93 (18) 94 (15) | ‐ ‐ | ‐ ‐ | P < 0.001 ‐6.8 (2.3) ‐2.4 (4.2) |
| McMahon 2002 Sibutramine Placebo | 97 (16) 99 (14) | nr nr | nr nr | ‐ ‐ | P < 0.05 ‐4.5 ‐0.4 |
| McMahon 2000 Sibutramine Placebo | 97 (13) 96 (17) | nr nr | nr nr | ‐ ‐ | P < 0.05 ‐4.4 ‐0.5 |
| Phentermine/topiramate vs placebo | |||||
| CONQUER 2013 Phen/Top [LD] Phen/Top [HD] Placebo | 104 (18)f | nr nr nr | nr nr nr | ‐ ‐ ‐ | P < 0.0001g ‐8.1% ‐10.1% ‐1.9% |
| Mo: months. nr: not reported. [O]: orlistat. [OD]: orlistat and diastolic blood pressure ≥ 90 mm Hg. [OS]: orlistat and systolic blood pressure ≥ 140 mm Hg. P: participants. [P]: placebo. Phen/Top [HD]: phentermine/topiramate high dose (15 mg/92 mg). Phen/Top [LD]: phentermine/topiramate low dose (7.5 mg/46 mg). [PD]: placebo and diastolic blood pressure ≥ 90 mm Hg. [PS]: placebo and systolic blood pressure ≥ 140 mm Hg. [S]: sibutramine. SD: standard deviation. aMean kg (SD), unless otherwise indicated. bData are reported for 267 of 278 [O] and 265 of 276 [P] participants only. cReported as being the standard deviation but probably the standard error due to its small number. dPublished values are different, but data were corrected after personal communication with the author. e95% confidence interval. fReported only combined for all three study groups. gFor each intervention group versus placebo. | |||||
| Study | Baselinea | 6 moa | 12 moa | 48 moa | Change from baseline to endpointa |
| Orlistat vs placebo | |||||
| Bakris 2002b Orlistat Placebo | 154 (13) 151 (13) | nr nr | nr nr | ‐ ‐ | ns ‐13.3 (15.2) ‐11.0 (15.0) |
| Cocco 2005 Orlistat Placebo | 146 (10) 142 (6) | 142 (13) 141 (9) | ‐ ‐ | ‐ ‐ | P = 0.025 ‐4.3 ‐0.9 |
| Guy‐Grand 2004 Orlistat Placebo | 150 (1)c 152 (1)c | nr nr | ‐ ‐ | ‐ ‐ | ns ‐9.8 (1) ‐9.8 (1) |
| XENDOS 2001‐2006 Orlistat [OD]d Placebo [PD]d Orlistat [OS]d Placebo [PS]d | 146 (13) 146 (12) 149 (10) 149 (8) | 135 (14) 136 (15) 125 (14) 138 (14) | 135 (14) 138 (16) 135 (14) 140 (14) | 137 (15) 139 (16) 138 (15) 140 (15) | P = 0.024 ‐8.8 (14.8) ‐6.4 (15.1) P < 0.002 ‐11.5 (14.9) ‐8.6 (14.3) |
| Sibutramine vs placebo | |||||
| Fanghaenel 2003e Sibutramine Placebo | 139 (9) 139 (13) | 125 (9) 123 (10) | ‐ ‐ | ‐ ‐ | ns ‐13.9f ‐16.5f |
| Faria 2002‐2005 Sibutramine Placebo | 150 (18) 150 (15) | 146 (15) 149 (22) | ‐ ‐ | ‐ ‐ | ns ‐4.6f ‐0.6f |
| McMahon 2002 Sibutramine Placebo | 129 (11) 129 (11) | nr nr | 133 130 | ‐ ‐ | P = 0.0497 3.8 1.1 |
| McMahon 2000 Sibutramine Placebo | 134 (10) 134 (11) | nr nr | nr nr | ‐ ‐ | ns 2.7 1.5 |
| Phentermine/topiramate vs placebo | |||||
| CONQUER 2013 Phen/Top [LD] Phen/Top [HD] Placebo | 134 (nr) 133 (nr) 135 (nr) | nr nr nr | nr nr nr | ‐ ‐ ‐ | P = 0.0475 [LD] P < 0.0001 [HD] ‐6.9 ‐9.1 ‐4.9 |
| Mo: months. nr: not reported. [O]: orlistat. [OD]: orlistat and diastolic blood pressure ≥ 90 mm Hg. [OS]: orlistat and systolic blood pressure ≥ 140 mm Hg. P: participants. [P]: placebo. Phen/Top [HD]: phentermine/topiramate high dose (15 mg/92 mg). Phen/Top [LD]: phentermine/topiramate low dose (7.5 mg/46 mg). [PD]: placebo and diastolic blood pressure ≥ 90 mm Hg. [PS]: placebo and systolic blood pressure ≥ 140 mm Hg. [S]: sibutramine. SD: standard deviation. aMean mm Hg (SD), unless otherwise indicated. bData are reported for 267 of 278 [O] and 265 of 276 [P] participants only. cReported as being the standard deviation but probably the standard error due to its small number. dBased on last observation carried forward data on 399 [OD], 423 [PD], 493 [OS], and 504 [PS] participants. eData at baseline were recorded after a two‐week wash‐out period of antihypertensive drugs for diagnostic confirmation of hypertension. fCalculated. | |||||
| Study | Baselinea | 6 moa | 12 moa | 48 moa | Change from baseline to endpointa |
| Orlistat vs placebo | |||||
| Bakris 2002b Orlistat Placebo | 98 (4) 98 (4)c | nr nr | nr nr | ‐ ‐ | P = 0.002 ‐11.4 (8.3) ‐9.2 (8.4) |
| Cocco 2005 Orlistat Placebo | 88 (7) 85 (6) | 84 (9) 85 (7) | ‐ ‐ | ‐ ‐ | P = 0.012 ‐3.6 ‐0.8 |
| Guy‐Grand 2004 Orlistat Placebo | 97 (0)d 97 (0)d | nr nr | ‐ ‐ | ‐ ‐ | ns ‐7.5 (0.6) ‐7.3 (0.6) |
| XENDOS 2001‐2006 Orlistat [OD]e Placebo [PD]e Orlistat [OS]e Placebo [PS]e | 95 (6) 95 (5) 91 (9) 91 (8) | 86 (8) 88 (9) 84 (9) 87 (9) | 86 (8) 88 (10) 85 (9) 88 (10) | 87 (9) 89 (10) 86 (9) 88 (10) | P < 0.006 ‐8.1 (9.3) ‐6.2 (9.9) P < 0.001 ‐5.0 (9.9) ‐3.0 (10.4) |
| Sibutramine vs placebo | |||||
| Fanghaenel 2003f Sibutramine Placebo | 93 (7) 92 (8) | 82 (5) 80 (5) | ‐ ‐ | ‐ ‐ | ns ‐11.4g ‐11.7g |
| Faria 2002‐2005 Sibutramine Placebo | 91 (12) 94 (12) | 92 (13) 92 (14) | ‐ ‐ | ‐ ‐ | ns 1.0g ‐2.06g |
| McMahon 2002 Sibutramine Placebo | 82 (6) 83 (6) | nr nr | 86 83 | ‐ ‐ | P = 0.004 3.0 ‐0.1 |
| McMahon 2000 Sibutramine Placebo | 84 (5) 84 (6) | nr nr | nr nr | ‐ ‐ | P < 0.05 2.0 ‐1.3 |
| Phentermine/topiramate vs placebo | |||||
| CONQUER 2013 Phen/Top [LD] Phen/Top [HD] Placebo | 83 (nr) 83 (nr) 85 (nr) | nr nr nr | nr nr nr | ‐ ‐ ‐ | P = 0.0400 [LD] P = 0.0003 [HD] ‐5.2 ‐5.8 ‐3.9 |
| Mo: months. nr: not reported. [O]: orlistat. [OD]: orlistat and diastolic blood pressure ≥ 90 mm Hg. [OS]: orlistat and systolic blood pressure ≥ 140 mm Hg. P: participants. [P]: placebo. Phen/Top [HD]: phentermine/topiramate high dose (15 mg/92 mg). Phen/Top [LD]: phentermine/topiramate low dose (7.5 mg/46 mg). [PD]: placebo and diastolic blood pressure ≥ 90 mm Hg. [PS]: placebo and systolic blood pressure ≥ 140 mm Hg. [S]: sibutramine. SD: standard deviation. aMean mm Hg (SD), unless otherwise indicated. bData are reported for 267 of 278 [O] and 265 of 276 [P] participants only. cThe standard deviation was published as being 35 but should probably be 3.5. dReported as being the standard deviation but probably the standard error due to its small number. eBased on last observation carried forward data on 399 [OD], 423 [PD], 493 [OS], and 504 [PS] participants. fData at baseline were recorded after a two‐week wash‐out period of antihypertensive drugs for diagnostic confirmation of hypertension. gCalculated. | |||||
| Outcome or subgroup title | No. of studies | No. of participants | Statistical method | Effect size |
| 1 Change in systolic blood pressure from baseline to endpoint Show forest plot | 4 | 2058 | Mean Difference (IV, Random, 95% CI) | ‐2.46 [‐4.01, ‐0.90] |
| 2 Change in diastolic blood pressure from baseline to endpoint Show forest plot | 4 | 2058 | Mean Difference (IV, Random, 95% CI) | ‐1.92 [‐2.99, ‐0.85] |
| 3 Change in body weight from baseline to endpoint Show forest plot | 4 | 2080 | Mean Difference (IV, Random, 95% CI) | ‐3.73 [‐4.65, ‐2.80] |
| Outcome or subgroup title | No. of studies | No. of participants | Statistical method | Effect size |
| 1 Change in diastolic blood pressure from baseline to endpoint Show forest plot | 2 | 428 | Mean Difference (IV, Fixed, 95% CI) | 3.16 [1.40, 4.92] |
| 2 Change in body weight from baseline to endpoint Show forest plot | 4 | 574 | Mean Difference (IV, Fixed, 95% CI) | ‐3.74 [‐4.84, ‐2.64] |