| 1 Mortality ‐ All Studies Show forest plot | 15 | 1212 | Risk Ratio (M‐H, Random, 95% CI) | 1.22 [0.55, 2.70] |
|
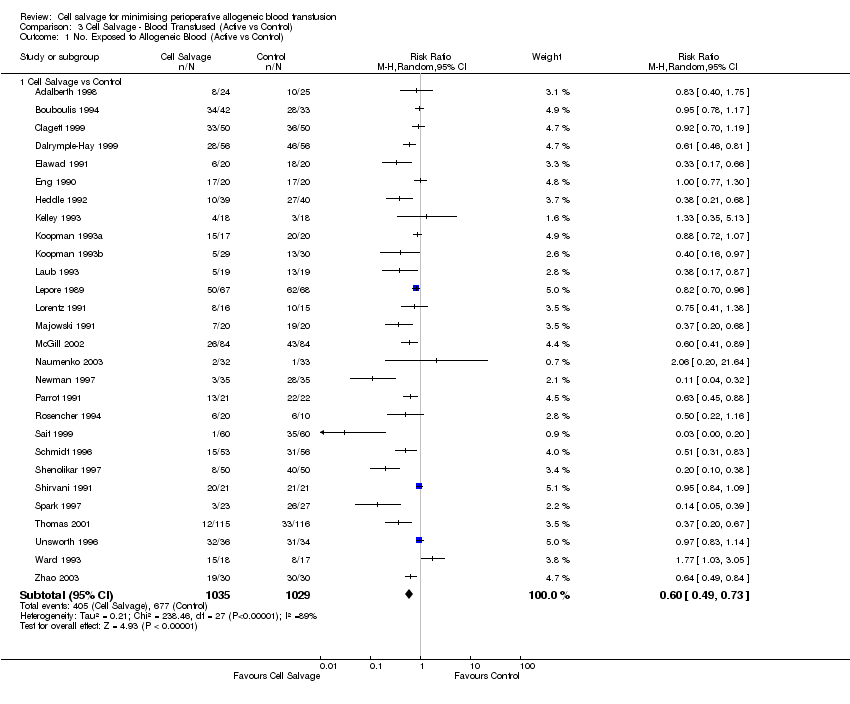
| 2 Mortality ‐ CS vs Control Show forest plot | 11 | | Risk Ratio (M‐H, Random, 95% CI) | Subtotals only |
|
| 2.1 Cell Salvage vs Control | 11 | 811 | Risk Ratio (M‐H, Random, 95% CI) | 1.53 [0.65, 3.61] |
| 3 Mortality ‐ Active vs Active Show forest plot | 4 | 401 | Risk Ratio (M‐H, Random, 95% CI) | 0.27 [0.03, 2.40] |
|
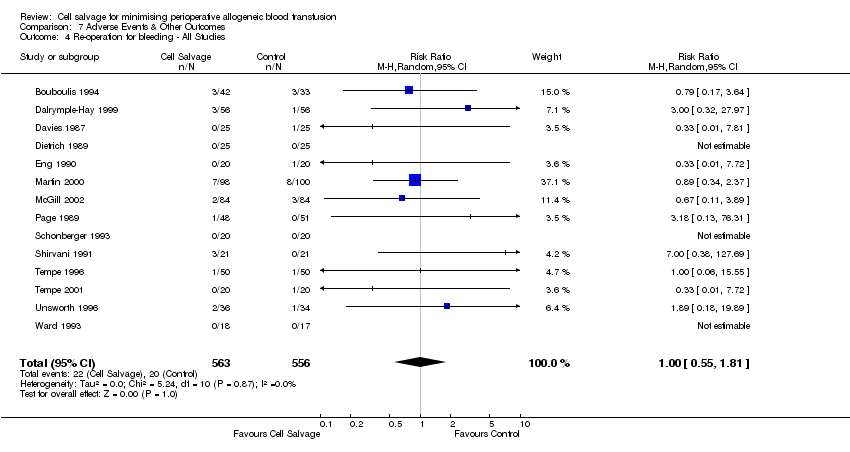
| 4 Re‐operation for bleeding ‐ All Studies Show forest plot | 14 | 1119 | Risk Ratio (M‐H, Random, 95% CI) | 1.00 [0.55, 1.81] |
|
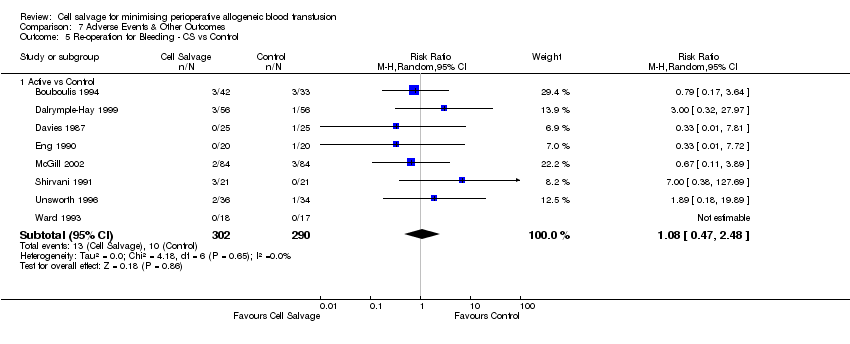
| 5 Re‐operation for Bleeding ‐ CS vs Control Show forest plot | 8 | | Risk Ratio (M‐H, Random, 95% CI) | Subtotals only |
|
| 5.1 Active vs Control | 8 | 592 | Risk Ratio (M‐H, Random, 95% CI) | 1.08 [0.47, 2.48] |
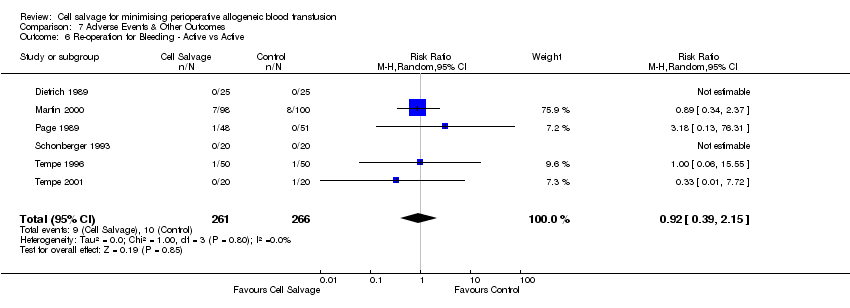
| 6 Re‐operation for Bleeding ‐ Active vs Active Show forest plot | 6 | 527 | Risk Ratio (M‐H, Random, 95% CI) | 0.92 [0.39, 2.15] |
|
| 7 Any Infection ‐ All Studies Show forest plot | 13 | 1390 | Risk Ratio (M‐H, Random, 95% CI) | 0.74 [0.44, 1.25] |
|
| 8 Any Infection ‐ CS vs Control Show forest plot | 9 | | Risk Ratio (M‐H, Random, 95% CI) | Subtotals only |
|
| 8.1 Cell Salvage vs Control | 9 | 826 | Risk Ratio (M‐H, Random, 95% CI) | 0.75 [0.41, 1.37] |
| 9 Any Infection ‐ Active vs Active Show forest plot | 4 | 564 | Risk Ratio (M‐H, Random, 95% CI) | 0.35 [0.05, 2.63] |
|
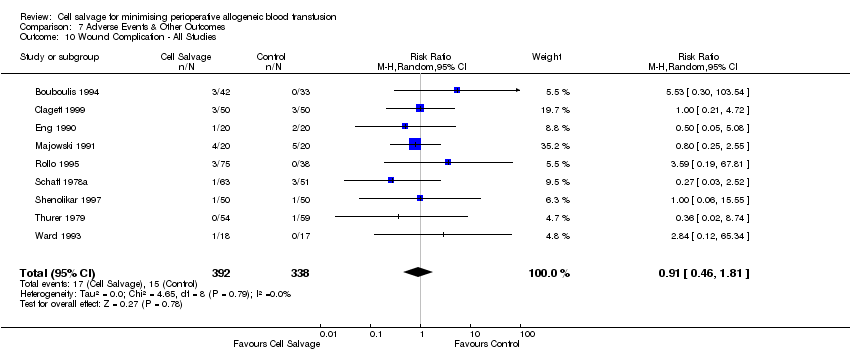
| 10 Wound Complication ‐ All Studies Show forest plot | 9 | 730 | Risk Ratio (M‐H, Random, 95% CI) | 0.91 [0.46, 1.81] |
|
| 11 Wound Complication ‐ CS vs Control Show forest plot | 7 | | Risk Ratio (M‐H, Random, 95% CI) | Subtotals only |
|
| 11.1 Active vs Control | 7 | 504 | Risk Ratio (M‐H, Random, 95% CI) | 0.88 [0.42, 1.81] |
| 12 Wound Complication ‐ Active vs Active Show forest plot | 2 | 226 | Risk Ratio (M‐H, Random, 95% CI) | 1.24 [0.13, 11.75] |
|
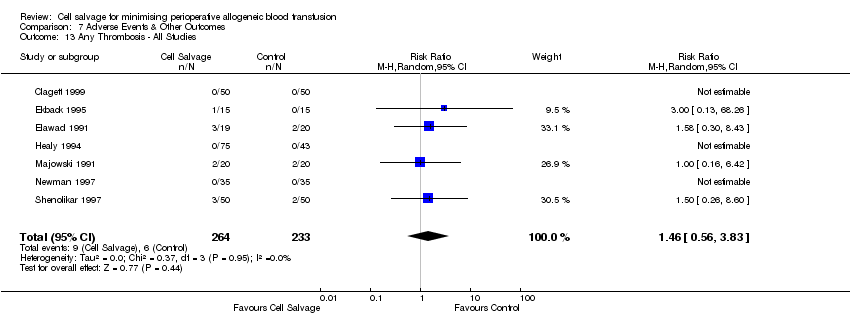
| 13 Any Thrombosis ‐ All Studies Show forest plot | 7 | 497 | Risk Ratio (M‐H, Random, 95% CI) | 1.46 [0.56, 3.83] |
|
| 14 Any Thrombosis ‐ CS vs Control Show forest plot | 6 | | Risk Ratio (M‐H, Random, 95% CI) | Subtotals only |
|
| 14.1 Active vs Control | 6 | 379 | Risk Ratio (M‐H, Random, 95% CI) | 1.46 [0.56, 3.83] |
| 15 Stroke ‐ All Studies Show forest plot | 4 | 496 | Risk Ratio (M‐H, Random, 95% CI) | 0.65 [0.17, 2.50] |
|
| 16 Stroke ‐ CS vs Control Show forest plot | 3 | | Risk Ratio (M‐H, Random, 95% CI) | Subtotals only |
|
| 16.1 Active vs Control | 3 | 298 | Risk Ratio (M‐H, Random, 95% CI) | 0.73 [0.14, 3.72] |
| 17 Non‐Fatal Myocardial Infarction ‐ All Studies Show forest plot | 9 | 831 | Risk Ratio (M‐H, Random, 95% CI) | 0.76 [0.40, 1.43] |
|
| 18 Non‐Fatal Myocardial Infarction ‐ CS vs Control Show forest plot | 5 | | Risk Ratio (M‐H, Random, 95% CI) | Subtotals only |
|
| 18.1 Active vs Control | 5 | 448 | Risk Ratio (M‐H, Random, 95% CI) | 0.58 [0.28, 1.19] |
| 19 Non‐Fatal Myocardial Infarction ‐ Active vs Active Show forest plot | 4 | 383 | Risk Ratio (M‐H, Random, 95% CI) | 1.89 [0.51, 6.98] |
|
| 20 Deep Vein Thrombosis (DVT) Show forest plot | 4 | | Risk Ratio (M‐H, Random, 95% CI) | Subtotals only |
|
| 20.1 Active vs Control | 4 | 249 | Risk Ratio (M‐H, Random, 95% CI) | 0.93 [0.31, 2.77] |
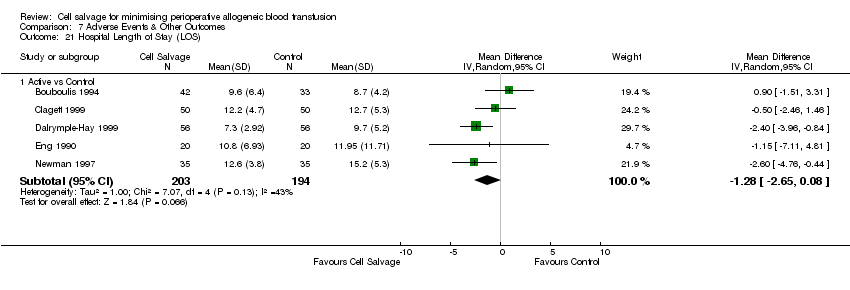
| 21 Hospital Length of Stay (LOS) Show forest plot | 5 | | Mean Difference (IV, Random, 95% CI) | Subtotals only |
|
| 21.1 Active vs Control | 5 | 397 | Mean Difference (IV, Random, 95% CI) | ‐1.28 [‐2.65, 0.08] |