Rescate celular para disminuir la transfusión perioperatoria de sangre alogénica
Referencias
Referencias de los estudios incluidos en esta revisión
Referencias de los estudios excluidos de esta revisión
Referencias adicionales
Characteristics of studies
Characteristics of included studies [ordered by study ID]
Ir a:
| Methods | Concealment of treatment allocation was by use of sealed envelopes. Method of generating allocation sequences was not described. | |
| Participants | 90 patients undergoing primary total knee arthroplasty were randomised to 1 of 3 groups: | |
| Interventions | (1) Group 1: No drain was used. | |
| Outcomes | Number of patients transfused allogeneic blood. | |
| Notes | Transfusion protocol used. | |
| Risk of bias | ||
| Bias | Authors' judgement | Support for judgement |
| Allocation concealment? | High risk | C ‐ Inadequate |
| Methods | Method of randomisation and allocation concealment was not described. | |
| Participants | 32 patients undergoing cardiac surgery requiring cardiopulmonary bypass were randomised to 1 of 2 groups: | |
| Interventions | (1) Group 1: received the volume of mediastinal shed blood that had been collected up to the point of transfusion. | |
| Outcomes | Amount of allogeneic blood transfused. | |
| Notes | Transfusion protocol used. | |
| Risk of bias | ||
| Bias | Authors' judgement | Support for judgement |
| Allocation concealment? | Unclear risk | B ‐ Unclear |
| Methods | Patients were randomly assigned on the basis of hospital number. The method of generating allocation sequences was not described. | |
| Participants | 232 patients undergoing total hip arthroplasties were randomly assigned to 1 of 2 groups: | |
| Interventions | (1) Group 1 (Autovac Post‐operative Orthopaedic Autotransfusion Canister group): blood was collected for 4 hours post‐operatively. The canister was injected with 40mls of acid‐citrate‐dextrose anticoagulant (ACD‐A) before activation. The canister was connected to wall suction with use of an Autovac Autotranfusion Regulator that limited maximum collection pressure to 100mmHg. If at least 300mls of blood was collected within 4 hours, the unwashed blood was reinfused through a microaggregate filter; if less than 300mls of blood was collected, the blood was discarded. Any blood that had not been reinfused within 6 hours after the beginning of collection was discarded. | |
| Outcomes | Number of patients transfused allogeneic and./or autologous blood. | |
| Notes | Transfusion protocol not reported. | |
| Risk of bias | ||
| Bias | Authors' judgement | Support for judgement |
| Allocation concealment? | High risk | C ‐ Inadequate |
| Methods | Method of randomisation and allocation concealment was not described. | |
| Participants | 75 consecutive patients undergoing coronary artery bypass graft surgery were randomised into 1 of 2 groups: | |
| Interventions | (1) Group1 (Autotransfusion group): received autotransfusion of shed mediastinal blood using the cardiotomy reservoir, after the completion of the coronary artery bypass grafting (CABG). As soon as the chest was closed, the mediastinal tubes were attached to the inlet port of the cardiotomy reservoir, which allows the chest tube drainage to pass through a 20 micron filter. The filtered blood was collected in the bottom of the cardiotomy reservoir, ready for reinfusion. The vacuum port was attached to wall suction apparatus and negative pressure was instituted at 20cm H2O. The chest drains were milked every 30 minutes. The collected blood was reinfused using a standard infusion pump. The hourly volume of mediastinal drainage was measured and the infusion pump adjusted to deliver this amount of blood over the next hour. Reinfusion was continued until the drainage was less than or equal to 50ml per hour for two consecutive hours. | |
| Outcomes | Amount of blood collected by the cell saver. | |
| Notes | Transfusion protocol used. | |
| Risk of bias | ||
| Bias | Authors' judgement | Support for judgement |
| Allocation concealment? | Unclear risk | B ‐ Unclear |
| Methods | A stratified block design was used to pre‐operatively assign patients to intervention or control groups. Concealment of treatment allocation was by sealed envelopes. | |
| Participants | 100 patients undergoing aortic surgery were randomly allocated to 1 of 2 groups: | |
| Interventions | (1) Group1: Intra‐operative autotransfusion with Cell Saver device. | |
| Outcomes | Number of patients transfused allogeneic blood. | |
| Notes | Transfusion protocol used. | |
| Risk of bias | ||
| Bias | Authors' judgement | Support for judgement |
| Allocation concealment? | Unclear risk | B ‐ Unclear |
| Methods | Method of randomisation and allocation concealment was not described. | |
| Participants | 112 patients undergoing cardiac surgery were randomised to 1 of 2 groups: | |
| Interventions | (1) Group 1: Autotransfusion group, transfused with washed post‐operative drainage fluid with a Fresenius Continuous Autotransfusion System. | |
| Outcomes | Amount of allogeneic blood transfused. | |
| Notes | Transfusion protocol used. | |
| Risk of bias | ||
| Bias | Authors' judgement | Support for judgement |
| Allocation concealment? | Unclear risk | B ‐ Unclear |
| Methods | Method of randomisation and allocation concealment was not described. | |
| Participants | 50 patients undergoing aortic surgery were randomly allocated to 1 of 2 groups: | |
| Interventions | (1) Group 1: blood was salvaged using the Sorenson autotransfusion system. Blood lost from the surgical site was suctioned into the Sorenson receptal device and this blood was retransfused into the patient at the time of surgery. Additional bood loss which was not able to be collected was replaced according to haematocrit levels, 3.5% polygeline being given if the haematocrit was above 30% and allogeneic blood if the haematocrit was below 30%. The collected blood was anticoagulated with an acid citrate dextrose solution and administered via a burette at a rate of 70ml for every 430ml of autologous blood collected. The scavenged blood was collected in a 1900ml sterile disposable Sorenson receptal ATS trauma liner contained within the rigid reusable receptal canister. When approximately 1 litre of autologous blood had been scavenged the liner was removed and this blood then administered to the patients after being filtered through a Pall 40 micron filter. | |
| Outcomes | Amount of blood re‐transfused from the cell saver. | |
| Notes | Transfusion protocol used. | |
| Risk of bias | ||
| Bias | Authors' judgement | Support for judgement |
| Allocation concealment? | Unclear risk | B ‐ Unclear |
| Methods | Method of randomisation and allocation concealment was not described. | |
| Participants | 100 patients undergoing myocardial revascularisation were randomly assigned to 1 of 4 groups: | |
| Interventions | (1) Group 1: patients received unprocessed oxygenator blood after the termination of extracorporeal circulation (ECC). | |
| Outcomes | Amount of blood re‐transfused from the cell saver. | |
| Notes | Transfusion protocol used. | |
| Risk of bias | ||
| Bias | Authors' judgement | Support for judgement |
| Allocation concealment? | Unclear risk | B ‐ Unclear |
| Methods | Method of randomisation and allocation concealment was not described. | |
| Participants | 45 patients undergoing total hip arthroplasty were randomly allocated to 1 of 3 groups; | |
| Interventions | (1) Group 1 (Control group): blood loss was replaced with heterologous erythrocyte concentrate (SAGM‐ERC) and 3% dextran 60 in a ratio of 1:1. If necessary, additional SAGM‐ERC was transfused to correct erythrocyte volume fraction (EVF)>27%. | |
| Outcomes | Amount of allogeneic blood transfused. | |
| Notes | Transfusion protocol used. | |
| Risk of bias | ||
| Bias | Authors' judgement | Support for judgement |
| Allocation concealment? | Unclear risk | B ‐ Unclear |
| Methods | Concealment of treament allocation was by use of sealed envelopes. Method of generating allocation sequences was not described. | |
| Participants | 40 patients undergoing primary total hip arthroplasty were randomly allocated to 1 of 2 groups: | |
| Interventions | (1) Group 1 (Intra‐operative autotransfusion ‐ IAT group): received autologous blood using the cell saver. Intraoperative blood salvage was performed using the Electromedic Autotrans AT1000 autotransfusion system. Blood was retrieved from the operative field with a double lumen suction catheter. The blood was immediately anticoagulated with sodium citrate. Larger debris was removed by a 240 micron filter in the cardiotomy reservoir. The filtered blood was pumped into a bowl centrifuge and washed with 1500ml saline. The supernatant was discarded. The erythrocyte concentrate was pumped into a reinfusion bag and then reinfused into the patient. | |
| Outcomes | Amount of allogeneic units transfused. | |
| Notes | Tranfusion protocol used. | |
| Risk of bias | ||
| Bias | Authors' judgement | Support for judgement |
| Allocation concealment? | High risk | C ‐ Inadequate |
| Methods | Method of randomisation and allocation concealment was not described. | |
| Participants | 40 patients (33 males and 7 females) undergoing elective coronary artery bypass surgery were randomised into 1 of 2 groups: | |
| Interventions | (1) Group 1: received postoperative autologous blood transfusion (AT) using the Shiley hardshell venous reservoir. At the end of the operation in theatre, the chest drains were connected to the Shiley hardshell venous reservoir using the Shiley drainage set. After the system was primed and specimens obtained for haematological, biochemical, and bacteriological analyses, transfusion of the shed blood was commenced, the rate depending on the amount of drainage, reinfusing the previous hours blood loss over the subsequent hour. At the end of 6 hours the AT was discontinued and further specimens were obtained. | |
| Outcomes | Amount of blood re‐transfused from the cell save. | |
| Notes | Transfusion protocol used. | |
| Risk of bias | ||
| Bias | Authors' judgement | Support for judgement |
| Allocation concealment? | Unclear risk | B ‐ Unclear |
| Methods | Method of randomisation and allocation concealment was not described [Italian article]. | |
| Participants | 82 patients undergoing myocardial revascularisation were randomised to 1 of 2 groups: | |
| Interventions | (1) Group 1: Autotransfusion was used. | |
| Outcomes | Amount of blood collected by the cell saver. | |
| Notes | Transfusion protocol used. | |
| Risk of bias | ||
| Bias | Authors' judgement | Support for judgement |
| Allocation concealment? | Unclear risk | B ‐ Unclear |
| Methods | A computer‐generated random number list was used to pre‐operatively assign patients to intervention or control groups. Method of allocation concealment was not described. | |
| Participants | 239 consecutive patients undergoing total knee replacement procedures were randomly assigned to 1 of 2 groups: | |
| Interventions | (1) Group 1: the wounds of patients in the study group were drained into Solcotrans (Solco Basle) postoperative blood salvage cannisters. There was a 6 hour total time limit for collection and reinfusion of blood. Because 40ml of citrate ACD‐A was entered in each Solcotrans canister prior to use, a minimum of 320ml of blood and citrate volume was necessary before reinfusion to prevent citrate toxicity. If wound drainage was slow and an adequate volume had not been collected before the 6‐hour time limit, the canister and blood were discarded, and a standard collection canister was attached to the drainage tube for the duration. If wound drainage was rapid, the canister was allowed to fill completely (500ml volume). The blood was then infused at an appropraite rate as long as the 6‐hour pre‐canister limit was not exceeded. Another Solcotrans canister could then be attached, beginning a new 6‐hour time interval. | |
| Outcomes | Amount of blood re‐transfused from the cell saver. | |
| Notes | Transfusion protocol used. | |
| Risk of bias | ||
| Bias | Authors' judgement | Support for judgement |
| Allocation concealment? | Unclear risk | B ‐ Unclear |
| Methods | Method of randomisation and allocation concealment was not described. | |
| Participants | 128 patients undergoing total hip arthroplasty, total knee arthroplasty, or spine fusion were randomly allocated to 1 of 3 groups: | |
| Interventions | (1) Group 1 received autologous shed blood reinfusion collected from wound drainage by an Orth‐evac device. | |
| Outcomes | Amount of blood collected by the cell saver. | |
| Notes | Transfusion protocol not reported. | |
| Risk of bias | ||
| Bias | Authors' judgement | Support for judgement |
| Allocation concealment? | Unclear risk | B ‐ Unclear |
| Methods | Method of randomisation and allocation concealment was not described. | |
| Participants | 81 patients undergoing elective knee arthroplasty were randomly assigned to 1 of 2 groups: | |
| Interventions | (1) Group 1: patients underwent drainage and autotransfusion transfusion using a Solcotrans system. The autologous blood collected into the drainage and transfusion device was transfused if specific transfusion guidelines were met. Patients were transfused the initial unit of Solcotrans blood if 350ml or more had been collected within 3 hours of the patients entry to the recovery room. The 3‐hour collection time provided for collection and transfusion of the blood within the maximum interval of 6 hours. After successful collection and transfusion of the first autologous blood unit, a second autologous blood collection device was attached. For this and subsequent collections, autologous blood was transfused if 150ml or more was collected within 3 hours. When the rate of drainage was less than 250ml of blood within a 3 hour period, a subsequent drainage and transfusion device was not attached. The first Solcotrans device attached to the drain contained 40ml of ACD‐A. | |
| Outcomes | Amount of allogeneic blood transfused. | |
| Notes | Transfusion protocol used. | |
| Risk of bias | ||
| Bias | Authors' judgement | Support for judgement |
| Allocation concealment? | Unclear risk | B ‐ Unclear |
| Methods | Patients were randomised on an alternating basis to either intervention or control. Method of randomisation was not described. | |
| Participants | 36 patients undergoing aortobifemoral or aortobi‐iliac bypass for occlusive disease were randomised to 1 of 2 groups: | |
| Interventions | (1) Group 1: Cell Saver Autotransfusion Device (Haemonetics) was monitored and operated by a technician‐member of the perfusion team. | |
| Outcomes | Amount of blood re‐transfused from the cell saver. | |
| Notes | Transfusion protocol used. | |
| Risk of bias | ||
| Bias | Authors' judgement | Support for judgement |
| Allocation concealment? | High risk | C ‐ Inadequate |
| Methods | Each patient was allocated on an alternating basis to one of two groups. The method of randomisation was not described. | |
| Participants | 40 patients undergoing elective coronary artery bypass graft surgery (CABG) were randomised to 1 of 2 groups: | |
| Interventions | (1) Group 1: Cell‐Saver group all received peri‐operative autotransfusion of blood processed by means of the Cell‐Saver III‐plus with a 225ml bowl. Additionally, allogeneic packed cells were transfused to maintain an Hct at 30%. | |
| Outcomes | Amount of blood collected by the cell saver. | |
| Notes | Transfusion protocol used. | |
| Risk of bias | ||
| Bias | Authors' judgement | Support for judgement |
| Allocation concealment? | High risk | C ‐ Inadequate |
| Methods | Each patient was allocated on an alternating basis to one of two groups. The method of randomisation was not described. | |
| Participants | 60 patients undergoing total hip arthroplasty or dorsal lumbo‐sacral fusion surgery were randomised to 1 of 2 groups: | |
| Interventions | (1) Group 1: all patients received peri‐operative autotransfusion by means of the Haemonetics Haemolite‐2 with a 200ml bowl. Allogeneic packed cells were transfused to maintain the patients Hct at 30%. The blood shed intra‐operaively and during the first six post‐operative hours was collected and heparinised. The blood was processed in the Haemolite‐2 by personnel of the Intensive Care Unit. The erythrocyte suspension thus produced was transfused to the patient within 4 hours after collection through a 40 micron blood filter. Blood cultures were taken before retransfusion to the patient. | |
| Outcomes | Amount of blood collected by the cell saver. | |
| Notes | Transfusion protocol used. | |
| Risk of bias | ||
| Bias | Authors' judgement | Support for judgement |
| Allocation concealment? | High risk | C ‐ Inadequate |
| Methods | Patients were randomised by coded instruction packets which specified the processing and administration of the patient's salvaged intra‐operative blood. Sealed instruction packets were randomised using a shuffle deck procedure, serially numbered, and assigned sequentially to patients in order of enrollment. The sealed instruction packets were sent with the patients to the operating room. | |
| Participants | 50 patients undergoing primary coronary revascularisation were randomised to 1 of 2 groups: | |
| Interventions | (1) Group 1: blood was scavenged from the surgical field in all cases using an autologous blood scavenging system (Cell Saver 4, Haemonetics). The shed blood collected from the operative field and the pump blood were washed and then reinfused. | |
| Outcomes | Amount of blood re‐transfused from the cell saver. | |
| Notes | Transfusion protocol used. | |
| Risk of bias | ||
| Bias | Authors' judgement | Support for judgement |
| Allocation concealment? | High risk | C ‐ Inadequate |
| Methods | Method of randomisation and allocation concealment was not described. | |
| Participants | 135 patients undergoing cardiac surgery were randomised to 1 of 2 groups: | |
| Interventions | (1) Group 1: after use in extracorporeal circulation, the cardiotomy reservoir (Dideco 742) was reconfigured to serve as a receptacle for post‐operative mediastinal drainage. One of the inlet ports was connected to the tubes draining the mediastinum. In this way the drainage from the chest passed through the 20 micron filter of the cardiotomy reservoir. The cardiotomy outlet tubing was replaced with an adapter connecting with standard intravenous tubing. A standard infusion pump was used to reinfuse the collected blood.The filtered blood collecting in the reservoir was reinfused at hourly intervals. No blood was reinfused after the 6th post‐operative hour. Thereafter the reservoir served only as a receptable for shed mediastinal blood. Reservoir blood was sampled at 6 hours for bacteriologic study. | |
| Outcomes | Amount of blood re‐transfused from the cell saver. | |
| Notes | Transfusion protocol not reported. | |
| Risk of bias | ||
| Bias | Authors' judgement | Support for judgement |
| Allocation concealment? | Unclear risk | B ‐ Unclear |
| Methods | Method of randomisation and allocation concealment was not clear [German article]. | |
| Participants | 64 patients scheduled for total hip arthroplasty were randomly divided into 1 of 4 groups: | |
| Interventions | (1) Group 1: preoperative autologous donations were stored in CPDA‐1 buffer. Three units of 450ml were requested. A predonation haemoglobin (Hb) concentration of 11g/dL was required. Surgery was carried out in the 5th week after the first donation. | |
| Outcomes | Amount of allogeneic blood transfused. | |
| Notes | Transfusion protocol use. | |
| Risk of bias | ||
| Bias | Authors' judgement | Support for judgement |
| Allocation concealment? | Unclear risk | B ‐ Unclear |
| Methods | Patients were randomised using a computer‐generated randomisation table. Method of allocation concealment was not described. | |
| Participants | 99 patients undergoing elective primary total knee replacement surgery were randomly allocated to one of two groups: | |
| Interventions | (1) Group 1: blood salvage was performed using a semi‐automated autotransfuser (Electromedics BT‐795) according to the manufacturer's instructions. Intra‐operative blood salvage was performed by a nurse in conjunction with an anaesthetist. Post‐operative blood salvage was a continuation of the intra‐operative salvage for a duration not exceeding 6 hours after the tourniquet was released. On completion of salvage, the wound drains were connected to two vacuum‐charged Redivac bottles and the drains were removed at 48 hours post operation. The average volume of blood salvaged in each patient was calculated after adjusting the haematocrit to 40%. Transfusions were used intra/post‐operatively to maintain a safe blood volume and the haemoglobin level around 100g/L. | |
| Outcomes | Number of patients transfused allogeneic blood. | |
| Notes | Transfusion protocol used. | |
| Risk of bias | ||
| Bias | Authors' judgement | Support for judgement |
| Allocation concealment? | Unclear risk | B ‐ Unclear |
| Methods | Method of randomisation and allocation concealment was not described. | |
| Participants | 40 patients undergoing primary unilateral total knee arthroplasty were randomised to 1 of 2 groups: | |
| Interventions | (1) Group 1: the two deep intra‐articular drains were connected to a Solcotrans reservoir and a suction pressure of 80mmHg applied for an initial period of 10 minutes, after which the wound was allowed to drain by gravity alone. Two Solcotrans reservoirs were attached sequentially to each patient regardless of the volume drained. Blood was reinfused if a sufficient volume had been collected. Drains were removed at 48 hours. | |
| Outcomes | Amount of blood collected by the cell saver. | |
| Notes | Transfusion protocol used. | |
| Risk of bias | ||
| Bias | Authors' judgement | Support for judgement |
| Allocation concealment? | Unclear risk | B ‐ Unclear |
| Methods | Method of randomisation and allocation concealment was not described. | |
| Participants | 198 patients undergoing coronary arery bypass grafting (CABG) or valvular surgery were randomised to 1 of 2 groups: | |
| Interventions | (1) Group 1: were treated with an autotransfusion system (Atrium Medical Corporation) consisting of 28F thoracic tubes connected to a 3 chamber system. All collected blood is filtered through a filter and autotransfused until no drainage was present or for a maximum period of 12 hours. Transfusion began 1 hour after the patient arrived in ICU. | |
| Outcomes | Number of patients transfused allogeneic blood. | |
| Notes | Transfusion protocol used. | |
| Risk of bias | ||
| Bias | Authors' judgement | Support for judgement |
| Allocation concealment? | Unclear risk | B ‐ Unclear |
| Methods | Randomisation was performed using a random numbers table. Allocation concealment was not described. | |
| Participants | 111 patients undergoing elective primary total hip arthroplasty (THA) and total knee arthroplasty (TKA) were randomly assigned to 1 of 2 groups: | |
| Interventions | (1) Group 1: were treated with a blood collection system, CBC Consta Vac, a battery‐operated suction unit set at 62mmHg, with a 800ml collection canister. The CBC Consta Vac system has an umbrella valve that ensures that the top 100ml of fluid containing serum fat, and bone debris does not leave the reservoir. Post‐operative drainage was collected, and the unwashed red blood cells were reinfused within a 6‐hour period. The blood was reinfused through a 20um macroaggregate filter. | |
| Outcomes | Number of patients transfused allogeneic or autologous blood Post‐operative drainage. | |
| Notes | Transfusion protocol not reported. | |
| Risk of bias | ||
| Bias | Authors' judgement | Support for judgement |
| Allocation concealment? | Unclear risk | B ‐ Unclear |
| Methods | Patient allocations were generated from random number tables by an independent observer and concealed in sealed opaque envelopes. | |
| Participants | 256 patients undergoing elective coronary artery bypass surgery were randomly allocated to 1 of 3 groups: | |
| Interventions | (1) Group 1: during surgery blood from the operation site was collected in a storage system. At the termination of cardiopulmonary bypass, blood remaining in the bypass circuit was added to the storage system. This blood was then centrifuged using a cell salvage system (Dideco Compact cell saver) leaving a concentrated solution of red blood cells with a haematocrit of 50‐60%. This autologous blood was then re‐transfused to the patient during the intra‐operative period. | |
| Outcomes | Number of patients transfused allogeneic blood. | |
| Notes | Transfusion protocol used. | |
| Risk of bias | ||
| Bias | Authors' judgement | Support for judgement |
| Allocation concealment? | High risk | C ‐ Inadequate |
| Methods | Method of randomisation and allocation concealment was not described [German article]. | |
| Participants | 42 patients undergoing total hip surgery and predonor plasmapheresis (Abbott Autotrans) were randomised into 1 of 3 groups: | |
| Interventions | (1) Group 1: for the substitution of blood loss, patients received, in addition to crystalloids and colloids, only allogeneic red blood cells (erythrocyte concentrate). Cell salvage was not used. | |
| Outcomes | Amount of blood re‐transfused from the cell saver. | |
| Notes | Transfusion protocol used. | |
| Risk of bias | ||
| Bias | Authors' judgement | Support for judgement |
| Allocation concealment? | Unclear risk | B ‐ Unclear |
| Methods | Method of randomisation was not reported and allocation concealment was unclear. Baseline comparability was unclear. However the study reported that, "no significant difference between groups were detected at any stage of the study." Participants were not blind to treatment allocation and blinding of the outcome assessor was unclear [Russian article]. | |
| Participants | 66 patients undergoing elective coronary artery bypass surgery (CABG) were randomly allocated to 1 of 2 groups: | |
| Interventions | Group 1: no retransfusion of drainage discharge. | |
| Outcomes | Number of patients transfused allogeneic blood. | |
| Notes | Transfusion protocol not reported. | |
| Risk of bias | ||
| Bias | Authors' judgement | Support for judgement |
| Allocation concealment? | Unclear risk | D ‐ Not used |
| Methods | Randomisation was by random‐number tables. Method of allocation concealment was not described. | |
| Participants | 70 consecutive patients undergoing unilateral total knee replacement with a cruciate‐sparing Kinemax Plus prosthesis were randomly allocated to 1 of 2 groups: | |
| Interventions | (1) Group 1: deep and superficial drains were inserted before skin closure and connected to the Dideco 797 reinfusion system which maintains a constant suction of ‐25mmHg. The drainage collected was mixed with citrate in a ratio of 12:1, filtered during collection and again during reinfusion through a 40um filter. No washing took place. Drainage was collected for 6 hours or until 500 ml had accumulated, at which point reinfusion of the unwashed salvaged blood took place. | |
| Outcomes | Amount of blood re‐transfused from cell saver. | |
| Notes | Transfusion protocol not reported. | |
| Risk of bias | ||
| Bias | Authors' judgement | Support for judgement |
| Allocation concealment? | Unclear risk | B ‐ Unclear |
| Methods | Method of randomisation and allocation concealment was not described. | |
| Participants | 100 consecutive patients undergoing elective coronary artery or valvular operations were randomly allocated to 1 of 2 groups: | |
| Interventions | (1) Group 1 ‐ a Polystan soft‐shell cardiotomy reservoir (Polystan A/S Walgerholm 8) was used during bypass. Blood was drained into conventional drainage bottles with an applied suction of 25cmH2O. | |
| Outcomes | Amount of blood re‐transfused from the cell saver. | |
| Notes | Transfusion protocol used. | |
| Risk of bias | ||
| Bias | Authors' judgement | Support for judgement |
| Allocation concealment? | Unclear risk | B ‐ Unclear |
| Methods | Method of randomisation and allocation concealment was not described. | |
| Participants | 66 patients undergoing aortocoronary bypass surgery were randomly assigned to 1 of 3 groups: | |
| Interventions | (1) Group 1: patients received allogeneic blood transfusions if their haematocrit fell below 20% during bypass, 28% at the end of the procedure, 30% within 24 hours, or if their haemoglobin level was less than 10g/dL while on the cardiac surgery ward (8 to 10 days). | |
| Outcomes | Amount of blood re‐transfused from the cell saver. | |
| Notes | Transfusion protocol used. | |
| Risk of bias | ||
| Bias | Authors' judgement | Support for judgement |
| Allocation concealment? | Unclear risk | B ‐ Unclear |
| Methods | A random number table was used to assign patients in equal numbers to the two groups. Method of allocation concealment was not described. | |
| Participants | 50 patients undergoing elective spinal surgery were randomly assigned to 1 of 2 groups: | |
| Interventions | (1) Group 1: post‐operatively drained blood was collected into a Solcotrans Orthopedic Plus system. The salvaged blood was considered for re‐infusion. | |
| Outcomes | Amount of blood re‐transfused from the cell saver. | |
| Notes | Transfusion protocol used. | |
| Risk of bias | ||
| Bias | Authors' judgement | Support for judgement |
| Allocation concealment? | Unclear risk | B ‐ Unclear |
| Methods | Patients were randomised by month of birth into four groups. | |
| Participants | 153 patients undergoing primary total hip arthroplasty were randomised to 1 of 4 groups: | |
| Interventions | (1) Group 1: the intra‐operative salvage of red blood cells was performed with the Haemonetics Cell‐Saver. A paediatric bowl was used for the processing of salvaged, shed blood. This collection was continued after surgery through two medium drains while the patient remained in the recovery room. A closed‐suction standard Hemovac drain was placed when salvage was discontinued. | |
| Outcomes | Amount of allogeneic and/or autologous blood transfused. | |
| Notes | Patients were able to donate at least 2 units of autologous blood pre‐operatively were included in the study. | |
| Risk of bias | ||
| Bias | Authors' judgement | Support for judgement |
| Allocation concealment? | High risk | C ‐ Inadequate |
| Methods | Patients were randomised by month of birth into four groups. | |
| Participants | 153 patients undergoing primary total hip arthroplasty were randomised to 1 of 4 groups: | |
| Interventions | (1) Group 1: the intra‐operative salvage of red blood cells was performed with the Haemonetics Cell‐Saver. A paediatric bowl was used for the processing of salvaged, shed blood. This collection was continued after surgery through two medium drains while the patient remained in the recovery room. A closed‐suction standard Hemovac drain was placed when salvage was discontinued. | |
| Outcomes | Amount of allogeneic and/or autologous blood transfused. | |
| Notes | Patients able to donate at least 2 units of autologous blood were included in the study. | |
| Risk of bias | ||
| Bias | Authors' judgement | Support for judgement |
| Allocation concealment? | High risk | C ‐ Inadequate |
| Methods | Method of randomisation and allocation concealment was not described. [French article] | |
| Participants | 30 patients undergoing total knee arthroplasty were randomised to 1 of 3 groups: | |
| Interventions | (1) Group 1: an Ortho‐evac system (not containing an anticoagulant) was connected to the deep suction drains in the operating room, after skin closure and before tourniquet removal. The salvaged blood was reinfused in the subsequent six hours via a 40 micron filter. The volume of collected blood was measured and allogeneic blood was added as required, to maintain a haematocrit of 30%. A blood sample was obtained before surgery, before reinfusion, two hours later, one day later, and from the collecting device before reinfusion. The Ortho‐evac system had a 1000ml capacity. | |
| Outcomes | Amount of blood collected by the cell saver. | |
| Notes | Transfusion protocol used. | |
| Risk of bias | ||
| Bias | Authors' judgement | Support for judgement |
| Allocation concealment? | Unclear risk | B ‐ Unclear |
| Methods | Method of randomisation and allocation concealment was not described. | |
| Participants | 120 patients undergoing total knee arthroplasty randomised to 1 of 2 groups: | |
| Interventions | (1) Group 1: autotransfusion was used. Methods used to perform cell salvage were not described. | |
| Outcomes | Number of patients transfused allogeneic blood. | |
| Notes | Transfusion protocol not reported. | |
| Risk of bias | ||
| Bias | Authors' judgement | Support for judgement |
| Allocation concealment? | Unclear risk | B ‐ Unclear |
| Methods | Patients were randomised by odd or even history numbers to either intervention or control groups. | |
| Participants | 114 patients undergoing cardiac surgery were randomised to 1 of 2 groups: | |
| Interventions | (1) Group 1: patients were treated with a Sorenson autotransfusion system (ATS) for the collection of shed mediastinal blood. Blood collected in the ATS bags was considered suitable for autotransfusion only if 400mls or more was collected within 4 hours. If the rate of mediastinal bleeding was slow and 4 hours passed without 400ml volume being collected, this blood was not reinfused. If Hct values were below 35% and left ventricular filling was judged to be adequate, whole blood and/or packed red blood cells were infused to restore intravascular volume. With higher haematocrit and with low left ventricular filling pressures, patients received an infusion of colloid solution or crystalloid solution (Ringer's lactate). Shed mediastinal blood was given in preference to stored bank blood when volume replacement was necessary. | |
| Outcomes | Amount of allogeneic blood transfused. | |
| Notes | Transfusion protocol not reported. | |
| Risk of bias | ||
| Bias | Authors' judgement | Support for judgement |
| Allocation concealment? | High risk | C ‐ Inadequate |
| Methods | Method of randomisation was not described. Allocation concealment was by means of sealed envelopes. | |
| Participants | 120 adult patients undergoing primary elective coronary artery bypass grafting were randomly allocated to 1 of 2 groups: | |
| Interventions | (1) Group 1: at the end of the operation, the mediastinal and pleural tubes were attached to the inlet port of the Bard cardiotomy / autotransfusion reservoir. Shed mediastinal blood from the cardiotomy reservoir was transfused every hour for the first 18 postoperative hours if more than 20ml of blood had accumulated. Prior to transfusion the shed mediastinal blood was filtered through a 40micron filter in the cardiotomy reservoir. | |
| Outcomes | Amount of blood re‐transfused from the cell saver. | |
| Notes | Transfusion protocol used. | |
| Risk of bias | ||
| Bias | Authors' judgement | Support for judgement |
| Allocation concealment? | High risk | C ‐ Inadequate |
| Methods | Method of randomisation and allocation concealment was not described. | |
| Participants | 40 patients undergoing elective primary unilateral internal mammary (IMA) artery bypass grafting were randomly assigned to 1 of 2 groups: | |
| Interventions | (1) Group 1: patients underwent internal mammary artery (IMA) surgery with pre‐bypass removal of autologous blood, reinfusion of the remaining volume in the extracorporeal circuit (ECC) after aortic decannulation, administration of 200ml aprotinin containing 280mg of aprotinin (2 million kallikrein inactivator units) added to the pump prime, acceptance of normovolemic anaemia (Hct greater than or equal to 25%) and autotransfusion of the shed blood post‐operatively. | |
| Outcomes | Amount of blood re‐transfused from the cell saver. | |
| Notes | Transfusion protocol used. | |
| Risk of bias | ||
| Bias | Authors' judgement | Support for judgement |
| Allocation concealment? | Unclear risk | B ‐ Unclear |
| Methods | Patients were allocated to groups according to a computer generated randomisation schedule. Method of allocation concealment was not described. | |
| Participants | 100 consecutive patients undergoing total knee replacement were randomised to 1 of 2 groups: | |
| Interventions | (1) Group 1: a Haemonetics cell saver 3 machine was used for post‐operative cell salvage. Blood was collected via the wound drains following the release of the tourniquet. The collected blood was anticoagulated with heparinised saline. The machine aspirate the wound drainage into the centrifuge bowl via roller pumps. The blood underwent accelerated sedimentation, being spun at 5600 revs/per/minute. The supernatant was discarded and the resulting red cells washed and resuspended in normal saline. The machines produced a product with a haematocrit of over 55% and a volume of 250 ml. When the post‐operative haemoglobin fell below 9.0g/dL they were transfused with allogeneic transfusion. | |
| Outcomes | Amount of blood collected by the cell saver. | |
| Notes | Transfusion protocol used. | |
| Risk of bias | ||
| Bias | Authors' judgement | Support for judgement |
| Allocation concealment? | Unclear risk | B ‐ Unclear |
| Methods | Method of randomisation and allocation concealment was not described. | |
| Participants | 40 patient undergoing first time coronary artery bypass graft sugery were randomly divided into 1 of 2 groups. The 2 groups were further subdivided according to whether the patients received aspirin preoperatively or not: | |
| Interventions | (1) Group 1: patients were transfused post‐operatively with allogeneic blood. Patients from this group received 75mg of aspirin daily pre‐operatively. | |
| Outcomes | Amount of allogeneic blood transfused. | |
| Notes | Transfusion protocol used. | |
| Risk of bias | ||
| Bias | Authors' judgement | Support for judgement |
| Allocation concealment? | Unclear risk | B ‐ Unclear |
| Methods | Method of randomisation and allocation concealment was not described. | |
| Participants | 24 patients undergoing elective total joint arthroplasty were randomly assigned to 1 of 2 groups: | |
| Interventions | (1) Group 1: a Solcotrans drain was inserted in the operating room and connected to the collection unit and placed under continuous suction (‐20cmH2O) once wound closure was complete. Collection continued for 6‐hours or until the unit was full. At that time, the amount of drainage was noted. If greater than 350ml, the drainage was reinfused and a new Solcotrans unit connected. ACD‐A (citrate‐based anticoagulant) was used in each unit (40mls). If the drainage was greater than 150ml but less than 350ml, the drainage was reinfused and a standard, spring loaded, closed intermittent suction canister was connected. If the drainage was less than 150ml, the drainage was not reinfused and collection continued, either in the Solcotrans canister or a closed suction drain. | |
| Outcomes | Amount of blood collected by the cell saver. | |
| Notes | Transfusion protocol used. | |
| Risk of bias | ||
| Bias | Authors' judgement | Support for judgement |
| Allocation concealment? | Unclear risk | B ‐ Unclear |
| Methods | Method of randomisation and allocation concealment was not described. | |
| Participants | 109 patients undergoing total hip or knee arthroplasty were randomly assigned to 1 of 2 groups: | |
| Interventions | (1) Group 1: a Hemolite cell saver was used. The wound drainage tubes were connected in the operating room to a sterile reservoir which contained 200ml of a heparin saline solution.The reservoir was connected to wall suction (120mmHg) in the operating suite. Collection was continued in the post‐anaesthetic care unit and the surgical ward. At the end of the 4 hour period the collected wound drainage was processed. Under sterile conditions the blood was washed with 2 litres of saline and processed in the Hemolite cell washer to remove heparin, cellular debris, platelets and clotting factors. After processing, the wound drainage consisted of concentrated red blood cells suspended in saline. This product was transfused back to the patient. After wound drainage collection was completed, the drains were attached to standard Hemovac suction and output was monitored at 8 hour intervals until the drains were disconnected at 48 hours. | |
| Outcomes | Amount of blood collected by the cell saver. | |
| Notes | Transfusion protocol not reported. | |
| Risk of bias | ||
| Bias | Authors' judgement | Support for judgement |
| Allocation concealment? | Unclear risk | B ‐ Unclear |
| Methods | Method of randomisation not described. Allocation concealment was by sealed envelopes. | |
| Participants | 50 patients undergoing elective infrarenal abdominal aortic aneurysm surgery were randomised to 1 of 2 groups: | |
| Interventions | (1) Group 1: patients received autologous blood via intra‐operative autotransfusion (IAT). A COBE Baylor rapid autologous transfusion system was employed for intraoperative cell salvage. Blood was retrieved from the operative site by suctioning into a double lumen catheter at less than 150mmHg, to minimise haemolysis. Blood was anticoagulated with heparin (30,000 Units / 1litre 0.9% saline). The salvaged blood was then collected in a reservoir where a macrofilter of 150 microns removed larger particles of debris. When 500 ml of blood was collected, it was pumped to a spinning centrifuge bowl. The red cells were washed with 0.9% saline, and concentrated to a Hct above 50%. The effluent containing plasma fractions, platelets, leukocytes, free haemoglobin, anticoagulant and saline was discarded. The washed red cells, suspended in saline were pumped from the centrifuge to the patient through a microfilter of either 20 or 40 microns. | |
| Outcomes | Amount of allogeneic blood transfused. | |
| Notes | Transfusion protocol used. | |
| Risk of bias | ||
| Bias | Authors' judgement | Support for judgement |
| Allocation concealment? | High risk | C ‐ Inadequate |
| Methods | Method of randomisation and allocation concealment was not described. | |
| Participants | 150 consecutive patients undergoing elective valve surgery using cardiopulmonary bypass were randomly allocated to 1 of 2 groups: | |
| Interventions | (1) Group 1: received autologous fresh blood donated before bypass, and both cell saver and membrane oxygenator were used. Autologous blood was removed by a central venous catheter after induction of anaesthesia and collected in citrate phosphate preservative at room temperature for subsequent transfusion. Blood volume was maintained with a simultaneous infusion of Ringer's lactate solution. A Dideco, Shiley cell saver system was used to collect all blood at the operation site. This system heparinises, washes, and centrifuges the blood to produce a red cell concentrate for transfusion. At the conclusion of CPB, all the blood remaining in the oxygenator was also processed by the cell saver in preparation for subsequent transfusion. A "Maxima" membrane oxygenator was used for this group. | |
| Outcomes | Amount of allogeneic blood transfused. | |
| Notes | Transfusion protocol used. | |
| Risk of bias | ||
| Bias | Authors' judgement | Support for judgement |
| Allocation concealment? | Unclear risk | B ‐ Unclear |
| Methods | Method of randomisation and allocation concealment was not described. | |
| Participants | 60 patients undergoing cardiac valve surgery were randomised to 1 of 3 groups: | |
| Interventions | (1) Group1: patients were treated with cell salvage using a Dideco system before heparin and after protamine administration. | |
| Outcomes | Amount of allogeneic blood transfused. | |
| Notes | Transfusion protocol used. | |
| Risk of bias | ||
| Bias | Authors' judgement | Support for judgement |
| Allocation concealment? | Unclear risk | B ‐ Unclear |
| Methods | Method of randomisation and allocation concealment was not described. | |
| Participants | 231 patients undergoing elective total knee replacement surgery were randomly allocated to 1 of 2 groups: | |
| Interventions | (1) Group 1: patients received autotransfusion of wound drainage if the volume of blood collected was greater than 125 ml post‐operatively. The collected blood was washed and re‐suspended in saline before re‐infusion using a centrifugal cell washing machine (Cell Saver 5 ‐ Haemonetics). Patients in the cell salvage group were transfused allogeneic red blood cells if their haemoglobin fell below a haemoglobin level of 9.0 g/dL after autotransfusion was completed. | |
| Outcomes | Number of patients transfused allogeneic blood. | |
| Notes | Transfusion protocol used. | |
| Risk of bias | ||
| Bias | Authors' judgement | Support for judgement |
| Allocation concealment? | Unclear risk | B ‐ Unclear |
| Methods | Method of randomisation and allocation concealment was not described. | |
| Participants | 113 consecutive adult patients undergoing cardiac surgical procedures requiring cardiopulmonary bypass were randomised to 1 of 2 groups: | |
| Interventions | (1) Group 1: shed mediastinal blood was collected post‐operatively by an autotransfusion system (Sorenson). Suction was applied (‐20cmH2O), allowing shed blood to flow into the upper bag of the system and then through two 170 micron filters into a lower 800ml collection bag. The lower bag was then disconnected from the system and its contents infused, the collected blood being transfused through an in‐line 40 micron filter. No blood was allowed to remain in the system longer than 4 hours. Shed blood that was not utilised during this time period was discarded. When notable bleeding ceased (4‐8 hours) retransfusion was no longer employed. | |
| Outcomes | Amount of blood collected by the cell saver. | |
| Notes | Transfusion protocol used. | |
| Risk of bias | ||
| Bias | Authors' judgement | Support for judgement |
| Allocation concealment? | Unclear risk | B ‐ Unclear |
| Methods | Patients were randomised on the day before surgery using a computer randomisation programme. Method of allocation concealment was not described. | |
| Participants | 105 patients undergoing primary elective coronary artery bypass graft surgery were randomised to 1 of 3 groups: | |
| Interventions | (1) Group 1: chest drains were connected to underwater sealed drainage bottles with suction applied at 10Kpa. Cell salvage was not performed. | |
| Outcomes | Amount of blood re‐transfused from the cell saver. | |
| Notes | Transfusion protocol used. | |
| Risk of bias | ||
| Bias | Authors' judgement | Support for judgement |
| Allocation concealment? | Unclear risk | B ‐ Unclear |
| Methods | Method of randomisation and allocation concealment was not described. | |
| Participants | 35 consecutive male patients undergoing elective myocardial revascularisation or valve replacement were randomised to 1 of 2 groups: | |
| Interventions | (1) Group 1: patients received autotransfusions with mediastinal shed blood for the first 12 hours post‐operatively. Autotransfusion involved reinfusion within 4 hours, a minimum of 100ml of chest drainage in the reservoir before initiation of autotransfusion, and discontinuation of autotransfusion for core temperatures greater than 39.5 degrees celsius. A two‐filter system was employed to minimise emboli. | |
| Outcomes | Amount of blood re‐transfused from the cell saver. | |
| Notes | Transfusion protocol used. | |
| Risk of bias | ||
| Bias | Authors' judgement | Support for judgement |
| Allocation concealment? | Unclear risk | B ‐ Unclear |
| Methods | Methods of randomisation and allocation concealment was not described. | |
| Participants | 42 patients undergoing cardiac operations were randomised to 1 of 2 groups: | |
| Interventions | (1) Group 1: patients received non‐washed shed mediasinal blood during the post‐operative period. | |
| Outcomes | Amount of blood re‐transfused from the cell saver. | |
| Notes | Transfusion protocol not reported. | |
| Risk of bias | ||
| Bias | Authors' judgement | Support for judgement |
| Allocation concealment? | Unclear risk | B ‐ Unclear |
| Methods | Method of randomisation and allocation concealment were unclear. Participants were not blind to treatment allocation and blinding of the outcome assessor was unclear. | |
| Participants | 60 patients undergoing elective primary coronary artery bypass graft surgery were randomly allocated to 1 of 2 groups: | |
| Interventions | (1) Group 1: patients received non‐washed shed mediastinal blood retransfused postoperatively after CABG using a cell saver device (Beijing PerMed Biomedical Engineering Company) up to 18 hours post‐surgery. Shed blood not returned within 4 hours was discarded and a new bag attached. When more than 200mls shed mediastinal blood collected within 4 hours the patients received autologous blood if volume replacement was considered necessary. Extracorporeal blood was routinely returned to patients after CABG. Length of cardiopulmonary bypass (CPB) = 121+/‐26 minutes. Aortic cross‐clamp time 74+/‐15 minutes. Volume of autologous blood collected/retransfusion. | |
| Outcomes | Number of patients transfused allogeneic blood; volume of allogeneic blood transfused (mls). | |
| Notes | Transfusion protocol used. | |
| Risk of bias | ||
| Bias | Authors' judgement | Support for judgement |
| Allocation concealment? | Unclear risk | B ‐ Unclear |
Characteristics of excluded studies [ordered by study ID]
Ir a:
| Study | Reason for exclusion |
| Insufficient data. | |
| Compared two active interventions. No control group. | |
| Insufficient data. | |
| Insufficient data. | |
| Duplicate article. | |
| Insufficient data. | |
| Inappropriate control group. | |
| Duplicate article. | |
| Insufficient data. | |
| Insufficient data. | |
| Insufficient data. | |
| Insufficient data. | |
| Insufficient data. | |
| Duplicate article. | |
| Duplicate article. | |
| Duplicate article. | |
| Insufficient data. | |
| Insufficient data. | |
| Compared two active interventions. No control group. | |
| Inappropriate control group. |
Data and analyses
| Outcome or subgroup title | No. of studies | No. of participants | Statistical method | Effect size |
| 1 No. Exposed to Allogeneic Blood (All Studies) Show forest plot | 47 | 3857 | Risk Ratio (M‐H, Random, 95% CI) | 0.61 [0.53, 0.71] |
| Analysis 1.1  Comparison 1 Cell Salvage ‐ Blood Transfused (All studies), Outcome 1 No. Exposed to Allogeneic Blood (All Studies). | ||||
| 2 No. Exposed to Allogeneic Blood (Transfusion Protocol) Show forest plot | 47 | Risk Ratio (M‐H, Random, 95% CI) | Subtotals only | |
| Analysis 1.2  Comparison 1 Cell Salvage ‐ Blood Transfused (All studies), Outcome 2 No. Exposed to Allogeneic Blood (Transfusion Protocol). | ||||
| 2.1 Transfusion Protocol | 38 | 2867 | Risk Ratio (M‐H, Random, 95% CI) | 0.63 [0.54, 0.73] |
| 2.2 No Transfusion Protocol | 9 | 990 | Risk Ratio (M‐H, Random, 95% CI) | 0.44 [0.22, 0.88] |
| 3 No. Exposed to Allogeneic Blood (Type of Surgery) Show forest plot | 47 | Risk Ratio (M‐H, Random, 95% CI) | Subtotals only | |
| Analysis 1.3  Comparison 1 Cell Salvage ‐ Blood Transfused (All studies), Outcome 3 No. Exposed to Allogeneic Blood (Type of Surgery). | ||||
| 3.1 Cardiac | 23 | 1784 | Risk Ratio (M‐H, Random, 95% CI) | 0.77 [0.68, 0.87] |
| 3.2 Orthopaedic | 21 | 1887 | Risk Ratio (M‐H, Random, 95% CI) | 0.42 [0.32, 0.54] |
| 3.3 Vascular | 3 | 186 | Risk Ratio (M‐H, Random, 95% CI) | 0.55 [0.13, 2.36] |
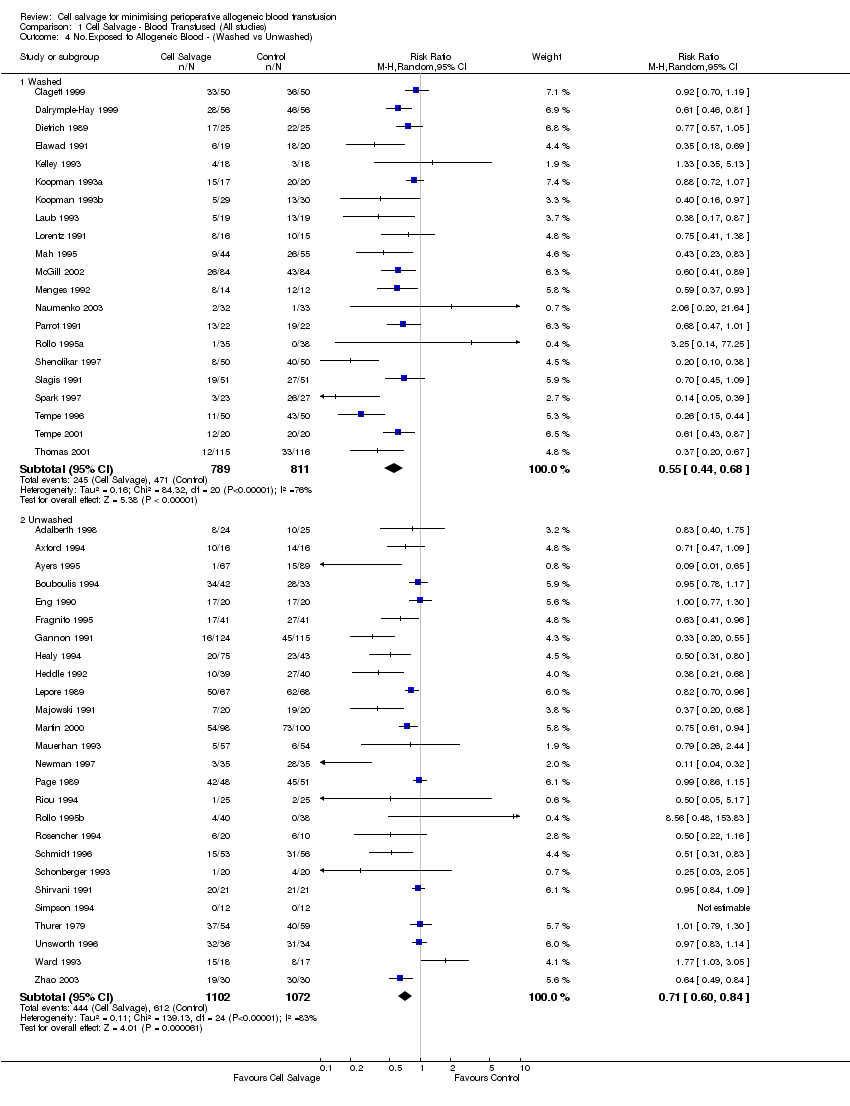
| 4 No.Exposed to Allogeneic Blood ‐ (Washed vs Unwashed) Show forest plot | 47 | Risk Ratio (M‐H, Random, 95% CI) | Subtotals only | |
| Analysis 1.4  Comparison 1 Cell Salvage ‐ Blood Transfused (All studies), Outcome 4 No.Exposed to Allogeneic Blood ‐ (Washed vs Unwashed). | ||||
| 4.1 Washed | 21 | 1600 | Risk Ratio (M‐H, Random, 95% CI) | 0.55 [0.44, 0.68] |
| 4.2 Unwashed | 26 | 2174 | Risk Ratio (M‐H, Random, 95% CI) | 0.71 [0.60, 0.84] |
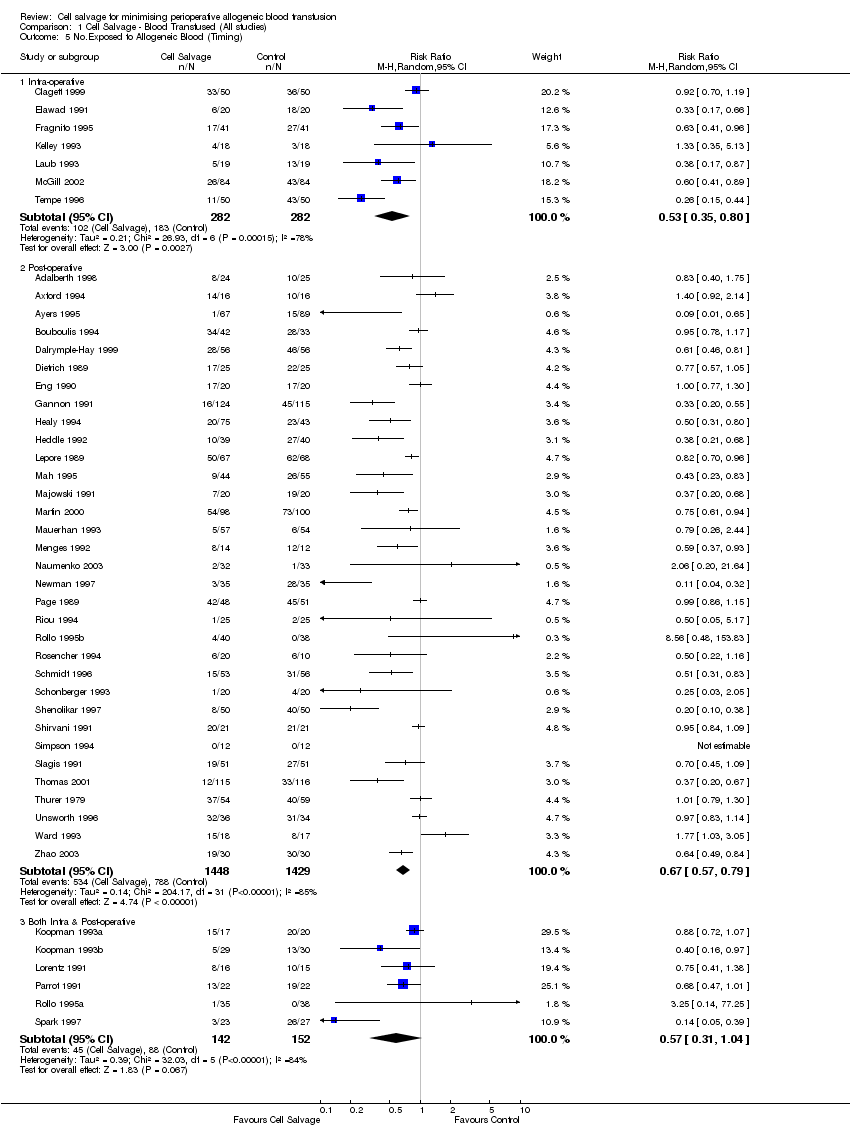
| 5 No.Exposed to Allogeneic Blood (Timing) Show forest plot | 46 | Risk Ratio (M‐H, Random, 95% CI) | Subtotals only | |
| Analysis 1.5  Comparison 1 Cell Salvage ‐ Blood Transfused (All studies), Outcome 5 No.Exposed to Allogeneic Blood (Timing). | ||||
| 5.1 Intra‐operative | 7 | 564 | Risk Ratio (M‐H, Random, 95% CI) | 0.53 [0.35, 0.80] |
| 5.2 Post‐operative | 33 | 2877 | Risk Ratio (M‐H, Random, 95% CI) | 0.67 [0.57, 0.79] |
| 5.3 Both Intra & Post‐operative | 6 | 294 | Risk Ratio (M‐H, Random, 95% CI) | 0.57 [0.31, 1.04] |
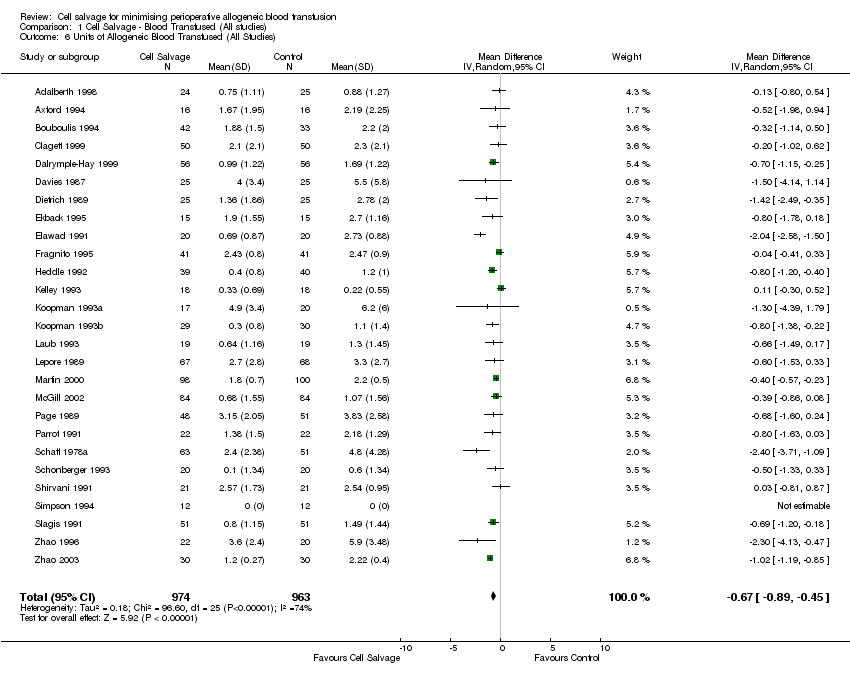
| 6 Units of Allogeneic Blood Transfused (All Studies) Show forest plot | 27 | 1937 | Mean Difference (IV, Random, 95% CI) | ‐0.67 [‐0.89, ‐0.45] |
| Analysis 1.6  Comparison 1 Cell Salvage ‐ Blood Transfused (All studies), Outcome 6 Units of Allogeneic Blood Transfused (All Studies). | ||||
| 7 Units of Allogeneic Blood Transfused (Transfusion Protocol) Show forest plot | 27 | Mean Difference (IV, Random, 95% CI) | Subtotals only | |
| Analysis 1.7  Comparison 1 Cell Salvage ‐ Blood Transfused (All studies), Outcome 7 Units of Allogeneic Blood Transfused (Transfusion Protocol). | ||||
| 7.1 Transfusion Protocol | 23 | 1544 | Mean Difference (IV, Random, 95% CI) | ‐0.61 [‐0.84, ‐0.37] |
| 7.2 No Transfusion Protocol | 4 | 393 | Mean Difference (IV, Random, 95% CI) | ‐1.26 [‐2.11, ‐0.40] |
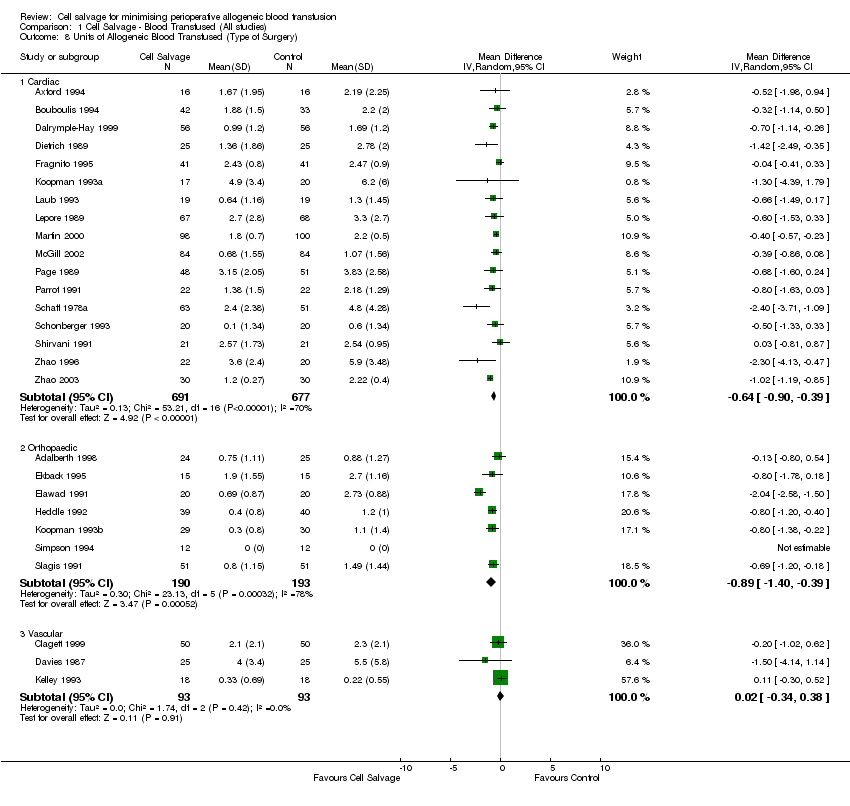
| 8 Units of Allogeneic Blood Transfused (Type of Surgery) Show forest plot | 27 | Mean Difference (IV, Random, 95% CI) | Subtotals only | |
| Analysis 1.8  Comparison 1 Cell Salvage ‐ Blood Transfused (All studies), Outcome 8 Units of Allogeneic Blood Transfused (Type of Surgery). | ||||
| 8.1 Cardiac | 17 | 1368 | Mean Difference (IV, Random, 95% CI) | ‐0.64 [‐0.90, ‐0.39] |
| 8.2 Orthopaedic | 7 | 383 | Mean Difference (IV, Random, 95% CI) | ‐0.89 [‐1.40, ‐0.39] |
| 8.3 Vascular | 3 | 186 | Mean Difference (IV, Random, 95% CI) | 0.02 [‐0.34, 0.38] |
| Outcome or subgroup title | No. of studies | No. of participants | Statistical method | Effect size |
| 1 No. Exposed Allogeneic Blood (Cardiac) Show forest plot | 23 | Risk Ratio (M‐H, Random, 95% CI) | Subtotals only | |
| Analysis 2.1  Comparison 2 Cell Salvage ‐ Blood Transfused (Washed vs Unwashed), Outcome 1 No. Exposed Allogeneic Blood (Cardiac). | ||||
| 1.1 Washed | 9 | 654 | Risk Ratio (M‐H, Random, 95% CI) | 0.61 [0.47, 0.80] |
| 1.2 Unwashed | 14 | 1130 | Risk Ratio (M‐H, Random, 95% CI) | 0.87 [0.78, 0.97] |
| 2 No. Exposed Allogeneic Blood (Orthopaedic) Show forest plot | 21 | Risk Ratio (M‐H, Random, 95% CI) | Subtotals only | |
| Analysis 2.2  Comparison 2 Cell Salvage ‐ Blood Transfused (Washed vs Unwashed), Outcome 2 No. Exposed Allogeneic Blood (Orthopaedic). | ||||
| 2.1 Washed | 9 | 760 | Risk Ratio (M‐H, Random, 95% CI) | 0.47 [0.34, 0.64] |
| 2.2 Unwashed | 12 | 1044 | Risk Ratio (M‐H, Random, 95% CI) | 0.42 [0.30, 0.60] |
| 3 No. Exposed Allogeneic Blood (Vascular) Show forest plot | 3 | Risk Ratio (M‐H, Random, 95% CI) | Subtotals only | |
| Analysis 2.3  Comparison 2 Cell Salvage ‐ Blood Transfused (Washed vs Unwashed), Outcome 3 No. Exposed Allogeneic Blood (Vascular). | ||||
| 3.1 Washed | 3 | 186 | Risk Ratio (M‐H, Random, 95% CI) | 0.55 [0.13, 2.36] |
| Outcome or subgroup title | No. of studies | No. of participants | Statistical method | Effect size |
| 1 No. Exposed to Allogeneic Blood (Active vs Control) Show forest plot | 28 | Risk Ratio (M‐H, Random, 95% CI) | Subtotals only | |
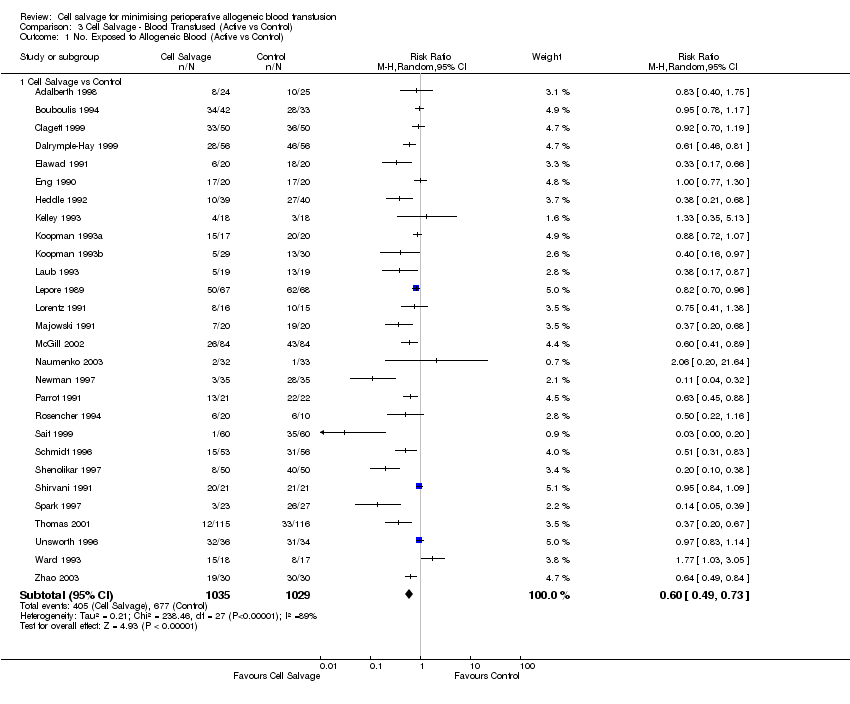
| Analysis 3.1  Comparison 3 Cell Salvage ‐ Blood Transfused (Active vs Control), Outcome 1 No. Exposed to Allogeneic Blood (Active vs Control). | ||||
| 1.1 Cell Salvage vs Control | 28 | 2064 | Risk Ratio (M‐H, Random, 95% CI) | 0.60 [0.49, 0.73] |
| 2 No. Exposed to Allogeneic Blood (Transfusion Protocol) Show forest plot | 28 | Risk Ratio (M‐H, Random, 95% CI) | Subtotals only | |
| Analysis 3.2  Comparison 3 Cell Salvage ‐ Blood Transfused (Active vs Control), Outcome 2 No. Exposed to Allogeneic Blood (Transfusion Protocol). | ||||
| 2.1 Transfusion Protocol | 24 | 1674 | Risk Ratio (M‐H, Random, 95% CI) | 0.63 [0.52, 0.77] |
| 2.2 No Transfusion Protocol | 4 | 390 | Risk Ratio (M‐H, Random, 95% CI) | 0.27 [0.02, 4.08] |
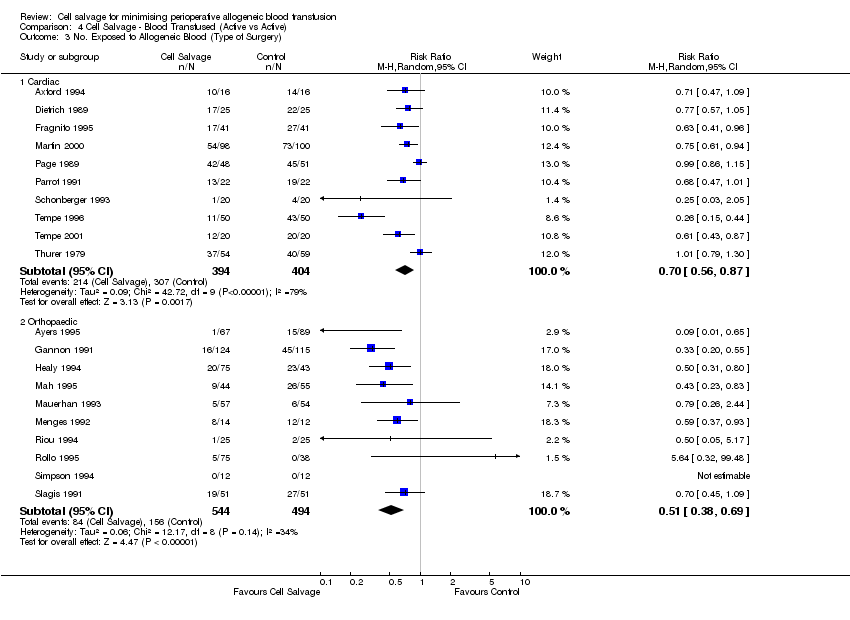
| 3 No. Exposed to Allogeneic Blood (Type of Surgery) Show forest plot | 28 | Risk Ratio (M‐H, Random, 95% CI) | Subtotals only | |
| Analysis 3.3  Comparison 3 Cell Salvage ‐ Blood Transfused (Active vs Control), Outcome 3 No. Exposed to Allogeneic Blood (Type of Surgery). | ||||
| 3.1 Cardiac | 14 | 1029 | Risk Ratio (M‐H, Random, 95% CI) | 0.81 [0.70, 0.93] |
| 3.2 Orthopaedic | 11 | 849 | Risk Ratio (M‐H, Random, 95% CI) | 0.35 [0.24, 0.52] |
| 3.3 Vascular | 3 | 186 | Risk Ratio (M‐H, Random, 95% CI) | 0.55 [0.13, 2.36] |
| 4 No. Exposed to Allogeneic Blood (Washed vs Unwashed) Show forest plot | 27 | Risk Ratio (M‐H, Random, 95% CI) | Subtotals only | |
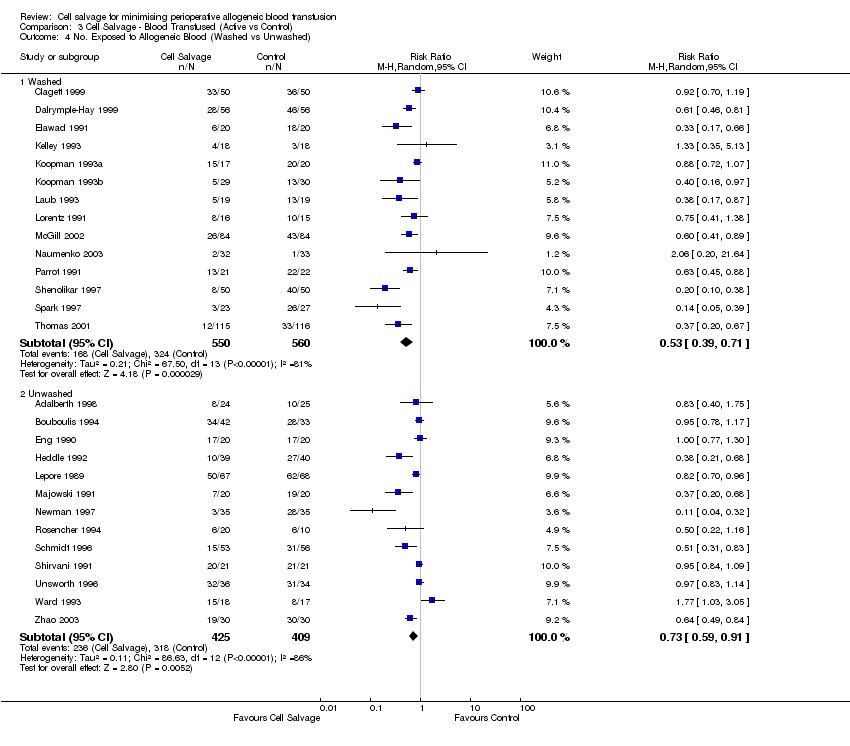
| Analysis 3.4  Comparison 3 Cell Salvage ‐ Blood Transfused (Active vs Control), Outcome 4 No. Exposed to Allogeneic Blood (Washed vs Unwashed). | ||||
| 4.1 Washed | 14 | 1110 | Risk Ratio (M‐H, Random, 95% CI) | 0.53 [0.39, 0.71] |
| 4.2 Unwashed | 13 | 834 | Risk Ratio (M‐H, Random, 95% CI) | 0.73 [0.59, 0.91] |
| 5 No. Exposed to Allogeneic Blood (Timing) Show forest plot | 28 | Risk Ratio (M‐H, Random, 95% CI) | Subtotals only | |
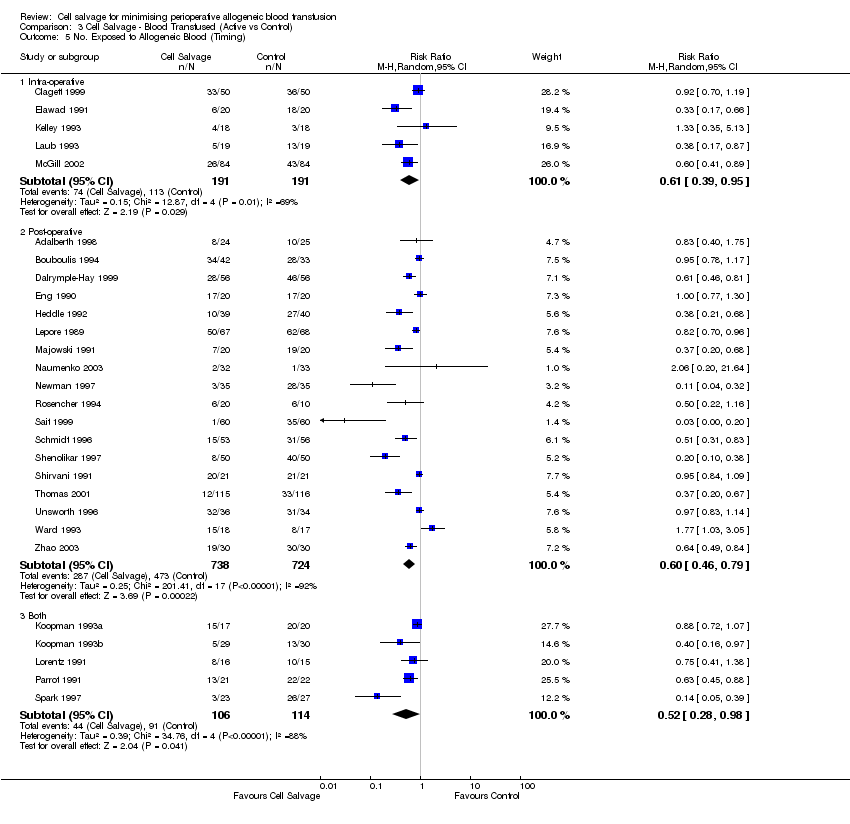
| Analysis 3.5  Comparison 3 Cell Salvage ‐ Blood Transfused (Active vs Control), Outcome 5 No. Exposed to Allogeneic Blood (Timing). | ||||
| 5.1 Intra‐operative | 5 | 382 | Risk Ratio (M‐H, Random, 95% CI) | 0.61 [0.39, 0.95] |
| 5.2 Post‐operative | 18 | 1462 | Risk Ratio (M‐H, Random, 95% CI) | 0.60 [0.46, 0.79] |
| 5.3 Both | 5 | 220 | Risk Ratio (M‐H, Random, 95% CI) | 0.52 [0.28, 0.98] |
| 6 Units Allogeneic Blood Transfused (Active vs Control) Show forest plot | 18 | Mean Difference (IV, Random, 95% CI) | Subtotals only | |
| Analysis 3.6  Comparison 3 Cell Salvage ‐ Blood Transfused (Active vs Control), Outcome 6 Units Allogeneic Blood Transfused (Active vs Control). | ||||
| 6.1 Cell Salvage vs Control | 18 | 1260 | Mean Difference (IV, Random, 95% CI) | ‐0.90 [‐1.23, ‐0.56] |
| 7 Units of Allogeneic Blood Transfused (Transfusion Protocol) Show forest plot | 18 | Mean Difference (IV, Random, 95% CI) | Subtotals only | |
| Analysis 3.7  Comparison 3 Cell Salvage ‐ Blood Transfused (Active vs Control), Outcome 7 Units of Allogeneic Blood Transfused (Transfusion Protocol). | ||||
| 7.1 Transfusion Protocol | 15 | 969 | Mean Difference (IV, Random, 95% CI) | ‐0.81 [‐1.16, ‐0.46] |
| 7.2 No Transfusion Protocol | 3 | 291 | Mean Difference (IV, Random, 95% CI) | ‐1.64 [‐2.96, ‐0.33] |
| 8 Units Allogeneic Blood Transfused (Type of Surgery) Show forest plot | 18 | Mean Difference (IV, Random, 95% CI) | Subtotals only | |
| Analysis 3.8  Comparison 3 Cell Salvage ‐ Blood Transfused (Active vs Control), Outcome 8 Units Allogeneic Blood Transfused (Type of Surgery). | ||||
| 8.1 Cardiac | 11 | 866 | Mean Difference (IV, Random, 95% CI) | ‐0.97 [‐1.40, ‐0.55] |
| 8.2 Orthopaedic | 4 | 208 | Mean Difference (IV, Random, 95% CI) | ‐1.13 [‐1.78, ‐0.48] |
| 8.3 Vascular | 3 | 186 | Mean Difference (IV, Random, 95% CI) | 0.02 [‐0.34, 0.38] |
| Outcome or subgroup title | No. of studies | No. of participants | Statistical method | Effect size |
| 1 No. Exposed to Allogeneic Blood (Active vs Active) Show forest plot | 20 | Risk Ratio (M‐H, Random, 95% CI) | Subtotals only | |
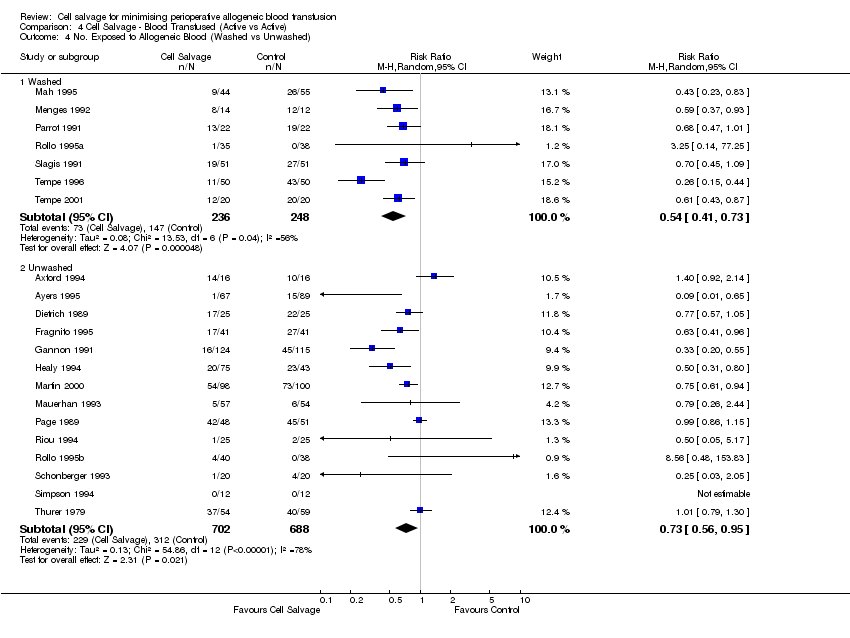
| Analysis 4.1  Comparison 4 Cell Salvage ‐ Blood Transfused (Active vs Active), Outcome 1 No. Exposed to Allogeneic Blood (Active vs Active). | ||||
| 1.1 Cell Salvage (Active vs Active) | 20 | 1836 | Risk Ratio (M‐H, Random, 95% CI) | 0.62 [0.50, 0.77] |
| 2 No. Exposed to Allogeneic Blood (Transfusion Protocol) Show forest plot | 20 | Risk Ratio (M‐H, Random, 95% CI) | Subtotals only | |
| Analysis 4.2  Comparison 4 Cell Salvage ‐ Blood Transfused (Active vs Active), Outcome 2 No. Exposed to Allogeneic Blood (Transfusion Protocol). | ||||
| 2.1 Transfusion Protocol | 15 | 1236 | Risk Ratio (M‐H, Random, 95% CI) | 0.63 [0.50, 0.79] |
| 2.2 No Transfusion Protocol | 5 | 600 | Risk Ratio (M‐H, Random, 95% CI) | 0.59 [0.35, 1.00] |
| 3 No. Exposed to Allogeneic Blood (Type of Surgery) Show forest plot | 20 | Risk Ratio (M‐H, Random, 95% CI) | Subtotals only | |
| Analysis 4.3  Comparison 4 Cell Salvage ‐ Blood Transfused (Active vs Active), Outcome 3 No. Exposed to Allogeneic Blood (Type of Surgery). | ||||
| 3.1 Cardiac | 10 | 798 | Risk Ratio (M‐H, Random, 95% CI) | 0.70 [0.56, 0.87] |
| 3.2 Orthopaedic | 10 | 1038 | Risk Ratio (M‐H, Random, 95% CI) | 0.51 [0.38, 0.69] |
| 4 No. Exposed to Allogeneic Blood (Washed vs Unwashed) Show forest plot | 21 | Risk Ratio (M‐H, Random, 95% CI) | Subtotals only | |
| Analysis 4.4  Comparison 4 Cell Salvage ‐ Blood Transfused (Active vs Active), Outcome 4 No. Exposed to Allogeneic Blood (Washed vs Unwashed). | ||||
| 4.1 Washed | 7 | 484 | Risk Ratio (M‐H, Random, 95% CI) | 0.54 [0.41, 0.73] |
| 4.2 Unwashed | 14 | 1390 | Risk Ratio (M‐H, Random, 95% CI) | 0.73 [0.56, 0.95] |
| 5 No. Exposed to Allogeneic Blood (Timing) Show forest plot | 21 | Risk Ratio (M‐H, Random, 95% CI) | Subtotals only | |
| Analysis 4.5  Comparison 4 Cell Salvage ‐ Blood Transfused (Active vs Active), Outcome 5 No. Exposed to Allogeneic Blood (Timing). | ||||
| 5.1 Intra‐operative | 3 | 222 | Risk Ratio (M‐H, Random, 95% CI) | 0.47 [0.27, 0.82] |
| 5.2 Post‐operative | 16 | 1535 | Risk Ratio (M‐H, Random, 95% CI) | 0.70 [0.55, 0.90] |
| 5.3 Both | 2 | 117 | Risk Ratio (M‐H, Random, 95% CI) | 0.71 [0.42, 1.22] |
| 6 Units Allogeneic Blood Transfused (Active vs Active) Show forest plot | 8 | Mean Difference (IV, Random, 95% CI) | Subtotals only | |
| Analysis 4.6  Comparison 4 Cell Salvage ‐ Blood Transfused (Active vs Active), Outcome 6 Units Allogeneic Blood Transfused (Active vs Active). | ||||
| 6.1 Cell Salvage (Active vs Active) | 8 | 627 | Mean Difference (IV, Random, 95% CI) | ‐0.44 [‐0.68, ‐0.19] |
| 7 Units of Allogeneic Blood Transfused (Transfusion Protocol) Show forest plot | 8 | Mean Difference (IV, Random, 95% CI) | Subtotals only | |
| Analysis 4.7  Comparison 4 Cell Salvage ‐ Blood Transfused (Active vs Active), Outcome 7 Units of Allogeneic Blood Transfused (Transfusion Protocol). | ||||
| 7.1 Transfusion Protocol | 7 | 525 | Mean Difference (IV, Random, 95% CI) | ‐0.39 [‐0.67, ‐0.12] |
| 7.2 No Transfusion Protocol | 1 | 102 | Mean Difference (IV, Random, 95% CI) | ‐0.69 [‐1.20, ‐0.18] |
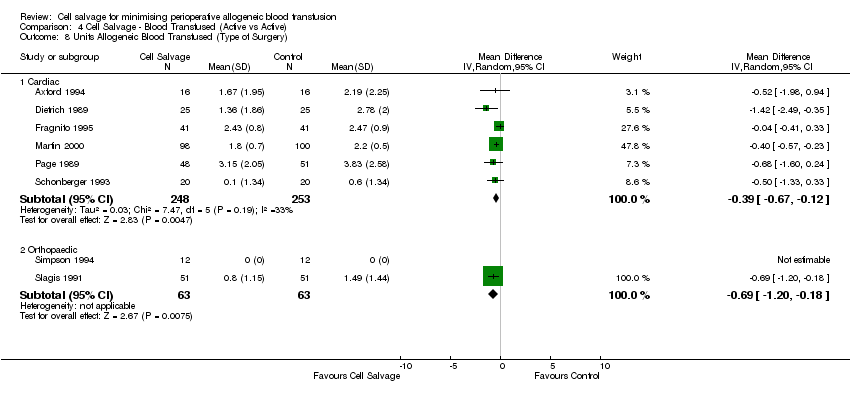
| 8 Units Allogeneic Blood Transfused (Type of Surgery) Show forest plot | 8 | Mean Difference (IV, Random, 95% CI) | Subtotals only | |
| Analysis 4.8  Comparison 4 Cell Salvage ‐ Blood Transfused (Active vs Active), Outcome 8 Units Allogeneic Blood Transfused (Type of Surgery). | ||||
| 8.1 Cardiac | 6 | 501 | Mean Difference (IV, Random, 95% CI) | ‐0.39 [‐0.67, ‐0.12] |
| 8.2 Orthopaedic | 2 | 126 | Mean Difference (IV, Random, 95% CI) | ‐0.69 [‐1.20, ‐0.18] |
| Outcome or subgroup title | No. of studies | No. of participants | Statistical method | Effect size |
| 1 Total Blood Loss (All Studies) Show forest plot | 23 | 1624 | Mean Difference (IV, Random, 95% CI) | ‐41.44 [‐111.57, 28.69] |
| Analysis 5.1  Comparison 5 Cell Salvage ‐ Blood Loss, Outcome 1 Total Blood Loss (All Studies). | ||||
| 2 Total Blood Loss (Active vs Control) Show forest plot | 18 | 1168 | Mean Difference (IV, Random, 95% CI) | ‐32.63 [‐122.30, 57.03] |
| Analysis 5.2  Comparison 5 Cell Salvage ‐ Blood Loss, Outcome 2 Total Blood Loss (Active vs Control). | ||||
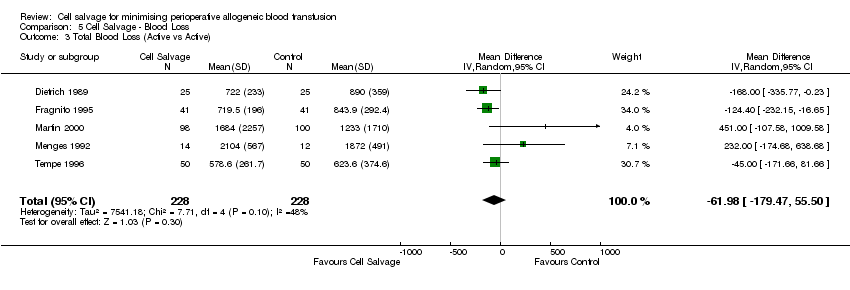
| 3 Total Blood Loss (Active vs Active) Show forest plot | 5 | 456 | Mean Difference (IV, Random, 95% CI) | ‐61.98 [‐179.47, 55.50] |
| Analysis 5.3  Comparison 5 Cell Salvage ‐ Blood Loss, Outcome 3 Total Blood Loss (Active vs Active). | ||||
| Outcome or subgroup title | No. of studies | No. of participants | Statistical method | Effect size |
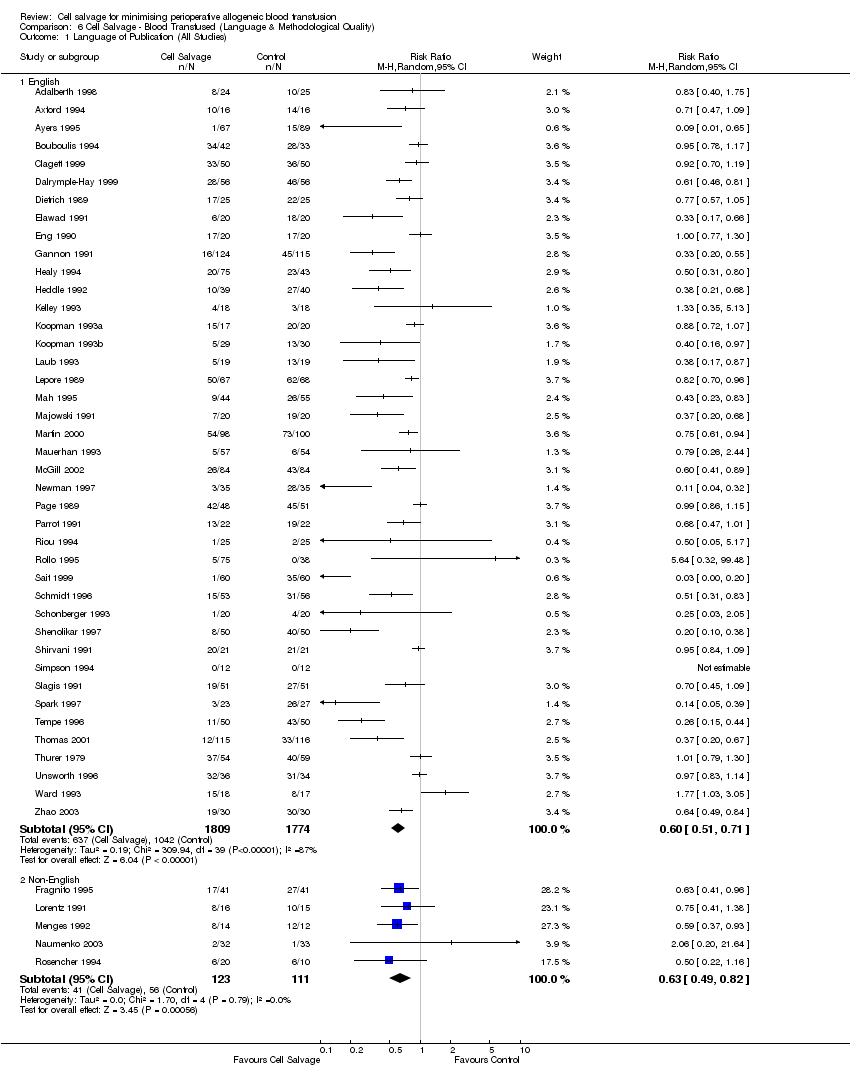
| 1 Language of Publication (All Studies) Show forest plot | 46 | Risk Ratio (M‐H, Random, 95% CI) | Subtotals only | |
| Analysis 6.1  Comparison 6 Cell Salvage ‐ Blood Transfused (Language & Methodological Quality), Outcome 1 Language of Publication (All Studies). | ||||
| 1.1 English | 41 | 3583 | Risk Ratio (M‐H, Random, 95% CI) | 0.60 [0.51, 0.71] |
| 1.2 Non‐English | 5 | 234 | Risk Ratio (M‐H, Random, 95% CI) | 0.63 [0.49, 0.82] |
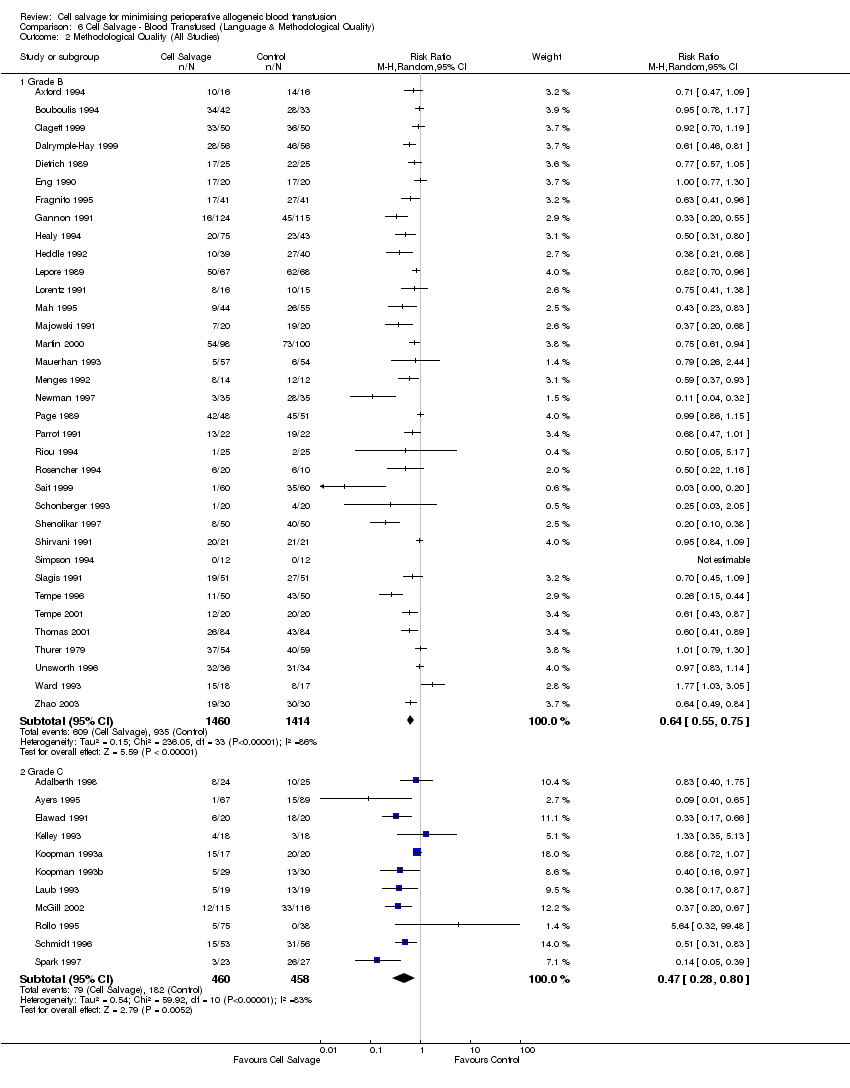
| 2 Methodological Quality (All Studies) Show forest plot | 46 | Risk Ratio (M‐H, Random, 95% CI) | Subtotals only | |
| Analysis 6.2  Comparison 6 Cell Salvage ‐ Blood Transfused (Language & Methodological Quality), Outcome 2 Methodological Quality (All Studies). | ||||
| 2.1 Grade B | 35 | 2874 | Risk Ratio (M‐H, Random, 95% CI) | 0.64 [0.55, 0.75] |
| 2.2 Grade C | 11 | 918 | Risk Ratio (M‐H, Random, 95% CI) | 0.47 [0.28, 0.80] |
| Outcome or subgroup title | No. of studies | No. of participants | Statistical method | Effect size |
| 1 Mortality ‐ All Studies Show forest plot | 15 | 1212 | Risk Ratio (M‐H, Random, 95% CI) | 1.22 [0.55, 2.70] |
| Analysis 7.1  Comparison 7 Adverse Events & Other Outcomes, Outcome 1 Mortality ‐ All Studies. | ||||
| 2 Mortality ‐ CS vs Control Show forest plot | 11 | Risk Ratio (M‐H, Random, 95% CI) | Subtotals only | |
| Analysis 7.2  Comparison 7 Adverse Events & Other Outcomes, Outcome 2 Mortality ‐ CS vs Control. | ||||
| 2.1 Cell Salvage vs Control | 11 | 811 | Risk Ratio (M‐H, Random, 95% CI) | 1.53 [0.65, 3.61] |
| 3 Mortality ‐ Active vs Active Show forest plot | 4 | 401 | Risk Ratio (M‐H, Random, 95% CI) | 0.27 [0.03, 2.40] |
| Analysis 7.3  Comparison 7 Adverse Events & Other Outcomes, Outcome 3 Mortality ‐ Active vs Active. | ||||
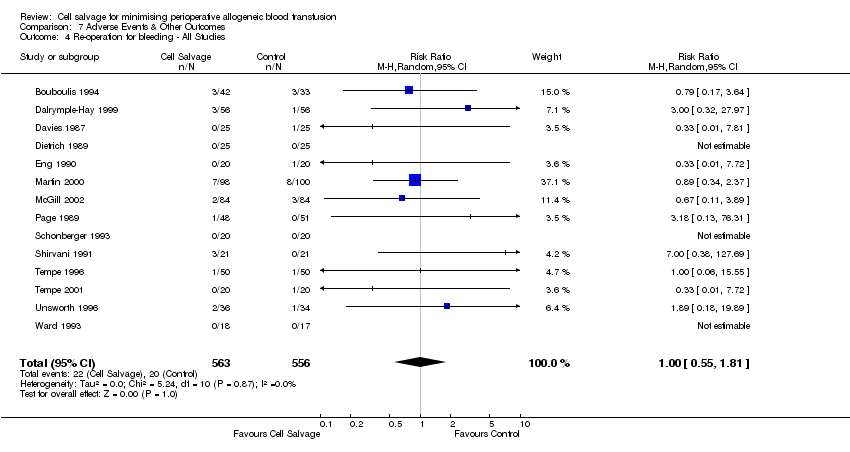
| 4 Re‐operation for bleeding ‐ All Studies Show forest plot | 14 | 1119 | Risk Ratio (M‐H, Random, 95% CI) | 1.00 [0.55, 1.81] |
| Analysis 7.4  Comparison 7 Adverse Events & Other Outcomes, Outcome 4 Re‐operation for bleeding ‐ All Studies. | ||||
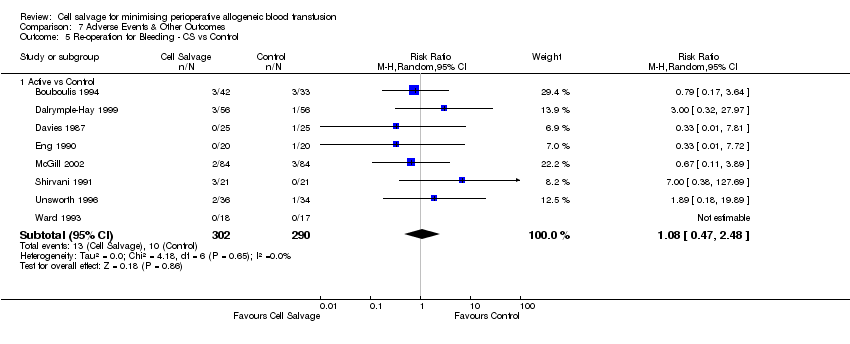
| 5 Re‐operation for Bleeding ‐ CS vs Control Show forest plot | 8 | Risk Ratio (M‐H, Random, 95% CI) | Subtotals only | |
| Analysis 7.5  Comparison 7 Adverse Events & Other Outcomes, Outcome 5 Re‐operation for Bleeding ‐ CS vs Control. | ||||
| 5.1 Active vs Control | 8 | 592 | Risk Ratio (M‐H, Random, 95% CI) | 1.08 [0.47, 2.48] |
| 6 Re‐operation for Bleeding ‐ Active vs Active Show forest plot | 6 | 527 | Risk Ratio (M‐H, Random, 95% CI) | 0.92 [0.39, 2.15] |
| Analysis 7.6  Comparison 7 Adverse Events & Other Outcomes, Outcome 6 Re‐operation for Bleeding ‐ Active vs Active. | ||||
| 7 Any Infection ‐ All Studies Show forest plot | 13 | 1390 | Risk Ratio (M‐H, Random, 95% CI) | 0.74 [0.44, 1.25] |
| Analysis 7.7  Comparison 7 Adverse Events & Other Outcomes, Outcome 7 Any Infection ‐ All Studies. | ||||
| 8 Any Infection ‐ CS vs Control Show forest plot | 9 | Risk Ratio (M‐H, Random, 95% CI) | Subtotals only | |
| Analysis 7.8  Comparison 7 Adverse Events & Other Outcomes, Outcome 8 Any Infection ‐ CS vs Control. | ||||
| 8.1 Cell Salvage vs Control | 9 | 826 | Risk Ratio (M‐H, Random, 95% CI) | 0.75 [0.41, 1.37] |
| 9 Any Infection ‐ Active vs Active Show forest plot | 4 | 564 | Risk Ratio (M‐H, Random, 95% CI) | 0.35 [0.05, 2.63] |
| Analysis 7.9  Comparison 7 Adverse Events & Other Outcomes, Outcome 9 Any Infection ‐ Active vs Active. | ||||
| 10 Wound Complication ‐ All Studies Show forest plot | 9 | 730 | Risk Ratio (M‐H, Random, 95% CI) | 0.91 [0.46, 1.81] |
| Analysis 7.10  Comparison 7 Adverse Events & Other Outcomes, Outcome 10 Wound Complication ‐ All Studies. | ||||
| 11 Wound Complication ‐ CS vs Control Show forest plot | 7 | Risk Ratio (M‐H, Random, 95% CI) | Subtotals only | |
| Analysis 7.11  Comparison 7 Adverse Events & Other Outcomes, Outcome 11 Wound Complication ‐ CS vs Control. | ||||
| 11.1 Active vs Control | 7 | 504 | Risk Ratio (M‐H, Random, 95% CI) | 0.88 [0.42, 1.81] |
| 12 Wound Complication ‐ Active vs Active Show forest plot | 2 | 226 | Risk Ratio (M‐H, Random, 95% CI) | 1.24 [0.13, 11.75] |
| Analysis 7.12  Comparison 7 Adverse Events & Other Outcomes, Outcome 12 Wound Complication ‐ Active vs Active. | ||||
| 13 Any Thrombosis ‐ All Studies Show forest plot | 7 | 497 | Risk Ratio (M‐H, Random, 95% CI) | 1.46 [0.56, 3.83] |
| Analysis 7.13  Comparison 7 Adverse Events & Other Outcomes, Outcome 13 Any Thrombosis ‐ All Studies. | ||||
| 14 Any Thrombosis ‐ CS vs Control Show forest plot | 6 | Risk Ratio (M‐H, Random, 95% CI) | Subtotals only | |
| Analysis 7.14  Comparison 7 Adverse Events & Other Outcomes, Outcome 14 Any Thrombosis ‐ CS vs Control. | ||||
| 14.1 Active vs Control | 6 | 379 | Risk Ratio (M‐H, Random, 95% CI) | 1.46 [0.56, 3.83] |
| 15 Stroke ‐ All Studies Show forest plot | 4 | 496 | Risk Ratio (M‐H, Random, 95% CI) | 0.65 [0.17, 2.50] |
| Analysis 7.15  Comparison 7 Adverse Events & Other Outcomes, Outcome 15 Stroke ‐ All Studies. | ||||
| 16 Stroke ‐ CS vs Control Show forest plot | 3 | Risk Ratio (M‐H, Random, 95% CI) | Subtotals only | |
| Analysis 7.16  Comparison 7 Adverse Events & Other Outcomes, Outcome 16 Stroke ‐ CS vs Control. | ||||
| 16.1 Active vs Control | 3 | 298 | Risk Ratio (M‐H, Random, 95% CI) | 0.73 [0.14, 3.72] |
| 17 Non‐Fatal Myocardial Infarction ‐ All Studies Show forest plot | 9 | 831 | Risk Ratio (M‐H, Random, 95% CI) | 0.76 [0.40, 1.43] |
| Analysis 7.17  Comparison 7 Adverse Events & Other Outcomes, Outcome 17 Non‐Fatal Myocardial Infarction ‐ All Studies. | ||||
| 18 Non‐Fatal Myocardial Infarction ‐ CS vs Control Show forest plot | 5 | Risk Ratio (M‐H, Random, 95% CI) | Subtotals only | |
| Analysis 7.18  Comparison 7 Adverse Events & Other Outcomes, Outcome 18 Non‐Fatal Myocardial Infarction ‐ CS vs Control. | ||||
| 18.1 Active vs Control | 5 | 448 | Risk Ratio (M‐H, Random, 95% CI) | 0.58 [0.28, 1.19] |
| 19 Non‐Fatal Myocardial Infarction ‐ Active vs Active Show forest plot | 4 | 383 | Risk Ratio (M‐H, Random, 95% CI) | 1.89 [0.51, 6.98] |
| Analysis 7.19  Comparison 7 Adverse Events & Other Outcomes, Outcome 19 Non‐Fatal Myocardial Infarction ‐ Active vs Active. | ||||
| 20 Deep Vein Thrombosis (DVT) Show forest plot | 4 | Risk Ratio (M‐H, Random, 95% CI) | Subtotals only | |
| Analysis 7.20  Comparison 7 Adverse Events & Other Outcomes, Outcome 20 Deep Vein Thrombosis (DVT). | ||||
| 20.1 Active vs Control | 4 | 249 | Risk Ratio (M‐H, Random, 95% CI) | 0.93 [0.31, 2.77] |
| 21 Hospital Length of Stay (LOS) Show forest plot | 5 | Mean Difference (IV, Random, 95% CI) | Subtotals only | |
| Analysis 7.21  Comparison 7 Adverse Events & Other Outcomes, Outcome 21 Hospital Length of Stay (LOS). | ||||
| 21.1 Active vs Control | 5 | 397 | Mean Difference (IV, Random, 95% CI) | ‐1.28 [‐2.65, 0.08] |

Comparison 1 Cell Salvage ‐ Blood Transfused (All studies), Outcome 1 No. Exposed to Allogeneic Blood (All Studies).

Comparison 1 Cell Salvage ‐ Blood Transfused (All studies), Outcome 2 No. Exposed to Allogeneic Blood (Transfusion Protocol).

Comparison 1 Cell Salvage ‐ Blood Transfused (All studies), Outcome 3 No. Exposed to Allogeneic Blood (Type of Surgery).
Comparison 1 Cell Salvage ‐ Blood Transfused (All studies), Outcome 4 No.Exposed to Allogeneic Blood ‐ (Washed vs Unwashed).
Comparison 1 Cell Salvage ‐ Blood Transfused (All studies), Outcome 5 No.Exposed to Allogeneic Blood (Timing).
Comparison 1 Cell Salvage ‐ Blood Transfused (All studies), Outcome 6 Units of Allogeneic Blood Transfused (All Studies).

Comparison 1 Cell Salvage ‐ Blood Transfused (All studies), Outcome 7 Units of Allogeneic Blood Transfused (Transfusion Protocol).
Comparison 1 Cell Salvage ‐ Blood Transfused (All studies), Outcome 8 Units of Allogeneic Blood Transfused (Type of Surgery).

Comparison 2 Cell Salvage ‐ Blood Transfused (Washed vs Unwashed), Outcome 1 No. Exposed Allogeneic Blood (Cardiac).

Comparison 2 Cell Salvage ‐ Blood Transfused (Washed vs Unwashed), Outcome 2 No. Exposed Allogeneic Blood (Orthopaedic).

Comparison 2 Cell Salvage ‐ Blood Transfused (Washed vs Unwashed), Outcome 3 No. Exposed Allogeneic Blood (Vascular).
Comparison 3 Cell Salvage ‐ Blood Transfused (Active vs Control), Outcome 1 No. Exposed to Allogeneic Blood (Active vs Control).

Comparison 3 Cell Salvage ‐ Blood Transfused (Active vs Control), Outcome 2 No. Exposed to Allogeneic Blood (Transfusion Protocol).

Comparison 3 Cell Salvage ‐ Blood Transfused (Active vs Control), Outcome 3 No. Exposed to Allogeneic Blood (Type of Surgery).
Comparison 3 Cell Salvage ‐ Blood Transfused (Active vs Control), Outcome 4 No. Exposed to Allogeneic Blood (Washed vs Unwashed).
Comparison 3 Cell Salvage ‐ Blood Transfused (Active vs Control), Outcome 5 No. Exposed to Allogeneic Blood (Timing).

Comparison 3 Cell Salvage ‐ Blood Transfused (Active vs Control), Outcome 6 Units Allogeneic Blood Transfused (Active vs Control).

Comparison 3 Cell Salvage ‐ Blood Transfused (Active vs Control), Outcome 7 Units of Allogeneic Blood Transfused (Transfusion Protocol).

Comparison 3 Cell Salvage ‐ Blood Transfused (Active vs Control), Outcome 8 Units Allogeneic Blood Transfused (Type of Surgery).

Comparison 4 Cell Salvage ‐ Blood Transfused (Active vs Active), Outcome 1 No. Exposed to Allogeneic Blood (Active vs Active).

Comparison 4 Cell Salvage ‐ Blood Transfused (Active vs Active), Outcome 2 No. Exposed to Allogeneic Blood (Transfusion Protocol).
Comparison 4 Cell Salvage ‐ Blood Transfused (Active vs Active), Outcome 3 No. Exposed to Allogeneic Blood (Type of Surgery).
Comparison 4 Cell Salvage ‐ Blood Transfused (Active vs Active), Outcome 4 No. Exposed to Allogeneic Blood (Washed vs Unwashed).

Comparison 4 Cell Salvage ‐ Blood Transfused (Active vs Active), Outcome 5 No. Exposed to Allogeneic Blood (Timing).

Comparison 4 Cell Salvage ‐ Blood Transfused (Active vs Active), Outcome 6 Units Allogeneic Blood Transfused (Active vs Active).

Comparison 4 Cell Salvage ‐ Blood Transfused (Active vs Active), Outcome 7 Units of Allogeneic Blood Transfused (Transfusion Protocol).
Comparison 4 Cell Salvage ‐ Blood Transfused (Active vs Active), Outcome 8 Units Allogeneic Blood Transfused (Type of Surgery).

Comparison 5 Cell Salvage ‐ Blood Loss, Outcome 1 Total Blood Loss (All Studies).

Comparison 5 Cell Salvage ‐ Blood Loss, Outcome 2 Total Blood Loss (Active vs Control).
Comparison 5 Cell Salvage ‐ Blood Loss, Outcome 3 Total Blood Loss (Active vs Active).
Comparison 6 Cell Salvage ‐ Blood Transfused (Language & Methodological Quality), Outcome 1 Language of Publication (All Studies).
Comparison 6 Cell Salvage ‐ Blood Transfused (Language & Methodological Quality), Outcome 2 Methodological Quality (All Studies).

Comparison 7 Adverse Events & Other Outcomes, Outcome 1 Mortality ‐ All Studies.

Comparison 7 Adverse Events & Other Outcomes, Outcome 2 Mortality ‐ CS vs Control.

Comparison 7 Adverse Events & Other Outcomes, Outcome 3 Mortality ‐ Active vs Active.
Comparison 7 Adverse Events & Other Outcomes, Outcome 4 Re‐operation for bleeding ‐ All Studies.
Comparison 7 Adverse Events & Other Outcomes, Outcome 5 Re‐operation for Bleeding ‐ CS vs Control.
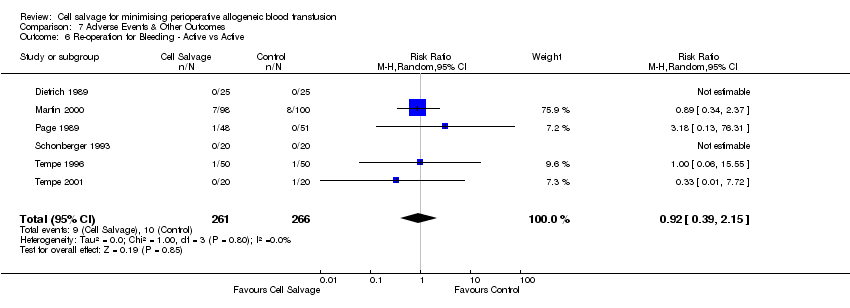
Comparison 7 Adverse Events & Other Outcomes, Outcome 6 Re‐operation for Bleeding ‐ Active vs Active.

Comparison 7 Adverse Events & Other Outcomes, Outcome 7 Any Infection ‐ All Studies.

Comparison 7 Adverse Events & Other Outcomes, Outcome 8 Any Infection ‐ CS vs Control.

Comparison 7 Adverse Events & Other Outcomes, Outcome 9 Any Infection ‐ Active vs Active.
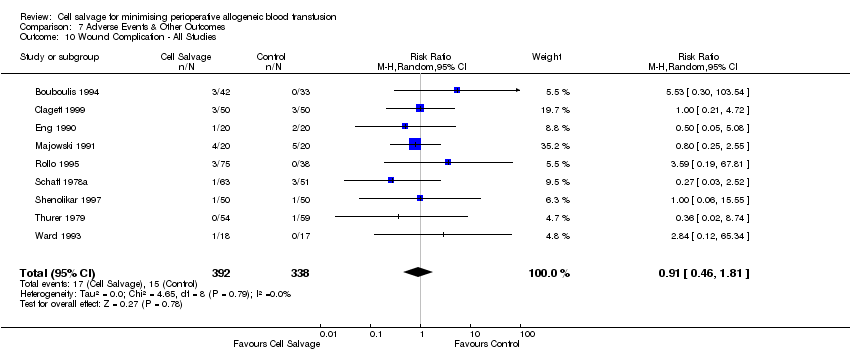
Comparison 7 Adverse Events & Other Outcomes, Outcome 10 Wound Complication ‐ All Studies.

Comparison 7 Adverse Events & Other Outcomes, Outcome 11 Wound Complication ‐ CS vs Control.

Comparison 7 Adverse Events & Other Outcomes, Outcome 12 Wound Complication ‐ Active vs Active.
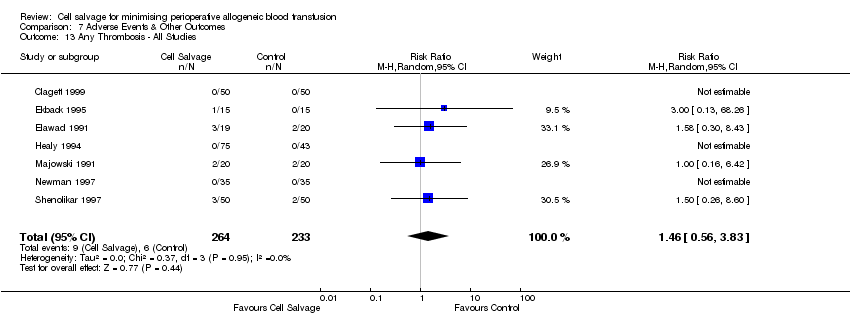
Comparison 7 Adverse Events & Other Outcomes, Outcome 13 Any Thrombosis ‐ All Studies.

Comparison 7 Adverse Events & Other Outcomes, Outcome 14 Any Thrombosis ‐ CS vs Control.

Comparison 7 Adverse Events & Other Outcomes, Outcome 15 Stroke ‐ All Studies.

Comparison 7 Adverse Events & Other Outcomes, Outcome 16 Stroke ‐ CS vs Control.

Comparison 7 Adverse Events & Other Outcomes, Outcome 17 Non‐Fatal Myocardial Infarction ‐ All Studies.

Comparison 7 Adverse Events & Other Outcomes, Outcome 18 Non‐Fatal Myocardial Infarction ‐ CS vs Control.

Comparison 7 Adverse Events & Other Outcomes, Outcome 19 Non‐Fatal Myocardial Infarction ‐ Active vs Active.

Comparison 7 Adverse Events & Other Outcomes, Outcome 20 Deep Vein Thrombosis (DVT).
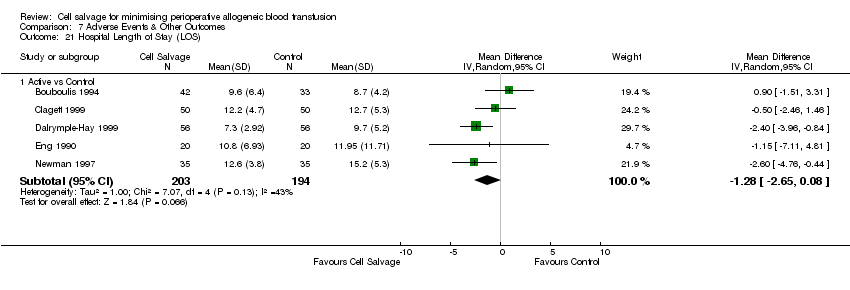
Comparison 7 Adverse Events & Other Outcomes, Outcome 21 Hospital Length of Stay (LOS).
| Outcome or subgroup title | No. of studies | No. of participants | Statistical method | Effect size |
| 1 No. Exposed to Allogeneic Blood (All Studies) Show forest plot | 47 | 3857 | Risk Ratio (M‐H, Random, 95% CI) | 0.61 [0.53, 0.71] |
| 2 No. Exposed to Allogeneic Blood (Transfusion Protocol) Show forest plot | 47 | Risk Ratio (M‐H, Random, 95% CI) | Subtotals only | |
| 2.1 Transfusion Protocol | 38 | 2867 | Risk Ratio (M‐H, Random, 95% CI) | 0.63 [0.54, 0.73] |
| 2.2 No Transfusion Protocol | 9 | 990 | Risk Ratio (M‐H, Random, 95% CI) | 0.44 [0.22, 0.88] |
| 3 No. Exposed to Allogeneic Blood (Type of Surgery) Show forest plot | 47 | Risk Ratio (M‐H, Random, 95% CI) | Subtotals only | |
| 3.1 Cardiac | 23 | 1784 | Risk Ratio (M‐H, Random, 95% CI) | 0.77 [0.68, 0.87] |
| 3.2 Orthopaedic | 21 | 1887 | Risk Ratio (M‐H, Random, 95% CI) | 0.42 [0.32, 0.54] |
| 3.3 Vascular | 3 | 186 | Risk Ratio (M‐H, Random, 95% CI) | 0.55 [0.13, 2.36] |
| 4 No.Exposed to Allogeneic Blood ‐ (Washed vs Unwashed) Show forest plot | 47 | Risk Ratio (M‐H, Random, 95% CI) | Subtotals only | |
| 4.1 Washed | 21 | 1600 | Risk Ratio (M‐H, Random, 95% CI) | 0.55 [0.44, 0.68] |
| 4.2 Unwashed | 26 | 2174 | Risk Ratio (M‐H, Random, 95% CI) | 0.71 [0.60, 0.84] |
| 5 No.Exposed to Allogeneic Blood (Timing) Show forest plot | 46 | Risk Ratio (M‐H, Random, 95% CI) | Subtotals only | |
| 5.1 Intra‐operative | 7 | 564 | Risk Ratio (M‐H, Random, 95% CI) | 0.53 [0.35, 0.80] |
| 5.2 Post‐operative | 33 | 2877 | Risk Ratio (M‐H, Random, 95% CI) | 0.67 [0.57, 0.79] |
| 5.3 Both Intra & Post‐operative | 6 | 294 | Risk Ratio (M‐H, Random, 95% CI) | 0.57 [0.31, 1.04] |
| 6 Units of Allogeneic Blood Transfused (All Studies) Show forest plot | 27 | 1937 | Mean Difference (IV, Random, 95% CI) | ‐0.67 [‐0.89, ‐0.45] |
| 7 Units of Allogeneic Blood Transfused (Transfusion Protocol) Show forest plot | 27 | Mean Difference (IV, Random, 95% CI) | Subtotals only | |
| 7.1 Transfusion Protocol | 23 | 1544 | Mean Difference (IV, Random, 95% CI) | ‐0.61 [‐0.84, ‐0.37] |
| 7.2 No Transfusion Protocol | 4 | 393 | Mean Difference (IV, Random, 95% CI) | ‐1.26 [‐2.11, ‐0.40] |
| 8 Units of Allogeneic Blood Transfused (Type of Surgery) Show forest plot | 27 | Mean Difference (IV, Random, 95% CI) | Subtotals only | |
| 8.1 Cardiac | 17 | 1368 | Mean Difference (IV, Random, 95% CI) | ‐0.64 [‐0.90, ‐0.39] |
| 8.2 Orthopaedic | 7 | 383 | Mean Difference (IV, Random, 95% CI) | ‐0.89 [‐1.40, ‐0.39] |
| 8.3 Vascular | 3 | 186 | Mean Difference (IV, Random, 95% CI) | 0.02 [‐0.34, 0.38] |
| Outcome or subgroup title | No. of studies | No. of participants | Statistical method | Effect size |
| 1 No. Exposed Allogeneic Blood (Cardiac) Show forest plot | 23 | Risk Ratio (M‐H, Random, 95% CI) | Subtotals only | |
| 1.1 Washed | 9 | 654 | Risk Ratio (M‐H, Random, 95% CI) | 0.61 [0.47, 0.80] |
| 1.2 Unwashed | 14 | 1130 | Risk Ratio (M‐H, Random, 95% CI) | 0.87 [0.78, 0.97] |
| 2 No. Exposed Allogeneic Blood (Orthopaedic) Show forest plot | 21 | Risk Ratio (M‐H, Random, 95% CI) | Subtotals only | |
| 2.1 Washed | 9 | 760 | Risk Ratio (M‐H, Random, 95% CI) | 0.47 [0.34, 0.64] |
| 2.2 Unwashed | 12 | 1044 | Risk Ratio (M‐H, Random, 95% CI) | 0.42 [0.30, 0.60] |
| 3 No. Exposed Allogeneic Blood (Vascular) Show forest plot | 3 | Risk Ratio (M‐H, Random, 95% CI) | Subtotals only | |
| 3.1 Washed | 3 | 186 | Risk Ratio (M‐H, Random, 95% CI) | 0.55 [0.13, 2.36] |
| Outcome or subgroup title | No. of studies | No. of participants | Statistical method | Effect size |
| 1 No. Exposed to Allogeneic Blood (Active vs Control) Show forest plot | 28 | Risk Ratio (M‐H, Random, 95% CI) | Subtotals only | |
| 1.1 Cell Salvage vs Control | 28 | 2064 | Risk Ratio (M‐H, Random, 95% CI) | 0.60 [0.49, 0.73] |
| 2 No. Exposed to Allogeneic Blood (Transfusion Protocol) Show forest plot | 28 | Risk Ratio (M‐H, Random, 95% CI) | Subtotals only | |
| 2.1 Transfusion Protocol | 24 | 1674 | Risk Ratio (M‐H, Random, 95% CI) | 0.63 [0.52, 0.77] |
| 2.2 No Transfusion Protocol | 4 | 390 | Risk Ratio (M‐H, Random, 95% CI) | 0.27 [0.02, 4.08] |
| 3 No. Exposed to Allogeneic Blood (Type of Surgery) Show forest plot | 28 | Risk Ratio (M‐H, Random, 95% CI) | Subtotals only | |
| 3.1 Cardiac | 14 | 1029 | Risk Ratio (M‐H, Random, 95% CI) | 0.81 [0.70, 0.93] |
| 3.2 Orthopaedic | 11 | 849 | Risk Ratio (M‐H, Random, 95% CI) | 0.35 [0.24, 0.52] |
| 3.3 Vascular | 3 | 186 | Risk Ratio (M‐H, Random, 95% CI) | 0.55 [0.13, 2.36] |
| 4 No. Exposed to Allogeneic Blood (Washed vs Unwashed) Show forest plot | 27 | Risk Ratio (M‐H, Random, 95% CI) | Subtotals only | |
| 4.1 Washed | 14 | 1110 | Risk Ratio (M‐H, Random, 95% CI) | 0.53 [0.39, 0.71] |
| 4.2 Unwashed | 13 | 834 | Risk Ratio (M‐H, Random, 95% CI) | 0.73 [0.59, 0.91] |
| 5 No. Exposed to Allogeneic Blood (Timing) Show forest plot | 28 | Risk Ratio (M‐H, Random, 95% CI) | Subtotals only | |
| 5.1 Intra‐operative | 5 | 382 | Risk Ratio (M‐H, Random, 95% CI) | 0.61 [0.39, 0.95] |
| 5.2 Post‐operative | 18 | 1462 | Risk Ratio (M‐H, Random, 95% CI) | 0.60 [0.46, 0.79] |
| 5.3 Both | 5 | 220 | Risk Ratio (M‐H, Random, 95% CI) | 0.52 [0.28, 0.98] |
| 6 Units Allogeneic Blood Transfused (Active vs Control) Show forest plot | 18 | Mean Difference (IV, Random, 95% CI) | Subtotals only | |
| 6.1 Cell Salvage vs Control | 18 | 1260 | Mean Difference (IV, Random, 95% CI) | ‐0.90 [‐1.23, ‐0.56] |
| 7 Units of Allogeneic Blood Transfused (Transfusion Protocol) Show forest plot | 18 | Mean Difference (IV, Random, 95% CI) | Subtotals only | |
| 7.1 Transfusion Protocol | 15 | 969 | Mean Difference (IV, Random, 95% CI) | ‐0.81 [‐1.16, ‐0.46] |
| 7.2 No Transfusion Protocol | 3 | 291 | Mean Difference (IV, Random, 95% CI) | ‐1.64 [‐2.96, ‐0.33] |
| 8 Units Allogeneic Blood Transfused (Type of Surgery) Show forest plot | 18 | Mean Difference (IV, Random, 95% CI) | Subtotals only | |
| 8.1 Cardiac | 11 | 866 | Mean Difference (IV, Random, 95% CI) | ‐0.97 [‐1.40, ‐0.55] |
| 8.2 Orthopaedic | 4 | 208 | Mean Difference (IV, Random, 95% CI) | ‐1.13 [‐1.78, ‐0.48] |
| 8.3 Vascular | 3 | 186 | Mean Difference (IV, Random, 95% CI) | 0.02 [‐0.34, 0.38] |
| Outcome or subgroup title | No. of studies | No. of participants | Statistical method | Effect size |
| 1 No. Exposed to Allogeneic Blood (Active vs Active) Show forest plot | 20 | Risk Ratio (M‐H, Random, 95% CI) | Subtotals only | |
| 1.1 Cell Salvage (Active vs Active) | 20 | 1836 | Risk Ratio (M‐H, Random, 95% CI) | 0.62 [0.50, 0.77] |
| 2 No. Exposed to Allogeneic Blood (Transfusion Protocol) Show forest plot | 20 | Risk Ratio (M‐H, Random, 95% CI) | Subtotals only | |
| 2.1 Transfusion Protocol | 15 | 1236 | Risk Ratio (M‐H, Random, 95% CI) | 0.63 [0.50, 0.79] |
| 2.2 No Transfusion Protocol | 5 | 600 | Risk Ratio (M‐H, Random, 95% CI) | 0.59 [0.35, 1.00] |
| 3 No. Exposed to Allogeneic Blood (Type of Surgery) Show forest plot | 20 | Risk Ratio (M‐H, Random, 95% CI) | Subtotals only | |
| 3.1 Cardiac | 10 | 798 | Risk Ratio (M‐H, Random, 95% CI) | 0.70 [0.56, 0.87] |
| 3.2 Orthopaedic | 10 | 1038 | Risk Ratio (M‐H, Random, 95% CI) | 0.51 [0.38, 0.69] |
| 4 No. Exposed to Allogeneic Blood (Washed vs Unwashed) Show forest plot | 21 | Risk Ratio (M‐H, Random, 95% CI) | Subtotals only | |
| 4.1 Washed | 7 | 484 | Risk Ratio (M‐H, Random, 95% CI) | 0.54 [0.41, 0.73] |
| 4.2 Unwashed | 14 | 1390 | Risk Ratio (M‐H, Random, 95% CI) | 0.73 [0.56, 0.95] |
| 5 No. Exposed to Allogeneic Blood (Timing) Show forest plot | 21 | Risk Ratio (M‐H, Random, 95% CI) | Subtotals only | |
| 5.1 Intra‐operative | 3 | 222 | Risk Ratio (M‐H, Random, 95% CI) | 0.47 [0.27, 0.82] |
| 5.2 Post‐operative | 16 | 1535 | Risk Ratio (M‐H, Random, 95% CI) | 0.70 [0.55, 0.90] |
| 5.3 Both | 2 | 117 | Risk Ratio (M‐H, Random, 95% CI) | 0.71 [0.42, 1.22] |
| 6 Units Allogeneic Blood Transfused (Active vs Active) Show forest plot | 8 | Mean Difference (IV, Random, 95% CI) | Subtotals only | |
| 6.1 Cell Salvage (Active vs Active) | 8 | 627 | Mean Difference (IV, Random, 95% CI) | ‐0.44 [‐0.68, ‐0.19] |
| 7 Units of Allogeneic Blood Transfused (Transfusion Protocol) Show forest plot | 8 | Mean Difference (IV, Random, 95% CI) | Subtotals only | |
| 7.1 Transfusion Protocol | 7 | 525 | Mean Difference (IV, Random, 95% CI) | ‐0.39 [‐0.67, ‐0.12] |
| 7.2 No Transfusion Protocol | 1 | 102 | Mean Difference (IV, Random, 95% CI) | ‐0.69 [‐1.20, ‐0.18] |
| 8 Units Allogeneic Blood Transfused (Type of Surgery) Show forest plot | 8 | Mean Difference (IV, Random, 95% CI) | Subtotals only | |
| 8.1 Cardiac | 6 | 501 | Mean Difference (IV, Random, 95% CI) | ‐0.39 [‐0.67, ‐0.12] |
| 8.2 Orthopaedic | 2 | 126 | Mean Difference (IV, Random, 95% CI) | ‐0.69 [‐1.20, ‐0.18] |
| Outcome or subgroup title | No. of studies | No. of participants | Statistical method | Effect size |
| 1 Total Blood Loss (All Studies) Show forest plot | 23 | 1624 | Mean Difference (IV, Random, 95% CI) | ‐41.44 [‐111.57, 28.69] |
| 2 Total Blood Loss (Active vs Control) Show forest plot | 18 | 1168 | Mean Difference (IV, Random, 95% CI) | ‐32.63 [‐122.30, 57.03] |
| 3 Total Blood Loss (Active vs Active) Show forest plot | 5 | 456 | Mean Difference (IV, Random, 95% CI) | ‐61.98 [‐179.47, 55.50] |
| Outcome or subgroup title | No. of studies | No. of participants | Statistical method | Effect size |
| 1 Language of Publication (All Studies) Show forest plot | 46 | Risk Ratio (M‐H, Random, 95% CI) | Subtotals only | |
| 1.1 English | 41 | 3583 | Risk Ratio (M‐H, Random, 95% CI) | 0.60 [0.51, 0.71] |
| 1.2 Non‐English | 5 | 234 | Risk Ratio (M‐H, Random, 95% CI) | 0.63 [0.49, 0.82] |
| 2 Methodological Quality (All Studies) Show forest plot | 46 | Risk Ratio (M‐H, Random, 95% CI) | Subtotals only | |
| 2.1 Grade B | 35 | 2874 | Risk Ratio (M‐H, Random, 95% CI) | 0.64 [0.55, 0.75] |
| 2.2 Grade C | 11 | 918 | Risk Ratio (M‐H, Random, 95% CI) | 0.47 [0.28, 0.80] |
| Outcome or subgroup title | No. of studies | No. of participants | Statistical method | Effect size |
| 1 Mortality ‐ All Studies Show forest plot | 15 | 1212 | Risk Ratio (M‐H, Random, 95% CI) | 1.22 [0.55, 2.70] |
| 2 Mortality ‐ CS vs Control Show forest plot | 11 | Risk Ratio (M‐H, Random, 95% CI) | Subtotals only | |
| 2.1 Cell Salvage vs Control | 11 | 811 | Risk Ratio (M‐H, Random, 95% CI) | 1.53 [0.65, 3.61] |
| 3 Mortality ‐ Active vs Active Show forest plot | 4 | 401 | Risk Ratio (M‐H, Random, 95% CI) | 0.27 [0.03, 2.40] |
| 4 Re‐operation for bleeding ‐ All Studies Show forest plot | 14 | 1119 | Risk Ratio (M‐H, Random, 95% CI) | 1.00 [0.55, 1.81] |
| 5 Re‐operation for Bleeding ‐ CS vs Control Show forest plot | 8 | Risk Ratio (M‐H, Random, 95% CI) | Subtotals only | |
| 5.1 Active vs Control | 8 | 592 | Risk Ratio (M‐H, Random, 95% CI) | 1.08 [0.47, 2.48] |
| 6 Re‐operation for Bleeding ‐ Active vs Active Show forest plot | 6 | 527 | Risk Ratio (M‐H, Random, 95% CI) | 0.92 [0.39, 2.15] |
| 7 Any Infection ‐ All Studies Show forest plot | 13 | 1390 | Risk Ratio (M‐H, Random, 95% CI) | 0.74 [0.44, 1.25] |
| 8 Any Infection ‐ CS vs Control Show forest plot | 9 | Risk Ratio (M‐H, Random, 95% CI) | Subtotals only | |
| 8.1 Cell Salvage vs Control | 9 | 826 | Risk Ratio (M‐H, Random, 95% CI) | 0.75 [0.41, 1.37] |
| 9 Any Infection ‐ Active vs Active Show forest plot | 4 | 564 | Risk Ratio (M‐H, Random, 95% CI) | 0.35 [0.05, 2.63] |
| 10 Wound Complication ‐ All Studies Show forest plot | 9 | 730 | Risk Ratio (M‐H, Random, 95% CI) | 0.91 [0.46, 1.81] |
| 11 Wound Complication ‐ CS vs Control Show forest plot | 7 | Risk Ratio (M‐H, Random, 95% CI) | Subtotals only | |
| 11.1 Active vs Control | 7 | 504 | Risk Ratio (M‐H, Random, 95% CI) | 0.88 [0.42, 1.81] |
| 12 Wound Complication ‐ Active vs Active Show forest plot | 2 | 226 | Risk Ratio (M‐H, Random, 95% CI) | 1.24 [0.13, 11.75] |
| 13 Any Thrombosis ‐ All Studies Show forest plot | 7 | 497 | Risk Ratio (M‐H, Random, 95% CI) | 1.46 [0.56, 3.83] |
| 14 Any Thrombosis ‐ CS vs Control Show forest plot | 6 | Risk Ratio (M‐H, Random, 95% CI) | Subtotals only | |
| 14.1 Active vs Control | 6 | 379 | Risk Ratio (M‐H, Random, 95% CI) | 1.46 [0.56, 3.83] |
| 15 Stroke ‐ All Studies Show forest plot | 4 | 496 | Risk Ratio (M‐H, Random, 95% CI) | 0.65 [0.17, 2.50] |
| 16 Stroke ‐ CS vs Control Show forest plot | 3 | Risk Ratio (M‐H, Random, 95% CI) | Subtotals only | |
| 16.1 Active vs Control | 3 | 298 | Risk Ratio (M‐H, Random, 95% CI) | 0.73 [0.14, 3.72] |
| 17 Non‐Fatal Myocardial Infarction ‐ All Studies Show forest plot | 9 | 831 | Risk Ratio (M‐H, Random, 95% CI) | 0.76 [0.40, 1.43] |
| 18 Non‐Fatal Myocardial Infarction ‐ CS vs Control Show forest plot | 5 | Risk Ratio (M‐H, Random, 95% CI) | Subtotals only | |
| 18.1 Active vs Control | 5 | 448 | Risk Ratio (M‐H, Random, 95% CI) | 0.58 [0.28, 1.19] |
| 19 Non‐Fatal Myocardial Infarction ‐ Active vs Active Show forest plot | 4 | 383 | Risk Ratio (M‐H, Random, 95% CI) | 1.89 [0.51, 6.98] |
| 20 Deep Vein Thrombosis (DVT) Show forest plot | 4 | Risk Ratio (M‐H, Random, 95% CI) | Subtotals only | |
| 20.1 Active vs Control | 4 | 249 | Risk Ratio (M‐H, Random, 95% CI) | 0.93 [0.31, 2.77] |
| 21 Hospital Length of Stay (LOS) Show forest plot | 5 | Mean Difference (IV, Random, 95% CI) | Subtotals only | |
| 21.1 Active vs Control | 5 | 397 | Mean Difference (IV, Random, 95% CI) | ‐1.28 [‐2.65, 0.08] |