Development of type 2 diabetes mellitus in people with intermediate hyperglycaemia
Abstract
Background
Intermediate hyperglycaemia (IH) is characterised by one or more measurements of elevated blood glucose concentrations, such as impaired fasting glucose (IFG), impaired glucose tolerance (IGT) and elevated glycosylated haemoglobin A1c (HbA1c). These levels are higher than normal but below the diagnostic threshold for type 2 diabetes mellitus (T2DM). The reduced threshold of 5.6 mmol/L (100 mg/dL) fasting plasma glucose (FPG) for defining IFG, introduced by the American Diabetes Association (ADA) in 2003, substantially increased the prevalence of IFG. Likewise, the lowering of the HbA1c threshold from 6.0% to 5.7% by the ADA in 2010 could potentially have significant medical, public health and socioeconomic impacts.
Objectives
To assess the overall prognosis of people with IH for developing T2DM, regression from IH to normoglycaemia and the difference in T2DM incidence in people with IH versus people with normoglycaemia.
Search methods
We searched MEDLINE, Embase, ClincialTrials.gov and the International Clinical Trials Registry Platform (ICTRP) Search Portal up to December 2016 and updated the MEDLINE search in February 2018. We used several complementary search methods in addition to a Boolean search based on analytical text mining.
Selection criteria
We included prospective cohort studies investigating the development of T2DM in people with IH. We used standard definitions of IH as described by the ADA or World Health Organization (WHO). We excluded intervention trials and studies on cohorts with additional comorbidities at baseline, studies with missing data on the transition from IH to T2DM, and studies where T2DM incidence was evaluated by documents or self‐report only.
Data collection and analysis
One review author extracted study characteristics, and a second author checked the extracted data. We used a tailored version of the Quality In Prognosis Studies (QUIPS) tool for assessing risk of bias. We pooled incidence and incidence rate ratios (IRR) using a random‐effects model to account for between‐study heterogeneity. To meta‐analyse incidence data, we used a method for pooling proportions. For hazard ratios (HR) and odds ratios (OR) of IH versus normoglycaemia, reported with 95% confidence intervals (CI), we obtained standard errors from these CIs and performed random‐effects meta‐analyses using the generic inverse‐variance method. We used multivariable HRs and the model with the greatest number of covariates. We evaluated the certainty of the evidence with an adapted version of the GRADE framework.
Main results
We included 103 prospective cohort studies. The studies mainly defined IH by IFG5.6 (FPG mmol/L 5.6 to 6.9 mmol/L or 100 mg/dL to 125 mg/dL), IFG6.1 (FPG 6.1 mmol/L to 6.9 mmol/L or 110 mg/dL to 125 mg/dL), IGT (plasma glucose 7.8 mmol/L to 11.1 mmol/L or 140 mg/dL to 199 mg/dL two hours after a 75 g glucose load on the oral glucose tolerance test, combined IFG and IGT (IFG/IGT), and elevated HbA1c (HbA1c5.7: HbA1c 5.7% to 6.4% or 39 mmol/mol to 46 mmol/mol; HbA1c6.0: HbA1c 6.0% to 6.4% or 42 mmol/mol to 46 mmol/mol). The follow‐up period ranged from 1 to 24 years. Ninety‐three studies evaluated the overall prognosis of people with IH measured by cumulative T2DM incidence, and 52 studies evaluated glycaemic status as a prognostic factor for T2DM by comparing a cohort with IH to a cohort with normoglycaemia. Participants were of Australian, European or North American origin in 41 studies; Latin American in 7; Asian or Middle Eastern in 50; and Islanders or American Indians in 5. Six studies included children and/or adolescents.
Cumulative incidence of T2DM associated with IFG5.6, IFG6.1, IGT and the combination of IFG/IGT increased with length of follow‐up. Cumulative incidence was highest with IFG/IGT, followed by IGT, IFG6.1 and IFG5.6. Limited data showed a higher T2DM incidence associated with HbA1c6.0 compared to HbA1c5.7. We rated the evidence for overall prognosis as of moderate certainty because of imprecision (wide CIs in most studies). In the 47 studies reporting restitution of normoglycaemia, regression ranged from 33% to 59% within one to five years follow‐up, and from 17% to 42% for 6 to 11 years of follow‐up (moderate‐certainty evidence).
Studies evaluating the prognostic effect of IH versus normoglycaemia reported different effect measures (HRs, IRRs and ORs). Overall, the effect measures all indicated an elevated risk of T2DM at 1 to 24 years of follow‐up. Taking into account the long‐term follow‐up of cohort studies, estimation of HRs for time‐dependent events like T2DM incidence appeared most reliable. The pooled HR and the number of studies and participants for different IH definitions as compared to normoglycaemia were: IFG5.6: HR 4.32 (95% CI 2.61 to 7.12), 8 studies, 9017 participants; IFG6.1: HR 5.47 (95% CI 3.50 to 8.54), 9 studies, 2818 participants; IGT: HR 3.61 (95% CI 2.31 to 5.64), 5 studies, 4010 participants; IFG and IGT: HR 6.90 (95% CI 4.15 to 11.45), 5 studies, 1038 participants; HbA1c5.7: HR 5.55 (95% CI 2.77 to 11.12), 4 studies, 5223 participants; HbA1c6.0: HR 10.10 (95% CI 3.59 to 28.43), 6 studies, 4532 participants. In subgroup analyses, there was no clear pattern of differences between geographic regions. We downgraded the evidence for the prognostic effect of IH versus normoglycaemia to low‐certainty evidence due to study limitations because many studies did not adequately adjust for confounders. Imprecision and inconsistency required further downgrading due to wide 95% CIs and wide 95% prediction intervals (sometimes ranging from negative to positive prognostic factor to outcome associations), respectively.
This evidence is up to date as of 26 February 2018.
Authors' conclusions
Overall prognosis of people with IH worsened over time. T2DM cumulative incidence generally increased over the course of follow‐up but varied with IH definition. Regression from IH to normoglycaemia decreased over time but was observed even after 11 years of follow‐up. The risk of developing T2DM when comparing IH with normoglycaemia at baseline varied by IH definition. Taking into consideration the uncertainty of the available evidence, as well as the fluctuating stages of normoglycaemia, IH and T2DM, which may transition from one stage to another in both directions even after years of follow‐up, practitioners should be careful about the potential implications of any active intervention for people 'diagnosed' with IH.
Plain language summary
Development of type 2 diabetes mellitus in people with intermediate hyperglycaemia ('prediabetes')
Review question
We wanted to find out whether raised blood sugar ('prediabetes') increases the risk of developing type 2 diabetes and how many of these people return to having normal blood sugar levels (normoglycaemia). We also investigated the difference in type 2 diabetes development in people with prediabetes compared to people with normoglycaemia.
Background
Type 2 diabetes is often diagnosed by blood sugar measurements like fasting blood glucose or glucose measurements after an oral glucose tolerance test (drinking 75 g of glucose on an empty stomach) or by measuring glycosylated haemoglobin A1c (HbA1c), a long‐term marker of blood glucose levels. Type 2 diabetes can have bad effects on health in the long term (diabetic complications), like severe eye or kidney disease or diabetic feet, eventually resulting in foot ulcers.
Raised blood glucose levels (hyperglycaemia), which are above normal ranges but below the limit of diagnosing type 2 diabetes, indicate prediabetes, or intermediate hyperglycaemia. The way prediabetes is defined has important effects on public health because some physicians treat people with prediabetes with medications that can be harmful. For example, reducing the threshold for defining impaired fasting glucose (after an overnight fast) from 6.1 mmol/L or 110 mg/dL to 5.6 mmol/L or 100 mg/dL, as done by the American Diabetes Association (ADA), dramatically increased the number of people diagnosed with prediabetes worldwide.
Study characteristics
We searched for observational studies (studies where no intervention takes place but people are observed over prolonged periods of time) that investigated how many people with prediabetes at the beginning of the study developed type 2 diabetes. We also evaluated studies comparing people with prediabetes to people with normoglycaemia. Prediabetes was defined by different blood glucose measurements.
We found 103 studies, monitoring people over 1 to 24 years. More than 250,000 participants began the studies. In 41 studies the participants were of Australian, European or North American origin, in 7 studies participants were primarily of Latin American origin and in 50 studies participants were of Asian or Middle Eastern origin. Three studies had American Indians as participants, and one study each invited people from Mauritius and Nauru. Six studies included children, adolescents or both as participants.
This evidence is up to date as of 26 February 2018.
Key results
Generally, the development of new type 2 diabetes (diabetes incidence) in people with prediabetes increased over time. However, many participants also reverted from prediabetes back to normal blood glucose levels. Compared to people with normoglycaemia, those with prediabetes (any definition) showed an increased risk of developing type 2 diabetes, but results showed wide differences and depended on how prediabetes was measured. There were no clear differences with regard to several regions in the world or different populations. Because people with prediabetes may develop diabetes but may also change back to normoglycaemia almost any time, doctors should be careful about treating prediabetes because we are not sure whether this will result in more benefit than harm, especially when done on a global scale affecting many people worldwide.
Certainty of the evidence
The certainty of the evidence for overall prognosis was moderate because results varied widely. The certainty of evidence for studies comparing prediabetic with normoglycaemic people was low because the results were not precise and varied widely. In our included observational studies the researchers often did not investigate well enough whether factors like physical inactivity, age or increased body weight also influenced the development of type 2 diabetes, thus making the relationship between prediabetes and the development of type 2 diabetes less clear.
Authors' conclusions
Summary of findings
| Outcome: development of T2DM | ||||||||
| Follow‐up | Cumulative T2DM incidence % (95% CI) | Regression from intermediate hyperglycaemia to normoglycaemia % (95% CI) | Overall certainty of the evidence (GRADE)a | |||||
| IFG5.6 | IFG6.1 | IGT | IFG + IGT | HbA1c5.7 | HbA1c6.0 | |||
| 1 | — | — | 13 (5–23) [3; 671] | 29 (23–36) [1; 207] | — | — | 59 (54–64) [2; 375] | ⊕⊕⊕⊝ |
| 2 | 2 (1–2) [1; 1335] | 11 (8–14) [2; 549] | 16 (9–26) [9; 1998] | — | — | — | 46 (36–55) [9; 2852] | |
| 3 | 17 (6–32) [3; 1091] | 9 (2–20) [3; 927] | 22 (18–27) [3; 417] | 34 (28–41) [1; 209]— | — | 7 (5–10) [1; 370] | 41 (24–69) [7; 1356] | |
| 4 | 17 (13–22) [3; 800] | 30 (17–44) [2; 1567] | 22 (12–34) [5; 1042] | — | 14 (7–23) [3; 5352] | 44 (40–48) [2; 627] | 33 (26–40) [3; 807] | |
| 5 | 18 (10–27) [7; 3530] | 26 (19–33) [11; 3837] | 39 (25–53) [12; 3444] | 50 (37–63) [5; 478] | 25 (18–32) [4; 3524] | 38 (26–51) [3; 1462] | 34 (27–42) [9; 2603] | |
| 6 | 22 (15–31) [4; 738] | 37 (31–43) [5; 279] | 29 (25–34) [7; 775] | 58 (48–67) [4; 106] | 17 (14–20) [1; 675] | — | 23 (3–53) [5; 1328] | |
| 7 | 18 (8–30) [5; 980] | 15 (0–45) [4; 434] | 19 (13–26) [5; 835] | 32 (20–45) [4; 753] | 21 (16–27) [1; 207] | — | 41 (37–45) [4; 679] | |
| 8 | 34 (27–40) [2; 1887] | 48 (31–66) [1;29] | 43 (37–49) [4; 1021] | 52 (47–57) [1; 356] | — | — | 39 (33–44) [2; 328] | |
| 9 | 38 (10–70) [3; 1356] | — | 53 (45–60) [1; 163] | 84 (74–91) [1; 69] | — | — | 17 (14–22) [1; 299] | |
| 10 | 23 (14–33) [6; 1542] | 29 (17–43) [6; 537] | 26 (17–37) [6; 443] | 30 (17–44) [2; 49] | 31 (29–33) [2; 2854] | — | 42 (22–63) [7; 894] | |
| 11 | — | 38 (33–43) [1; 402] | 46 (43–49) [1; 1253] | — | — | — | 28 (17–39) [2; 736] | |
| 12 | 31 (19–34) [3; 433] | 31 (28–33) [1; 1382] | 41 (38–43) [2; 1552] | 70 (63–76) [2; 207] | — | — | — | |
| 15 | — | — | — | — | — | 29 (19–40) [1; 70] | — | |
| 20 | — | — | 60 (5–68) [1; 114] | — | — | — | — | |
| CI: confidence interval; HbA1c5.7 : glycosylated haemoglobin A1c, 5.7% threshold; HbA1c6.0 : glycosylated haemoglobin A1c, 6.0% threshold; IFG5.6 : impaired fasting glucose, 5.6 mmol/L threshold; IFG6.1 : impaired fasting glucose, 6.1 mmol/L threshold; IGT: impaired glucose tolerance; T2DM: type 2 diabetes mellitus. | ||||||||
| GRADE Working Group grades of evidence | ||||||||
| aWith phase 2 explanatory studies aiming to confirm independent associations between the prognostic factor and the outcome, GRADE starts with 'high quality' (Huguet 2013). We assumed the GRADE factor publication bias was inherent with this type of research (phase 2 design), so we did not use it as a potential downgrading factor | ||||||||
| Outcome: development of T2DM | ||||
| No of studies | No of participants with intermediate hyperglycaemia | Geographic region/special population | Estimated effect (95% CI) | Overall certainty of the evidence (GRADE)a |
| HR: 4 IRR: 6 OR: 10 | HR: 2385 IRR: 15,661 OR: 6359 | Asia/Middle East | HR: 5.07 (3.41–4.86) [1.07–24.02] IRR: 5.23 (3.77–7.25) [1.72–15.89] OR: 2.94 (1.77–4.86) [0.43–19.93] | ⊕⊕⊝⊝ |
| HR: 3 IRR: 3 OR: 9 | HR: 5685 IRR: 6322 OR: 1949 | Australia/Europe/North America | HR: 4.15 (1.24–13.9) [N/M] IRR: 4.96 (3.25–7.57) [0.32–77.24] OR: 6.47 (3.81–11.00) [0.99–42.32] | |
| HR: 0 IRR: 0 OR: 1 | HR: 0 IRR: 0 OR: 65 | Latin America | HR: NA IRR: NA OR: 4.28 (3.21–5.71) | |
| HR: 1 IRR: 1 OR: 1 | HR: 947 IRR: 2374 OR: 947 | American Indians/Islands | HR: 2.38 (1.85–3.06) IRR: 2.74 (1.88–3.99) OR: 3.12 (2.31–4.21) | |
| HR: 8 IRR: 10 OR: 21 | HR: 9017 IRR: 24,357 OR: 9320 | Overall | HR: 4.32 (2.61–7.12) [0.75–25.0] IRR: 4.81 (3.67–6.30) [1.95–11.83] OR: 4.15 (2.75–6.28) [0.53–32.4] | |
| CI: confidence interval; HR: hazard ratio;IFG5.6 : impaired fasting glucose 5.6 mmol/L threshold; IRR: incidence rate ratio; NA: not applicable; N/M: fewer than 3 studies or calculation of the 95% prediction interval did not provide a meaningful estimate; OR: odds ratio; T2DM: type 2 diabetes mellitus. | ||||
| GRADE Working Group grades of evidence | ||||
| aWith phase 2 explanatory studies aiming to confirm independent associations between the prognostic factor and the outcome, GRADE starts with 'high quality' (Huguet 2013). We assumed the GRADE factor publication bias was inherent with this type of research (phase 2 design), so we did not use it as a potential downgrading factor | ||||
| Outcome: development of T2DM | ||||
| No of studies | No of participants with intermediate hyperglycaemia | Geographic region/special population | Estimated effect (95% CI) | Overall certainty of |
| HR: 5 IRR: 2 OR: 7 | HR: 1054 IRR: 1677 OR: 3317 | Asia/Middle East | HR: 10.55 (3.61–30.81) [N/M] IRR: 3.62 (1.67–7.83) [N/M] OR: 5.18 (2.32–11.53) [0.29–91.37] | ⊕⊕⊝⊝ |
| HR: 4 IRR: 4 OR: 7 | HR: 1736 IRR: 3438 OR: 1240 | Australia/Europe/North America | HR: 3.30 (2.32–4.67) [0.84–12.99] IRR: 8.55 (6.37–11.48) [4.37–16.73] OR: 8.69 (4.95–15.24) [1.20–62.69] | |
| HR: 0 IRR: 0 OR: 1 | HR: 0 IRR: 0 OR: 17 | Latin America | HR: NA IRR: NA OR: 3.73 (2.18–6.38) | |
| HR: 0 IRR: 0 OR: 0 | HR: 0 IRR: 0 OR: 0 | American Indians/Islands | HR: NA IRR: NA OR: NA | |
| HR: 9 IRR: 6 OR: 15 | HR: 2818 IRR: 5115 OR: 4574 | Overall | HR: 5.47 (3.50–8.54) [1.09–27.56] IRR: 6.82 (4.53–10.25) [2.03–22.87] OR: 6.60 (4.18–10.43) [0.93–46.82] | |
| CI: confidence interval; HR: hazard ratio;IFG6.1 : impaired fasting glucose 6.1 mmol/L threshold; IRR: incidence rate ratio; NA: not applicable; N/M: fewer than 3 studies or calculation of the 95% prediction interval did not provide a meaningful estimate; OR: odds ratio; T2DM: type 2 diabetes mellitus. | ||||
| GRADE Working Group grades of evidence | ||||
| aWith phase 2 explanatory studies aiming to confirm independent associations between the prognostic factor and the outcome, GRADE starts with 'high quality' (Huguet 2013). We assumed the GRADE factor publication bias was inherent with this type of research (phase 2 design), so we did not use it as a potential downgrading factor | ||||
| Outcome: development of T2DM | ||||
| No of studies | No of participants with intermediate hyperglycaemia | Geographic region/special population | Estimated effect (95% CI) | Overall certainty of the evidence (GRADE)a |
| HR: 3 IRR: 5 OR: 6 | HR: 1780 IRR: 14,809 OR: 1226 | Asia/Middle East | HR: 4.48 (2.81–7.15) [N/M] IRR: 3.93 (3.03–5.10) [1.71–9.02] OR: 3.74 (2.83–4.94) [1.70–8.21] | ⊕⊕⊝⊝ |
| HR: 2 IRR: 5 OR: 11 | HR: 2230 IRR: 2572 OR: 1481 | Australia/Europe/North America | HR: 2.53 (1.52–4.19) [N/M] IRR: 5.93 (4.11–8.57) [2.38–14.81] OR: 5.20 (3.62–7.45) [1.50–18.09] | |
| HR: 0 IRR: 0 OR: 2 | HR: 0 IRR: 0 OR: 381 | Latin America | HR: NA IRR: NA OR: 4.94 (3.15–7.76) [N/M] | |
| IRR: 2 | IRR: 1087 | American Indians/Islands | IRR: 4.46 (3.12–6.38) [N/M] OR: 3.60 (1.40–9.26) HR: NA | |
| HR: 5 IRR: 12 OR: 20 | HR: 4010 IRR: 18,468 OR: 3139 | Overall | HR: 3.61 (2.31–5.64) [0.69–18.97] IRR: 4.48 (3.59–5.44) [2.60–7.70] OR: 4.61 (3.76–5.64) [2.10–10.13] | |
| CI: confidence interval; HR: hazard ratio;IGT: impaired glucose tolerance; IRR: incidence rate ratio; NA: not applicable; N/M: fewer than 3 studies or calculation of the 95% prediction interval did not provide a meaningful estimate; T2DM: type 2 diabetes mellitus. | ||||
| GRADE Working Group grades of evidence | ||||
| aWith phase 2 explanatory studies aiming to confirm independent associations between the prognostic factor and the outcome, GRADE starts with 'high quality' (Huguet 2013). We assumed the GRADE factor publication bias was inherent with this type of research (phase 2 design), so we did not use it as a potential downgrading factor | ||||
| Outcome: development of T2DM | ||||
| No of studies | No of participants with intermediate hyperglycaemia | Geographic region/special population | Estimated effect (95% CI) | Overall certainty of the evidence (GRADE)a |
| HR: 3 IRR: 4 OR: 3 | HR: 461 IRR: 3166 OR: 498 | Asia/Middle East | HR: 10.20 (5.45–19.09) [N/M] IRR: 11.20 (5.59–22.43) [N/M] OR: 6.99 (3.09–15.83) [N/M] | ⊕⊕⊝⊝ |
| HR: 1 IRR: 4 OR: 6 | HR: 221 IRR: 699 OR: 154 | Australia/Europe/North America | HR: 3.80 (2.30–6.28) [N/M] IRR: 13.92 (9.99–19.40) [6.71–28.85] OR: 20.95 (12.40–35.40) [4.93–89.05] | |
| HR: 0 IRR: 0 OR: 0 | HR: 0 IRR: 0 OR: 0 | Latin America | HR: NA IRR: NA OR: NA | |
| HR: 1 IRR: 1 | HR: 356 IRR: 605 | American Indians/Islands | HR: 4.06 (3.05–5.40) IRR: 5.18 (3.42–7.83) | |
| HR: 5 IRR: 9 OR: 9 | HR: 1038 IRR: 4470 OR: 652 | Overall | HR: 6.90 (4.15–11.45) [1.06–44.95] IRR: 10.94 (7.22–16.58) [2.58–46.46] OR: 13.14 (7.41–23.30) [1.84–93.66] | |
| CI: confidence interval; HR: hazard ratio;IFG: impaired fasting glucose; IGT: impaired glucose tolerance; IRR: incidence rate ratio; NA: not applicable; N/M: fewer than 3 studies or calculation of the 95% prediction interval did not provide a meaningful estimate; OR: odds ratio; T2DM: type 2 diabetes mellitus. | ||||
| GRADE Working Group grades of evidence | ||||
| aWith phase 2 explanatory studies aiming to confirm independent associations between the prognostic factor and the outcome, GRADE starts with 'high quality' (Huguet 2013). We assumed the GRADE factor publication bias was inherent with this type of research (phase 2 design), so we did not use it as a potential downgrading factor | ||||
| Outcome: development of T2DM | ||||
| No of studies | No of participants with intermediate hyperglycaemia | Geographic region/special population | Estimated effect (95% CI) | Overall certainty of the evidence (GRADE)a |
| HR: 3 IRR: 1 OR: 1 | HR: 3196 IRR: 1965 OR: 675 | Asia/Middle East | HR: 7.21 (5.14–10.11) [0.81–64.52] IRR: 6.62 (4.18–10.49) [N/M] OR: 4.54 (2.65–7.78) [N/M] | ⊕⊕⊝⊝ |
| HR: 1 IRR: 0 OR: 2 | HR: 2027 IRR: 0 OR: 231 | Australia/Europe/North America | HR: 2.71 (2.48–2.96) [N/M] IRR: NA OR: 4.38 (1.36–14.15) [N/M] | |
| HR: 0 IRR: 0 OR: 0 | HR: 0 IRR: 0 OR: 0 | Latin America | HR: NA IRR: NA OR: NA | |
| HR: 0 IRR: 0 OR: 0 | HR: 0 IRR: 0 OR: 0 | American Indians/Islands | HR: NA IRR: NA OR: NA | |
| HR: 4 IRR: 1 OR: 3 | HR: 5223 IRR: 1965 OR: 906 | Overall | HR: 5.55 (2.77–11.12) [0.23–141.18] IRR: 6.62 (4.18–10.49) [N/M] OR: 4.43 (2.20–8.88) [N/M] | |
| CI: confidence interval; HbA1c5.7 : glycosylated haemoglobin A1c 5.7% threshold; HR: hazard ratio;IRR: incidence rate ratio; NA: not applicable; N/M: fewer than 3 studies or calculation of the 95% prediction interval did not provide a meaningful estimate; OR: odds ratio; T2DM: type 2 diabetes mellitus. | ||||
| GRADE Working Group grades of evidence | ||||
| aWith phase 2 explanatory studies aiming to confirm independent associations between the prognostic factor and the outcome, GRADE starts with 'high quality' (Huguet 2013). We assumed the GRADE factor publication bias was inherent with this type of research (phase 2 design), so we did not use it as a potential downgrading factor | ||||
| Outcome: development of T2DM | ||||
| No of studies | No of participants with intermediate hyperglycaemia | Geographic region/special population | Estimated effect (95% CI) | Overall certainty of the evidence (GRADE)a |
| HR: 2 IRR: 0 OR: 1 | HR: 1040 IRR: 0 OR: 370 | Australia/Europe/North America | HR: 5.09 (1.69–15.37) [N/M] IRR: NA OR: 15.60 (6.90–35.27) [N/M] | ⊕⊕⊝⊝ |
| HR: 4 IRR: 0 OR: 1 | HR: 3492 IRR: 0 OR: 1103 | Asia/Middle East | HR: 13.12 (4.10–41.96) [N/M] IRR: NA OR: 23.20 (18.70–28.78) [N/M] | |
| HR: 0 IRR: 0 OR: 0 | HR: 0 IRR: 0 OR: 0 | Latin America | HR: NA IRR: NA OR: NA | |
| IRR: 0 | IRR: 0 HR: 0 | American Indians/Islands | IRR: NA OR: 5.89 (4.23–8.20) [N/M] HR: NA | |
| HR: 6 IRR: 0 OR: 3 | HR: 4532 IRR: 0 OR: 1594 | Overall | HR: 10.10 (3.59–28.43) [N/M] IRR: NA OR: 12.79 [4.56–35.85] [N/M] | |
| CI: confidence interval; HbA1c6.0 : glycosylated haemoglobin A1c 6.0% threshold; HR: hazard ratio;IRR: incidence rate ratio; NA: not applicable; N/M: fewer than 3 studies or calculation of the 95% prediction interval did not provide a meaningful estimate; OR: odds ratio; T2DM: type 2 diabetes mellitus. | ||||
| GRADE Working Group grades of evidence | ||||
| aWith phase 2 explanatory studies aiming to confirm independent associations between the prognostic factor and the outcome, GRADE starts with 'high quality' (Huguet 2013). We assumed the GRADE factor publication bias was inherent with this type of research (phase 2 design), so we did not use it as a potential downgrading factor | ||||
Background
For a glossary of terms please see Appendix 1.
'Prediabetes', 'borderline diabetes', 'prediabetic stage', 'high risk of diabetes', 'dysglycaemia' or 'intermediate hyperglycaemia' (IH) are terms used to characterise various measurements of elevated blood glucose concentrations, such as impaired fasting glucose (IFG), impaired glucose tolerance (IGT), elevated glycosylated haemoglobin A1c (HbA1c) or combinations of these conditions (WHO/IDF 2006). Elevated blood glucose levels that indicate hyperglycaemia are too high to be considered normal, but they are below the diagnostic threshold for type 2 diabetes mellitus (T2DM). Therefore, due to the continuous glycaemic spectrum from normal to the diabetic stage, a sound evidence base is needed to define glycaemic thresholds for people at high risk of T2DM, especially because dysglycaemia is commonly an asymptomatic condition, so naturally it often remains undiagnosed (CDC 2015). The various terms used to describe stages of hyperglycaemia may cause people to have marked emotional reactions. For example, the term prediabetes may imply (at least for non‐experts) that diabetes is unavoidable, whereas (high) risk of diabetes gives people the impression that they can possibly avoid the disease altogether. In addition to the disputable construct of intermediate health states termed 'predisease' (Viera 2011), many people may associate the label 'prediabetes' with dire consequences. Alternatively, any diagnosis of prediabetes may be an opportunity to reassess, for example, eating habits and physical activity levels, thus enabling affected individuals to actively change their health‐related behaviours.
Several institutional bodies like the American Diabetes Association (ADA) and the World Health Organization (WHO) have established commonly used criteria to define people who are at a high risk of developing T2DM.
-
In 1979, the National Diabetes Data Group (NDDG) described glucose intolerance as an intermediate metabolic state between normoglycaemia and diabetes (NDDG 1979). NDDG defined this IGT as an elevated plasma glucose concentration (7.8 mmol/L to 11.1 mmol/L or 140 mg/dL to 199 mg/dL) two hours after a 75 g glucose load on the oral glucose tolerance test (OGTT).
-
In 1997, the Expert Committe on the Diagnosis and Classification of Diabetes Mellitus and later the WHO defined two intermediate states of glucose regulation existing between regular glucose homeostasis and diabetes: IGT was diagnosed two hours after a 75 g OGTT by a plasma glucose level of 7.8 mmol/L to 11.1 mmol/L (140 mg/dL to 199 mg/dL) or by the concept of IFG (ADA 1997; WHO 1999). The initial definition of IFG was a fasting plasma glucose (FPG) level of 6.1 mmol/L to 6.9 mmol/L (110 mg/dL to 125 mg/dL). In 2003, the ADA reduced the lower threshold to 5.6 mmol/L (100 mg/dL) (ADA 2003). However, the WHO did not endorse this lower cut‐off point for IFG (WHO/IDF 2006).
-
More recently, an elevated HbA1c has been introduced to identify people at high risk of developing T2DM. In 2009, the International Expert Committee (IEC) proposed HbA1c measurements of 6.0% to 6.4% (42 mmol/mol to 46 mmol/mol) to identify people at a high risk of T2DM (IEC 2009). In 2010, the ADA re‐defined this HbA1c level as 5.7% to 6.4% (39 mmol/mol to 46 mmol/mol) (ADA 2010), a decision not endorsed by WHO, IEC or other organisations.
The various glycaemic tests do not identify the same people at risk, as there is an imperfect overlap among the glycaemic modalities available to define IH (Cheng 2006; Gosmanov 2014; Morris 2013; Selvin 2011). Unlike IFG and IGT, HbA1c reflects longer‐term glycaemic control, that is, how a person's blood glucose concentrations have been during the preceding two to three months (Inzucchi 2012). Compared with IFG and IGT measurements, HbA1c assessments have less intrapersonal variability when repeated. However, haemoglobin variants, genetic haemoglobinopathies, thalassemias and iron deficiency anaemia substantially influence HbA1c measurements (Mostafa 2011). The FPG thresholds of defining IFG and the question whether HbA1c is an adequate tool to diagnose IH are still a subject of debate (Buysschaert 2011; Buysschaert 2016). In studies investigating the risk of IH as measured by HbA1c, the association is probably underestimated if time‐dependent effects are not taken into account (Lind 2009). On the other hand, some investigators question whether HbA1c as such is the right outcome measure for studies of diabetes (Lipska 2017).
Also, IFG and IGT differ in their age and sex distribution, and both increase with advancing age (Nathan 2007), as glucose tolerance deteriorates with age (Gale 2013). 'Ethnicity' and geography are additional important features: the prevalence of elevated HbA1c in black people is twice as high as in non‐Hispanic white people, but the opposite is true for IGT (Selvin 2011; Ziemer 2010). The number of people with IH identified in South Asian compared with European cohorts and the associated cardiovascular disease (CVD) risk depend on how prediabetes is diagnosed (Eastwood 2016).
The increase in T2DM results from an interaction between genetic and environmental factors, reflecting behavioural changes over time such as decreased physical activity levels and increased body weight (DeFronzo 2011; Nathan 2007). Both IFG and IGT are insulin‐resistant states, and insulin resistance is thought to be the core defect in T2DM: people with (isolated) IFG predominantly have β‐cell dysfunction with impaired insulin secretion (DeFronzo 1989), plus moderate hepatic insulin resistance, but near‐normal muscle insulin sensitivity. The consequence is excessive fasting hepatic glucose production followed by elevated FPG. During an OGTT the early insulin response (0 to 30/60 min) is impaired, resulting in an excessive early rise in postload glucose (PG). The late insulin response (60 min to 120 min) appears intact and the two‐hour PG returns to its approximately starting FPG level (DeFronzo 2011; Nathan 2007). People with (isolated) IGT have normal to slightly reduced hepatic insulin sensitivity and moderate to severe muscle insulin resistance (Abdul‐Ghani 2006; Jensen 2002). During an OGTT both the early and the late insulin response are impaired. Hyperglycaemia is progressive and prolonged after the glucose load, and the two‐hour PG remains above its starting FPG level (DeFronzo 2011; Nathan 2007).
There are some known risk indicators for the development of T2DM, including a positive family history, gestational diabetes mellitus, obesity, 'ethnicity' (e.g. the risk of diabetes is thought to be higher among Asians, Hispanics, and 'black' people), polycystic ovarian syndrome, impaired insulin secretion and insulin resistance, abnormal coagulation factors and endothelial dysfunction. However, the evidence base for the weight of a single risk indicator and the interplay of various factors is still under investigation. Type 2 diabetes mellitus is a rather complex metabolic state and could be described as an asymptomatic risk factor for a future disease (Yudkin 2016), and hence prediabetes a risk factor for another risk factor (Nathan 2007).
Diabetes is a category, whereas IFG and IGT reflect a continuous variable with more or less arbitrarily chosen cut‐off points (Yudkin 1990; Yudkin 2014). The reduced lower threshold of 5.6 mmol/L (100 mg/dL) to define IFG by the ADA in 2003 substantially increased the prevalence of IFG with potentially significant public health and socioeconomic implications (Davidson 2003; Yudkin 2014; Yudkin 2016). Some authors have argued that substantial benefits might ensue even if it were only possible to delay the onset of diabetes by detecting and treating prediabetes (Cefalu 2016). Interestingly, some people with IH will not develop T2DM, and some people will return or 'regress' to normoglycaemia. In the Diabetes Prevention Program (DPP), the hazard ratio of developing T2DM was 0.44 (95% confidence interval 0.37 to 0.55) in people having at least one normal OGTT during the DPP compared with people who never regressed to normoglycaemia during the DPP (Perreault 2012; Perreault 2014). The ADA associated regression with remission and defined it as a partial or complete diabetes remission of glycaemic measurements for at least one year without pharmacological or surgical interventions (Buse 2009). This could have significant impact on "the therapeutic strategy from diabetes prevention and lifelong glucose‐lowering treatment to induction of regression and monitoring for relapse" (Yakubovich 2012).
Objectives
Objective 1: to assess the overall prognosis of people with IH for the development of T2DM and to assess how many people with IH revert back to normoglycaemia (regression).
With regard to objective 1 we established the following 'Population, Intervention, Outcome, Timing, Setting' (PICOTS) table (adapted according to the PICOTS system presented in Debray 2017).
| Item | Definition |
| Population | People with intermediate hyperglycaemia (defined by IFG, IGT or elevated HbA1c) |
| Intervention | None |
| Comparator | None |
| Outcome | Development of type 2 diabetes Regression to normoglycaemia |
| Timing | At least 1 year follow‐up |
| Setting | Outpatients |
| IFG: impaired fasting glucose; IGT: impaired glucose tolerance; HbA1c: glycosylated haemoglobin A1c | |
Objective 2: to assess the difference in T2DM incidence in people with IH versus people with normoglycaemia.
With regard to objective 2 we established the following PICOTS table (adapted according to the PICOTS system presented in Debray 2017).
| Item | Definition |
| Population | People with intermediate hyperglycaemia (defined by IFG, IGT or elevated HbA1c) |
| Intervention | Intermediate hyperglycaemia as a prognostic factor |
| Comparator | Normoglycaemia |
| Outcome | Development of type 2 diabetes |
| Timing | At least one year follow‐up |
| Setting | Outpatients |
| IFG: impaired fasting glucose; IGT: impaired glucose tolerance; HbA1c: glycosylated haemoglobin A1c | |
Methods
Criteria for considering studies for this review
Study design
Prospective cohort studies investigating either the overall prognosis of people with IH for developing T2DM or IH versus normoglycaemia as a prognostic factor for developing T2DM (Altman 2001).
Inclusion criteria
Types of participants
To study the overall prognosis of people with IH and regression from IH to normoglycaemia, we included cohort studies in people with IH at baseline, defined by impaired fasting glucose (IFG), impaired glucose tolerance (IGT), elevated glycosylated haemoglobin A1c (HbA1c) or any combination of these. IH had to be established by standard cut‐off values for IFG, IGT or elevated HbA1c, as defined by ADA or WHO (ADA 1997; ADA 2003; ADA 2010; ICH 1997; IEC 2009; WHO 1998; WHO/IDF 2006).
To study whether IH compared to normoglycaemia is a prognostic factor for developing T2DM, we included cohort studies in people with IH and normoglycaemia at baseline.
Definition of IH
We defined IH according to ADA and WHO descriptions.
-
IFG5.6 threshold, usually defined as a fasting plasma glucose level between 5.6 mmol/L and 6.9 mmol/L at baseline.
-
IFG6.1 threshold, usually defined as a fasting plasma glucose level between 6.1 mmol/L and 6.9 mmol/L at baseline.
-
IGT, usually defined as a plasma glucose level between 7.8 mmol/L and 11.1 mmol/L two hours after a 75 g OGTT at baseline.
-
Isolated IFG was defined as IFG5.6 or IFG6.1 only (without IGT), and isolated IGT was defined as IGT only (without IFG5.6 or IFG6.1).
-
HbA1c5.7 threshold, usually defined as HbA1c measurement between 5.7% and 6.4% at baseline.
-
HbA1c6.0 threshold, usually defined as HbA1c measurement between 6.0% and 6.4% at baseline.
Types of outcome measures
Our outcome of primary interest was the diagnosis of newly developed T2DM (T2DM incidence). T2DM incidence should have been diagnosed by blood glucose measurements such as fasting plasma glucose (FPG), two‐hour postload glucose (PG) or HbA1c. Diagnosis could have been combined with self‐reported diabetes, physician‐diagnosed diabetes or use of antihyperglycaemic medications such as oral hypoglycaemic drugs, insulin or both.
Exclusion criteria
-
Intervention trials and study designs other than prospective cohort studies.
-
People with comorbidities at baseline (e.g. people with coronary heart disease and IGT).
-
Missing data on transition from IH to T2DM.
-
Follow‐up period after baseline assessment not specified (not possible to associate T2DM incidence with length of follow‐up).
-
T2DM incidence evaluated by documents (e.g. hospital records, retrospective use of registers) or self‐report only.
Search methods for identification of studies
The fundamental challenge of this review question was to define the population of interest, that is, people with IH. We expected a great number of terms describing this population, such as people with prediabetes, mentions of IFG, IGT or HbA1c somewhere in the title or abstract of relevant publications, and terms like risk factors, predictors, prevalence, incidence and several other concepts which cannot be foreseen when developing a Boolean search strategy in a conceptual way.
One option to address this problem would have been to design a highly sensitive search strategy, which would have resulted in a yield of more than 15,000 references, which was unfeasible for fast human screening but could be addressed in the future with robust automated classification algorithms. Instead, we designed a more specific Boolean search approach based on text analysis and augmented by the following complementary search methods.
-
Identification of systematic reviews addressing our review question.
-
Careful checking of reference lists and Discussion sections of relevant studies.
-
A non‐human skill dependent search method based on PubMed's 'similar articles' algorithm.
Boolean search
We developed the search strategy using analytical text mining of 44 relevant publications (range of publication years 2008 to 2015, from 31 journals) already known to review author BR. We used the tools PubReMiner, TerMine and AntConc and applied the prognosis filters by the Hedges Team (Wilczynski 2004; Wilczynski 2005).
We searched the following sources from database inception to the specified date.
-
MEDLINE Ovid Epub Ahead of Print, In‐Process & Other Non‐Indexed Citations, Ovid MEDLINE(R) Daily and Ovid MEDLINE(R) (1946 to 15 December 2016 and then updated to 26 February 2018).
-
Embase Ovid (1974 to 2016 Week 50, last searched 15 December 2016).
-
ClinicalTrials.gov (searched 15 December 2016).
-
WHO International Clinical Trials Registry Platform (ICTRP) Search Portal (apps.who.int/trialsearch; searched 15 December 2016).
Before publication, we updated the MEDLINE search as reflected above. We restricted the update to MEDLINE because 98% of the publications of included studies identified up to the point of updating (on 26 February 2018) were indexed in MEDLINE.
The search strategy consisted of two tiers.
-
Prediabetes as predictor for cardiovascular disease (CVD), mortality, stroke, cancer, micro‐ and macrovascular complications.
-
Prediabetes as predictor for diabetes incidence.
We combined both strategies with the conjunction 'OR' because it was likely that search results for prediabetes as a predictor for complications also contained data on diabetes incidence. For details of all search strategies see Appendix 2.
Study extraction of relevant systematic reviews
In addition, we extracted relevant publications from 16 identified systematic reviews (Echouffo‐Tcheugui 2016; Erqou 2013; Ford 2010; Hope 2016; Huang 2014b; Huang 2014a; Huang 2016; Lee 2012; Morris 2013; Santos‐Oliveira 2011; Sarwar 2010; Schottker 2016; Twito 2015; Xu 2015; Zhang 2012a; Zhong 2016).
Reference checking of included studies
We extracted relevant publications after handsearching the full texts of included studies (Methods section, Discussion section, reference lists).
'Similar articles'‐based search method
On 15 March 2018 we ran PubMed's 'similar articles' algorithm with the 224 publications of included studies identified by our search methods so far ('seed publications' in Appendix 2). When using the 'similar articles' algorithm, search results in PubMed are retrieved and ranked according to pre‐calculated similarities of the seed publications. We downloaded the first 500 results (of 24,124), deduplicated them against the already identified seed publications and screened the resulting set.
Selection of studies
Two review authors (BR and BH) independently scanned the title, abstract, or both, of every record retrieved in the literature searches to determine which studies to assess further. We investigated the full text of all potentially relevant articles, resolving discrepancies through consensus or by recourse to a third review author (MIM). We prepared a flow diagram of the number of studies identified and excluded at each stage in accordance with the PRISMA flow diagram of study selection (Liberati 2009).
Data extraction and management
For studies that fulfilled our inclusion criteria, one review author (BR) extracted key study characteristics, inclusion and exclusion criteria of study participants, stated aim of the study, definitions of prognosis, prognostic factor and outcome (normoglycaemia, intermediate glycaemia and T2DM incidence), baseline characteristics of study participants and data on transition from IH (as defined by IFG, IGT, elevated HbA1c or combinations thereof) to T2DM. Another author (MIM) checked these data extractions, and we resolved any disagreements by discussion or, if required, by consultation with a third review author (BH). We used parts of the checklist for critical appraisal and data extraction for systematic reviews of prediction modelling studies (CHARMS), which helps to evaluate prediction modelling studies (Moons 2014), and we established our own context‐specific data extraction sheets after piloting data extraction for 15 studies.
Dealing with companion publications
In the event of companion publications or multiple reports of a prospective cohort study (e.g. because of different time points investigated) we focused on the analysis of the publication describing the longest follow‐up from baseline and extracted data from shorter follow‐ups in case some measures were not reported in the publication on the longest follow‐up (e.g. the most recent paper might have described the association between elevated HbA1c and T2DM incidence, but an older publication might have described the association between IGT and T2DM incidence). Companion publications or multiple reports of a primary study were listed as secondary references under the primary reference of the included, ongoing or excluded study.
Assessment of risk of bias in included studies
One review author (BR) assessed the risk of bias of each included study and another review author (MIM) checked the accuracy of this assessment. We resolved any disagreements by consensus, or by consultation with a third review author (BH). We used a tailored version of the Quality In Prognosis Studies (QUIPS) tool for assessing risk of bias in studies of the prognostic factor IH versus normoglycaemia (Dretzke 2014; Hayden 2013; see Appendix 3). Our tool consisted of six risk of bias domains: study participation, study attrition, glycaemic status measurement, outcome measurement, study confounding; and statistical analysis and reporting. The study participation domain consisted of five items: description of the source population or population of interest, description of the baseline study sample, adequate description of the sampling frame and recruitment, adequate description of the period and place of recruitment, and adequate description of inclusion and exclusion criteria. The study attrition domain consisted of four items: description of attempts to collect information on participants who dropped out, reasons for loss to follow‐up provided, adequate description of participants lost to follow‐up, and no important differences between participants who completed the study and those who did not. The glycaemic status measurement domain consisted of four items: provision of clear definition or description of the glycaemic status, adequately valid and reliable method of measuring glycaemic status, reporting of continuous variables or use of appropriate cut points, and use of same method and setting of measurement of glycaemic status in all study participants. The outcome measurement domain consisted of three items: provision of clear definition of the outcome, use of adequately valid and reliable method of outcome measurement, and use of same method and setting of outcome measurement in all study participants. The study confounding domain consisted of the seven items: measurement of all important confounders, provision of clear definitions of the important confounders measured, adequately valid and reliable measurement of all important confounders, use of same method and setting of confounding measurement in all study participants, appropriate imputation methods used for missing confounders (if applicable), important potential confounders accounted for in the study design, and important potential confounders accounted for in the analysis. The statistical analysis and reporting domain consisted of two items: sufficient presentation of data to assess the adequacy of the analytic strategy, and adequate statistical model for the design of the study. There is no recommended tool for assessing risk of bias in studies of overall prognosis. Therefore, we applied the tailored QUIPS tool to these studies as well but without the domains for study confounding and statistical analysis and reporting because these were not suitable to basic calculations of cumulative incidence. We planned to investigate the influence of low risk of bias (low risk of bias in all domains) versus unclear/high risk of bias (unclear or high risk of bias in at least one of these domains).
Measures of T2DM incidence and unit of analyses issues
If more than one group from the same cohort study was eligible for inclusion in the same meta‐analysis, we included the groups only if separate information was available (e.g. data on T2DM incidence for female and male participants). If more than one time point of T2DM was available for a study (e.g. cumulative incidence data) we included data in the appropriate meta‐analysis for each time point separately and did not pool data across different follow‐up periods.
Data synthesis
Our primary aim for overall prognosis in people with IH was to provide a transparent overview of the whole data matrix describing a wide variety of possible associations between various isolated and combined definitions of IH and incident T2DM in dissimilar populations covering diverse time periods. We also evaluated whether IH compared to normoglycaemia is a prognostic factor for developing T2DM.
First, we grouped studies on IH definitions, i.e. isolated IFG 5.6 mmol/L to 6.9 mmol/L (IFG5.6 threshold), isolated IFG 6.1 mmol/L to 6.9 mmol/L (IFG6.1 threshold), isolated IGT (glucose concentration 7.8 mmol/L to 11.1 mmol/L two hours after a 75 g glucose load on the OGTT), IFG and IGT combined, HbA1c 6.0% to 6.4% (HbA1c6.0 threshold), and HbA1c 5.7% to 6.4% (HbA1c5.7 threshold). Then we evaluated subgroups of different geographic locations/'ethnicities' for each IH definition.
We expected the following outcome measures.
-
Cases (cumulative incidence at follow‐up; e.g. 20 new diabetes cases out of 400 people with IFG at baseline (5%)) and cumulative incidence rates (cases per 1000 person‐years) for overall prognosis of people with IH.
-
Odds ratios (ORs), incidence rate ratios (IRRs), and hazard ratios (HRs) for IH versus normoglycaemia as a prognostic factor for developing T2DM.
We pooled incidence and incidence rate ratios (IRR) using a random‐effects model to account for between‐study heterogeneity. For meta‐analysis of incidence data, we used a method for pooling proportions which uses the Freeman‐Tukey Double Arcsine Transformation to stabilise the variances (Freeman 1950). The meta‐analysis was performed using the Stata software user written programme metaprop (Stata 2015). For the confidence intervals (CI) for individual studies shown on the forest plots for incidence, we used the Wilson approach (Newcombe 1998). For meta‐analysis of IRRs, we first computed the log IRRs and their approximate standard errors and then used an inverse variance weighted random‐effects model to pool the log IRRs (Hasselblad 1994; Higgins 2011b). We exponentiated the pooled log IRR to obtain the pooled IRR. The meta‐analysis of log IRRs was performed using the Stata user written programme metan.
If publications reported HRs with associated 95% CIs, we obtained standard errors from these CIs as described in chapter 7.7.7.3 of the Cochrane Handbook for Systematic Reviews of Interventions (Higgins 2011a), and we performed meta‐analysis using the generic inverse‐variance method (RevMan 2014). When possible, we reported both adjusted and unadjusted HRs, but we primarily used adjusted HRs from multivariable models of studies incorporating similar covariates (Dretzke 2014).
Assessment of heterogeneity
We expected substantial clinical heterogeneity between studies because of geographical/'ethnic' and methodological diversity. We did not intend to address statistical heterogeneity (inconsistency) using the I2 statistic because this statistic does not indicate how much the effect size varies, which is what people want to know when asking about the implications of heterogeneity (Borenstein 2017a). Also, the I2 statistic is problematic in the context of prognosis studies because individual studies often have large sample sizes resulting in narrow CIs, which can result in high I2 values even if inconsistency between studies is moderate (Iorio 2015). Instead, when there were at least three studies, we reported the range of the effects of the random‐effects meta‐analyses using prediction intervals (Borenstein 2017b; Higgins 2009; IntHout 2016; Riley 2011; Riley 2015). In a random‐effects meta‐analysis, the prediction interval reflects the whole distribution of effects across study populations, including the effect expected in a future study (IntHout 2016; Riley 2015).
Certainty of the evidence
We created a 'Summary of findings' table using Review Manager 5 (RevMan 2014). We used an adapted version of the GRADE framework for prognostic factor research for describing the influence of IFG, IGT, elevated HbA1c and both IFG and IGT on the development of T2DM (Huguet 2013). We justified all decisions to downgrade the certainty of evidence using footnotes, and we made comments to aid the reader's understanding of this Cochrane Review where necessary.
Sensitivity analysis
We planned to perform sensitivity analyses to explore the influence of the following factors (when applicable) on effect sizes by excluding:
-
studies at high or unclear risk of bias;
-
very long or large studies to establish the extent to which they dominate the results.
Subgroup analysis
Because we stratified the analyses by IH definition and geographical locations/'ethnicity', which we thought were the main sources of heterogeneity, we did not plan to perform subgroup analyses. However, if at least 10 studies specifying diabetes incidence data were included, we would have investigated age and sex by testing for interactions between subgroups.
If T2DM incidence data were available for children and adolescents, we reported the results separately.
Results
Description of studies
Results of the search
We identified a total of 8354 records through database searching and an additional 259 records from 16 systematic reviews. After excluding duplicates and non‐relevant records based on title and abstract screening, we assessed 450 full‐text records. Of these we excluded 213 full‐text articles; the remaining 237 articles were reports of 110 studies. Of the 110 studies, 4 were potentially relevant ongoing trials (NCT00786890; NCT02838693; NCT02958579; Vilanova 2017), and 3 are awaiting classification (Li 2001; Misnikova 2011; NCT00816608). Therefore, we included 103 studies. We added 86 new publications after handsearching the full texts of included studies, but these were all secondary publications of the included studies.
The complementary 'similar articles' algorithm search using our set of known publications yielded 263 publications for screening after deduplication. This resulted in 24 new publications after excluding irrelevant articles based on title and abstract screening. We did not identify new studies but found 13 secondary publications of studies we had already included.
Altogether, we included 103 prospective cohort studies (329 publications) in the review. After the initial search in four databases (in December 2016), we observed that 98% of all included publications were indexed in Ovid MEDLINE. Therefore, we decided to restrict the pre‐publication update search in February 2018 to Ovid MEDLINE.
For full details of search results see Figure 1.

Study flow diagram
Included studies
For a detailed description of the characteristics of the included studies, see Characteristics of included studies; Appendix 4; Appendix 5; Appendix 6; Appendix 7; Appendix 8; Appendix 9; Appendix 10; Appendix 11; Appendix 12; Appendix 13; Appendix 14; Appendix 15; Appendix 16; and Appendix 17. The following is a succinct overview.
Source of data
The 103 studies took place in the following regions of the world.
-
Australia: 3 studies.
-
Latin America: 7 studies (Chile, 1 study; Columbia, 1 study; Mexico, 5 studies (2 studies with primarily Mexican Americans took place in the USA (Garcia 2016; Lorenzo 2003)).
-
North America: 12 studies (USA ,12 studies, with 4 studies in particular populations: Pima Indians/Native Americans, 3 studies (Vijayakumar 2017; Wang 2011; Wheelock 2016); and Japanese Americans, 1 study (McNeely 2003)).
-
Africa: 1 study (performed in South Africa but with a population consisting of South African Indians (Motala 2003)).
-
Middle East: 7 studies (Iran, 5 studies; Israel, 1 study; Jordan, 1 study).
-
Asia: 42 studies (China, 11 studies; India, 5 studies; Japan, 8 studies; Korea, 11 studies; Singapore, 2 studies; Taiwan, 2 studies; Thailand, 3 studies).
-
Islands: 2 studies (Mauritius, 1 study; Micronesia (Nauru), 1 study).
-
Europe: 29 studies (Denmark, 1 study; Finland, 5 studies; France, 3 studies; Germany, 3 studies; Greece, 1 study; Italy, 3 studies; Malta, 1 study; Spain, 3 studies; Sweden, 3 studies; Netherlands, 4 studies; UK, 2 studies). One study in the Netherlands included a mixed population of South‐Asian Surinamese participants, African Surinamese participants and "Ethnic Dutch" participants (Admiraal 2014).
Fifty‐eight studies contributed most of the data (Appendix 4).
Measurements of overall prognosis of people with IH and of the prognostic factor IH versus normoglycaemia
Of the 103 included studies, 17 evaluated the overall prognosis of people with IH for the development of type 2 diabetes mellitus without a normoglycaemic comparison group. Of these studies, six recruited participants with IFG at baseline (Baena‐Diez 2011; Gautier 2010; Lecomte 2007; Leiva 2014; Levitzky 2008; Sharifi 2013), six recruited participants with IGT at baseline (Kleber 2010; Kleber 2011; Ko 1999; Marshall 1994; Rajala 2000; Ramachandran 1986), two recruited a mixed IFG/IGT cohort (Rasmussen 2008; Toshihiro 2008), and three recruited participants with various definitions of IH (Kim 2014; Lee 2016; Song 2016a). In addition, 76 studies with a normoglycaemic comparison group contributed data to evaluate the overall prognosis of people with IH by means of cumulative incidence. Therefore, analysis of overall prognosis is based on 93 studies.
Fifty‐two studies assessed the prognostic effect of IH versus normoglycaemia for the development of type 2 diabetes mellitus and provided outcome measures as ratios (hazard ratio (HR), incidence rate ratio (IRR) and/or odds ratio (OR)). Forty‐seven studies explicitly defined normoglycaemia, often by a combination of FPG thresholds and two hour post‐load glucose thresholds (Anjana 2015; Baena‐Diez 2011; Bergman 2016; Chen 2003; Chen 2017; Coronado‐Malagon 2009; Den Biggelaar 2016; Derakhshan 2016; Dowse 1991; Forouhi 2007; Guerrero‐Romero 2006; Heianza 2012; Janghorbani 2015; Jaruratanasirikul 2016; Kim 2005; Ko 1999; Ko 2001; Larsson 2000; Lecomte 2007; Leiva 2014; Li 2003; Ligthart 2016; Lipska 2013; Liu 2014; Liu 2017; Lyssenko 2005; Magliano 2008; Man 2017; Meigs 2003; Motala 2003; Motta 2010; Mykkänen 1993; Nakanishi 2004; Peterson 2017; Qian 2012; Rajala 2000; Rathmann 2009; Rijkelijkhuizen 2007; Sasaki 1982; Soriguer 2008; Toshihiro 2008; Vaccaro 1999; Valdes 2008; Viswanathan 2007; Wang 2011; Wat 2001; Weiss 2005; Yeboah 2011). In the remaining studies, it was evident that normoglycaemia reflected the population with neither IH nor T2DM at baseline.
IH was commonly defined by the IFG5.6 threshold (FPG level 5.6 mmol/L to 6.9 mmol/L or 100 mg/dL to 125 mg/dL), IFG6.1threshold (FPG level 6.1 mmol/L to 6.9 mmol/L or 110 mg/dL to 125 mg/dL), IGT (plasma glucose concentration 7.8 mmol/L to 11.1 mmol/L or 140 mg/dL to 199 mg/dL two hours after a 75 g glucose load on the OGTT), or combinations of these criteria (Appendix 5; Appendix 6). Sixty‐six studies used an OGTT at baseline as part of the strategy to assess glycaemic status, and 46 studies used OGTT at baseline and follow‐up (Appendix 5).
Twelve studies defined IH by applying the HbA1c5.7 threshold (HbA1c 5.7% to 6.4% or 39 mmol/mol to 46 mmol/mol) (Bae 2011; Cederberg 2010; Han 2017; Heianza 2012; Kim 2014; Kim 2016a; Lee 2016; Lipska 2013; Man 2017; Nakagami 2016; Vijayakumar 2017; Warren 2017), and 10 studies used the HbA1c6.0 threshold (HbA1c 6.0% to 6.4% or 42 mmol/mol to 46 mmol/mol) (Bae 2011; Bonora 2011; Chamnan 2011; Han 2017; Heianza 2012; Kim 2016a; Nakagami 2016; Sato 2009; Wang 2011; Warren 2017).
Overview of study populations
Sixty‐nine studies (67%) started recruitment after 1990 (see Characteristics of included studies), and overall follow‐up ranged from 1 year in Bai 1999,Coronado‐Malagon 2009 and Kleber 2010 to 24 years in Bergman 2016 (see Characteristics of included studies; Appendix 7).
Depending on the phase of the study, the number of participants differed. The first phase of every study often constituted a large epidemiological investigation of, for example, the importance of various risk factors for cardiovascular health; in total, more than 250,000 participants began the studies (Appendix 8). The number of participants with IH depended on how the studies defined this condition at baseline and the way they measured the development of T2DM.
The overall prognosis of participants with IH at baseline and across all follow‐up times (1 to 20 years) was based on the following data (Table 1).
| Follow‐up time (years) | % (95% CI) cumulative T2DM incidence | % (95% CI) regression from IH to normoglycaemia | ||||||
| IFG5.6 | IFG6.1 | IGT | IFG + IGT | HbA1c5.7 | HbA1c6.0 | |||
| 1 | — | — | 13 (5–23) [3; 671] | 29 (23–36) [1; 207] | — | — | 59 (54–64) [2; 375] | |
| 2 | 2 (1–2) [1; 1335] | 11 (8–14) [2; 549] | 16 (9–26) [9; 1998] | — | — | — | 46 (36–55) [9; 2852] | |
| 3 | 17 (6–32) [3; 1091] | 9 (2–20) [3; 927] | 22 (18–27) [3; 417] | 34 (28–41) [1; 209] | — | 7 (5–10) [1; 370] | 41 (24–59) [7; 1356] | |
| 4 | 17 (13–22) [3; 800] | 30 (17–44) [2; 1567] | 22 (12–34) [5; 1042] | — | 14 (7–23) [3; 5352] | 44 (40–48) [2; 627] | 33 (26–40) [3; 807] | |
| 5 | 18 (10–27) [7; 3530] | 26 (19–33) [11; 3837] | 39 (25–53) [12; 3444] | 50 (37–63) [5; 478] | 25 (18–32) [4; 3524] | 38 (26–51) [3; 1462] | 34 (27–42) [9; 2603] | |
| 6 | 22 (15–31) [4; 738] | 37 (31–43) [5; 279] | 29 (25–34) [7; 775] | 58 (48–67) [4; 106] | 17 (14–20) [1; 675] | — | 23 (3–53) [5; 1328] | |
| 7 | 18 (8–30) [5; 980] | 15 (0–45) [4; 434] | 19 (13–26) [5; 835] | 32 (20–45) [4; 753] | 21 (16–27) [1; 207] | — | 41 (37–45) [4; 679] | |
| 8 | 34 (27–40) [2; 1887] | 48 (31–66) [1;29] | 43 (37–49) [4; 1021] | 52 (47–57) [1; 356] | — | — | 39 (33–44) [2; 328] | |
| 9 | 38 (10–70) [3; 1356] | — | 53 (45–60) [1; 163] | 84 (74–91) [1; 69] | — | — | 17 (14–22) [1; 299] | |
| 10 | 23 (14–33) [6; 1542] | 29 (17–43) [6; 537] | 26 (17–37) [6; 443] | 30 (17–44) [2; 49] | 31 (29–33) [2; 2854] | — | 42 (22–63) [7; 894] | |
| 11 | — | 38 (33–43) [1; 402] | 46 (43–49) [1; 1253] | — | — | — | 28 (17–39) [2; 736] | |
| 12 | 31 (19–34) [3; 433] | 31 (28–33) [1; 1382] | 41 (38–43) [2; 1552] | 70 (63–76) [2; 207] | — | — | — | |
| 15 | — | — | — | — | — | 29 (19–40) [1; 70] | — | |
| 20 | — | — | 60 (5–68) [1; 114] | — | — | — | — | |
CI: confidence interval; HbA1c: glycosylated haemoglobin A1c; HbA1c5.7/6.0 (threshold 5.7% or 6.0%); IFG5.6/6.1 : impaired fasting glucose (threshold 5.6 mmol/L or 6.1 mmol/L); IGT: impaired glucose tolerance; IFG + IGT: both IFG and IGT; IH: intermediate hyperglycaemia; T2DM: type 2 diabetes mellitus
-
IFG5.6: 13,692 participants.
-
IFG6.1: 9943 participants.
-
IGT: 13,728 participants.
-
Both IFG and IGT: 2434 participants.
-
HbA1c5.7: 9758 participants.
-
HbA1c6.0: 2529 participants.
Follow‐up time across all measures of IH at baseline had the following number of participants per year of follow‐up (in parentheses, number of people with IH who regressed to normoglycaemia); see Table 1.
-
1 year: 878 (375) participants.
-
2 years: 3882 (2852) participants.
-
3 years: 3014 (1356) participants.
-
4 years: 9388 (807) participants.
-
5 years: 16,275 (2603) participants.
-
6 years: 2573 (1328) participants.
-
7 years: 3209 (679) participants.
-
8 years: 3293 (328) participants.
-
9 years: 1588 (299) participants.
-
10 years: 5425 (894) participants.
-
11 years: 1655 (736) participants.
-
12 years: 3574 (no data) participants.
-
15 years: 70 (no data) participants.
-
20 years: 114 (no data) participants.
Data on the prognostic factor IH versus normoglycaemia for the development of T2DM were based on the following number of participants with IH at baseline (Table 2). Data were reported by ratio measures (HR, IRR, OR).
| Ratio (95% CI) [no of studies; no of participants with IH/no of participants with normoglycaemia] | |||||||
| Hazard ratio | |||||||
| Region | IFG5.6 cohort | IFG6.1 cohort | IGT cohort | IFG + IGT cohort | HbA1c5.7 cohort | HbA1c6.0 cohort | HbA1c5.7 + IFG5.6 cohort |
| Asia/Middle East | 5.07 (3.41‐7.53) 1.07–24.02 [4; 2385/12,837] | 10.55 (3.61–30.81) NAb [5; 1054/9756] | 4.48 (2.81–7.15) NAb [3; 1780/6695] | 10.20 (5.45–19.09) NAb [3; 461/6695] | 7.21 (5.14–10.11) 0.81–64.52 [3; 3196/13,609] | 13.12 (4.10–41.96) NAb [4; 3492/19,242] | 32.50 (23.00–45.92)c NAa [1; 410/4149] |
| Australia/Europe/North America | 4.15 (1.24–13.87) NAb [3; 5685/12,837] | 3.30 (2.32–4.67) 0.84–12.99 [4; 1736/8835] | 2.53 (1.52–4.19) NAa [2; 2230/5871] | 3.80 (2.30–6.28) NAa [1; 221/1429] | 2.71 (2.48–2.96) NAa [1: 2027/6215] | 5.09 (1.69–15.37) NAa [2; 1040/6925] | — |
| Latin America | — | 2.06 (1.76–2.41) NAb | — | — | — | — | — |
| American Indians/Islands | 2.38 (1.85–3.06) NAa [1; 947/595] | — | — | 4.06 (3.05–5.40) NAa [1; 356/595] | — | — | — |
| Overall | 4.32 (2.61–7.12) 0.75–25.01 [8; 9017/25,850] | 5.47 (3.50–8.54) 1.09–27.56 [9; 2818/18,591] | 3.61 (2.31–5.64) 0.69–18.97 [5; 4010/12,566] | 6.90 (4.15–11.45) 1.06–44.95 [5; 1038/8719] | 5.55 (2.77–11.12) 0.23–141.18 [4; 5223/19,824] | 10.10 (3.59–28.43) NAb [6; 4532/26,167] | 32.50 (23.00–45.92) NAa [1; 410/4149] |
| Incidence rate ratio | |||||||
| Region | IFG5.6 cohort | IFG6.1 cohort | IGT cohort | IFG + IGT cohort | HbA1c5.7 cohort | HbA1c6.0 cohort | HbA1c5.7 + IFG5.6 cohort |
| Asia/Middle East | 5.23 (3.77–7.25) 1.72–15.89 [6; 15,661/145,597] | 3.62 (1.67–7.83) NAa [2; 1677/36,334] | 3.93 (3.03–5.10) 1.71–9.02 [5; 14,809/73,128] | 11.20 (5.59–22.43) NAb [4; 3166/69,463] | 6.62 (4.18–10.49) NAa [1; 1965/19961] | — | 40.72 (29.30–56.61) NAa [1; 1641/19,961] |
| Australia/Europe/North America | 4.96 (3.25–7.57) 0.32–77.24 [3; 6322/8062] | 8.55 (6.37–11.48) 4.37–16.73 [4; 3438/20,246] | 5.93 (4.11–8.57) 2.38–14.81 [5; 2572/22,329] | 13.92 (9.99–19.40) 6.71–28.85 [4; 699/18,966] | — | — | — |
| Latin America | — | — | — | — | — | — | — |
| American Indians/Islands | 2.74 (1.88–3.99) NAa [1; 2374/1613] | — | 4.46 (3.12–6.38) NAa [2; 1087/2952] | 5.18 (3.42–7.83) NAa [1; 605/1613] | — | — | — |
| Overall | 4.81 (3.67–6.30) 1.95–11.83 [10; 24,357/155,272] | 6.82 (4.53–10.25) 2.03–22.87 [6; 5115/56,580] | 4.48 (3.69–5.44) 2.60–7.70 [12; 18,468/98,409] | 10.94 (7.22–16.58) 2.58–46.46 [9; 4470/90,072] | 6.62 (4.18–10.5) NAa [1; 1965/19961] | — | 40.72 (29.30–56.61) NAa [1; 1641/19,961] |
| Odds ratio | |||||||
| IFG5.6 cohort | IFG6.1 cohort | IGT cohort | IFG + IGT cohort | HbA1c5.7 cohort | HbA1c6.0 cohort | HbA1c5.7 + IFG5.6 cohort | |
| Asia/Middle East | 2.94 (1.77–4.86) 0.43–19.93 [10; 6359/28,218] | 5.18 (2.32–11.53) 0.29–91.37 [7; 3317/25,604] | 3.74 (2.83–4.94) 1.70–8.21 [6; 1226/7417] | 6.99 (3.09–15.83) NAb [3; 498/3704] | 4.54 (2.65–7.78) NAa [1; 675/462] | 23.20 (18.70–28.78) NAa [1; 1103/10,763] | 46.70 (33.60–64.91) NAa [1; 1951/10,761] |
| Australia/Europe/North America | 6.47 (3.81–11.00) 0.99–42.32 [9; 1949/7920] | 8.69 (4.95–15.24) 1.20–62.69 [7; 1240/5094] | 5.20 (3.62–7.45) 1.50–18.09 [11; 1481/7684] | 20.95 (12.40–35.40) 4.93–89.05 [6; 154/5300] | 4.38 (1.36–14.15) NAa [2; 231/2100] | 15.60 (6.90–35.27) NAa [1; 370/5365] | 26.20 (16.30–41.11) NAa [1; 169/1125] |
| Latin America | 4.28 (3.21–5.71) NAa [1; 65/1594] | 3.73 (2.18–6.38) NAa [1; 17/1594] | 4.94 (3.15–7.76) NAa [2; 381/3097] | — | — | — | — |
| American Indians/Islands | 3.12 (2.31–4.21) NAa [1; 947/595] | — | 3.60 (1.40–9.26) NAa [1; 51/215] | — | — | 5.89 (4.23–8.20) NAa [1; 121/595] | — |
| Overall | 4.15 (2.75–6.28) 0.54–32.00 [21; 9320/38,327] | 6.60 (4.18–10.43) 0.93–46.82 [15; 4574/32,292] | 4.61 (3.76–5.64) 2.10–10.13 [20; 3139/18,413] | 13.14 (7.41–23.30) 1.84–93.66 [9; 652/9004] | 4.43 (2.20–8.88) NAb [3; 906/2562] | 12.8 [4.56–35.9] NAb [3; 1594/16,723] | 35.91 (20.43–63.12) NAa [2; 2120/11,886] |
CI: confidence interval; HbA1c: glycosylated haemoglobin A1c; HbA1c5.7/6.0 (threshold 5.7% or 6.0%); HbA1c5.7 + IFG5.6 : both HbA1c5.7 and IFG5.6; IFG5.6/6.1 : impaired fasting glucose (threshold 5.6 mmol/L or 6.1 mmol/L); IGT: impaired glucose tolerance; IFG + IGT: both IFG and IGT; IH: intermediate hyperglycaemia; NA: not applicable; T2DM: type 2 diabetes mellitus; NR: not reported
aWith fewer than 3 studies a prediction interval could not be calculated
bCalculation of the 95% prediction interval did not provide a meaningful estimate
cCombination of HbA1c6.0 plus IFG5.6 at baseline showed a hazard ratio for T2DM development of 53.7 (95% CI 38.4–75.1)
-
IFG5.6: 42,694 participants.
-
IFG6.1: 12,507 participants.
-
IGT: 25,617 participants.
-
Both IFG and IGT: 6160 participants.
-
HbA1c5.7: 8094 participants.
-
HbA1c6.0: 6126 participants.
-
Both HbA1c5.7 and IFG5.6: 3761 participants.
The mean age of adult participants at baseline ranged from 30 years to 77 years (Appendix 9). In two studies all the participants were female (De Abreu 2015; Larsson 2000), and in eight studies all the participants were male (Charles 1997; Lecomte 2007; Nakanishi 2004; Park 2006; Sato 2009; Stengard 1992; Toshihiro 2008; Zethelius 2004). The body mass index (BMI) of the participants at baseline ranged from 23.2 kg/m2 to 39.1 kg/m2. A family history of diabetes was reported in 3% to 100% of the study participants.
At baseline, 60 studies (58%) reported diastolic and systolic blood pressure; 43 studies (22%), smoking status; 66 studies (64%), FPG; 24 studies (23%), HbA1c; 44 studies (43%), two‐hour glucose measurements; 7 studies (7%), medications; 26 studies (25%), comorbidities; 20 studies (19%), hypertension; and 5 studies (5%), dyslipidaemia (Appendix 10).
Categorisation of studies
In order to address the complexity of our dataset with regard to factors potentially influencing the definition, detection and development of T2DM, such as genetics, environmental and social conditions, the way risk factors and T2DM incidence were measured, and access to health care (Avilés‐Santa 2016; De Rekeneire 2007; Herman 2012; Likhari 2010; Maruthur 2011; Parrinello 2016) – with all of these features interacting to some degree – we choose to provide the reader with a broad overview mainly focusing on geographic regions in the following way.
Groups consisted of participants from studies taking place in Australia, Europe or North America; people from Latin America; individuals from Asia or the Middle East; and American (Pima) Indians and Pacific/Indian Ocean islanders ('American Indians/Islands' group). The logic of grouping participants in the last cohort together resided in the fact that they shared some characteristics relevant to T2DM, including a considerable genetic background risk, historic isolation from outside communities with substantial influence from Western diets, or both (Hanson 2014; Jowett 2009; Nair 2015; Serjeantson 1983).
For 41 studies, we categorised the origin of participants as 'Australia/Europe/North America' (Admiraal 2014; Baena‐Diez 2011; Bonora 2011; Cederberg 2010; Chamnan 2011; Charles 1997; Cugati 2007; De Abreu 2015; Den Biggelaar 2016; Filippatos 2016; Forouhi 2007; Gautier 2010; Hanley 2005; Kleber 2010; Kleber 2011; Larsson 2000; Lecomte 2007; Levitzky 2008; Ligthart 2016; Lipska 2013; Lyssenko 2005; Magliano 2008; Marshall 1994; McNeely 2003; Meigs 2003; Motta 2010; Mykkänen 1993; Peterson 2017; Rajala 2000; Rasmussen 2008; Rathmann 2009; Rijkelijkhuizen 2007; Schranz 1989; Soriguer 2008; Stengard 1992; Vaccaro 1999; Valdes 2008; Warren 2017; Weiss 2005; Yeboah 2011; Zethelius 2004).
For seven studies, we categorised the origin of participants as 'Latin America' (Coronado‐Malagon 2009; Ferrannini 2009; Garcia 2016; Gomez‐Arbelaez 2015; Guerrero‐Romero 2006; Leiva 2014; Lorenzo 2003). Although Garcia 2016 and Lorenzo 2003 took place in the USA, they included primarily Mexican Americans, hence the rationale for this categorisation.
We categorised 50 studies as 'Asia/Middle East' (Aekplakorn 2006; Ammari 1998; Anjana 2015; Bae 2011; Bai 1999; Bergman 2016; Chen 2003; Chen 2017; Derakhshan 2016; Han 2017; Heianza 2012; Inoue 1996; Janghorbani 2015; Jaruratanasirikul 2016; Jeong 2010; Jiamjarasrangsi 2008a; Kim 2005; Kim 2008; Kim 2014; Kim 2016a; Ko 1999; Ko 2001; Latifi 2016; Lee 2016; Li 2003; Liu 2008; Liu 2014; Liu 2016; Liu 2017; Man 2017; Mohan 2008; Motala 2003; Nakagami 2016; Nakanishi 2004; Noda 2010; Park 2006; Qian 2012; Ramachandran 1986; Sadeghi 2015; Sasaki 1982; Sato 2009; Sharifi 2013; Shin 1997; Song 2015; Song 2016a; Toshihiro 2008; Viswanathan 2007; Wang 2007; Wat 2001; Wong 2003). Of these, 37 studies recruited participants from China, Japan, South Korea, Singapore, Taiwan and Thailand (Aekplakorn 2006; Bae 2011; Chen 2003; Chen 2017; Han 2017; Heianza 2012; Inoue 1996; Jaruratanasirikul 2016; Jeong 2010; Jiamjarasrangsi 2008a; Kim 2005; Kim 2008; Kim 2014; Kim 2016a; Ko 1999; Ko 2001; Lee 2016; Li 2003; Liu 2008; Liu 2014; Liu 2016; Liu 2017; Man 2017; Nakagami 2016; Nakanishi 2004; Noda 2010; Park 2006; Qian 2012; Sasaki 1982; Sato 2009; Shin 1997; Song 2015; Song 2016a; Toshihiro 2008; Wang 2007; Wat 2001; Wong 2003), 5 studies recruited participants from India (Anjana 2015; Bai 1999; Mohan 2008; Ramachandran 1986; Viswanathan 2007), 1 study involved Indian‐South African participants (Motala 2003), and 7 studies recruited participants from Iran, Israel and Jordan (Ammari 1998; Bergman 2016; Derakhshan 2016; Janghorbani 2015; Latifi 2016; Sadeghi 2015; Sharifi 2013).
We categorised the origin of participants as 'American Indians/Islands' in five studies. Three of the five studies had American Indians as participants (Vijayakumar 2017; Wang 2011; Wheelock 2016), one included Mauritians (Söderberg 2004), and the remaining study included Nauruans (Dowse 1991).
Six studies included black participants (Admiraal 2014; Bergman 2016; Hanley 2005; Söderberg 2004; Warren 2017; Yeboah 2011), representing 25% to 47% of all participants in these studies.
Six studies included children, adolescents or both as participants (Jaruratanasirikul 2016; Kleber 2010; Kleber 2011; Vijayakumar 2017; Weiss 2005; Wheelock 2016).
Measurement of the development of T2DM
Almost all studies combined criteria to define incident T2DM, using indicators such as FPG of 7.0 mmol/L or more, two‐hour postload glucose level of 11.1 mmol/L or more, HbA1c of 6.5% or more, receipt of antidiabetic medication, physician diagnosis or self‐report.
Of the 103 included studies, 64 included FPG of 7.0 mmol/L or more, and 52, two‐hour postload glucose level of 11.1 mmol/L or more, in their definition of incident T2DM. Eighteen studies used HbA1c as part of the definition of T2DM, typically an HbA1c level of 6.5% or more. One study defined T2DM incidence based only on an HbA1c level of 6.5% or more (Lee 2016). In 34 studies, antidiabetic treatment comprised part of the definition of T2DM, and in 15 studies physician diagnosis or self‐report was part of the T2DM incidence definition.
Risk of bias in included studies
For details on the QUIPS tool and the risk of bias of the included studies see Appendix 3 and Characteristics of included studies. The results are summarised below separately for studies that provided data on overall prognosis for people with IH and on IH versus normoglycaemia as a prognostic factor.
a) Overall prognosis of people with IH for the development of T2DM and b) regression from IH to normoglycaemia
There were 93 studies providing data on cumulative incidence. Figure 2 summarises the risk of bias results across all studies, while the results for each study are shown in Figure 3 and Figure 4 (split into two figures because of the large number of studies). We evaluated the first four risk of bias domains (i.e. study participation, study attrition, glycaemic status measurement, outcome measurement) of the QUIPS tool.
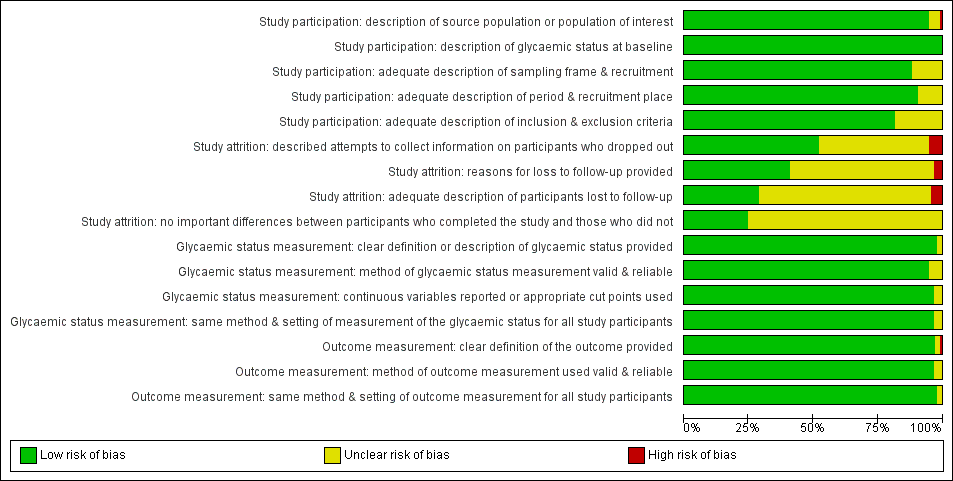
Risk of bias graph for studies of overall prognosis of people with intermediate hyperglycaemia for developing type 2 diabetes: review authors' judgements about each risk of bias item presented as percentages across all included studies
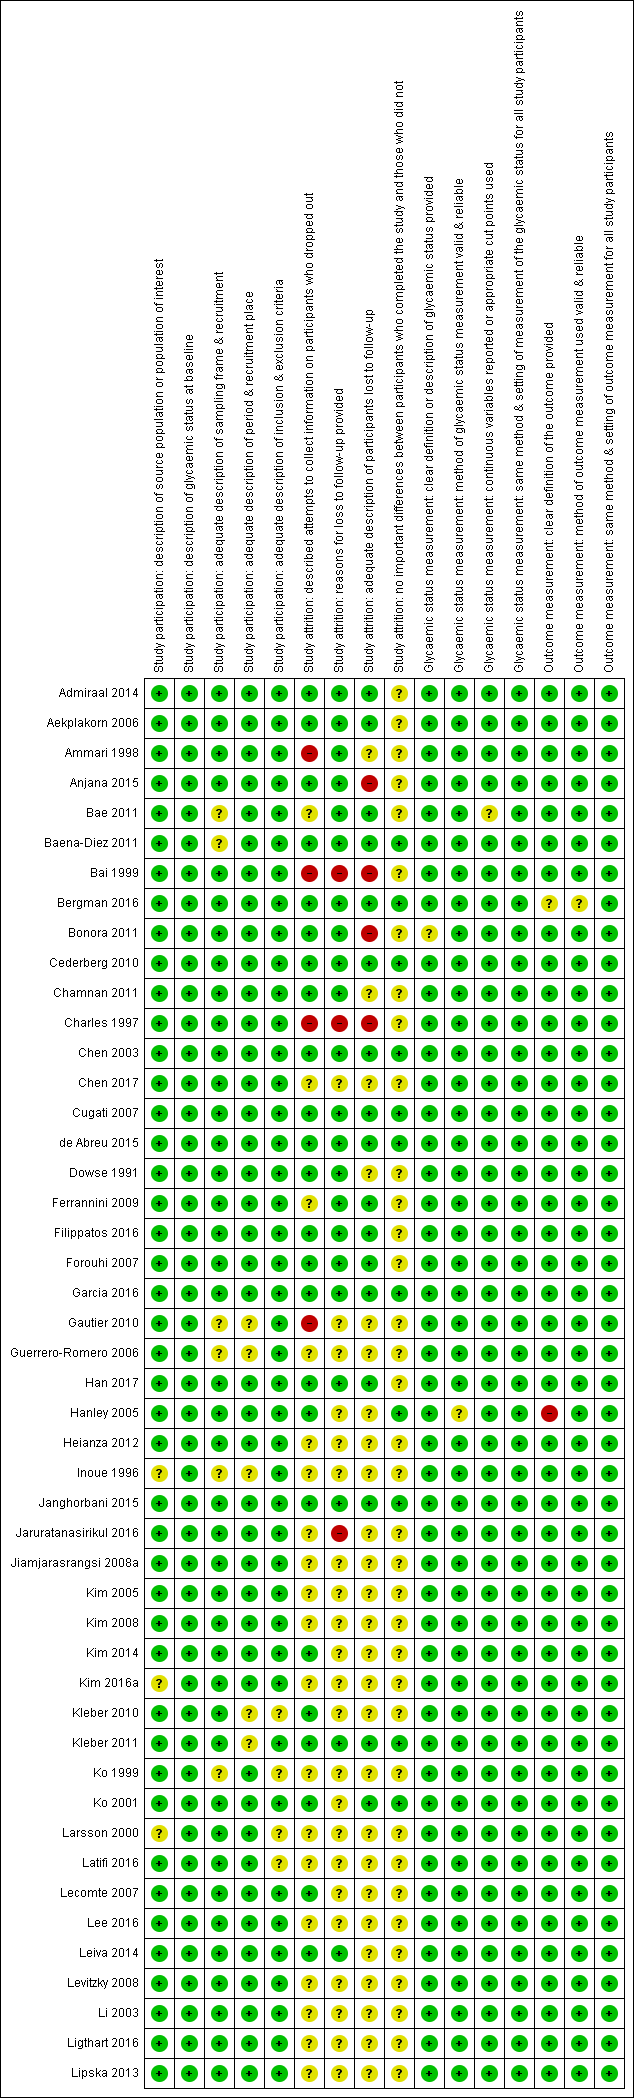
'Risk of bias' summary for studies of overall prognosis in people with intermediate hyperglycaemia for developing type 2 diabetes: review authors' judgements about each risk of bias item for each included study (part 1). The summary was split into part 1 (Figure 3) and part 2 (Figure 4) for better legibility
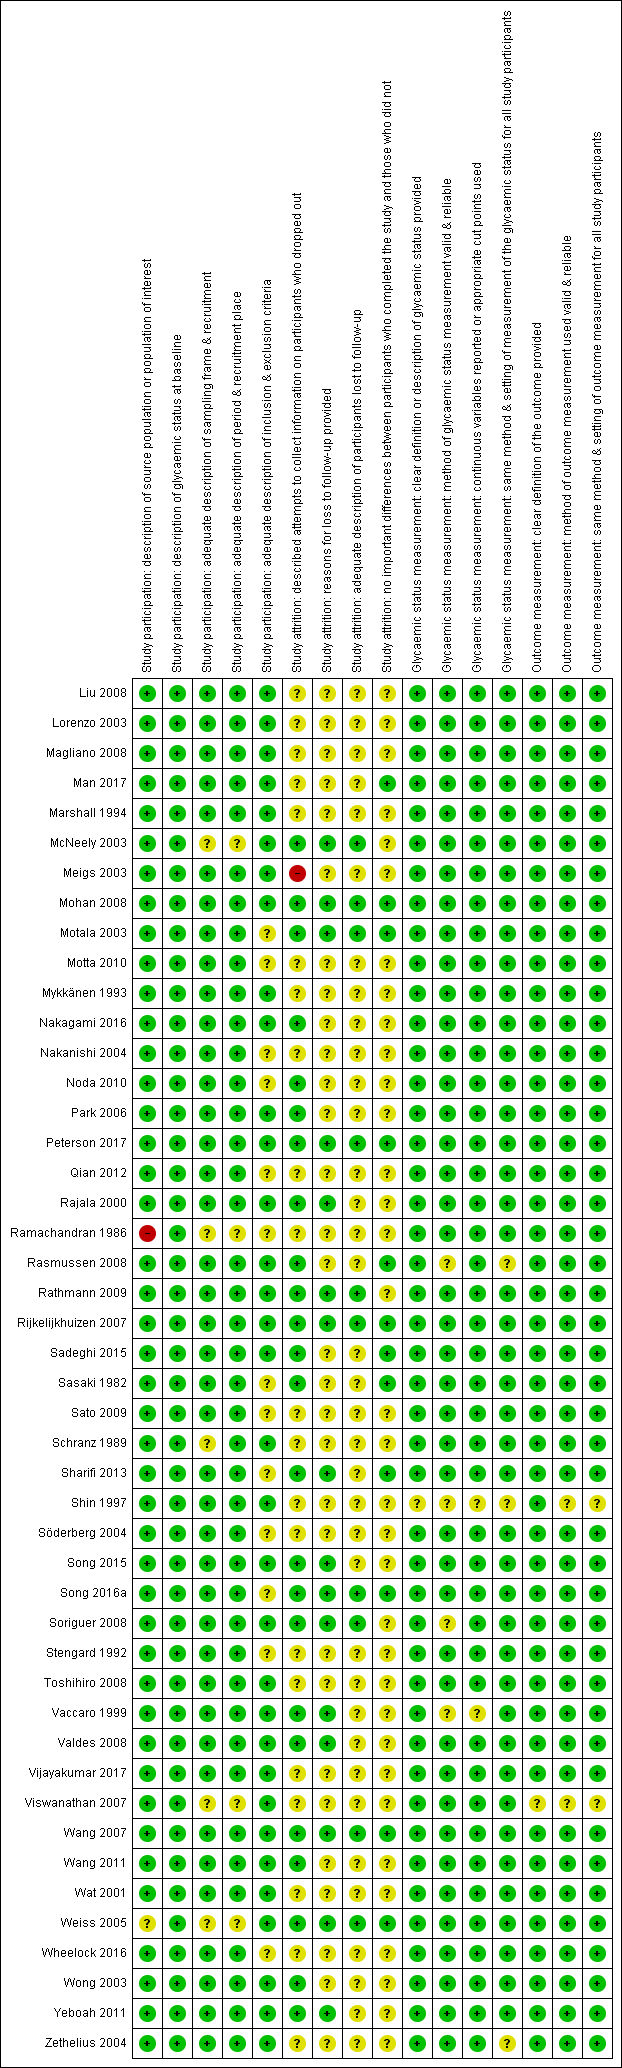
Risk of bias summary for studies of overall prognosis of people with intermediate hyperglycaemia for developing type 2 diabetes: review authors' judgements about each risk of bias item for each included study (part 2)
Study participation
Study authors described the five items in this domain sufficiently in most (65 studies; 70%) included studies. Eleven studies did not adequately characterise the sampling frame and/or recruitment procedures (Bae 2011; Baena‐Diez 2011; Gautier 2010; Guerrero‐Romero 2006; Inoue 1996; Ko 1999; McNeely 2003; Ramachandran 1986; Schranz 1989; Viswanathan 2007; Weiss 2005). One study was at high risk of bias for the item 'description of the source population or population of interest' (Ramachandran 1986).
Study attrition
Forty‐eight studies attempted to collect information on participants who were lost to follow‐up, while 40 studies were at unclear risk of bias and five studies were at high risk of bias (Ammari 1998; Bai 1999; Charles 1997; Gautier 2010; Meigs 2003).
In most (61 studies; 66%) of the studies we could not identify the reasons for loss to follow‐up or adequate descriptions of these participants. Five studies were at high risk of bias for one or both of the items (Anjana 2015; Bai 1999; Bonora 2011; Charles 1997; Jaruratanasirikul 2016).
Only 23 studies (25%) provided information on potentially important differences between participants who completed the studies and those who did not.
Glycaemic status measurement
Study authors described these items sufficiently in 85 studies (91%). One study did not describe three of the four items ('clear definition of the outcome provided', 'adequately valid and reliable method of measurement', and 'continuous variables reported or appropriate cut points used') in enough detail (Shin 1997).
Outcome measurement
Study authors described the three items sufficiently in 89 studies (96%). One study was at high risk of bias for the item 'provision of clear definition of the outcome' (Hanley 2005).
c) Development of T2DM in people with IH as compared to people with normoglycaemia
There were 52 studies comparing IH with normoglycaemia as a prognostic factor for T2DM. Figure 5 shows the results for the six domains summarised across studies, and the result for each study is shown in Figure 6.

Risk of bias graph for studies of intermediate hyperglycaemia versus normoglycaemia as a prognostic factor for developing type 2 diabetes: review authors' judgements about each risk of bias item presented as percentages across all included studies

Risk of bias summary for studies of intermediate hyperglycaemia versus normoglycaemia as a prognostic factor for developing type 2 diabetes: review authors' judgements about each risk of bias item for each included study
Fourteen studies provided data on multivariable HRs of T2DM incidence, adjusted for 2 to 13 covariates (Bae 2011; Bonora 2011; Forouhi 2007; Han 2017; Heianza 2012; Janghorbani 2015; Kim 2005; Li 2003; Liu 2016; Lyssenko 2005; Nakagami 2016; Wang 2011; Warren 2017; Yeboah 2011). Whenever possible, we used the reported model with the greatest number of covariates.
Study participation
Study authors described the items of this domain sufficiently in most (42 studies; 82%) of the included studies. Two studies did not adequately characterise the sampling frame and/or recruitment procedures (Bae 2011; Viswanathan 2007).
Study attrition
Study authors usually described these items sufficiently and attempted to collect information on participants who were lost to follow‐up. However, in most (32 studies; 63%) of the included studies we could not identify the reasons for losses to follow‐up or adequate descriptions of these participants. Only 10 studies (20%) provided information on potentially important differences between participants who completed the studies and those who did not. Two studies were at high risk of bias on one of the four items (Bonora 2011; Jeong 2010).
Glycaemic status measurement
Study authors described the items sufficiently in 40 (78%) studies.
Outcome measurement
Study authors described these items sufficiently in 46 studies (90%). One study had a high risk of bias for the item 'clear definition of the outcome provided' (Hanley 2005).
Study confounding
Only one study described all items sufficiently (Derakhshan 2016).
It was difficult to judge study confounding because the number of important covariates measured was limited. If studies analysed data by means of multivariable regression models, they often adjusted these analyses taking into account several covariates: age (43 out of 52 studies), anthropometric measures such as BMI (33 out of 52 studies), sex (31 out of 52 studies), family history of diabetes (24 out of 52 studies), smoking status (24 out of 52 studies), blood pressure/hypertension (19 out of 52 studies), triglycerides (18 out of 52 studies), cholesterol (17 out of 52 studies), physical activity (14 out of 52 studies), drinking status (12 out of 52 studies), socioeconomic status (8 out of 52 studies), 'ethnicity' (5 out 52 studies), medications (3 out of 52 studies) and renal function (1 study); for details see Appendix 16 and Appendix 17.
Twenty studies (39%) adjusted their analyses for age, sex and anthropometric measures (e.g. BMI or waist circumference) (Admiraal 2014; Bergman 2016; Bonora 2011; Chamnan 2011; Chen 2003; Derakhshan 2016; Forouhi 2007; Han 2017; Heianza 2012; Janghorbani 2015; Kim 2005; Kim 2016a; Li 2003; Man 2017; Sadeghi 2015; Soriguer 2008; Valdes 2008; Wang 2011; Warren 2017; Yeboah 2011). Six studies (12%) adjusted for age, sex, anthropometric measures and physical activity (Bonora 2011; Derakhshan 2016; Forouhi 2007; Han 2017; Kim 2016a; Yeboah 2011), and five studies (10%) also included smoking status (Bonora 2011; Derakhshan 2016; Forouhi 2007; Han 2017; Kim 2016a). When used, covariates were usually clearly defined and measured. However, only two studies reported an imputation method for missing confounders (Derakhshan 2016; Sadeghi 2015).
Statistical analysis and reporting
Study authors addressed this domain sufficiently in 44 studies (86%).
Development of T2DM in people with IH
In the following we report the results of the analyses for the overall prognosis of people with IH as well as regression from IH to normoglycaemia, and the effects of glycaemic status (IH versus normoglycaemia) as a prognostic factor for T2DM.
Definition of IH at baseline
Studies defined IH as follows.
-
IFG5.6 threshold, usually defined as a fasting plasma glucose level of 5.6 mmol/L to 6.9 mmol/L.
-
IFG6.1 threshold, usually defined as a fasting plasma glucose level of 6.1 mmol/L to 6.9 mmol/L.
-
IGT, usually defined as a plasma glucose level of 7.8 mmol/L to 11.1 mmol/L two hours after a 75 g OGTT.
-
Isolated IFG was defined as IFG5.6 or IFG6.1 alone, without IGT, and isolated IGT was defined as IGT alone, without IFG5.6 or IFG6.1.
-
HbA1c5.7 threshold, usually defined as HbA1c measurement of 5.7% to 6.4%.
-
HbA1c6.0 threshold, usually defined as HbA1c measurement of 6.0% to 6.4%.
Depending on how investigators measured IH, the following number of study cohorts provided information on T2DM incidence associated with glycaemic status at baseline (one study might have investigated several associations between glycaemic status and T2DM incidence within the same study, for example, one cohort with IFG5.6, another cohort with IFG6.1 and a third cohort with IGT).
-
IFG5.6/isolated IFG5.6: 27/10 study cohorts.
-
IFG6.1/isolated IFG6.1: 22/9 study cohorts.
-
IGT/isolated IGT: 39/18 study cohorts.
-
Combined IFG and IGT: 15 study cohorts.
-
HbA1c5.7: 7 study cohorts.
-
HbA1c6.0: 10 study cohorts.
-
Combined HbA1c5.7 and IFG5.6: 3 study cohorts.
a) Overall prognosis of people with IH for developing T2DM
Irrespective of the definition of IH at baseline, the cumulative incidence of T2DM seemed to increase with length of follow‐up, though there was no obvious linear trend. There was no clear pattern of differences between geographic regions.
IH defined by IFG5.6 mmol/L threshold
Diabetes incidence associated with IFG5.6 at baseline and follow‐up periods from 2 to 12 years showed pooled cumulative incidences of 2% to 38% (Figure 7; Figure 8).

Impaired fasting glucose 5.6 mmol/L (IFG5.6) threshold: association with cumulative type 2 diabetes mellitus (T2DM) incidence over 2–5 years
*Isolated IFG5.6
CI: confidence interval; M: men; n/N: events/number of participants; W: women

Impaired fasting glucose 5.6 mmol/L (IFG5.6) threshold: association with cumulative type 2 diabetes mellitus (T2DM) incidence over 6–12 years
*Isolated IFG5.6
**'Africa': African Surinamese cohort, 'Asia': Asian Surinamese cohort, 'Australia/Europe/North America': 'ethnic Dutch' cohort.
CI: confidence interval; M: men; n/N: events/number of participants; W: women
The number of studies and participants, and the cumulative incidence of T2DM (pooled if more than one study) according to follow‐up period were as follows.
-
2 years' follow‐up: 1 study, 1335 participants, cumulative incidence 2% (95% confidence interval (CI) 1 to 2).
-
3 years' follow‐up: 3 studies, 1091 participants, cumulative incidence 17% (95% CI 6 to 32).
-
4 years' follow‐up: 3 studies, 800 participants, cumulative incidence 17% (95% CI 13 to 22).
-
5 years' follow‐up: 7 studies, 3530 participants, cumulative incidence 18% (95% CI 10 to 27).
-
6 years' follow‐up: 4 studies, 783 participants, cumulative incidence 22% (95% CI 15 to 31).
-
7 years' follow‐up: 5 studies, 980 participants, cumulative incidence 18% (95% CI 8 to 30).
-
8 years' follow‐up: 2 studies, 1887 participants, cumulative incidence 34% (95% CI 27 to 40).
-
9 years' follow‐up: 3 studies, 1356 participants, cumulative incidence 38% (95% CI 10 to 70).
-
10 years' follow‐up: 6 studies, 1542 participants, cumulative incidence 23% (95% CI 14 to 33).
-
12 years' follow‐up: 3 studies, 433 participants, cumulative incidence 31% (95% CI 19 to 34).
IH defined by IFG6.1 mmol/L threshold
Diabetes incidence, as associated with IFG6.1 at baseline and a follow‐up period of 2 to 15 years, showed pooled cumulative incidences of 9% to 48% (Figure 9; Figure 10).

Impaired fasting glucose 6.1 mmol/L (IFG6.1) threshold: association with cumulative type 2 diabetes mellitus (T2DM) incidence over 2–5 years
*Isolated IFG6.1
CI: confidence interval; M: men; n/N: events/number of participants; W: women

Impaired fasting glucose 6.1 mmol/L (IFG6.1) threshold: association with cumulative type 2 diabetes mellitus (T2DM) incidence over 6–15 years
*Isolated IFG6.1
CI: confidence interval; n/N: events/number of participants
The number of studies and participants, and the cumulative incidence of T2DM (pooled if more than one study) according to follow‐up period were as follows.
-
2 years' follow‐up: 2 studies, 549 participants, cumulative incidence 11% (95% CI 8 to 14).
-
3 years' follow‐up: 3 studies, 927 participants, cumulative incidence 9% (95% CI 2 to 20).
-
4 years' follow‐up: 2 studies, 1567 participants, cumulative incidence 30% (95% CI 17 to 44).
-
5 years' follow‐up: 11 studies, 3837 participants, cumulative incidence 26% (95% CI 19 to 33).
-
6 years' follow‐up: 5 studies, 279 participants, cumulative incidence 37% (95% CI 31 to 43).
-
7 years' follow‐up: 4 studies, 434 participants, cumulative incidence 15% (95% CI 0 to 45).
-
8 years' follow‐up: 1 study, 29 participants, cumulative incidence 48% (95% CI 31 to 66).
-
10 years' follow‐up: 6 studies, 537 participants, cumulative incidence 29% (95% CI 17 to 43).
-
11 years' follow‐up: 1 study, 402 participants, cumulative incidence 38% (95% CI 33 to 43).
-
15 years' follow‐up: 1 study, 1382 participants, cumulative incidence 31% (95% CI 28 to 33).
IH defined by IGT
Diabetes incidence associated with IGT at baseline showed pooled cumulative incidences of 13% to 60% after a follow‐up period of 1 to 20 years (Figure 11; Figure 12).
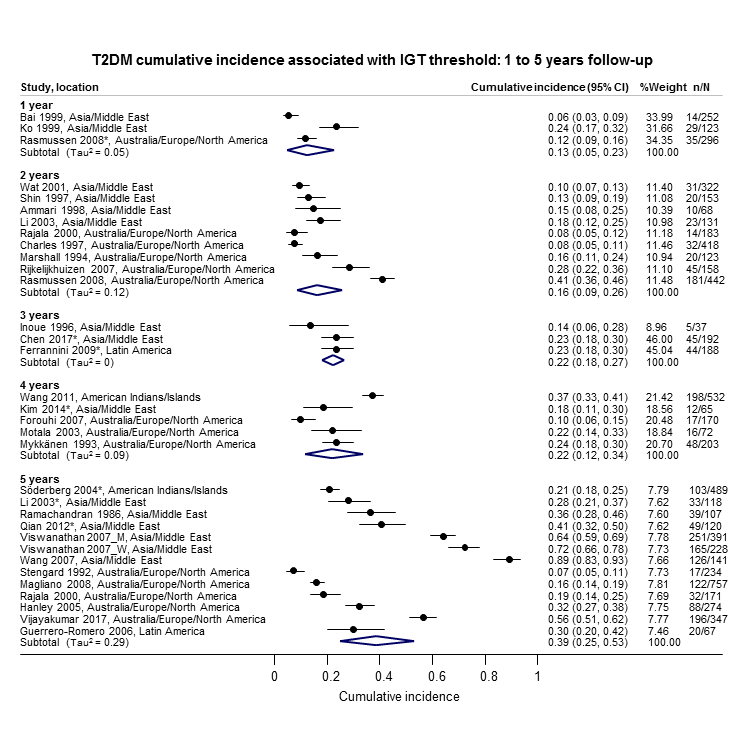
Impaired glucose tolerance (IGT): association with cumulative type 2 diabetes mellitus (T2DM) incidence over 1–5 years
*Isolated IGT
CI: confidence interval; n/N: events/number of participants

Impaired glucose tolerance (IGT): association with cumulative type 2 diabetes mellitus (T2DM) incidence over 6–20 years
*Isolated IGT
CI: confidence interval; M: men; n/N: events/number of participants; W: women
The number of studies and participants, and the cumulative incidence of T2DM (pooled if more than one study) according to follow‐up period were as follows.
-
1 year's follow‐up: 3 studies, 671 participants, cumulative incidence 13% (95% CI 5 to 23).
-
2 years' follow‐up: 9 studies, 1998 participants, cumulative incidence 16% (95% CI 9 to 26).
-
3 years' follow‐up: 3 studies, 417 participants, cumulative incidence 22% (95% CI 18 to 27).
-
4 years' follow‐up: 5 studies, 1042 participants, cumulative incidence 22% (95% CI 12 to 34).
-
5 years' follow‐up: 12 studies, 3444 participants, cumulative incidence 39% (95% CI 25 to 53).
-
6 years' follow‐up: 7 studies, 775 participants, cumulative incidence 29% (95% CI 25 to 34).
-
7 years' follow‐up: 5 studies, 835 participants, cumulative incidence 19% (95% CI 13 to 26).
-
8 years' follow‐up: 4 studies, 1021 participants, cumulative incidence 43% (95% CI 37 to 49).
-
9 years' follow‐up: 1 study, 163 participants, cumulative incidence 53% (95% CI 45 to 60).
-
10 years' follow‐up: 6 studies, 443 participants, cumulative incidence 26% (95% CI 17 to 37).
-
11 years' follow‐up: 1 study, 1253 participants, cumulative incidence 46% (95% CI 43 to 49).
-
12 years' follow‐up: 2 studies, 1552 participants, cumulative incidence 41% (95% CI 38 to 43).
-
20 years' follow‐up: 1 study, 114 participants, cumulative incidence 60% (95% CI 50 to 68).
IH defined by combined IFG and IGT
Diabetes incidence associated with the combination of both IFG and IGT at baseline showed pooled cumulative incidences of 29% to 84% at 1 to 12 years (Figure 13).

Combined impaired glucose tolerance (IGT) and impaired fasting glucose (IFG): association with cumulative type 2 diabetes mellitus (T2DM) incidence over 1–12 years
CI: confidence interval; M: men; n/N: events/number of participants; W: women
The number of studies and participants, and the cumulative incidence of T2DM (pooled if more than one study) according to follow‐up period were as follows.
-
1 year's follow‐up: 1 study, 207 participants, cumulative incidence 29% (95% CI 23 to 36).
-
3 years' follow‐up: 1 study, 209 participants, cumulative incidence 34% (95% CI 28 to 41).
-
5 years' follow‐up: 5 studies, 478 participants, cumulative incidence 50% (95% CI 37 to 63).
-
6 years' follow‐up: 4 studies, 106 participants, cumulative incidence 58% (95% CI 48 to 67).
-
7 years' follow‐up: 4 studies, 753 participants, cumulative incidence 32% (95% CI 20 to 45).
-
8 years' follow‐up: 1 study, 356 participants, cumulative incidence 52% (95% CI 47 to 57).
-
9 years' follow‐up: 1 study, 69 participants, cumulative incidence 84% (95% CI 74 to 91).
-
10 years' follow‐up: 2 studies, 49 participants, cumulative incidence 30% (95% CI 17 to 44).
-
12 years' follow‐up: 2 studies, 207 participants, cumulative incidence 70% (95% CI 63 to 76).
IH defined by HbA1c5.7 threshold
Diabetes incidence associated with HbA1c5.7 at baseline and a follow‐up period of 4 to 10 years showed pooled cumulative incidences of 14% to 31% (Figure 14).

Elevated glycosylated haemoglobin A1c (HbA1c) 5.7% threshold: association with cumulative type 2 diabetes mellitus (T2DM) incidence over 4–10 years
CI: confidence interval; n/N: events/number of participants
The number of studies and participants, and the cumulative incidence of T2DM (pooled if more than one study) according to follow‐up period were as follows.
-
4 years' follow‐up: 3 studies, 5352 participants, cumulative incidence 14% (95% CI 7 to 23).
-
5 years' follow‐up: 4 studies, 3524 participants, cumulative incidence 25% (95% CI 18 to 32).
-
6 years' follow‐up: 1 study, 675 participants, cumulative incidence 17% (95% CI 14 to 20).
-
7 years' follow‐up: 1 study, 207 participants, cumulative incidence 21% (95% CI 16 to 27).
-
10 years' follow‐up: 2 studies, 2854 participants, cumulative incidence 31% (95% CI 29 to 33).
IH defined by HbA1c6.0 threshold
Most studies were undertaken in Asia. Diabetes incidence associated with HbA1c6.0 at baseline and a follow‐up period of 3 to 15 years showed pooled cumulative incidences of 7% to 44% (Figure 15).
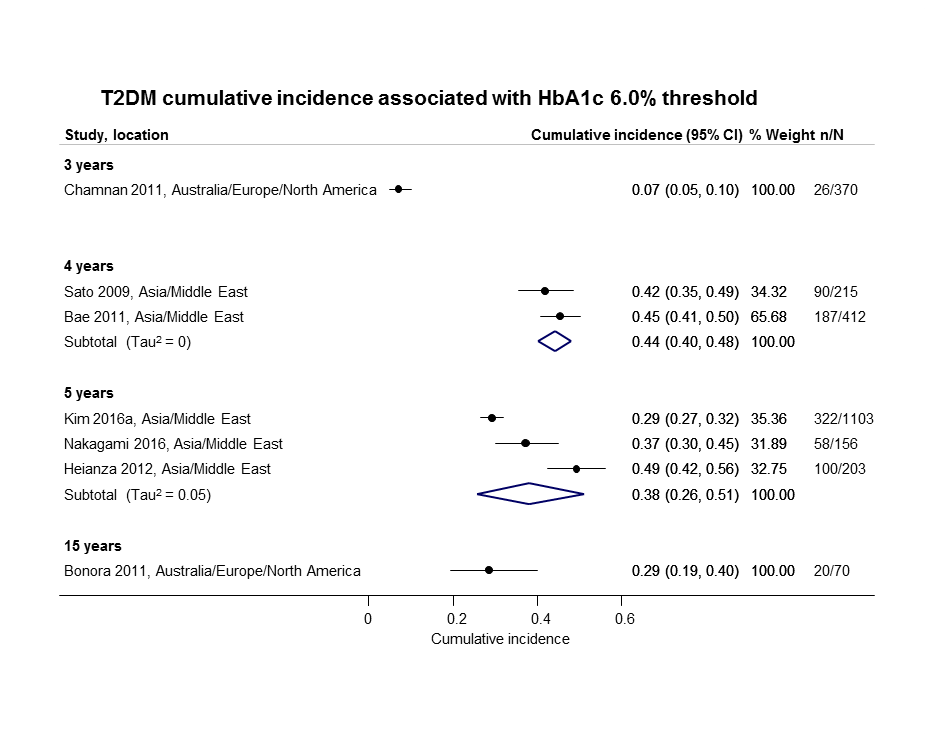
Elevated glycosylated haemoglobin A1c (HbA1c) 6.0% threshold: association with cumulative type 2 diabetes mellitus (T2DM) incidence over 3–15 years
CI: confidence interval; n/N: events/number of participants
The number of studies and participants, and the cumulative incidence of T2DM (pooled if more than one study) according to follow‐up period were as follows.
-
3 years' follow‐up: 1 study, 370 participants, cumulative incidence 7% (95% CI 5 to 10).
-
4 years' follow‐up: 2 studies, 627 participants, cumulative incidence 44% (95% CI 40 to 48).
-
5 years' follow‐up: 3 studies, 1462 participants, cumulative incidence 38% (95% CI 26 to 51).
-
15 years' follow‐up: 1 study, 70 participants, cumulative incidence 29% (95% CI 19 to 40).
Children and adolescents with IH (mostly IGT)
Diabetes incidence in children and adolescents, usually associated with IGT at baseline and with follow‐up of 1 to 10 years, showed pooled cumulative incidences of 1% to 56% (Figure 16). We did not observe any distinct pattern between T2DM incidence and geography.
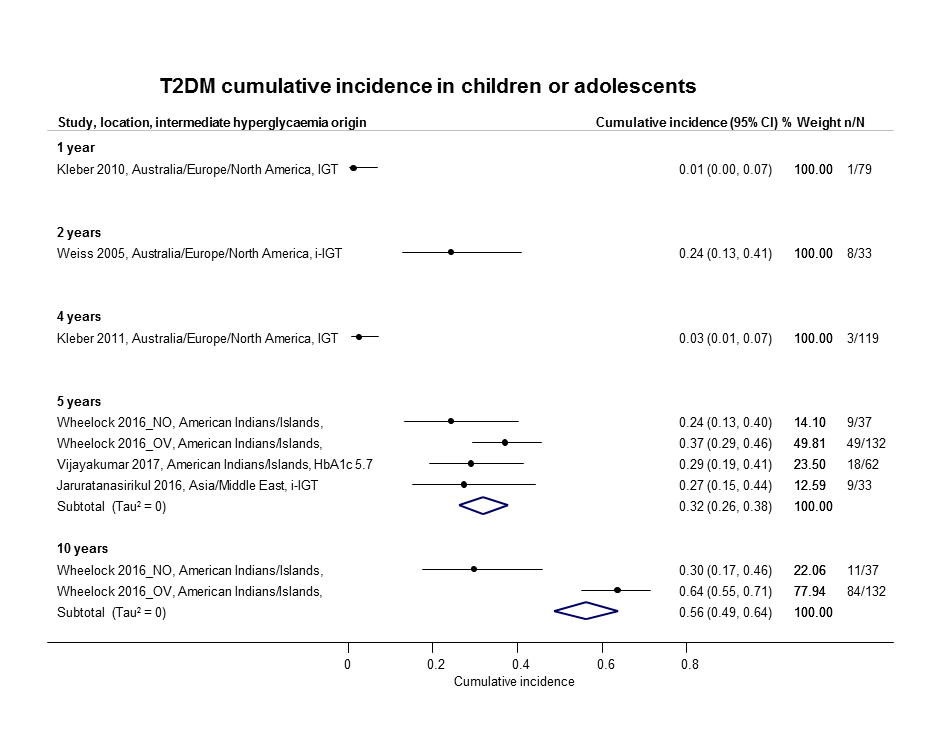
Cumulative type 2 diabetes mellitus (T2DM) incidence in children/adolescents over 1–10 years
CI: confidence interval; HbA1c 5.7: glycosylated haemoglobin A1c 5.7% threshold; (i‐)IGT: (isolated) impaired glucose tolerance; n/N: events/number of participants; NO: non‐overweight; OV: overweight
The number of studies and participants, and the cumulative incidence of T2DM (pooled if more than one study) according to follow‐up period were as follows.
-
1 year's follow‐up: 1 study, 79 participants, cumulative incidence 1% (95% CI 0 to 7).
-
2 years' follow‐up: 1 study, 33 participants, cumulative incidence 24% (95% CI 13 to 41).
-
4 years' follow‐up: 1 study, 119 participants, cumulative incidence 3% (95% CI 1 to 7).
-
5 years' follow‐up: 3 studies, 264 participants, pooled cumulative incidence 32% (95% CI 26 to 38).
-
10 years' follow‐up: 1 study (2 subpopulations), 169 participants, cumulative incidence 56% (95% CI 49 to 64).
Special populations with IH
Studies involving black populations were scarce: one study reported a cumulative T2DM incidence of 35% in African Surinamese after 10 years of follow‐up in association with IFG5.6 at baseline (Admiraal 2014). Another study, which used IFG5.6 at baseline, reported a T2DM cumulative incidence of 33% in African Americans after 7.5 years of follow‐up (Yeboah 2011).
b) Regression from IH to normoglycaemia
Adults
In the 47 studies reporting data on regression from IH to normoglycaemia in adults within a follow‐up period of 1 to 11 years, pooled percentages ranged from 17% to 59% (Figure 17; Figure 18). Regression to normoglycaemia varied widely and showed neither a clear linear reduction or increase nor a distinct pattern associated with geography. Regression rates were often reported in association with IGT at baseline; however, there were no distinct differences in regression rates when compared with IFG5.6, IFG6.1 or HbA1c5.7 as IH risk factors.
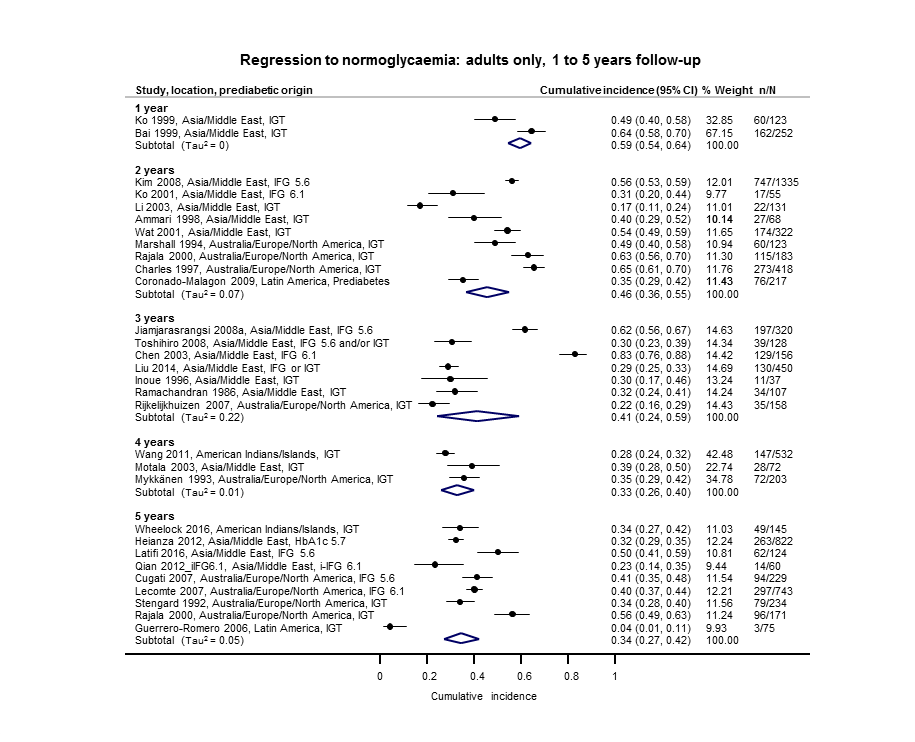
Regression from intermediate hyperglycaemia to normoglycaemia in adults over 1–5 years
CI: confidence interval; HbA1c5.7 : glycosylated haemoglobin A1c 5.7%; i‐IFG5.6/6.1 : (isolated) impaired fasting glucose 5.6/6.1 mmol/L threshold;IGT: impaired glucose tolerance; n/N: events/number of participants

Regression from intermediate hyperglycaemia to normoglycaemia in adults over 6–11 years
CI: confidence interval; i‐IFG5.6/6.1 : (isolated) impaired fasting glucose 5.6/6.1 mmol/L threshold; i‐IGT: (isolated) impaired glucose tolerance; n/N: events/number of participants
The number of studies and participants, and the proportion regressing from IH to normoglycaemia (pooled if more than one study) according to follow‐up period were as follows.
-
1 year's follow‐up: 2 studies, 375 participants, regression to normoglycaemia 59% (95% CI 54 to 64).
-
2 years' follow‐up: 9 studies, 2852 participants, regression to normoglycaemia 46% (95% CI 36 to 55).
-
3 years' follow‐up: 7 studies, 1356 participants, regression to normoglycaemia 41% (95% CI 24 to 59).
-
4 years' follow‐up: 3 studies, 807 participants, regression to normoglycaemia 33% (95% CI 26 to 40).
-
5 years' follow‐up: nine studies, 2603 participants, regression to normoglycaemia 34% (95% CI 27 to 42).
-
6 years' follow‐up: 5 studies, 1328 participants, regression to normoglycaemia 23% (95% CI 3 to 53).
-
7 years' follow‐up: 4 studies, 679 participants, regression to normoglycaemia 41% (95% CI 37 to 45).
-
8 years' follow‐up: 2 studies, 328 participants, regression to normoglycaemia 39% (95% CI 33 to 44).
-
9 years' follow‐up: 1 study, 299 participants, regression to normoglycaemia 17% (95% CI 14 to 22)
-
10 years' follow‐up: 7 studies, 894 participants, regression to normoglycaemia 42% (95% CI 22 to 63).
-
11 years' follow‐up: 2 studies, 736 participants, regression to normoglycaemia 28% (95% CI 17 to 39).
Children and adolescents
Regression from IH to normoglycaemia in children and adolescents within a follow‐up period of one to four years showed percentages from 45% to 81% (Figure 19). There were no distinct patterns with regard to geography. IGT at baseline was often investigated as the IH risk factor.

Regression from intermediate hyperglycaemia to normoglycaemia in children/adolescents over 1–4 years
CI: confidence interval; IGT: impaired glucose tolerance; n/N: events/number of participants
The number of studies and participants, and the proportion regressing from IH to normoglycaemia according to follow‐up period were as follows.
-
1 year's follow‐up: 1 study, 79 participants, regression to normoglycaemia 66% (95% CI 55 to 75).
-
2 years' follow‐up: 1 study, 33 participants, regression to normoglycaemia 45% (95% CI 30 to 62).
-
4 years' follow‐up: 1 study, 119 participants, regression to normoglycaemia 81% (95% CI 73 to 87).
c) IH versus normoglycaemia as a prognostic factor for developing T2DM
Prognostic factor studies used various definitions for IH and different effect measures (IRR, OR and HR) to express the effect of glycaemic status on development of T2DM. The findings are presented below according to IH definition and effect measure. No data were available on the prognostic factor IH versus normoglycaemia for children or adolescents.
HR as the effect measure
IFG 5.6 mmol/L threshold
Eight studies reported HRs and the IFG5.6 threshold for IH at baseline (Analysis 1.1). The length of follow‐up ranged from 4 to 22 years (studies are ordered with ascending length of follow‐up in Analysis 1.1). The studies included 9017 participants with IH and 25,850 participants with normoglycaemia. The overall HR was 4.32 (95% CI 2.61 to 7.12). The 95% prediction interval ranged from 0.75 to 25.01
The comparison of geographic regions showed the following results (Analysis 1.1).
-
Asia/Middle East (4 studies, 2385 participants with IH and 12,418 participants with normoglycaemia, 5 to 12 years' follow‐up): the pooled HR was 5.07 (95% CI 3.41 to 7.53). The 95% prediction interval ranged from 1.07 to 24.02.
-
Australia/Europe/North America (3 studies, 5685 participants with IH and 12,837 participants with normoglycaemia, 8 to 22 years' follow‐up): the pooled HR was 4.15 (95% CI 1.24 to 13.87). Calculation of the 95% prediction interval did not provide a meaningful estimate.
-
American Indians/Islands (1 study, 947 participants with IH and 595 participants with normoglycaemia, 4 years' follow‐up): the HR was 2.38 (95% CI 1.85 to 3.06).
IFG 6.1 mmol/L threshold
Nine studies reported HRs and the IFG6.1 threshold for IH at baseline (Analysis 1.2). The length of follow‐up ranged from 5 to 22 years (studies are ordered by ascending length of follow‐up in Analysis 1.2). The studies included 2818 participants with IH and 18,591 participants with normoglycaemia. The overall HR was 5.47 (95% CI 3.50 to 8.54). The 95% prediction interval ranged from 1.09 to 27.56
The comparison of geographic regions showed the following results (Analysis 1.2).
-
Asia/Middle East (5 studies, 1054 participants with IH and 9756 participants with normoglycaemia, 5 to 11 years' follow‐up): the pooled HR was 10.55 (95% CI 3.61 to 30.81). Calculation of the 95% prediction interval did not provide a meaningful estimate.
-
Australia/Europe/North America (4 studies, 1736 participants with IH and 8835 participants with normoglycaemia, 6 to 22 years' follow‐up): the pooled HR was 3.30 (95% CI 2.32 to 4.67). The 95% prediction interval ranged from 0.84 to 12.99.
-
Latin America (1 study, 28 participants with IH and 66 participants with normoglycaemia, 6 years' follow‐up): the HR was 2.06 (95% CI 1.76 to 2.41).
IGT
Five studies reported HRs and IGT for IH at baseline (Analysis 1.3). The length of follow‐up ranged from 5 to 16 years (studies are ordered by ascending length of follow‐up in Analysis 1.3). These studies included 4010 participants with IH and 12,566 participants with normoglycaemia. The overall HR was 3.61 (95% CI 2.31 to 5.64). The 95% prediction interval ranged from 0.69 to 18.97.
The comparison of geographic regions showed the following results (Analysis 1.3).
-
Asia/Middle East (3 studies, 1780 participants with IH and 6695 participants with normoglycaemia, 5 to 12 years' follow‐up): the pooled HR was 4.48 (95% CI 2.81 to 7.15). Calculation of the 95% prediction interval did not provide a meaningful estimate.
-
Australia/Europe/North America (2 studies, 2230 participants with IH and 5871 participants with normoglycaemia, 6 to 16 years' follow‐up): the pooled HR was 2.53 (95% CI 1.52 to 4.19).
Combined IFG and IGT
Five studies reported HRs and used both IFG and IGT for defining IH at baseline (Analysis 1.4). The length of follow‐up ranged from 4 to 12 years (studies are ordered by ascending length of follow‐up in Analysis 1.4). These studies included 1038 participants with IH and 8719 participants with normoglycaemia. The overall HR was 6.90 (95% CI 4.15 to 11.45). The 95% prediction interval ranged from 1.06 to 44.95.
The comparison of geographic regions showed the following results (Analysis 1.4).
-
Asia/Middle East (3 studies, 461 participants with IH and 6695 participants with normoglycaemia, 5 to 12 years' follow‐up): the pooled HR was 10.20 (95% CI 5.45 to 19.09). Calculation of the 95% prediction interval did not provide a meaningful estimate.
-
Australia/Europe/North America (1 study, 221 participants with IH and 1429 participants with normoglycaemia, 6 years' follow‐up): the HR was 3.80 (95% CI 2.30 to 6.28).
-
American Indians/Islands (1 study, 356 participants with both IFG and IGT and 595 participants with normoglycaemia, 4 years' follow‐up): the HR was 4.06 (95% CI 3.05 to 5.40).
HbA1c 5.7% threshold
Four studies reported HRs and the HbA1c5.7 threshold for IH at baseline (Analysis 1.5). The length of follow‐up ranged from 4 to 22 years (studies are ordered by ascending length of follow‐up in Analysis 1.5). The studies included 5223 participants with IH and 19,824 participants with normoglycaemia. The overall HR was 5.55 (95% CI 2.77 to 11.12). The 95% prediction interval ranged from 0.23 to 141.18.
The comparison of geographic regions showed the following results (Analysis 1.5).
-
Asia/Middle East (3 studies, 3196 participants with IH and 13,609 participants with normoglycaemia, 4 to 5 years' follow‐up): the pooled HR was 7.21 (95% CI 5.14 to 10.11). The 95% prediction interval ranged from 0.81 to 64.52.
-
Australia/Europe/North America (1 study, 2027 participants with IH and 6215 participants with normoglycaemia, 22 years' follow‐up): the HR was 2.71 (95% CI 2.48 to 2.96).
HbA1c 6.0% threshold
Six studies reported HRs and the HbA1c6.0 threshold for IH at baseline (Analysis 1.6). The length of follow‐up ranged from 4 to 22 years (studies are ordered by ascending length of follow‐up in Analysis 1.6). The studies included 4532 participants with IH and 26,167 participants with normoglycaemia. The overall HR was 10.10 (95% CI 3.59 to 28.43). Calculation of the 95% prediction interval did not provide a meaningful estimate.
The comparison of geographic regions showed the following results (Analysis 1.6).
-
Asia/Middle East (4 studies, 3492 participants with IH and 19,242 participants with normoglycaemia, 4 to 12 years' follow‐up): the pooled HR was 13.12 (95% CI 4.10 to 41.96). Calculation of the 95% prediction interval did not provide a meaningful estimate.
-
Australia/Europe/North America (2 studies, 1040 participants with IH and 6925 participants with normoglycaemia, 15 to 22 years' follow‐up): the pooled HR was 5.09 (95% CI 1.69 to 15.37).
Both elevated HbA1c and IFG
One study in Japanese participants provided data on elevated HbA1c and IFG for defining IH at baseline and estimated the effect of IH versus normoglycaemia using the HR (Analysis 1.7). The combination of HbA1c5.7 plus IFG5.6 (410 participants) when compared with normoglycaemia (4149 participants) showed an HR of 32.50 (95% CI 23.00 to 45.92). The combination of HbA1c5.7 plus IFG6.1 (159 participants) when compared with normoglycaemia (5198 participants) showed an HR of 37.90 (95% CI 28.10 to 51.12). The combination of HbA1c6.0 plus IFG5.6 (135 participants) when compared with normoglycaemia (4493 participants) showed an HR of 53.70 (95% CI 38.40 to 75.09). The combination of HbA1c6.0 plus IFG6.1 (72 participants) when compared with normoglycaemia (5730 participants) showed an HR of 52.30 (95% CI 37.80 to 72.37).
IH in special populations
Data on black populations were scarce: one study in African Surinamese reported an adjusted OR of 5.1 (95% CI 2.0 to 13.3) for the association between IFG5.6 at baseline and T2DM incidence at 7.5 years' follow‐up (Admiraal 2014). Another study including a subgroup of African Americans reported the association of various measures of IH at baseline with the development of T2DM using HRs (Warren 2017): after 16 years of follow‐up the HR for IFG5.6 was 2.65 (95% CI 2.11 to 3.32); for IFG6.1, the HR was 3.16 (95% CI 2.47 to 4.06); and for IGT, the HR was 2.55 (95% CI 2.01 to 3.22). After 22 years' follow‐up, the HR for IFG5.6 was 2.05 (95% CI 1.75 to 2.40); for IFG6.1, the HR was 2.66 (95% CI 2.26 to 3.13); for HbA1c5.7, the HR was 2.24 (95% CI 1.92 to 2.61); and for HbA1c6.0, the HR was 2.60 (95% CI 2.21 to 3.05).
Incidence rate ratio as the effect measure
IFG 5.6 mmol/L threshold
Ten studies reported incidence rate ratios (IRRs) and used the IFG5.6 threshold for IH. The studies included 24,357 participants with IH and 155,272 participants with normoglycaemia (Figure 20). Of those with IH, 661 (2.7%) developed T2DM compared with 1270 (0.8%) in participants with normoglycaemia. The overall IRR was 4.81 (95% CI 3.67 to 6.30) with a 95% prediction interval ranging from 1.95 to 11.83.

IFG: impaired fasting glucose; IRR: incidence rate ratio; n: number of cases; T: person‐time in years
The results for the geographic regions were as follows.
-
Asia/Middle East (6 studies): T2DM developed in 434/15,661 (2.8%) participants with IH and in 1204/145,597 (0.8%) participants with normoglycaemia. The pooled IRR was 5.23 (95% CI 3.77 to 7.25) with a 95% prediction interval ranging from 1.72 to 15.89.
-
Australia/Europe/North America (3 studies): T2DM developed in 90/6322 (1.4%) participants with IH and in 32/8062 (0.4%) participants with normoglycaemia. The pooled IRR was 4.96 (95% CI 3.25 to 7.57) with a 95% prediction interval ranging from 0.32 to 77.24.
-
American Indians/Islands (1 study): T2DM developed in 137/2374 (5.8%) participants with IH and in 34/1613 (2.1%) participants with normoglycaemia. The IRR was 2.74 (95% CI 1.88 to 3.99).
IFG 6.1 mmol/L threshold
Six studies reported IRRs and used an IFG6.1 threshold for IH. Thee studies included 5115 participants with IH, of whom 127 (2.5%) developed T2DM, plus 56,580 participants with normoglycaemia, of whom 188 (0.3%) developed T2DM (Figure 21). The overall IRR was 6.82 (95% CI 4.53 to 10.25) with a 95% prediction interval ranging from 2.03 to 22.87.
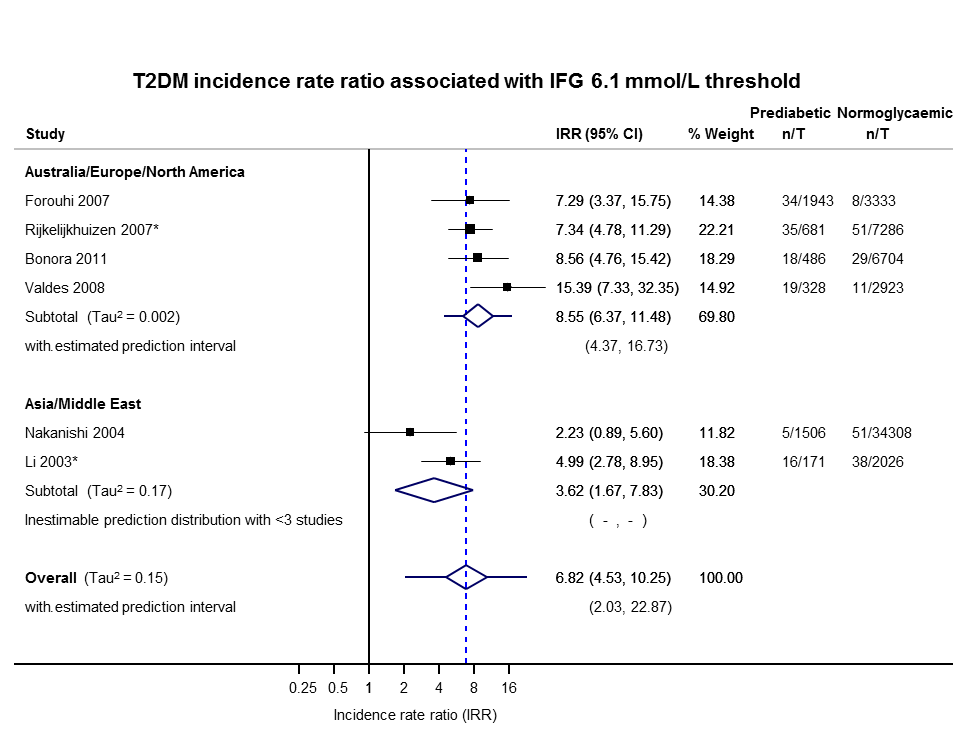
IFG: impaired fasting glucose; IRR: incidence rate ratio; n: number of cases; T: person‐time in years
The comparison of geographic regions showed a lower IRR for Asia/Middle East as follows.
-
Asia/Middle East (2 studies): T2DM developed in 21/1677 (1.3%) participants with IH and in 89/36,334 (0.2%) participants with normoglycaemia. The pooled IRR was 3.62 (95% CI 1.67 to 7.83).
-
Australia/Europe/North America (4 studies): T2DM developed in 106/3438 (3.1%) participants with IH and in 99/20,246 (0.5%) participants with normoglycaemia. The pooled IRR was 8.55 (95% CI 6.37 to 11.48) with a 95% prediction interval ranging from 4.37 to 16.73.
IGT threshold
Twelve studies reported IRRs and defined IH using IGT. The studies included 18,468 participants with IH and 98,409 participants with normoglycaemia (Figure 22). T2DM developed in 947 (5.1%) participants with IH compared to 1147 (1.2%) in participants with normoglycaemia. The overall IRR was 4.48 (95% CI 3.69 to 5.44) with a 95% prediction interval ranging from 2.60 to 7.70.

IGT: impaired glucose tolerance; IRR: incidence rate ratio; n: number of cases; T: person‐time in years
The findings according to geographic regions were as follows.
-
Asia/Middle East (5 studies): T2DM developed in 766/14,809 (5.2%) participants with IH and in 390/73,128 (0.5%) participants with normoglycaemia. The pooled IRR was 3.93 (95% CI 3.03 to 5.10) with a 95% prediction interval ranging from 1.71 to 9.02.
-
Australia/Europe/North America (5 studies): T2DM developed in 75/2572 participants with IH and in 117/22,329 (0.5%) participants with normoglycaemia. The pooled IRR was 5.93 (95% CI 4.11 to 8.57) with a 95% prediction interval ranging from 2.38 to 14.81.
-
American Indians/Islands (2 studies): T2DM developed in 88/1087 (8.1%) participants with IH and in 48/2952 (1.6%) participants with normoglycaemia. The pooled IRR was 4.46 (95% CI 3.12 to 6.38).
Combined IFG and IGT
Nine studies used both IFG and IGT to define IH and reported IRRs. Of the 4470 participants with IH included in the studies, 551 (12.3%) developed T2DM compared with 1091 of the 90,072 (1.2%) participants with normoglycaemia (Figure 23). The overall IRR was 10.94 (95% CI 7.22 to 16.58) with 95% prediction interval ranging from 2.58 to 46.46.
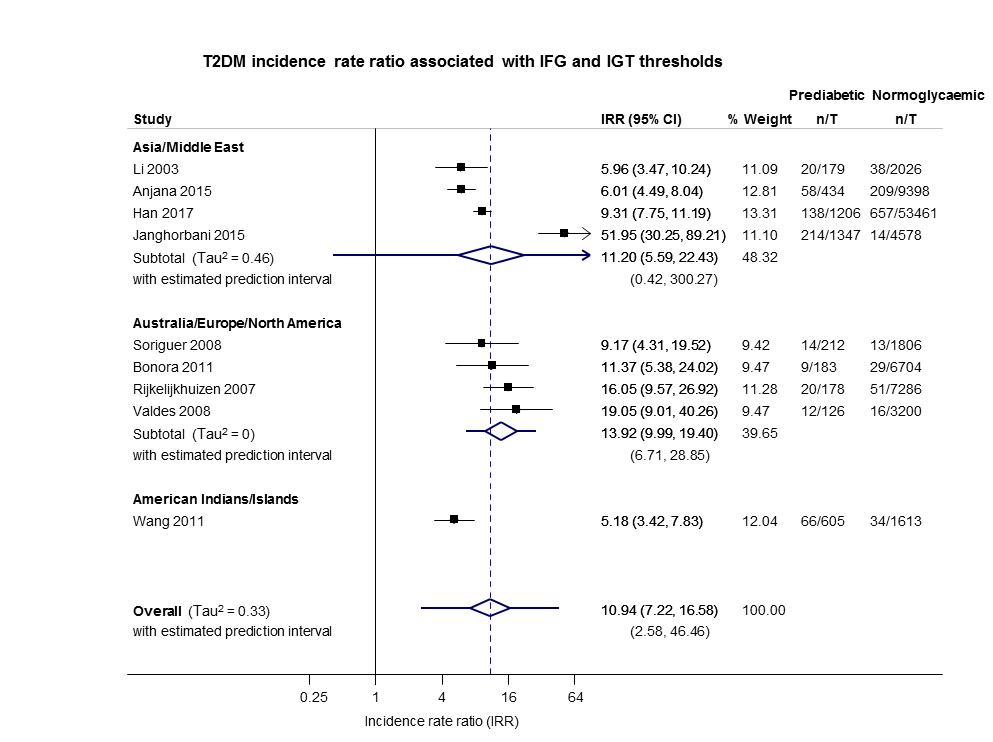
IFG: impaired fasting glucose; IGT: impaired glucose tolerance; IRR: incidence rate ratio; n: number of cases; T: person‐time in years
A lower pooled IRR was observed for the American Indians/Islands cohort compared to other cohorts as shown below.
-
Asia/Middle East (4 studies): T2DM developed in 430/3166 (13.6%) participants with IH and in 918/69,463 (1.3%) participants with normoglycaemia. The pooled IRR was 11.20 (95% CI 5.59 to 22.43). Calculation of the 95% prediction interval did not provide a meaningful estimate.
-
Australia/Europe/North America (4 studies): T2DM developed in 55/699 (7.9%) participants with IH and in 109/18,966 (0.6%) participants with normoglycaemia. The pooled IRR was 13.92 (95% CI 9.99 to 19.40) with a 95% prediction interval ranging from 6.71 to 28.85.
-
American Indians/Islands (1 study): T2DM developed in 66/605 (10.9%) participants with IH and in 34/1613 (2.1%) participants with normoglycaemia. The pooled IRR was 5.18 (95% CI 3.42 to 7.83).
HbA1c 5.7% threshold only and the combination of HbA1c 5.7% threshold with IFG 5.6 mmol/L threshold
One study, Heianza 2012, reported using HbA1c5.7 only or the combination of IFG5.6 plus HbA1c5.7 to define IH at baseline (Figure 24).

IFG: impaired fasting glucose; HbA1c: glycosylated haemoglobin A1c; IRR: incidence rate ratio; n: number of cases; T: person‐time in years
T2DM developed in 30/1965 (1.5%) participants with IH defined using HbA1c5.7 only compared with 46/19,961 (0.2%) in participants with normoglycaemia. The IRR was 6.62 (4.18 to 10.49).
In the cohort with both HbA1c5.7 and IFG5.6, T2DM developed in 154/1641 (9.4%) participants compared with 46/19961 (0.2%) in participants with normoglycaemia. The IRR was 40.72 (95% CI 29.30 to 56.61).
Odds ratio as the effect measure
IFG 5.6 mmol/L threshold
Twenty‐one studies reported ORs and the IFG5.6 threshold for IH (Analysis 2.1). The length of follow‐up ranged from 4 to 24 years (studies are ordered by ascending length of follow‐up in Analysis 2.1). The studies included 9320 participants with IH and 38,327 participants with normoglycaemia. The overall OR was 4.15 (95% CI 2.75 to 6.28). The 95% prediction interval ranged from 0.54 to 32.00.
The comparison of geographic regions showed the following results (Analysis 2.1).
-
Asia/Middle East (10 studies, 6359 participants with IH and 28,218 participants with normoglycaemia, 4 to 24 years' follow‐up): the pooled OR was 2.94 (95% CI 1.77 to 4.86). The 95% prediction interval ranged from 0.43 to 19.93.
-
Australia/Europe/North America (9 studies, 1949 participants with IH and 7920 participants with normoglycaemia, 4 to 12 years' follow‐up): the pooled OR was 6.47 (95% CI 3.81 to 11.00). The 95% prediction interval ranged from 0.99 to 42.32.
-
Latin America (1 study, 65 participants with IH and 1594 participants with normoglycaemia, 7 years' follow‐up): the OR was 4.28 (95% CI 3.21 to 5.71).
-
American Indians/Islands (1 study, 947 participants with IH and 595 participants with normoglycaemia, 4 years' follow‐up): the OR was 3.12 (95% CI 2.31 to 4.21).
The test for subgroup differences did not indicate a significant subgroup effect (P = 0.07). However, two of the four subgroups had only one study each, so the validity of the analysis is uncertain. Furthermore, there is substantial heterogeneity between studies (Tau2 = 0.65 and 0.59) within each of the other two subgroups, and the subgroup analysis does not appear to have explained heterogeneity.
IFG 6.1 mmol/L threshold
Fifteen studies reported ORs and the IFG6.1 threshold for IH at baseline (Analysis 2.2). The length of follow‐up ranged from 3 to 24 years (studies are ordered by ascending length of follow‐up in Analysis 2.2). The studies included 4574 participants with threshold for IH and 32,292 participants with normoglycaemia. The overall OR was 6.60 (95% CI 4.18 to 10.43). The 95% prediction interval ranged from 0.93 to 46.82.
The comparison between geographic regions showed the following results (Analysis 2.2).
-
Asia/Middle East (7 studies, 3317 participants with IH and 25,604 participants with normoglycaemia, 3 to 24 years' follow‐up): the pooled OR was 5.18 (95% CI 2.32 to 11.53). The 95% prediction interval ranged from 0.29 to 91.37.
-
Australia/Europe/North America (7 studies, 1240 participants with IH and 5094 participants with normoglycaemia, 4 to 15 years' follow‐up): the pooled OR was 8.69 (95% CI 4.95 to 15.24). The 95% prediction interval ranged from 1.20 to 62.69.
-
Latin America (1 study, 17 participants with IH and 1594 participants with normoglycaemia, 7 years' follow‐up): the OR was 3.73 (95% CI 2.18 to 6.38).
The test for subgroup differences did not indicate a significant subgroup effect (P = 0.10). However, one of the three subgroups had only one study, and there is substantial heterogeneity between studies (Tau2 = 1.08 and 0.57) within each of the other two subgroups.
IGT
Twenty studies reported adjusted ORs and IGT for IH at baseline (Analysis 2.3). The length of follow‐up ranged from 5 to 24 years (studies are ordered by ascending length of follow‐up in Analysis 2.3). The studies included 3139 participants with IH and 18,413 participants with normoglycaemia. The overall OR was 4.61 (95% CI 3.76 to 5.64). The 95% prediction interval ranged from 2.10 to 10.13.
The comparison of geographic regions showed the following results (Analysis 2.3).
-
Asia/Middle East (6 studies, 1226 participants with IH and 7417 participants with normoglycaemia, 5 to 24 years' follow‐up): the pooled OR was 3.74 (95% CI 2.83 to 4.94). The 95% prediction interval ranged from 1.70 to 8.21.
-
Australia/Europe/North America (11 studies, 1481 participants with IH and 7684 participants with normoglycaemia, 4 to 12 years' follow‐up): the pooled OR was 5.20 (95% CI 3.62 to 7.45). The 95% prediction interval ranged from 1.50 to 18.09.
-
Latin America (2 studies, 381 participants with IH and 3097 participants with normoglycaemia, 7 to 8 years' follow‐up): the pooled OR was 4.94 (95% CI 3.15 to 7.76).
-
American Indians/Islands (1 study, 51 participants with IH and 215 participants with normoglycaemia, 5 to 8 years' follow‐up): the OR was 3.60 (95% CI 1.40 to 9.26).
The test for subgroup differences did not indicate a significant subgroup effect (P = 0.47). However, two of the four subgroups had only one or two studies, so the validity of the analysis is uncertain.
Combined IFG and IGT
Nine studies reported ORs and used both IFG and IGT for defining IH at baseline (Analysis 2.4). The length of follow‐up ranged from 5 to 24 years (studies are ordered by ascending length of follow‐up in Analysis 2.4). The studies included 652 participants with IH and 9004 participants with normoglycaemia. The overall OR was 13.14 (95% CI 7.41 to 23.30). The 95% prediction interval ranged from 1.84 to 93.66.
The comparison of geographic regions showed the following results (Analysis 2.4).
-
Asia/Middle East (3 studies, 498 participants with IHT and 3704 participants with normoglycaemia, 5 to 24 years' follow‐up): the pooled OR was 6.99 (95% CI 3.09 to 15.83). Calculation of the 95% prediction interval did not provide a meaningful estimate.
-
Australia/Europe/North America (6 studies, 154 participants with IH and 5300 participants with normoglycaemia, 6 to 12 years' follow‐up): the pooled OR was 20.95 (95% CI 12.40 to 35.40). The 95% prediction interval ranged from 4.93 to 89.05.
The OR for the Australia/Europe/North America cohort of studies appeared to be higher compared with the Asia/Middle East cohort.
HbA1c 5.7% threshold
Three studies reported ORs and HbA1c5.7 threshold for IH at baseline (Analysis 2.5). The length of follow‐up ranged from 6 to 10 years (studies are ordered with ascending length of follow‐up in Analysis 2.5). The studies included 906 participants with IH and 2562 participants with normoglycaemia. The overall OR was 4.43 (95% CI 2.20 to 8.88). Calculation of the 95% prediction interval did not provide a meaningful estimate.
The results by geographic region are as follows (Analysis 2.5).
-
Asia/Middle East (1 study, 675 participants with IH and 462 participants with normoglycaemia, 6 years' follow‐up): the OR was 4.54 (95% CI 2.65 to 7.78).
-
Australia/Europe/North America (2 studies, 231 participants with IH and 2100 participants with normoglycaemia, 7 to 10 years' follow‐up): the pooled OR was 4.38 (95% CI 1.36 to 14.15).
HbA1c 6.0% threshold
Three studies reported ORs and the HbA1c6.0 threshold for IH at baseline (Analysis 2.6). The length of follow‐up ranged from three to five years. The studies included 1594 participants with IH and 16,723 participants with normoglycaemia. The overall OR was 12.79 (95% CI 4.56 to 35.85). Calculation of the 95% prediction interval did not provide a meaningful estimate.
The comparison of geographic regions showed the following results (Analysis 2.6).
-
Asia/Middle East (1 study, 1103 participants with IH and 10,763 participants with normoglycaemia, 5 years' follow‐up): the OR was 23.20 (95% CI 18.70 to 28.78).
-
Australia/Europe/North America (1 study, 370 participants with IH and 5365 participants with normoglycaemia, 3 years' follow‐up): the OR was 15.60 (95% CI 6.90 to 35.27).
-
American Indians/Islands (1 study, 121 participants with IH and 595 participants with normoglycaemia, 4 years' follow‐up): the OR was 5.89 (95% CI 4.23 to 8.20).
The OR for the Asia/Middle East and Australia/Europe/North America studies appeared higher compared with the American Indians/Islands study.
Combination of HbA1c 5.7% threshold with IFG 5.6 mmol/L threshold
Two studies defined IH using a combination of HbA1c5.7 and IFG5.6 at baseline and reported ORs (Analysis 2.7). The length of follow‐up ranged from five to seven years (studies are ordered by ascending length of follow‐up in Analysis 2.7).The studies included 2120 participants with IH and 11,886 participants with normoglycaemia. The pooled OR was 35.91 (95% CI 20.43 to 63.12).
The findings for each geographic region are as follows (Analysis 2.7).
-
Asia/Middle East (1 study, 1951 participants with IH and 10,761 participants with normoglycaemia, 5 years' follow‐up): the OR was 46.70 (95% CI 33.60 to 64.91).
-
Australia/Europe/North America (1 study, 169 participants with IH and 1125 participants with normoglycaemia, 7 years' follow‐up): the OR was 26.20 (95% CI 16.30 to 42.11).
Subgroup and sensitivity analyses
There were not enough data to perform subgroup analyses by age or sex. The special group of children and adolescents is reported under the headings corresponding to the association between IH and T2DM incidence and regression to normoglycaemia.
Sensitivity analyses for risk of bias were not meaningful because of the diversity in measurement of T2DM incidence, definitions of IH, and follow‐up periods. The analysis of adequate adjustment for confounding factors in studies reporting HRs may have provided interesting information, but there were not enough data to analyse the impact of at least four or five well‐known covariates influencing the relationship between prognostic factor and T2DM incidence. There were no very large studies including participants with IH at baseline.
Overview of complete data set and certainty of the evidence
Table 1 provides a succinct overview of the overall prognosis of people with IH as well as regression from IH to normoglycaemia over 1 to 20 years of follow‐up.
Table 2 provides a succinct overview of IH compared with normoglycaemia as a prognostic factor for developing T2DM according to geographic regions/special populations and type of outcome measurement.
Figure 25 shows the overall prognosis of IH as measured by cumulative incidence over different follow‐up periods and across all populations, as well as regression from IH to normoglycaemia.

Overall prognosis of people with intermediate hyperglycaemia (cumulative type 2 diabetes incidence and regression to normoglycaemia) associated with measures of intermediate hyperglycaemia
HbA1c5.7/HbA1c6.0: glycosylated haemoglobin A1c 5.7%/6.0% threshold; IFG5.6/6.1: impaired fasting glucose 5.6/6.1 mmol/L threshold; IGT: impaired glucose tolerance
Figure 26 shows IH versus normoglycaemia as a prognostic factor for developing T2DM measured by IRR, OR or HR across all populations.
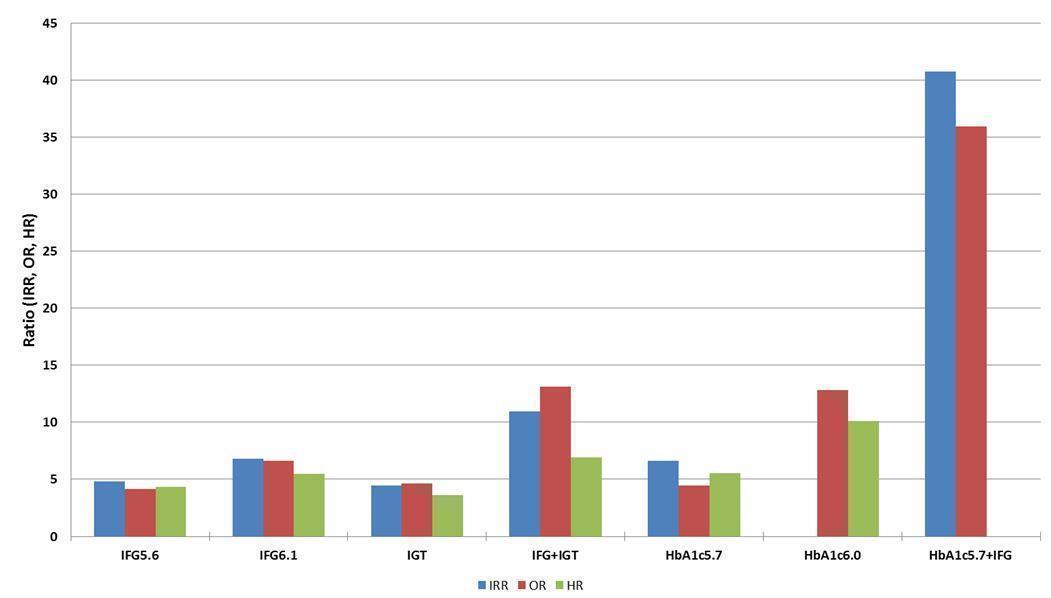
Intermediate hyperglycaemia versus normoglycaemia as a prognostic factor for developing type 2 diabetes (associated with different measures and relative risks of intermediate hyperglycaemia)
HbA1c5.7/HbA1c6.0: glycosylated haemoglobin A1c 5.7%/6.0% threshold; IFG5.6/6.1: impaired fasting glucose 5.6/6.1 mmol/L threshold; IGT: impaired glucose tolerance; IRR: incidence rate ratio; OR: odds ratio; HR: hazard ratio
Taking into account all follow‐up times and all populations, the percentages of people with IH not developing T2DM over time (i.e. either regressing to normoglycaemia or remaining 'prediabetic') were as follows (see Appendix 11): IFG5.6 cohorts, 79.2%; IFG6.1 cohorts, 75.4%; IGT cohorts, 66.7%; combined IFG and IGT cohorts, 57.2%; HbA1c5.7 cohorts, 79.7%; and HbA1c6.0 cohorts, 69.0%.
For overall prognosis, we started with high‐certainty evidence because prospective cohort studies represent an adequate study design to investigate overall prognosis. However, we downgraded the certainty of the evidence to moderate because of imprecise results for most definitions of IH (summary of findings Table for the main comparison).
We considered the overall certainty of the evidence for the prognostic factor IH versus normoglycaemia as low (summary of findings Table 2; summary of findings Table 3; summary of findings Table 4; summary of findings Table 5; summary of findings Table 6; summary of findings Table 7). We started with a high level of evidence because most included studies were phase 2 explanatory studies, defined as studies that aimed to confirm independent associations between the prognostic factor and the outcome (Huguet 2013). We downgraded the evidence for all IH measurements to low, first one level due to study limitations because many studies did not adequately adjust for confounders (only six studies used the covariate core set of age, sex, anthropometric measures and physical activity for adjustments in multivariable regression analyses ‐ Bonora 2011; Derakhshan 2016; Forouhi 2007; Han 2017; Kim 2016a; Yeboah 2011). Furthermore, we downgraded one level for imprecision/inconsistency (wide 95% CIs/wide 95% prediction intervals, sometimes ranging from negative to positive prognostic factor to outcome associations).
Discussion
Summary of main results
We included 103 prospective cohort studies from many parts of the world evaluating people with IH, usually defined using the IFG5.6 or IFG6.1 threshold, IGT, combined IFG/IGT or elevated HbA1c. However, we did not identify studies involving black Africans or Eastern Europeans. Participants were of Australian, European or North American origin in 41 studies; primarily of Latin American origin in 7 studies; Asian or Middle Eastern origin in 50 studies; American Indians in 3 studies; Mauritians in 1 study; and Nauruans in 1 study. Six studies included children, adolescents or both.
Ninety‐three studies contributed data to estimate the overall prognosis of people with IH, and 52 studies evaluated baseline glycaemic status as a prognostic factor by comparing an IH cohort with a normoglycaemic cohort.
Cumulative incidence of T2DM for the IFG5.6 threshold, the IFG6.1 threshold, IGT, combined IFG/IGT and elevated HbA1c, showed increasing percentages over follow‐up time; however, there was no clear linear increase over time. Regression rates to normoglycaemia, though decreasing over follow‐up, showed fluctuations and no clear linear decrease over time. The estimates of the prognostic effect of IH versus normoglycaemia were comparable when using HR, IRR or OR across the different definitions of IH. There was no clear pattern of risk differences between geographic regions.
Overall completeness and applicability of evidence
A limiting factor of our review was that most studies took place in Asia, the Middle East, Australia, Western Europe and North America, affecting the generalisability of findings to other populations residing in Africa and Eastern Europe. We are also aware that categorising the included studies based on region or 'ethnicity' has deficiencies with regard to clearly delineating study participants. The complicated interplay of factors like genetics, diets, and changing environmental and social conditions, among others, makes it virtually impossible to achieve a generally accepted categorisation. We chose an approach based primarily on geographic location because we thought that most readers would be interested in having a broad overview of any potential differences in T2DM incidence based on this characteristic. At the same time, we tried not to overload the reader with too much information by fragmenting our dataset into all the different countries or into more precisely defined 'ethnicities', since some investigators even reported several 'ethnic' subgroups within a single study cohort. However, we do provide detailed information, when available, in our appendices to enable the interested reader to identify studies according to whatever combination of factors seems of value to generate hypotheses of potential differences between the diverse study groups.
Only six studies addressed the overall prognosis of IH in 495 children or adolescents, with approximately 50% originating from high‐risk American Indian cohorts, also affecting the applicability of findings to other populations. No data were available on the prognostic factor of IH versus normoglycaemia for children or adolescents. Most studies determined the glycaemic status of participants at baseline and follow‐up on the basis of a single FPG, glucose tolerance test or HbA1c. Therefore, participants may have been misclassified at baseline, follow‐up or both in either direction. Interestingly, 93 studies provided data on overall prognosis of IH, but only 49 studies published information on regression from IH to normoglycaemia.
Certainty of the evidence
To our knowledge there is no validated risk of bias tool for studies addressing overall prognosis. Moreover, information on some applicable risk of bias domains of the QUIPS tools were limited. However, as illustrated in Figure 25, there was a wide fluctuation between the various definitions of IH as well as no linear increase in T2DM incidence over time of follow‐up. Of note, regression rates to normoglycaemia were also high, even after more than five years of follow‐up, emphasising that transition from IH to T2DM might be an intermediate state (Taylor 2017).
The certainty of the evidence for the overall prognosis of IH was moderate due to imprecise results for most IH definitions. The certainty of the evidence for the prognostic factor of IH versus normoglycaemia was low, mainly because most studies did not adjust for confounders known to be independently associated with T2DM incidence and due to substantial imprecision (wide 95% CIs) and inconsistency (wide 95% prediction intervals). However, the results of the six studies that adjusted for sex, anthropometric measures and physical activity were similar to the rest of the prospective cohort studies.
Limitations in the review process
As described in the Methods section, it was difficult to define a reliable search strategy, which probably holds true for many systematic reviews of prognostic studies. We noted that when checking other systematic reviews on the topic and the references of the included studies, around one third of our included studies were identified through reference checking. However, using PubMed's 'similar articles' algorithm did not yield new studies but did help us identify 13 secondary publications of studies we had already included. The 103 prospective cohort studies included in this review represent by far the largest amount of data synthesised on the overall prognosis of IH and the impact of IH versus normoglycaemia as a prognostic factor for T2DM development. We did not contact study authors for additional information, mainly for logistical reasons but also because we anticipated poor response, since many studies were published long ago. Moreover, retrieval of additional information, often demanding recalculations, would have imposed a considerable burden on study authors.
During the review process, the need to establish a database of cohort studies specifying details on prognostic factors and outcomes, amongst other things, became clear. Many large cohort studies investigate the association of a great number of prognostic factors with yet another large number of outcomes. These data may only be detected through a detailed analysis of the full text (especially tables and figures). It is evident that screening titles and abstracts will miss this information.
We did not include participants of randomised controlled trials. Though potentially some trials with longer time of follow‐up could provide additional data, we decided not to include information from intervention trials at this stage on theoretical grounds, as any intervention will interfere with peoples' lives, as opposed to demonstrating the natural progression of a disorder. In addition, we are conducting a series of Cochrane Reviews on interventions for people with IH and may integrate these data in a later update of this review (Hemmingsen 2016a; Hemmingsen 2016b; Hemmingsen 2016c).
Agreements and disagreements with other reviews
Gerstein 2007 is a widely cited review including 21 cohort studies and nine randomised controlled trials published between 1979 and 2004. The review authors annualised T2DM incidence rates, which varied from 5% to 10%. Their relative risks for T2DM incidence of 6.35 in people with IGT, 4.66 in people with IFG and 12.1 with both IFG and IGT were higher but comparable to our HR data. We did not annualise incidence rates because with pronounced fluctuations between regression and development of T2DM, assumptions to establish a model for annualising incidence data over prolonged period of times appeared too strong. Zhang 2010 examined ranges of HbA1c and also associated these with annualised diabetes incidences. The results of seven included studies reporting HbA1c categories showed an increase in T2DM incidence across an HbA1c range from 5.0% to 6.5%. No meta‐analysis was performed. Our results also showed increased T2DM incidence when the threshold of the HbA1c value at baseline was raised from 5.7% to 6.0%. Morris et al. performed a meta‐analysis of prospective observational studies in which participants had IH at baseline (Morris 2013). The review included 70 studies and estimated pooled incidence rates using IFG (35.5 incident cases per 1000 person‐years as defined by ADA and 47.4 incident cases per 1000 person‐years as defined by WHO, 11 and 34 studies, respectively), IGT (45.5 incident cases per 1000 person‐years, 46 studies) and IFG/IGT (70.4 incident cases per 1000 person‐years, 15 studies) definitions for IH. Elevated HbA1c was associated with a pooled incidence rate of 35.6 per 1000 person‐years. Similar to our results, the review found that progression rates to T2DM differed by definition of IH.
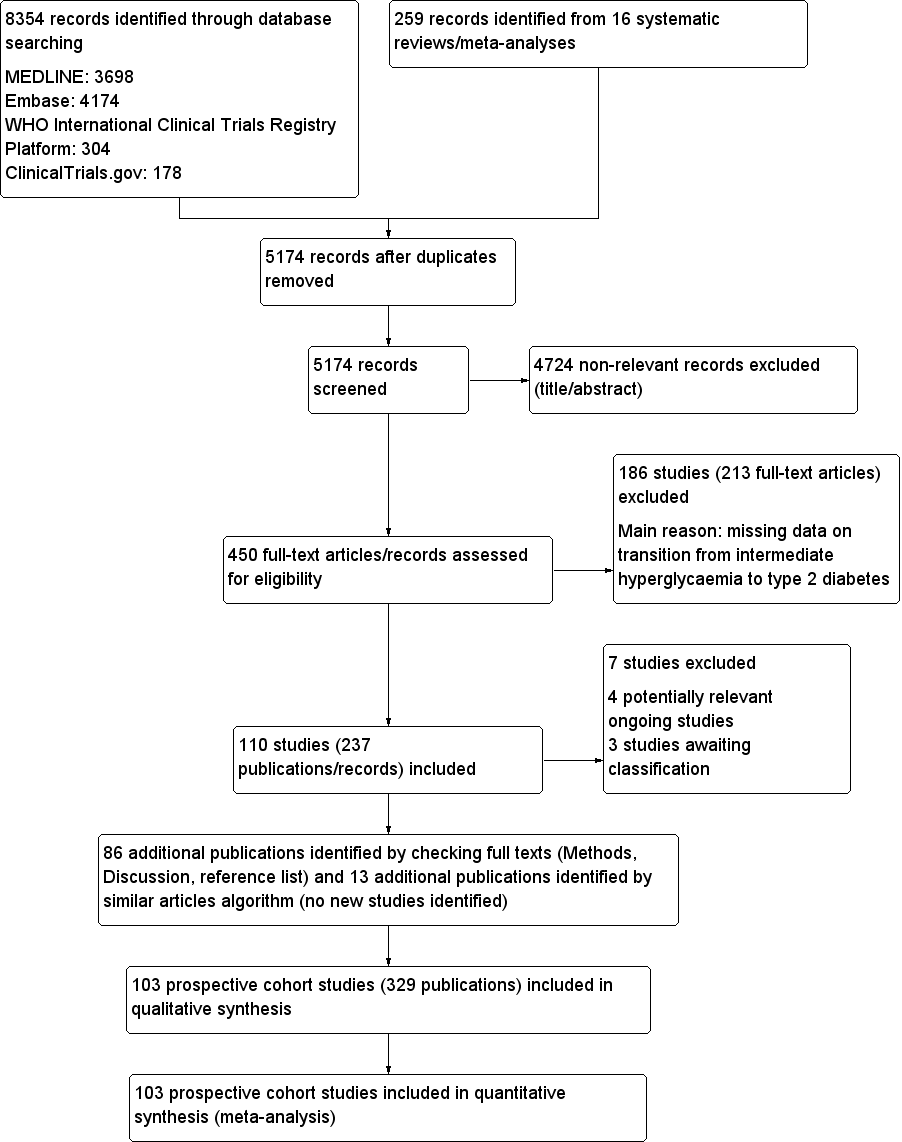
Study flow diagram

Risk of bias graph for studies of overall prognosis of people with intermediate hyperglycaemia for developing type 2 diabetes: review authors' judgements about each risk of bias item presented as percentages across all included studies

'Risk of bias' summary for studies of overall prognosis in people with intermediate hyperglycaemia for developing type 2 diabetes: review authors' judgements about each risk of bias item for each included study (part 1). The summary was split into part 1 (Figure 3) and part 2 (Figure 4) for better legibility

Risk of bias summary for studies of overall prognosis of people with intermediate hyperglycaemia for developing type 2 diabetes: review authors' judgements about each risk of bias item for each included study (part 2)
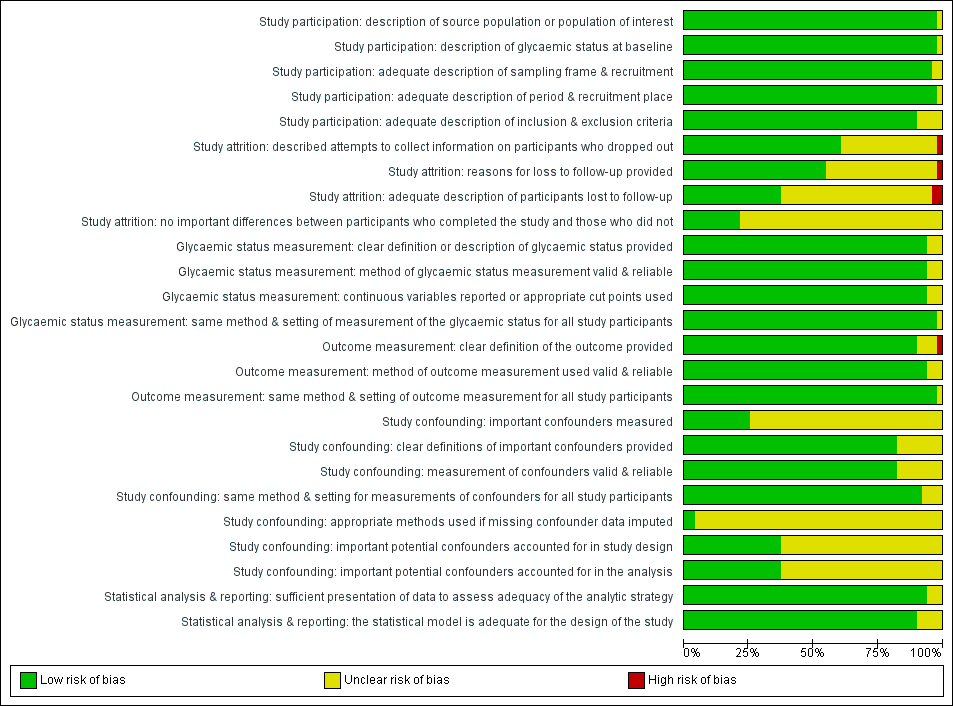
Risk of bias graph for studies of intermediate hyperglycaemia versus normoglycaemia as a prognostic factor for developing type 2 diabetes: review authors' judgements about each risk of bias item presented as percentages across all included studies

Risk of bias summary for studies of intermediate hyperglycaemia versus normoglycaemia as a prognostic factor for developing type 2 diabetes: review authors' judgements about each risk of bias item for each included study

Impaired fasting glucose 5.6 mmol/L (IFG5.6) threshold: association with cumulative type 2 diabetes mellitus (T2DM) incidence over 2–5 years
*Isolated IFG5.6
CI: confidence interval; M: men; n/N: events/number of participants; W: women
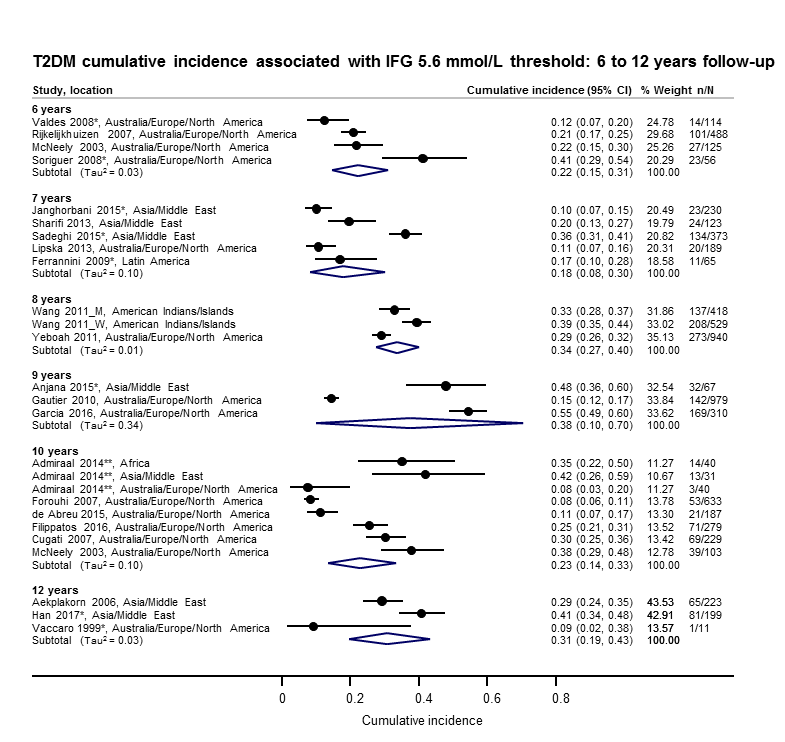
Impaired fasting glucose 5.6 mmol/L (IFG5.6) threshold: association with cumulative type 2 diabetes mellitus (T2DM) incidence over 6–12 years
*Isolated IFG5.6
**'Africa': African Surinamese cohort, 'Asia': Asian Surinamese cohort, 'Australia/Europe/North America': 'ethnic Dutch' cohort.
CI: confidence interval; M: men; n/N: events/number of participants; W: women
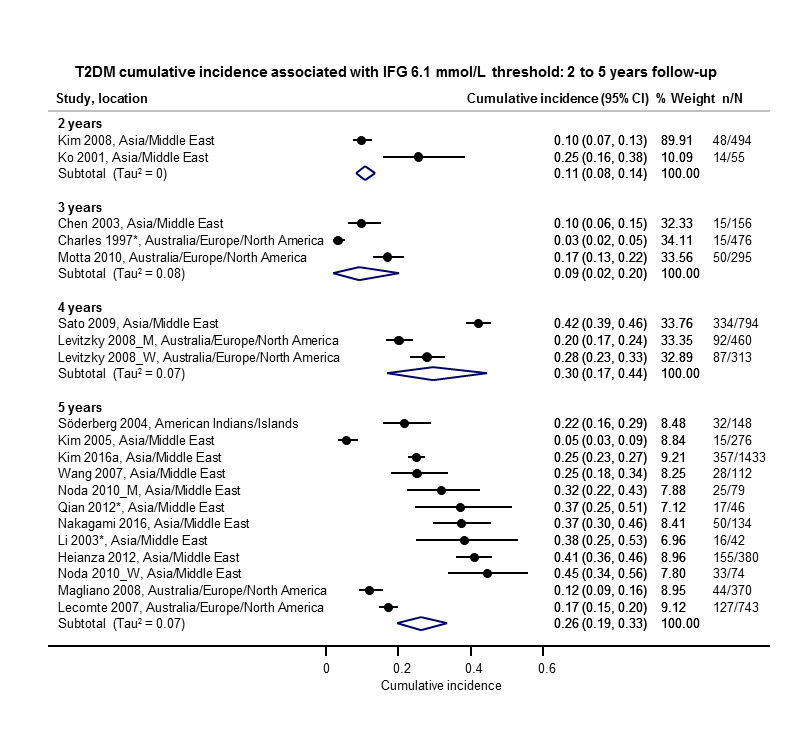
Impaired fasting glucose 6.1 mmol/L (IFG6.1) threshold: association with cumulative type 2 diabetes mellitus (T2DM) incidence over 2–5 years
*Isolated IFG6.1
CI: confidence interval; M: men; n/N: events/number of participants; W: women
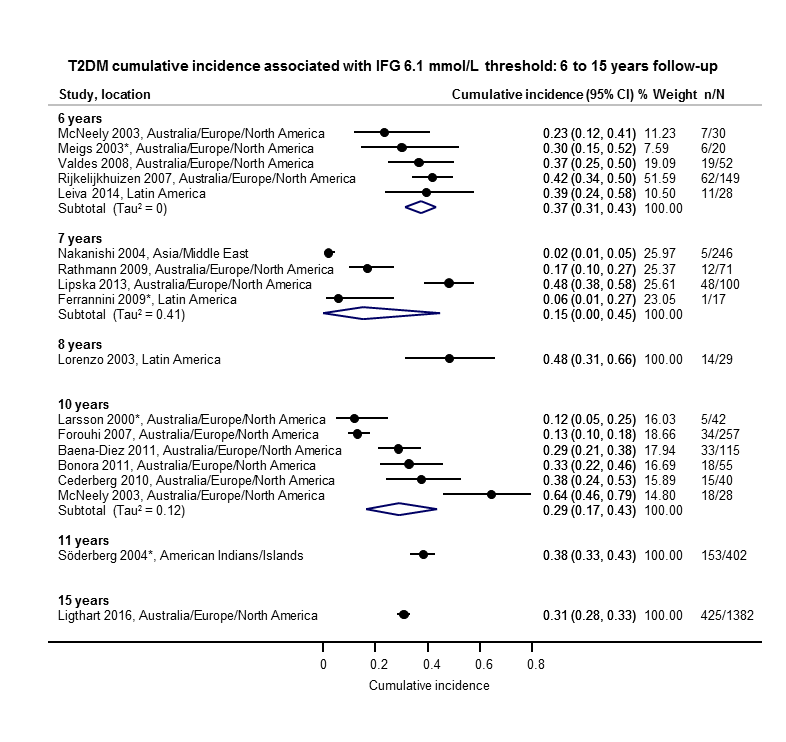
Impaired fasting glucose 6.1 mmol/L (IFG6.1) threshold: association with cumulative type 2 diabetes mellitus (T2DM) incidence over 6–15 years
*Isolated IFG6.1
CI: confidence interval; n/N: events/number of participants

Impaired glucose tolerance (IGT): association with cumulative type 2 diabetes mellitus (T2DM) incidence over 1–5 years
*Isolated IGT
CI: confidence interval; n/N: events/number of participants
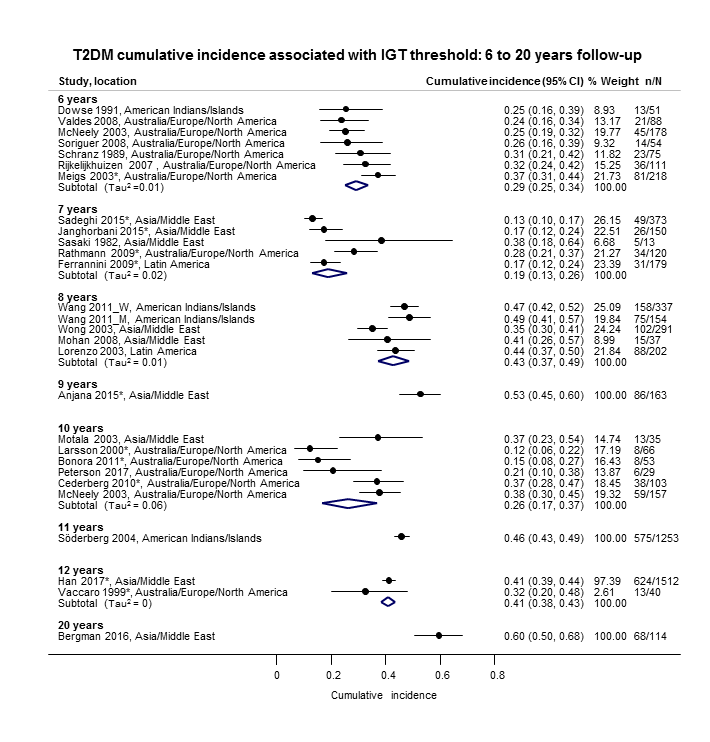
Impaired glucose tolerance (IGT): association with cumulative type 2 diabetes mellitus (T2DM) incidence over 6–20 years
*Isolated IGT
CI: confidence interval; M: men; n/N: events/number of participants; W: women

Combined impaired glucose tolerance (IGT) and impaired fasting glucose (IFG): association with cumulative type 2 diabetes mellitus (T2DM) incidence over 1–12 years
CI: confidence interval; M: men; n/N: events/number of participants; W: women
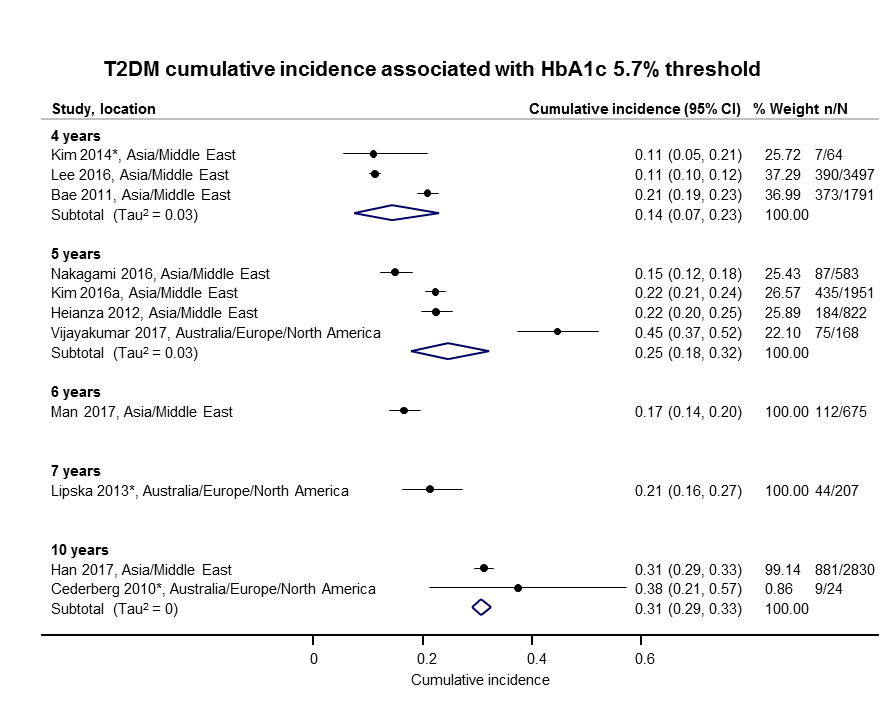
Elevated glycosylated haemoglobin A1c (HbA1c) 5.7% threshold: association with cumulative type 2 diabetes mellitus (T2DM) incidence over 4–10 years
CI: confidence interval; n/N: events/number of participants

Elevated glycosylated haemoglobin A1c (HbA1c) 6.0% threshold: association with cumulative type 2 diabetes mellitus (T2DM) incidence over 3–15 years
CI: confidence interval; n/N: events/number of participants

Cumulative type 2 diabetes mellitus (T2DM) incidence in children/adolescents over 1–10 years
CI: confidence interval; HbA1c 5.7: glycosylated haemoglobin A1c 5.7% threshold; (i‐)IGT: (isolated) impaired glucose tolerance; n/N: events/number of participants; NO: non‐overweight; OV: overweight

Regression from intermediate hyperglycaemia to normoglycaemia in adults over 1–5 years
CI: confidence interval; HbA1c5.7 : glycosylated haemoglobin A1c 5.7%; i‐IFG5.6/6.1 : (isolated) impaired fasting glucose 5.6/6.1 mmol/L threshold;IGT: impaired glucose tolerance; n/N: events/number of participants

Regression from intermediate hyperglycaemia to normoglycaemia in adults over 6–11 years
CI: confidence interval; i‐IFG5.6/6.1 : (isolated) impaired fasting glucose 5.6/6.1 mmol/L threshold; i‐IGT: (isolated) impaired glucose tolerance; n/N: events/number of participants
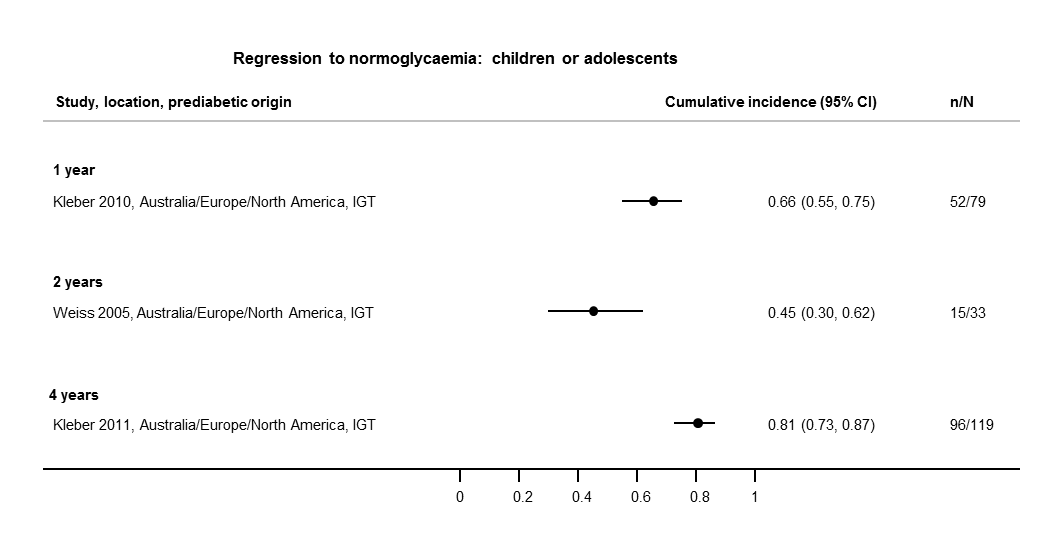
Regression from intermediate hyperglycaemia to normoglycaemia in children/adolescents over 1–4 years
CI: confidence interval; IGT: impaired glucose tolerance; n/N: events/number of participants
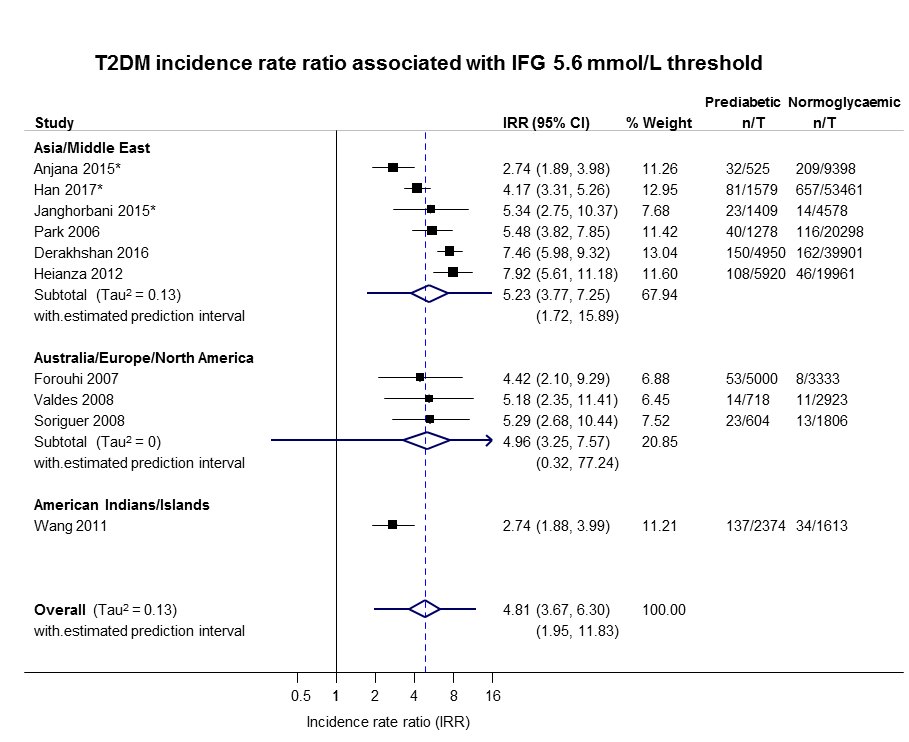
IFG: impaired fasting glucose; IRR: incidence rate ratio; n: number of cases; T: person‐time in years

IFG: impaired fasting glucose; IRR: incidence rate ratio; n: number of cases; T: person‐time in years

IGT: impaired glucose tolerance; IRR: incidence rate ratio; n: number of cases; T: person‐time in years

IFG: impaired fasting glucose; IGT: impaired glucose tolerance; IRR: incidence rate ratio; n: number of cases; T: person‐time in years
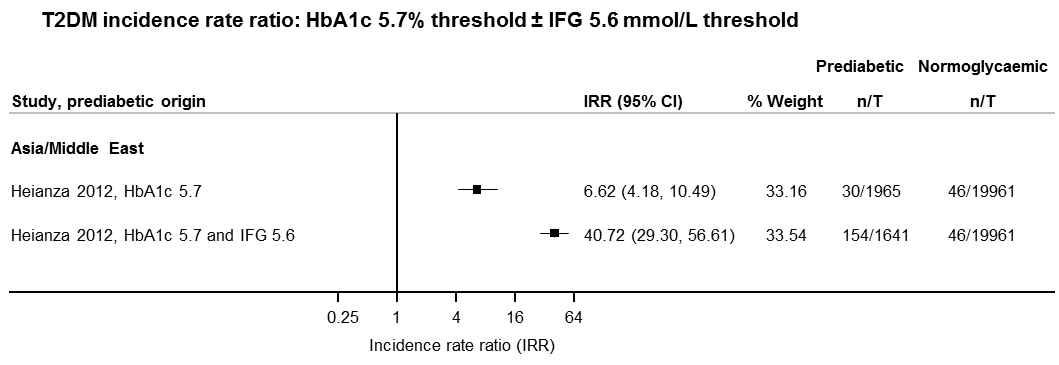
IFG: impaired fasting glucose; HbA1c: glycosylated haemoglobin A1c; IRR: incidence rate ratio; n: number of cases; T: person‐time in years
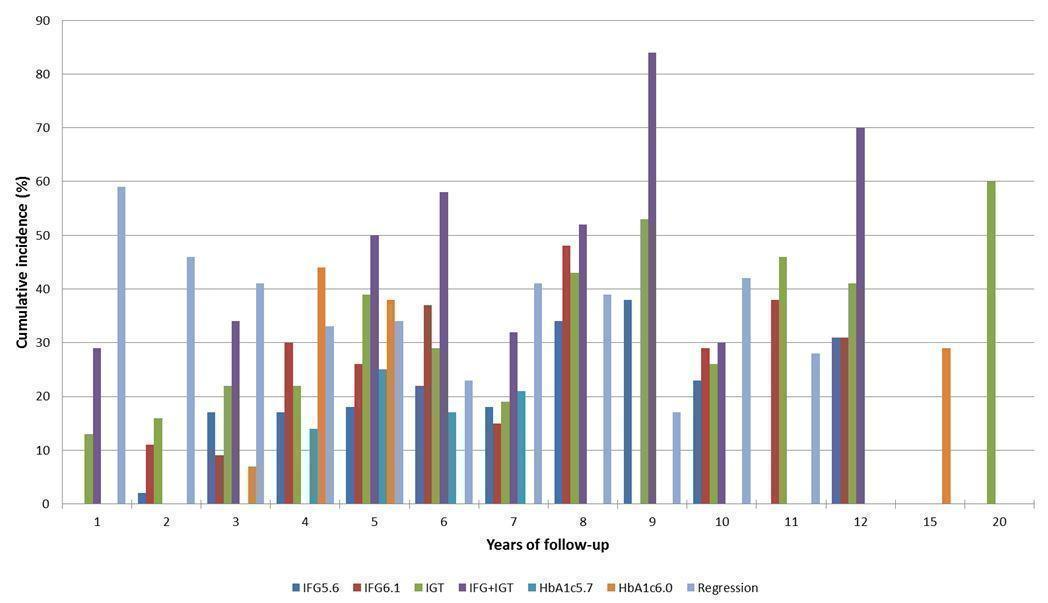
Overall prognosis of people with intermediate hyperglycaemia (cumulative type 2 diabetes incidence and regression to normoglycaemia) associated with measures of intermediate hyperglycaemia
HbA1c5.7/HbA1c6.0: glycosylated haemoglobin A1c 5.7%/6.0% threshold; IFG5.6/6.1: impaired fasting glucose 5.6/6.1 mmol/L threshold; IGT: impaired glucose tolerance

Intermediate hyperglycaemia versus normoglycaemia as a prognostic factor for developing type 2 diabetes (associated with different measures and relative risks of intermediate hyperglycaemia)
HbA1c5.7/HbA1c6.0: glycosylated haemoglobin A1c 5.7%/6.0% threshold; IFG5.6/6.1: impaired fasting glucose 5.6/6.1 mmol/L threshold; IGT: impaired glucose tolerance; IRR: incidence rate ratio; OR: odds ratio; HR: hazard ratio
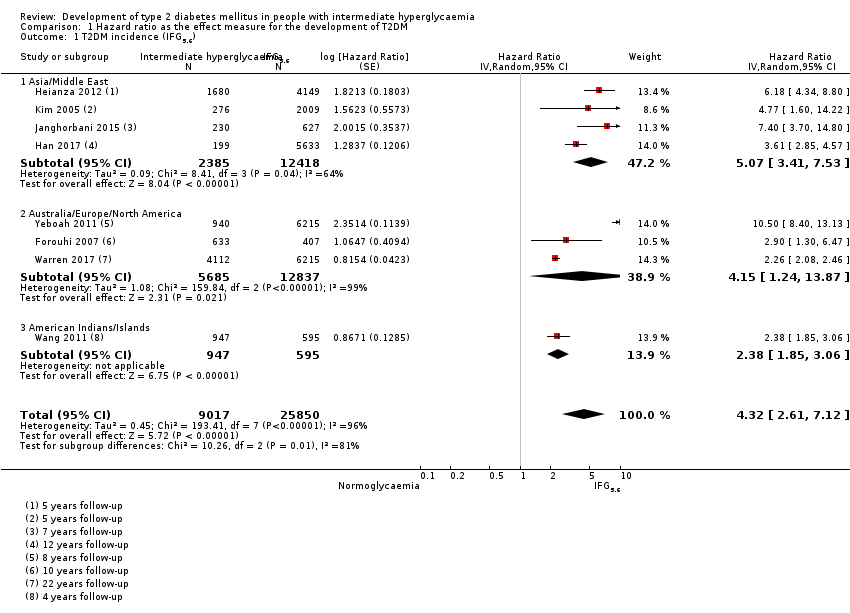
Comparison 1 Hazard ratio as the effect measure for the development of T2DM, Outcome 1 T2DM incidence (IFG5.6).

Comparison 1 Hazard ratio as the effect measure for the development of T2DM, Outcome 2 T2DM incidence (IFG6.1).

Comparison 1 Hazard ratio as the effect measure for the development of T2DM, Outcome 3 T2DM incidence (IGT).

Comparison 1 Hazard ratio as the effect measure for the development of T2DM, Outcome 4 T2DM incidence (IFG + IGT).

Comparison 1 Hazard ratio as the effect measure for the development of T2DM, Outcome 5 T2DM incidence (HbA1c5.7).
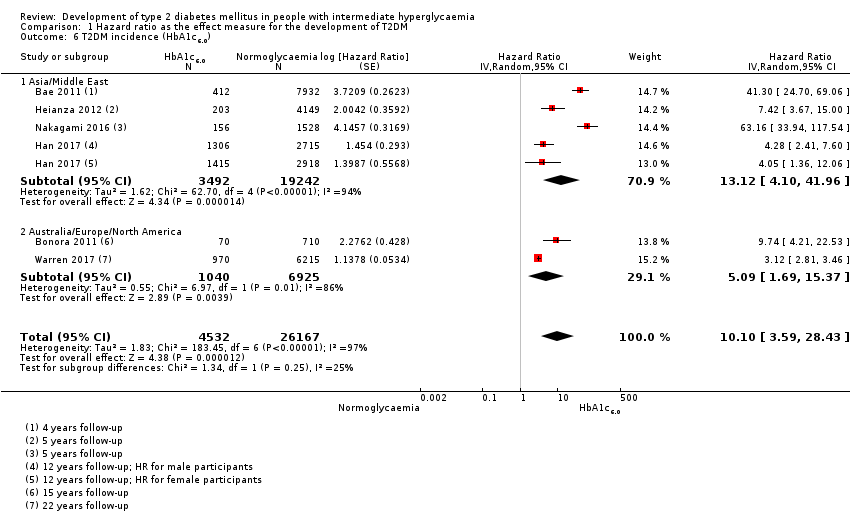
Comparison 1 Hazard ratio as the effect measure for the development of T2DM, Outcome 6 T2DM incidence (HbA1c6.0).
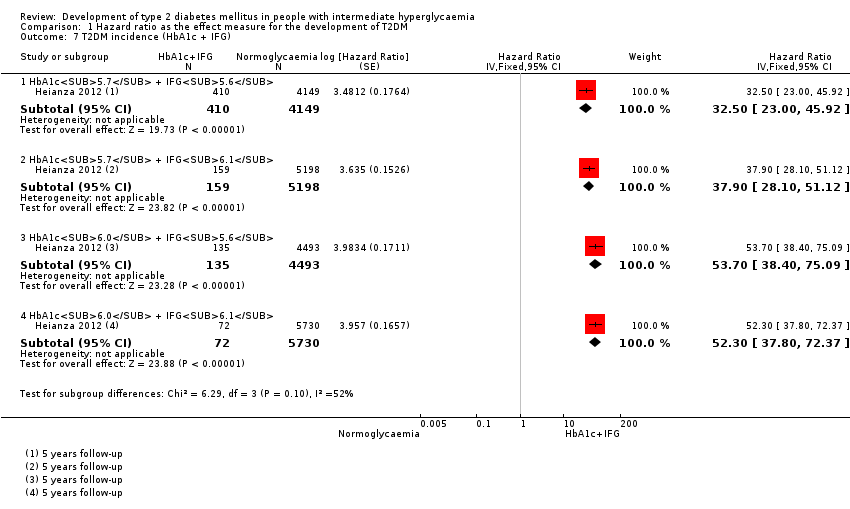
Comparison 1 Hazard ratio as the effect measure for the development of T2DM, Outcome 7 T2DM incidence (HbA1c + IFG).

Comparison 2 Odds ratio as the effect measure for the development of T2DM, Outcome 1 T2DM incidence (IFG5.6).

Comparison 2 Odds ratio as the effect measure for the development of T2DM, Outcome 2 T2DM incidence (IFG6.1).

Comparison 2 Odds ratio as the effect measure for the development of T2DM, Outcome 3 T2DM incidence (IGT).

Comparison 2 Odds ratio as the effect measure for the development of T2DM, Outcome 4 T2DM incidence (IFG + IGT).
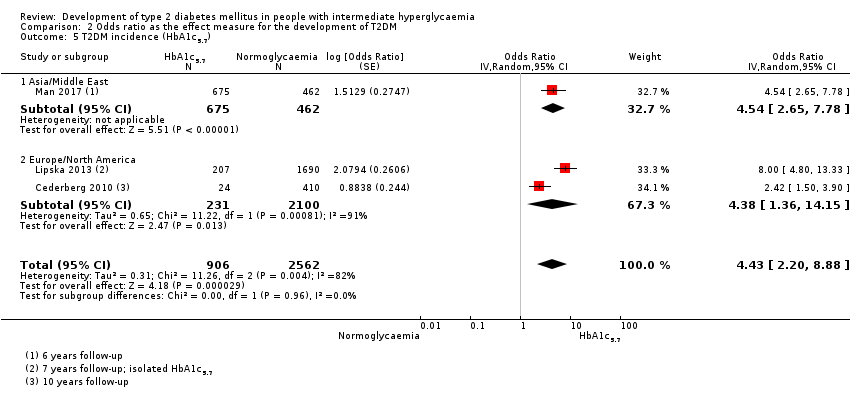
Comparison 2 Odds ratio as the effect measure for the development of T2DM, Outcome 5 T2DM incidence (HbA1c5.7).
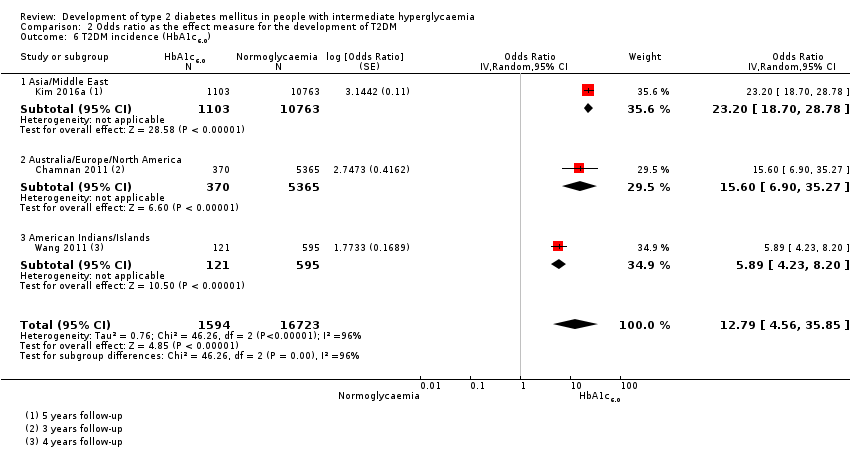
Comparison 2 Odds ratio as the effect measure for the development of T2DM, Outcome 6 T2DM incidence (HbA1c6.0).
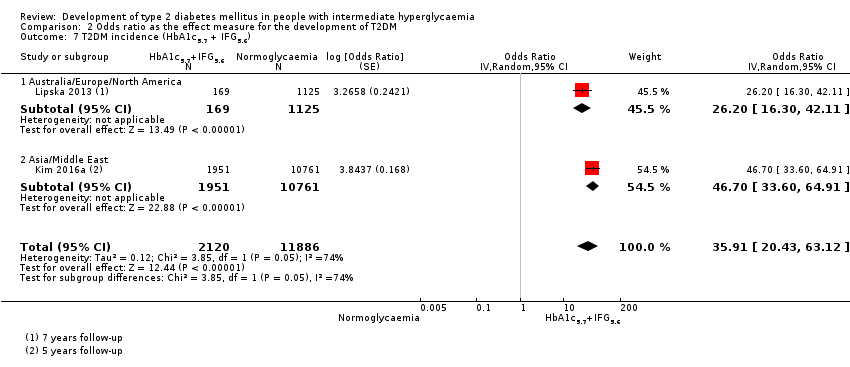
Comparison 2 Odds ratio as the effect measure for the development of T2DM, Outcome 7 T2DM incidence (HbA1c5.7 + IFG5.6).
| Outcome: development of T2DM | ||||||||
| Follow‐up | Cumulative T2DM incidence % (95% CI) | Regression from intermediate hyperglycaemia to normoglycaemia % (95% CI) | Overall certainty of the evidence (GRADE)a | |||||
| IFG5.6 | IFG6.1 | IGT | IFG + IGT | HbA1c5.7 | HbA1c6.0 | |||
| 1 | — | — | 13 (5–23) [3; 671] | 29 (23–36) [1; 207] | — | — | 59 (54–64) [2; 375] | ⊕⊕⊕⊝ |
| 2 | 2 (1–2) [1; 1335] | 11 (8–14) [2; 549] | 16 (9–26) [9; 1998] | — | — | — | 46 (36–55) [9; 2852] | |
| 3 | 17 (6–32) [3; 1091] | 9 (2–20) [3; 927] | 22 (18–27) [3; 417] | 34 (28–41) [1; 209]— | — | 7 (5–10) [1; 370] | 41 (24–69) [7; 1356] | |
| 4 | 17 (13–22) [3; 800] | 30 (17–44) [2; 1567] | 22 (12–34) [5; 1042] | — | 14 (7–23) [3; 5352] | 44 (40–48) [2; 627] | 33 (26–40) [3; 807] | |
| 5 | 18 (10–27) [7; 3530] | 26 (19–33) [11; 3837] | 39 (25–53) [12; 3444] | 50 (37–63) [5; 478] | 25 (18–32) [4; 3524] | 38 (26–51) [3; 1462] | 34 (27–42) [9; 2603] | |
| 6 | 22 (15–31) [4; 738] | 37 (31–43) [5; 279] | 29 (25–34) [7; 775] | 58 (48–67) [4; 106] | 17 (14–20) [1; 675] | — | 23 (3–53) [5; 1328] | |
| 7 | 18 (8–30) [5; 980] | 15 (0–45) [4; 434] | 19 (13–26) [5; 835] | 32 (20–45) [4; 753] | 21 (16–27) [1; 207] | — | 41 (37–45) [4; 679] | |
| 8 | 34 (27–40) [2; 1887] | 48 (31–66) [1;29] | 43 (37–49) [4; 1021] | 52 (47–57) [1; 356] | — | — | 39 (33–44) [2; 328] | |
| 9 | 38 (10–70) [3; 1356] | — | 53 (45–60) [1; 163] | 84 (74–91) [1; 69] | — | — | 17 (14–22) [1; 299] | |
| 10 | 23 (14–33) [6; 1542] | 29 (17–43) [6; 537] | 26 (17–37) [6; 443] | 30 (17–44) [2; 49] | 31 (29–33) [2; 2854] | — | 42 (22–63) [7; 894] | |
| 11 | — | 38 (33–43) [1; 402] | 46 (43–49) [1; 1253] | — | — | — | 28 (17–39) [2; 736] | |
| 12 | 31 (19–34) [3; 433] | 31 (28–33) [1; 1382] | 41 (38–43) [2; 1552] | 70 (63–76) [2; 207] | — | — | — | |
| 15 | — | — | — | — | — | 29 (19–40) [1; 70] | — | |
| 20 | — | — | 60 (5–68) [1; 114] | — | — | — | — | |
| CI: confidence interval; HbA1c5.7 : glycosylated haemoglobin A1c, 5.7% threshold; HbA1c6.0 : glycosylated haemoglobin A1c, 6.0% threshold; IFG5.6 : impaired fasting glucose, 5.6 mmol/L threshold; IFG6.1 : impaired fasting glucose, 6.1 mmol/L threshold; IGT: impaired glucose tolerance; T2DM: type 2 diabetes mellitus. | ||||||||
| GRADE Working Group grades of evidence | ||||||||
| aWith phase 2 explanatory studies aiming to confirm independent associations between the prognostic factor and the outcome, GRADE starts with 'high quality' (Huguet 2013). We assumed the GRADE factor publication bias was inherent with this type of research (phase 2 design), so we did not use it as a potential downgrading factor | ||||||||
| Outcome: development of T2DM | ||||
| No of studies | No of participants with intermediate hyperglycaemia | Geographic region/special population | Estimated effect (95% CI) | Overall certainty of the evidence (GRADE)a |
| HR: 4 IRR: 6 OR: 10 | HR: 2385 IRR: 15,661 OR: 6359 | Asia/Middle East | HR: 5.07 (3.41–4.86) [1.07–24.02] IRR: 5.23 (3.77–7.25) [1.72–15.89] OR: 2.94 (1.77–4.86) [0.43–19.93] | ⊕⊕⊝⊝ |
| HR: 3 IRR: 3 OR: 9 | HR: 5685 IRR: 6322 OR: 1949 | Australia/Europe/North America | HR: 4.15 (1.24–13.9) [N/M] IRR: 4.96 (3.25–7.57) [0.32–77.24] OR: 6.47 (3.81–11.00) [0.99–42.32] | |
| HR: 0 IRR: 0 OR: 1 | HR: 0 IRR: 0 OR: 65 | Latin America | HR: NA IRR: NA OR: 4.28 (3.21–5.71) | |
| HR: 1 IRR: 1 OR: 1 | HR: 947 IRR: 2374 OR: 947 | American Indians/Islands | HR: 2.38 (1.85–3.06) IRR: 2.74 (1.88–3.99) OR: 3.12 (2.31–4.21) | |
| HR: 8 IRR: 10 OR: 21 | HR: 9017 IRR: 24,357 OR: 9320 | Overall | HR: 4.32 (2.61–7.12) [0.75–25.0] IRR: 4.81 (3.67–6.30) [1.95–11.83] OR: 4.15 (2.75–6.28) [0.53–32.4] | |
| CI: confidence interval; HR: hazard ratio;IFG5.6 : impaired fasting glucose 5.6 mmol/L threshold; IRR: incidence rate ratio; NA: not applicable; N/M: fewer than 3 studies or calculation of the 95% prediction interval did not provide a meaningful estimate; OR: odds ratio; T2DM: type 2 diabetes mellitus. | ||||
| GRADE Working Group grades of evidence | ||||
| aWith phase 2 explanatory studies aiming to confirm independent associations between the prognostic factor and the outcome, GRADE starts with 'high quality' (Huguet 2013). We assumed the GRADE factor publication bias was inherent with this type of research (phase 2 design), so we did not use it as a potential downgrading factor | ||||
| Outcome: development of T2DM | ||||
| No of studies | No of participants with intermediate hyperglycaemia | Geographic region/special population | Estimated effect (95% CI) | Overall certainty of |
| HR: 5 IRR: 2 OR: 7 | HR: 1054 IRR: 1677 OR: 3317 | Asia/Middle East | HR: 10.55 (3.61–30.81) [N/M] IRR: 3.62 (1.67–7.83) [N/M] OR: 5.18 (2.32–11.53) [0.29–91.37] | ⊕⊕⊝⊝ |
| HR: 4 IRR: 4 OR: 7 | HR: 1736 IRR: 3438 OR: 1240 | Australia/Europe/North America | HR: 3.30 (2.32–4.67) [0.84–12.99] IRR: 8.55 (6.37–11.48) [4.37–16.73] OR: 8.69 (4.95–15.24) [1.20–62.69] | |
| HR: 0 IRR: 0 OR: 1 | HR: 0 IRR: 0 OR: 17 | Latin America | HR: NA IRR: NA OR: 3.73 (2.18–6.38) | |
| HR: 0 IRR: 0 OR: 0 | HR: 0 IRR: 0 OR: 0 | American Indians/Islands | HR: NA IRR: NA OR: NA | |
| HR: 9 IRR: 6 OR: 15 | HR: 2818 IRR: 5115 OR: 4574 | Overall | HR: 5.47 (3.50–8.54) [1.09–27.56] IRR: 6.82 (4.53–10.25) [2.03–22.87] OR: 6.60 (4.18–10.43) [0.93–46.82] | |
| CI: confidence interval; HR: hazard ratio;IFG6.1 : impaired fasting glucose 6.1 mmol/L threshold; IRR: incidence rate ratio; NA: not applicable; N/M: fewer than 3 studies or calculation of the 95% prediction interval did not provide a meaningful estimate; OR: odds ratio; T2DM: type 2 diabetes mellitus. | ||||
| GRADE Working Group grades of evidence | ||||
| aWith phase 2 explanatory studies aiming to confirm independent associations between the prognostic factor and the outcome, GRADE starts with 'high quality' (Huguet 2013). We assumed the GRADE factor publication bias was inherent with this type of research (phase 2 design), so we did not use it as a potential downgrading factor | ||||
| Outcome: development of T2DM | ||||
| No of studies | No of participants with intermediate hyperglycaemia | Geographic region/special population | Estimated effect (95% CI) | Overall certainty of the evidence (GRADE)a |
| HR: 3 IRR: 5 OR: 6 | HR: 1780 IRR: 14,809 OR: 1226 | Asia/Middle East | HR: 4.48 (2.81–7.15) [N/M] IRR: 3.93 (3.03–5.10) [1.71–9.02] OR: 3.74 (2.83–4.94) [1.70–8.21] | ⊕⊕⊝⊝ |
| HR: 2 IRR: 5 OR: 11 | HR: 2230 IRR: 2572 OR: 1481 | Australia/Europe/North America | HR: 2.53 (1.52–4.19) [N/M] IRR: 5.93 (4.11–8.57) [2.38–14.81] OR: 5.20 (3.62–7.45) [1.50–18.09] | |
| HR: 0 IRR: 0 OR: 2 | HR: 0 IRR: 0 OR: 381 | Latin America | HR: NA IRR: NA OR: 4.94 (3.15–7.76) [N/M] | |
| IRR: 2 | IRR: 1087 | American Indians/Islands | IRR: 4.46 (3.12–6.38) [N/M] OR: 3.60 (1.40–9.26) HR: NA | |
| HR: 5 IRR: 12 OR: 20 | HR: 4010 IRR: 18,468 OR: 3139 | Overall | HR: 3.61 (2.31–5.64) [0.69–18.97] IRR: 4.48 (3.59–5.44) [2.60–7.70] OR: 4.61 (3.76–5.64) [2.10–10.13] | |
| CI: confidence interval; HR: hazard ratio;IGT: impaired glucose tolerance; IRR: incidence rate ratio; NA: not applicable; N/M: fewer than 3 studies or calculation of the 95% prediction interval did not provide a meaningful estimate; T2DM: type 2 diabetes mellitus. | ||||
| GRADE Working Group grades of evidence | ||||
| aWith phase 2 explanatory studies aiming to confirm independent associations between the prognostic factor and the outcome, GRADE starts with 'high quality' (Huguet 2013). We assumed the GRADE factor publication bias was inherent with this type of research (phase 2 design), so we did not use it as a potential downgrading factor | ||||
| Outcome: development of T2DM | ||||
| No of studies | No of participants with intermediate hyperglycaemia | Geographic region/special population | Estimated effect (95% CI) | Overall certainty of the evidence (GRADE)a |
| HR: 3 IRR: 4 OR: 3 | HR: 461 IRR: 3166 OR: 498 | Asia/Middle East | HR: 10.20 (5.45–19.09) [N/M] IRR: 11.20 (5.59–22.43) [N/M] OR: 6.99 (3.09–15.83) [N/M] | ⊕⊕⊝⊝ |
| HR: 1 IRR: 4 OR: 6 | HR: 221 IRR: 699 OR: 154 | Australia/Europe/North America | HR: 3.80 (2.30–6.28) [N/M] IRR: 13.92 (9.99–19.40) [6.71–28.85] OR: 20.95 (12.40–35.40) [4.93–89.05] | |
| HR: 0 IRR: 0 OR: 0 | HR: 0 IRR: 0 OR: 0 | Latin America | HR: NA IRR: NA OR: NA | |
| HR: 1 IRR: 1 | HR: 356 IRR: 605 | American Indians/Islands | HR: 4.06 (3.05–5.40) IRR: 5.18 (3.42–7.83) | |
| HR: 5 IRR: 9 OR: 9 | HR: 1038 IRR: 4470 OR: 652 | Overall | HR: 6.90 (4.15–11.45) [1.06–44.95] IRR: 10.94 (7.22–16.58) [2.58–46.46] OR: 13.14 (7.41–23.30) [1.84–93.66] | |
| CI: confidence interval; HR: hazard ratio;IFG: impaired fasting glucose; IGT: impaired glucose tolerance; IRR: incidence rate ratio; NA: not applicable; N/M: fewer than 3 studies or calculation of the 95% prediction interval did not provide a meaningful estimate; OR: odds ratio; T2DM: type 2 diabetes mellitus. | ||||
| GRADE Working Group grades of evidence | ||||
| aWith phase 2 explanatory studies aiming to confirm independent associations between the prognostic factor and the outcome, GRADE starts with 'high quality' (Huguet 2013). We assumed the GRADE factor publication bias was inherent with this type of research (phase 2 design), so we did not use it as a potential downgrading factor | ||||
| Outcome: development of T2DM | ||||
| No of studies | No of participants with intermediate hyperglycaemia | Geographic region/special population | Estimated effect (95% CI) | Overall certainty of the evidence (GRADE)a |
| HR: 3 IRR: 1 OR: 1 | HR: 3196 IRR: 1965 OR: 675 | Asia/Middle East | HR: 7.21 (5.14–10.11) [0.81–64.52] IRR: 6.62 (4.18–10.49) [N/M] OR: 4.54 (2.65–7.78) [N/M] | ⊕⊕⊝⊝ |
| HR: 1 IRR: 0 OR: 2 | HR: 2027 IRR: 0 OR: 231 | Australia/Europe/North America | HR: 2.71 (2.48–2.96) [N/M] IRR: NA OR: 4.38 (1.36–14.15) [N/M] | |
| HR: 0 IRR: 0 OR: 0 | HR: 0 IRR: 0 OR: 0 | Latin America | HR: NA IRR: NA OR: NA | |
| HR: 0 IRR: 0 OR: 0 | HR: 0 IRR: 0 OR: 0 | American Indians/Islands | HR: NA IRR: NA OR: NA | |
| HR: 4 IRR: 1 OR: 3 | HR: 5223 IRR: 1965 OR: 906 | Overall | HR: 5.55 (2.77–11.12) [0.23–141.18] IRR: 6.62 (4.18–10.49) [N/M] OR: 4.43 (2.20–8.88) [N/M] | |
| CI: confidence interval; HbA1c5.7 : glycosylated haemoglobin A1c 5.7% threshold; HR: hazard ratio;IRR: incidence rate ratio; NA: not applicable; N/M: fewer than 3 studies or calculation of the 95% prediction interval did not provide a meaningful estimate; OR: odds ratio; T2DM: type 2 diabetes mellitus. | ||||
| GRADE Working Group grades of evidence | ||||
| aWith phase 2 explanatory studies aiming to confirm independent associations between the prognostic factor and the outcome, GRADE starts with 'high quality' (Huguet 2013). We assumed the GRADE factor publication bias was inherent with this type of research (phase 2 design), so we did not use it as a potential downgrading factor | ||||
| Outcome: development of T2DM | ||||
| No of studies | No of participants with intermediate hyperglycaemia | Geographic region/special population | Estimated effect (95% CI) | Overall certainty of the evidence (GRADE)a |
| HR: 2 IRR: 0 OR: 1 | HR: 1040 IRR: 0 OR: 370 | Australia/Europe/North America | HR: 5.09 (1.69–15.37) [N/M] IRR: NA OR: 15.60 (6.90–35.27) [N/M] | ⊕⊕⊝⊝ |
| HR: 4 IRR: 0 OR: 1 | HR: 3492 IRR: 0 OR: 1103 | Asia/Middle East | HR: 13.12 (4.10–41.96) [N/M] IRR: NA OR: 23.20 (18.70–28.78) [N/M] | |
| HR: 0 IRR: 0 OR: 0 | HR: 0 IRR: 0 OR: 0 | Latin America | HR: NA IRR: NA OR: NA | |
| IRR: 0 | IRR: 0 HR: 0 | American Indians/Islands | IRR: NA OR: 5.89 (4.23–8.20) [N/M] HR: NA | |
| HR: 6 IRR: 0 OR: 3 | HR: 4532 IRR: 0 OR: 1594 | Overall | HR: 10.10 (3.59–28.43) [N/M] IRR: NA OR: 12.79 [4.56–35.85] [N/M] | |
| CI: confidence interval; HbA1c6.0 : glycosylated haemoglobin A1c 6.0% threshold; HR: hazard ratio;IRR: incidence rate ratio; NA: not applicable; N/M: fewer than 3 studies or calculation of the 95% prediction interval did not provide a meaningful estimate; OR: odds ratio; T2DM: type 2 diabetes mellitus. | ||||
| GRADE Working Group grades of evidence | ||||
| aWith phase 2 explanatory studies aiming to confirm independent associations between the prognostic factor and the outcome, GRADE starts with 'high quality' (Huguet 2013). We assumed the GRADE factor publication bias was inherent with this type of research (phase 2 design), so we did not use it as a potential downgrading factor | ||||
| Follow‐up time (years) | % (95% CI) cumulative T2DM incidence | % (95% CI) regression from IH to normoglycaemia | ||||||
| IFG5.6 | IFG6.1 | IGT | IFG + IGT | HbA1c5.7 | HbA1c6.0 | |||
| 1 | — | — | 13 (5–23) [3; 671] | 29 (23–36) [1; 207] | — | — | 59 (54–64) [2; 375] | |
| 2 | 2 (1–2) [1; 1335] | 11 (8–14) [2; 549] | 16 (9–26) [9; 1998] | — | — | — | 46 (36–55) [9; 2852] | |
| 3 | 17 (6–32) [3; 1091] | 9 (2–20) [3; 927] | 22 (18–27) [3; 417] | 34 (28–41) [1; 209] | — | 7 (5–10) [1; 370] | 41 (24–59) [7; 1356] | |
| 4 | 17 (13–22) [3; 800] | 30 (17–44) [2; 1567] | 22 (12–34) [5; 1042] | — | 14 (7–23) [3; 5352] | 44 (40–48) [2; 627] | 33 (26–40) [3; 807] | |
| 5 | 18 (10–27) [7; 3530] | 26 (19–33) [11; 3837] | 39 (25–53) [12; 3444] | 50 (37–63) [5; 478] | 25 (18–32) [4; 3524] | 38 (26–51) [3; 1462] | 34 (27–42) [9; 2603] | |
| 6 | 22 (15–31) [4; 738] | 37 (31–43) [5; 279] | 29 (25–34) [7; 775] | 58 (48–67) [4; 106] | 17 (14–20) [1; 675] | — | 23 (3–53) [5; 1328] | |
| 7 | 18 (8–30) [5; 980] | 15 (0–45) [4; 434] | 19 (13–26) [5; 835] | 32 (20–45) [4; 753] | 21 (16–27) [1; 207] | — | 41 (37–45) [4; 679] | |
| 8 | 34 (27–40) [2; 1887] | 48 (31–66) [1;29] | 43 (37–49) [4; 1021] | 52 (47–57) [1; 356] | — | — | 39 (33–44) [2; 328] | |
| 9 | 38 (10–70) [3; 1356] | — | 53 (45–60) [1; 163] | 84 (74–91) [1; 69] | — | — | 17 (14–22) [1; 299] | |
| 10 | 23 (14–33) [6; 1542] | 29 (17–43) [6; 537] | 26 (17–37) [6; 443] | 30 (17–44) [2; 49] | 31 (29–33) [2; 2854] | — | 42 (22–63) [7; 894] | |
| 11 | — | 38 (33–43) [1; 402] | 46 (43–49) [1; 1253] | — | — | — | 28 (17–39) [2; 736] | |
| 12 | 31 (19–34) [3; 433] | 31 (28–33) [1; 1382] | 41 (38–43) [2; 1552] | 70 (63–76) [2; 207] | — | — | — | |
| 15 | — | — | — | — | — | 29 (19–40) [1; 70] | — | |
| 20 | — | — | 60 (5–68) [1; 114] | — | — | — | — | |
| CI: confidence interval; HbA1c: glycosylated haemoglobin A1c; HbA1c5.7/6.0 (threshold 5.7% or 6.0%); IFG5.6/6.1 : impaired fasting glucose (threshold 5.6 mmol/L or 6.1 mmol/L); IGT: impaired glucose tolerance; IFG + IGT: both IFG and IGT; IH: intermediate hyperglycaemia; T2DM: type 2 diabetes mellitus | ||||||||
| Ratio (95% CI) [no of studies; no of participants with IH/no of participants with normoglycaemia] | |||||||
| Hazard ratio | |||||||
| Region | IFG5.6 cohort | IFG6.1 cohort | IGT cohort | IFG + IGT cohort | HbA1c5.7 cohort | HbA1c6.0 cohort | HbA1c5.7 + IFG5.6 cohort |
| Asia/Middle East | 5.07 (3.41‐7.53) 1.07–24.02 [4; 2385/12,837] | 10.55 (3.61–30.81) NAb [5; 1054/9756] | 4.48 (2.81–7.15) NAb [3; 1780/6695] | 10.20 (5.45–19.09) NAb [3; 461/6695] | 7.21 (5.14–10.11) 0.81–64.52 [3; 3196/13,609] | 13.12 (4.10–41.96) NAb [4; 3492/19,242] | 32.50 (23.00–45.92)c NAa [1; 410/4149] |
| Australia/Europe/North America | 4.15 (1.24–13.87) NAb [3; 5685/12,837] | 3.30 (2.32–4.67) 0.84–12.99 [4; 1736/8835] | 2.53 (1.52–4.19) NAa [2; 2230/5871] | 3.80 (2.30–6.28) NAa [1; 221/1429] | 2.71 (2.48–2.96) NAa [1: 2027/6215] | 5.09 (1.69–15.37) NAa [2; 1040/6925] | — |
| Latin America | — | 2.06 (1.76–2.41) NAb | — | — | — | — | — |
| American Indians/Islands | 2.38 (1.85–3.06) NAa [1; 947/595] | — | — | 4.06 (3.05–5.40) NAa [1; 356/595] | — | — | — |
| Overall | 4.32 (2.61–7.12) 0.75–25.01 [8; 9017/25,850] | 5.47 (3.50–8.54) 1.09–27.56 [9; 2818/18,591] | 3.61 (2.31–5.64) 0.69–18.97 [5; 4010/12,566] | 6.90 (4.15–11.45) 1.06–44.95 [5; 1038/8719] | 5.55 (2.77–11.12) 0.23–141.18 [4; 5223/19,824] | 10.10 (3.59–28.43) NAb [6; 4532/26,167] | 32.50 (23.00–45.92) NAa [1; 410/4149] |
| Incidence rate ratio | |||||||
| Region | IFG5.6 cohort | IFG6.1 cohort | IGT cohort | IFG + IGT cohort | HbA1c5.7 cohort | HbA1c6.0 cohort | HbA1c5.7 + IFG5.6 cohort |
| Asia/Middle East | 5.23 (3.77–7.25) 1.72–15.89 [6; 15,661/145,597] | 3.62 (1.67–7.83) NAa [2; 1677/36,334] | 3.93 (3.03–5.10) 1.71–9.02 [5; 14,809/73,128] | 11.20 (5.59–22.43) NAb [4; 3166/69,463] | 6.62 (4.18–10.49) NAa [1; 1965/19961] | — | 40.72 (29.30–56.61) NAa [1; 1641/19,961] |
| Australia/Europe/North America | 4.96 (3.25–7.57) 0.32–77.24 [3; 6322/8062] | 8.55 (6.37–11.48) 4.37–16.73 [4; 3438/20,246] | 5.93 (4.11–8.57) 2.38–14.81 [5; 2572/22,329] | 13.92 (9.99–19.40) 6.71–28.85 [4; 699/18,966] | — | — | — |
| Latin America | — | — | — | — | — | — | — |
| American Indians/Islands | 2.74 (1.88–3.99) NAa [1; 2374/1613] | — | 4.46 (3.12–6.38) NAa [2; 1087/2952] | 5.18 (3.42–7.83) NAa [1; 605/1613] | — | — | — |
| Overall | 4.81 (3.67–6.30) 1.95–11.83 [10; 24,357/155,272] | 6.82 (4.53–10.25) 2.03–22.87 [6; 5115/56,580] | 4.48 (3.69–5.44) 2.60–7.70 [12; 18,468/98,409] | 10.94 (7.22–16.58) 2.58–46.46 [9; 4470/90,072] | 6.62 (4.18–10.5) NAa [1; 1965/19961] | — | 40.72 (29.30–56.61) NAa [1; 1641/19,961] |
| Odds ratio | |||||||
| IFG5.6 cohort | IFG6.1 cohort | IGT cohort | IFG + IGT cohort | HbA1c5.7 cohort | HbA1c6.0 cohort | HbA1c5.7 + IFG5.6 cohort | |
| Asia/Middle East | 2.94 (1.77–4.86) 0.43–19.93 [10; 6359/28,218] | 5.18 (2.32–11.53) 0.29–91.37 [7; 3317/25,604] | 3.74 (2.83–4.94) 1.70–8.21 [6; 1226/7417] | 6.99 (3.09–15.83) NAb [3; 498/3704] | 4.54 (2.65–7.78) NAa [1; 675/462] | 23.20 (18.70–28.78) NAa [1; 1103/10,763] | 46.70 (33.60–64.91) NAa [1; 1951/10,761] |
| Australia/Europe/North America | 6.47 (3.81–11.00) 0.99–42.32 [9; 1949/7920] | 8.69 (4.95–15.24) 1.20–62.69 [7; 1240/5094] | 5.20 (3.62–7.45) 1.50–18.09 [11; 1481/7684] | 20.95 (12.40–35.40) 4.93–89.05 [6; 154/5300] | 4.38 (1.36–14.15) NAa [2; 231/2100] | 15.60 (6.90–35.27) NAa [1; 370/5365] | 26.20 (16.30–41.11) NAa [1; 169/1125] |
| Latin America | 4.28 (3.21–5.71) NAa [1; 65/1594] | 3.73 (2.18–6.38) NAa [1; 17/1594] | 4.94 (3.15–7.76) NAa [2; 381/3097] | — | — | — | — |
| American Indians/Islands | 3.12 (2.31–4.21) NAa [1; 947/595] | — | 3.60 (1.40–9.26) NAa [1; 51/215] | — | — | 5.89 (4.23–8.20) NAa [1; 121/595] | — |
| Overall | 4.15 (2.75–6.28) 0.54–32.00 [21; 9320/38,327] | 6.60 (4.18–10.43) 0.93–46.82 [15; 4574/32,292] | 4.61 (3.76–5.64) 2.10–10.13 [20; 3139/18,413] | 13.14 (7.41–23.30) 1.84–93.66 [9; 652/9004] | 4.43 (2.20–8.88) NAb [3; 906/2562] | 12.8 [4.56–35.9] NAb [3; 1594/16,723] | 35.91 (20.43–63.12) NAa [2; 2120/11,886] |
| CI: confidence interval; HbA1c: glycosylated haemoglobin A1c; HbA1c5.7/6.0 (threshold 5.7% or 6.0%); HbA1c5.7 + IFG5.6 : both HbA1c5.7 and IFG5.6; IFG5.6/6.1 : impaired fasting glucose (threshold 5.6 mmol/L or 6.1 mmol/L); IGT: impaired glucose tolerance; IFG + IGT: both IFG and IGT; IH: intermediate hyperglycaemia; NA: not applicable; T2DM: type 2 diabetes mellitus; NR: not reported | |||||||
| Outcome or subgroup title | No. of studies | No. of participants | Statistical method | Effect size |
| 1 T2DM incidence (IFG5.6) Show forest plot | 8 | 34867 | Hazard Ratio (Random, 95% CI) | 4.32 [2.61, 7.12] |
| 1.1 Asia/Middle East | 4 | 14803 | Hazard Ratio (Random, 95% CI) | 5.07 [3.41, 7.53] |
| 1.2 Australia/Europe/North America | 3 | 18522 | Hazard Ratio (Random, 95% CI) | 4.15 [1.24, 13.87] |
| 1.3 American Indians/Islands | 1 | 1542 | Hazard Ratio (Random, 95% CI) | 2.38 [1.85, 3.06] |
| 2 T2DM incidence (IFG6.1) Show forest plot | 10 | 21475 | Hazard Ratio (Random, 95% CI) | 5.47 [3.50, 8.54] |
| 2.1 Asia/Middle East | 5 | 10810 | Hazard Ratio (Random, 95% CI) | 10.55 [3.61, 30.81] |
| 2.2 Australia/Europe/North America | 4 | 10571 | Hazard Ratio (Random, 95% CI) | 3.30 [2.32, 4.67] |
| 2.3 Latin America | 1 | 94 | Hazard Ratio (Random, 95% CI) | 2.06 [1.76, 2.41] |
| 3 T2DM incidence (IGT) Show forest plot | 5 | 16576 | Hazard Ratio (Random, 95% CI) | 3.61 [2.31, 5.64] |
| 3.1 Asia/Middle East | 3 | 8475 | Hazard Ratio (Random, 95% CI) | 4.48 [2.81, 7.15] |
| 3.2 Australia/Europe/North America | 2 | 8101 | Hazard Ratio (Random, 95% CI) | 2.53 [1.52, 4.19] |
| 4 T2DM incidence (IFG + IGT) Show forest plot | 5 | 9757 | Hazard Ratio (Random, 95% CI) | 6.90 [4.15, 11.45] |
| 4.1 Asia/Middle East | 3 | 7156 | Hazard Ratio (Random, 95% CI) | 10.20 [5.45, 19.09] |
| 4.2 Australia/Europe/North America | 1 | 1650 | Hazard Ratio (Random, 95% CI) | 3.80 [2.30, 6.28] |
| 4.3 American Indians/Islands | 1 | 951 | Hazard Ratio (Random, 95% CI) | 4.06 [3.05, 5.40] |
| 5 T2DM incidence (HbA1c5.7) Show forest plot | 4 | 25047 | Hazard Ratio (Random, 95% CI) | 5.55 [2.77, 11.12] |
| 5.1 Asia | 3 | 16805 | Hazard Ratio (Random, 95% CI) | 7.21 [5.14, 10.11] |
| 5.2 Australia/Europe/North America | 1 | 8242 | Hazard Ratio (Random, 95% CI) | 2.71 [2.48, 2.96] |
| 6 T2DM incidence (HbA1c6.0) Show forest plot | 6 | 30699 | Hazard Ratio (Random, 95% CI) | 10.10 [3.59, 28.43] |
| 6.1 Asia/Middle East | 4 | 22734 | Hazard Ratio (Random, 95% CI) | 13.12 [4.10, 41.96] |
| 6.2 Australia/Europe/North America | 2 | 7965 | Hazard Ratio (Random, 95% CI) | 5.09 [1.69, 15.37] |
| 7 T2DM incidence (HbA1c + IFG) Show forest plot | 1 | Hazard Ratio (Fixed, 95% CI) | Subtotals only | |
| 7.1 HbA1c5.7 + IFG5.6 | 1 | 4559 | Hazard Ratio (Fixed, 95% CI) | 32.50 [23.00, 45.92] |
| 7.2 HbA1c5.7 + IFG6.1 | 1 | 5357 | Hazard Ratio (Fixed, 95% CI) | 37.90 [28.10, 51.12] |
| 7.3 HbA1c6.0 + IFG5.6 | 1 | 4628 | Hazard Ratio (Fixed, 95% CI) | 53.70 [38.40, 75.09] |
| 7.4 HbA1c6.0 + IFG6.1 | 1 | 5802 | Hazard Ratio (Fixed, 95% CI) | 52.30 [37.80, 72.37] |
| Outcome or subgroup title | No. of studies | No. of participants | Statistical method | Effect size |
| 1 T2DM incidence (IFG5.6) Show forest plot | 21 | 47647 | Odds Ratio (Random, 95% CI) | 4.15 [2.75, 6.28] |
| 1.1 Asia/Middle East | 10 | 34577 | Odds Ratio (Random, 95% CI) | 2.94 [1.77, 4.86] |
| 1.2 Australia/Europe/North America | 9 | 9869 | Odds Ratio (Random, 95% CI) | 6.47 [3.81, 11.00] |
| 1.3 Latin America | 1 | 1659 | Odds Ratio (Random, 95% CI) | 4.28 [3.21, 5.71] |
| 1.4 American Indians/Islands | 1 | 1542 | Odds Ratio (Random, 95% CI) | 3.12 [2.31, 4.21] |
| 2 T2DM incidence (IFG6.1) Show forest plot | 15 | 36866 | Odds Ratio (Random, 95% CI) | 6.60 [4.18, 10.43] |
| 2.1 Asia/Middle East | 7 | 28921 | Odds Ratio (Random, 95% CI) | 5.18 [2.32, 11.53] |
| 2.2 Australia/Europe/North America | 7 | 6334 | Odds Ratio (Random, 95% CI) | 8.69 [4.95, 15.24] |
| 2.3 Latin America | 1 | 1611 | Odds Ratio (Random, 95% CI) | 3.73 [2.18, 6.38] |
| 3 T2DM incidence (IGT) Show forest plot | 20 | 21552 | Odds Ratio (Random, 95% CI) | 4.61 [3.76, 5.64] |
| 3.1 Asia/Middle East | 6 | 8643 | Odds Ratio (Random, 95% CI) | 3.74 [2.83, 4.94] |
| 3.2 Australia/Europe/North America | 11 | 9165 | Odds Ratio (Random, 95% CI) | 5.20 [3.62, 7.45] |
| 3.3 Latin America | 2 | 3478 | Odds Ratio (Random, 95% CI) | 4.94 [3.15, 7.76] |
| 3.4 American Indians/Islands | 1 | 266 | Odds Ratio (Random, 95% CI) | 3.60 [1.40, 9.26] |
| 4 T2DM incidence (IFG + IGT) Show forest plot | 9 | 9656 | Odds Ratio (Random, 95% CI) | 13.14 [7.41, 23.30] |
| 4.1 Asia/Middle East | 3 | 4202 | Odds Ratio (Random, 95% CI) | 6.99 [3.09, 15.83] |
| 4.2 Australia/Europe/North America | 6 | 5454 | Odds Ratio (Random, 95% CI) | 20.95 [12.40, 35.40] |
| 5 T2DM incidence (HbA1c5.7) Show forest plot | 3 | 3468 | Odds Ratio (Random, 95% CI) | 4.43 [2.20, 8.88] |
| 5.1 Asia/Middle East | 1 | 1137 | Odds Ratio (Random, 95% CI) | 4.54 [2.65, 7.78] |
| 5.2 Europe/North America | 2 | 2331 | Odds Ratio (Random, 95% CI) | 4.38 [1.36, 14.15] |
| 6 T2DM incidence (HbA1c6.0) Show forest plot | 3 | 18317 | Odds Ratio (Random, 95% CI) | 12.79 [4.56, 35.85] |
| 6.1 Asia/Middle East | 1 | 11866 | Odds Ratio (Random, 95% CI) | 23.20 [18.70, 28.78] |
| 6.2 Australia/Europe/North America | 1 | 5735 | Odds Ratio (Random, 95% CI) | 15.60 [6.90, 35.27] |
| 6.3 American Indians/Islands | 1 | 716 | Odds Ratio (Random, 95% CI) | 5.89 [4.23, 8.20] |
| 7 T2DM incidence (HbA1c5.7 + IFG5.6) Show forest plot | 2 | 14006 | Odds Ratio (Random, 95% CI) | 35.91 [20.43, 63.12] |
| 7.1 Australia/Europe/North America | 1 | 1294 | Odds Ratio (Random, 95% CI) | 26.20 [16.30, 42.11] |
| 7.2 Asia/Middle East | 1 | 12712 | Odds Ratio (Random, 95% CI) | 46.70 [33.60, 64.91] |