Desarrollo de diabetes mellitus tipo 2 en pacientes con hiperglucemia intermedia
Referencias
References to studies included in this review
References to studies excluded from this review
References to studies awaiting assessment
References to ongoing studies
Additional references
Characteristics of studies
Characteristics of included studies [ordered by study ID]
| Name of study | Surinamese in the Netherlands: study on health and ethnicity/healthy life in an urban setting (SUNSET/HELIUS) | |
| Inclusion criteria | Participants of 2 studies (SUNSET and HELIUS), Surinamese and ethnic Dutch, southeast Amsterdam, aged 35–60 years with completed interviews and medical examinations at baseline and follow‐up | |
| Exclusion criteria | Missing FPG data, diabetes | |
| Notes | Baseline data for total cohort included in the analyses (N = 456): South‐Asian Surinamese (N = 90), African Surinamese (N = 190), ethnic Dutch (N = 176) | |
| Risk of bias | ||
| Bias | Authors' judgement | Support for judgement |
| Study participation: description of source population or population of interest | Low risk | Surinamese in the Netherlands study |
| Study participation: description of glycaemic status at baseline | Low risk | 456 participants available for analysis; table 1 specifies people with IFG5.7 |
| Study participation: adequate description of sampling frame & recruitment | Low risk | Random sample of 2975 Surinamese and ethnic Dutch individuals, aged 35–60, drawn from the population register of 2 neighbourhoods in southeast Amsterdam |
| Study participation: adequate description of period & recruitment place | Low risk | Yes |
| Study participation: adequate description of inclusion & exclusion criteria | Low risk | Inclusion and exclusion criteria specified |
| Study attrition: description of attempts to collect information on participants who dropped out | Low risk | Those who were lost to follow‐up were younger, had a higher BMI and greater waist circumference, a higher FPG and more often had baseline IFG than those with follow‐up data available after 10 years |
| Study attrition: reasons for loss to follow‐up provided | Low risk | 777/1444 lost to follow‐up (moved outside of Amsterdam, declined to participate, died, non‐response); figure S1 |
| Study attrition: adequate description of participants lost to follow‐up | Low risk | Reported in Table S2 |
| Study attrition: no important differences between participants who completed the study and those who did not | Unclear risk | See above |
| Glycaemic status measurement: provision of clear definition or description of glycaemic status | Low risk | IFG |
| Glycaemic status measurement: valid and reliable method of glycaemic status measurement | Low risk | FPG measurement by G6PD test |
| Glycaemic status measurement: continuous variables reported or appropriate cut points used | Low risk | IFG: FPG 5.7–6.9 |
| Glycaemic status measurement: same method and setting of measurement of the glycaemic status for all study participants | Low risk | Yes |
| Outcome measurement: clear definition of the outcome provided | Low risk | FPG ≥ 7.0; HbA1c ≥ 6.5; self‐reported T2DM |
| Outcome measurement: method of outcome measurement used valid & reliable | Low risk | Reliable measurement |
| Outcome measurement: same method & setting of outcome measurement for all study participants | Low risk | Yes |
| Study confounding: important confounders measured | Unclear risk | Limited number of confounders measured |
| Study confounding: clear definitions of important confounders provided | Low risk | Yes |
| Study confounding: measurement of confounders valid & reliable | Low risk | Yes |
| Study confounding: same method & setting for measurements of confounders for all study participants | Low risk | Yes |
| Study confounding: appropriate methods used if missing confounder data imputed | Unclear risk | Not reported |
| Study confounding: important potential confounders accounted for in study design | Low risk | Adjustment for sex, age, BMI and change in BMI after 10 years |
| Study confounding: important potential confounders accounted for in the analysis | Low risk | Unadjusted and adjusted analyses |
| Statistical analysis & reporting: sufficient presentation of data to assess adequacy of the analytic strategy | Low risk | Cumulative incidence, odds ratio |
| Statistical analysis & reporting: the statistical model is adequate for the design of the study | Low risk | Multivariate logistic regression |
| Name of study | None | |
| Inclusion criteria | Eymployees of the Electric Generation Authority Bangkok, Thailand aged ≥ 35 years ('exploratory cohort'); middle‐income social class | |
| Exclusion criteria | Diabetes at baseline | |
| Notes | Baseline data for cohort becoming diabetic (N = 361) | |
| Risk of bias | ||
| Bias | Authors' judgement | Support for judgement |
| Study participation: description of source population or population of interest | Low risk | Cohort study of employees of the Electric Generation Authority of Bangkok, Thailand |
| Study participation: description of glycaemic status at baseline | Low risk | Yes |
| Study participation: adequate description of sampling frame & recruitment | Low risk | 3499 employees aged ≥ 35 years; mostly urban dwellers of middle‐income social class |
| Study participation: adequate description of period & recruitment place | Low risk | Yes |
| Study participation: adequate description of inclusion & exclusion criteria | Low risk | Inclusion and exclusion criteria specified |
| Study attrition: description of attempts to collect information on participants who dropped out | Low risk | Of 3254 participants without diabetes at baseline, 2667 took part in the 1997 survey |
| Study attrition: reasons for loss to follow‐up provided | Low risk | Yes |
| Study attrition: adequate description of participants lost to follow‐up | Low risk | Individuals lost to follow‐up were slightly older |
| Study attrition: no important differences between participants who completed the study and those who did not | Unclear risk | Unclear, limited data only |
| Glycaemic status measurement: provision of clear definition or description of glycaemic status | Low risk | 2‐h OGTT after 75‐g glucose load |
| Glycaemic status measurement: valid and reliable method of glycaemic status measurement | Low risk | Glucose oxidase method |
| Glycaemic status measurement: continuous variables reported or appropriate cut points used | Low risk | IFG: FPG ≥ 5.6 to < 7.0; IGT: 2‐h PG ≥ 7.8 to < 11.1 |
| Glycaemic status measurement: same method and setting of measurement of the glycaemic status for all study participants | Low risk | Yes |
| Outcome measurement: clear definition of the outcome provided | Low risk | FPG ≥ 7.0 or 2‐h glucose ≥ 11.1; development of T2DM during the follow‐up period until 1997 according to FPG or diagnosis and/or receipt of diabetes medication during follow‐up |
| Outcome measurement: method of outcome measurement used valid & reliable | Low risk | Yes |
| Outcome measurement: same method & setting of outcome measurement for all study participants | Low risk | Yes |
| Study confounding: important confounders measured | Unclear risk | Limited number of confounders |
| Study confounding: clear definitions of important confounders provided | Low risk | Yes |
| Study confounding: measurement of confounders valid & reliable | Low risk | Yes |
| Study confounding: same method & setting for measurements of confounders for all study participants | Low risk | Yes |
| Study confounding: appropriate methods used if missing confounder data imputed | Unclear risk | Not reported |
| Study confounding: important potential confounders accounted for in study design | Low risk | Age, sex, BMI, waist circumference, smoking status, drinking status, family history, hypertension |
| Study confounding: important potential confounders accounted for in the analysis | Low risk | Yes; IFG status (model 2) and IGT status (model 3) |
| Statistical analysis & reporting: sufficient presentation of data to assess adequacy of the analytic strategy | Low risk | Odds ratio |
| Statistical analysis & reporting: the statistical model is adequate for the design of the study | Low risk | Multivariable logistic regression |
| Name of study | None | |
| Inclusion criteria | Community‐based survey of cardiovascular risk factors in 4 Jordanian towns, individuals aged ≥ 25 years; follow‐up on one of the town (Sikhra) and matched control group with non‐IGT (normal) individuals from initial survey | |
| Exclusion criteria | Diabetes | |
| Notes | Few baseline data reported for total study population (N = 212) | |
| Risk of bias | ||
| Bias | Authors' judgement | Support for judgement |
| Study participation: description of source population or population of interest | Low risk | 4 community‐based survey of cardiovascular risk factors in 4 Jordanian towns |
| Study participation: description of glycaemic status at baseline | Low risk | Community‐based survey of cardiovascular risk factors in 4 Jordanian towns |
| Study participation: adequate description of sampling frame & recruitment | Low risk | Yes |
| Study participation: adequate description of period & recruitment place | Low risk | Yes |
| Study participation: adequate description of inclusion & exclusion criteria | Low risk | Inclusion and exclusion criteria described |
| Study attrition: description of attempts to collect information on participants who dropped out | High risk | Scarce data |
| Study attrition: reasons for loss to follow‐up provided | Low risk | Yes |
| Study attrition: adequate description of participants lost to follow‐up | Unclear risk | Not described (some comparison of participants with non‐participants) |
| Study attrition: no important differences between participants who completed the study and those who did not | Unclear risk | Not described |
| Glycaemic status measurement: provision of clear definition or description of glycaemic status | Low risk | IGT |
| Glycaemic status measurement: valid and reliable method of glycaemic status measurement | Low risk | FPG and 2‐h 75 g OGTT |
| Glycaemic status measurement: continuous variables reported or appropriate cut points used | Low risk | IGT: 2‐h PG 7.8 to < 11.1 (WHO 1985) |
| Glycaemic status measurement: same method and setting of measurement of the glycaemic status for all study participants | Low risk | Yes |
| Outcome measurement: clear definition of the outcome provided | Low risk | 2‐h PG ≥ 11.1 (WHO 1985) |
| Outcome measurement: method of outcome measurement used valid & reliable | Low risk | Yes |
| Outcome measurement: same method & setting of outcome measurement for all study participants | Low risk | Yes (probably FPG and 2‐h OGTT was also measured at follow‐up) |
| Study confounding: important confounders measured | Unclear risk | Some baseline parameters were investigated (hypercholesterolaemia, hypertriglyceridaemia, obesity, hypertension, family history of diabetes) |
| Study confounding: clear definitions of important confounders provided | Unclear risk | Scarce data |
| Study confounding: measurement of confounders valid & reliable | Unclear risk | Scarce data |
| Study confounding: same method & setting for measurements of confounders for all study participants | Unclear risk | Cumulative incidence |
| Study confounding: appropriate methods used if missing confounder data imputed | Unclear risk | Not reported |
| Study confounding: important potential confounders accounted for in study design | Unclear risk | Not reported |
| Study confounding: important potential confounders accounted for in the analysis | Unclear risk | Not reported |
| Statistical analysis & reporting: sufficient presentation of data to assess adequacy of the analytic strategy | Low risk | Cumulative incidence |
| Statistical analysis & reporting: the statistical model is adequate for the design of the study | Unclear risk | Not reported |
| Name of study | Chennai Urban Rural Epidemiology Study (CURES) | |
| Inclusion criteria | Representative sample from Chennai, ≥ 20 years of age | |
| Exclusion criteria | Diabetes at baseline, unknown glycaemic status | |
| Notes | Baseline data for cohort becoming diabetic at follow‐up (N = 176) | |
| Risk of bias | ||
| Bias | Authors' judgement | Support for judgement |
| Study participation: description of source population or population of interest | Low risk | Chennai Urban Rural Epidemiology Study |
| Study participation: description of glycaemic status at baseline | Low risk | 299 with 'prediabetes' |
| Study participation: adequate description of sampling frame & recruitment | Low risk | Representative sample from Chennai, ≥ 20 years |
| Study participation: adequate description of period & recruitment place | Low risk | Yes |
| Study participation: adequate description of inclusion & exclusion criteria | Low risk | Inclusion and exclusion criteria specified |
| Study attrition: description of attempts to collect information on participants who dropped out | Low risk | Yes |
| Study attrition: reasons for loss to follow‐up provided | Low risk | Yes |
| Study attrition: adequate description of participants lost to follow‐up | High risk | Not reported |
| Study attrition: no important differences between participants who completed the study and those who did not | Unclear risk | Not reported |
| Glycaemic status measurement: provision of clear definition or description of glycaemic status | Low risk | i‐IFG, i‐IGT, IFG/IGT |
| Glycaemic status measurement: valid and reliable method of glycaemic status measurement | Low risk | Yes |
| Glycaemic status measurement: continuous variables reported or appropriate cut points used | Low risk | i‐IGT: 2‐h PG 7.8–11.0 and FPG > 5.6; i‐IFG: FPG 5.6–6.9 and 2‐h PG < 7.8; prediabetes: FPG 5.6–6.9 or 2‐h PG 7.8–11.0 (i‐IGT or i‐IFG or IFG/IGT) |
| Glycaemic status measurement: same method and setting of measurement of the glycaemic status for all study participants | Low risk | Yes |
| Outcome measurement: clear definition of the outcome provided | Low risk | FPG ≥ 7.0; 2‐h PG ≥ 11.1; diagnosed; antihyperglycaemic medication |
| Outcome measurement: method of outcome measurement used valid & reliable | Low risk | Yes |
| Outcome measurement: same method & setting of outcome measurement for all study participants | Low risk | Yes |
| Study confounding: important confounders measured | Unclear risk | For IFG/IGT, several confounders measured as predictors for incident diabetes |
| Study confounding: clear definitions of important confounders provided | Low risk | Yes |
| Study confounding: measurement of confounders valid & reliable | Low risk | Yes |
| Study confounding: same method & setting for measurements of confounders for all study participants | Low risk | Yes |
| Study confounding: appropriate methods used if missing confounder data imputed | Unclear risk | Not reported |
| Study confounding: important potential confounders accounted for in study design | Unclear risk | Cox proportional hazards model for various single factors |
| Study confounding: important potential confounders accounted for in the analysis | Unclear risk | Univariate analyses |
| Statistical analysis & reporting: sufficient presentation of data to assess adequacy of the analytic strategy | Low risk | Cumulative incidence, incidence rate |
| Statistical analysis & reporting: the statistical model is adequate for the design of the study | Unclear risk | Cox proportional hazards model, univariate analyses for single variables |
| Name of study | None | |
| Inclusion criteria | Individuals who participated in comprehensive health check‐ups annually for 5 years | |
| Exclusion criteria | Anaemia with a haemoglobin level < 7.4 mmol/L; self‐reported diabetes and undiagnosed diabetes (FPG concentration 7.0 mmol/l or HbA1c 6.5%; absence of HbA1c data at any visit | |
| Notes | Baseline data for total cohort | |
| Risk of bias | ||
| Bias | Authors' judgement | Support for judgement |
| Study participation: description of source population or population of interest | Low risk | Participants partially undergoing annual or biannual health check‐ups (Kangbuk Samsung Hospital Total,Healthcare Center) |
| Study participation: description of glycaemic status at baseline | Low risk | Yes |
| Study participation: adequate description of sampling frame & recruitment | Unclear risk | Scarce data |
| Study participation: adequate description of period & recruitment place | Low risk | Yes |
| Study participation: adequate description of inclusion & exclusion criteria | Low risk | Inclusion and exclusion criteria described |
| Study attrition: description of attempts to collect information on participants who dropped out | Unclear risk | Not reported |
| Study attrition: reasons for loss to follow‐up provided | Low risk | Yes |
| Study attrition: adequate description of participants lost to follow‐up | Low risk | Yes |
| Study attrition: no important differences between participants who completed the study and those who did not | Unclear risk | Not reported |
| Glycaemic status measurement: provision of clear definition or description of glycaemic status | Low risk | HbA1c5.7 and HbA1c6.0 |
| Glycaemic status measurement: valid and reliable method of glycaemic status measurement | Low risk | Yes |
| Glycaemic status measurement: continuous variables reported or appropriate cut points used | Unclear risk | Normal reference for HbA1c: < 5 |
| Glycaemic status measurement: same method and setting of measurement of the glycaemic status for all study participants | Low risk | Yes |
| Outcome measurement: clear definition of the outcome provided | Low risk | FPG ≥ 7.0; HbA1c ≥ 6.5; history of diabetes; antihyperglycaemic medication |
| Outcome measurement: method of outcome measurement used valid & reliable | Low risk | Yes |
| Outcome measurement: same method & setting of outcome measurement for all study participants | Low risk | Yes |
| Study confounding: important confounders measured | Unclear risk | 2 covariates measured: age and sex |
| Study confounding: clear definitions of important confounders provided | Low risk | Yes |
| Study confounding: measurement of confounders valid & reliable | Low risk | Yes |
| Study confounding: same method & setting for measurements of confounders for all study participants | Low risk | Yes |
| Study confounding: appropriate methods used if missing confounder data imputed | Unclear risk | Not reported |
| Study confounding: important potential confounders accounted for in study design | Unclear risk | 2 covariates included: age and sex |
| Study confounding: important potential confounders accounted for in the analysis | Unclear risk | 2 covariates analysed: age and sex |
| Statistical analysis & reporting: sufficient presentation of data to assess adequacy of the analytic strategy | Low risk | Cumulative incidence, incidence rate, hazard ratio |
| Statistical analysis & reporting: the statistical model is adequate for the design of the study | Unclear risk | Kaplan‐Meier method, Cox proportional hazard analysis (2 covariates), ROC analysis |
| Name of study | None | |
| Inclusion criteria | Participants aged > 18 years visiting a healthcare centre with impaired fasting glucose measured twice | |
| Exclusion criteria | Corticosteroid therapy, terminal illness, life expectancy of 1 year or less, diabetes | |
| Notes | Baseline data for cohort with intermediate hyperglycaemia (N = 115) | |
| Risk of bias | ||
| Bias | Authors' judgement | Support for judgement |
| Study participation: description of source population or population of interest | Low risk | Healthcare centre in Barcelona, Spain, "Cohorta Zona Franca" |
| Study participation: description of glycaemic status at baseline | Low risk | Yes |
| Study participation: adequate description of sampling frame & recruitment | Unclear risk | Scarce data |
| Study participation: adequate description of period & recruitment place | Low risk | Yes |
| Study participation: adequate description of inclusion & exclusion criteria | Low risk | Inclusion and exclusion criteria specified |
| Study attrition: description of attempts to collect information on participants who dropped out | Low risk | Yes |
| Study attrition: reasons for loss to follow‐up provided | Low risk | Yes |
| Study attrition: adequate description of participants lost to follow‐up | Low risk | Yes |
| Study attrition: no important differences between participants who completed the study and those who did not | Low risk | Quote: "no significant differences" |
| Glycaemic status measurement: provision of clear definition or description of glycaemic status | Low risk | IFG |
| Glycaemic status measurement: valid and reliable method of glycaemic status measurement | Low risk | FPG measured twice |
| Glycaemic status measurement: continuous variables reported or appropriate cut points used | Low risk | IFG: 6.1–6.9 |
| Glycaemic status measurement: same method and setting of measurement of the glycaemic status for all study participants | Low risk | Yes |
| Outcome measurement: clear definition of the outcome provided | Low risk | FPG ≥ 7.0 (measured twice) |
| Outcome measurement: method of outcome measurement used valid & reliable | Low risk | FPG |
| Outcome measurement: same method & setting of outcome measurement for all study participants | Low risk | Yes |
| Study confounding: important confounders measured | Unclear risk | Some variables (univariate analyses) associated with progression to diabetes |
| Study confounding: clear definitions of important confounders provided | Low risk | Yes |
| Study confounding: measurement of confounders valid & reliable | Low risk | Yes |
| Study confounding: same method & setting for measurements of confounders for all study participants | Low risk | Yes |
| Study confounding: appropriate methods used if missing confounder data imputed | Unclear risk | Not reported |
| Study confounding: important potential confounders accounted for in study design | Unclear risk | Some confounders measured |
| Study confounding: important potential confounders accounted for in the analysis | Unclear risk | Univariate analyses for single variables |
| Statistical analysis & reporting: sufficient presentation of data to assess adequacy of the analytic strategy | Low risk | Cumulative incidence |
| Statistical analysis & reporting: the statistical model is adequate for the design of the study | Unclear risk | Cox regression for other risk factors (e.g. obesity) associated with progression to diabetes |
| Name of study | None | |
| Inclusion criteria | Staff of the Indian Institute of Technology of Chennai, along with their family members, aged 20 years and over | |
| Exclusion criteria | Treatment for diabetes | |
| Notes | Baseline data for the IGT cohort (N = 252) | |
| Risk of bias | ||
| Bias | Authors' judgement | Support for judgement |
| Study participation: description of source population or population of interest | Low risk | Staff of the Indian Institute of Technology of Chennai, along with their family members, aged 20 years and over |
| Study participation: description of glycaemic status at baseline | Low risk | Yes |
| Study participation: adequate description of sampling frame & recruitment | Low risk | Yes |
| Study participation: adequate description of period & recruitment place | Low risk | Yes |
| Study participation: adequate description of inclusion & exclusion criteria | Low risk | Inclusion and exclusion criteria described |
| Study attrition: description of attempts to collect information on participants who dropped out | High risk | Not reported |
| Study attrition: reasons for loss to follow‐up provided | High risk | Not reported |
| Study attrition: adequate description of participants lost to follow‐up | High risk | Not reported |
| Study attrition: no important differences between participants who completed the study and those who did not | Unclear risk | Not reported |
| Glycaemic status measurement: provision of clear definition or description of glycaemic status | Low risk | IGT |
| Glycaemic status measurement: valid and reliable method of glycaemic status measurement | Low risk | Yes |
| Glycaemic status measurement: continuous variables reported or appropriate cut points used | Low risk | IGT: 7.8 to < 11.1 (WHO 1985) |
| Glycaemic status measurement: same method and setting of measurement of the glycaemic status for all study participants | Low risk | Yes |
| Outcome measurement: clear definition of the outcome provided | Low risk | 2‐h PG ≥ 11.1 (WHO 1985) |
| Outcome measurement: method of outcome measurement used valid & reliable | Low risk | Yes |
| Outcome measurement: same method & setting of outcome measurement for all study participants | Low risk | Yes |
| Study confounding: important confounders measured | Unclear risk | Not reported, cumulative incidence |
| Study confounding: clear definitions of important confounders provided | Unclear risk | Not reported |
| Study confounding: measurement of confounders valid & reliable | Unclear risk | Not reported |
| Study confounding: same method & setting for measurements of confounders for all study participants | Unclear risk | Not reported |
| Study confounding: appropriate methods used if missing confounder data imputed | Unclear risk | Not reported |
| Study confounding: important potential confounders accounted for in study design | Unclear risk | Not reported |
| Study confounding: important potential confounders accounted for in the analysis | Unclear risk | Not reported |
| Statistical analysis & reporting: sufficient presentation of data to assess adequacy of the analytic strategy | Low risk | Cumulative incidence |
| Statistical analysis & reporting: the statistical model is adequate for the design of the study | Unclear risk | Not reported |
| Name of study | Israel study of glucose intolerance, obesity and hypertension (Israel GOH study) | |
| Inclusion criteria | Survival until follow‐up with fasting blood glucose < 126 mg/dL (7.0 mmol/L) and 1‐ and 2‐h postload glucose values available at baseline | |
| Exclusion criteria | Individuals with diabetes | |
| Notes | Baseline data for IGT cohort (N = 24) | |
| Risk of bias | ||
| Bias | Authors' judgement | Support for judgement |
| Study participation: description of source population or population of interest | Low risk | Israeli general population registry sample |
| Study participation: description of glycaemic status at baseline | Low risk | Yes |
| Study participation: adequate description of sampling frame & recruitment | Low risk | Yes |
| Study participation: adequate description of period & recruitment place | Low risk | Yes |
| Study participation: adequate description of inclusion & exclusion criteria | Low risk | Inclusion and exclusion criteria described |
| Study attrition: description of attempts to collect information on participants who dropped out | Low risk | Yes |
| Study attrition: reasons for loss to follow‐up provided | Low risk | Yes |
| Study attrition: adequate description of participants lost to follow‐up | Low risk | Yes |
| Study attrition: no important differences between participants who completed the study and those who did not | Low risk | Comment: "no differences" between non‐participants and participants |
| Glycaemic status measurement: provision of clear definition or description of glycaemic status | Low risk | Comment: IGT |
| Glycaemic status measurement: valid and reliable method of glycaemic status measurement | Low risk | Yes |
| Glycaemic status measurement: continuous variables reported or appropriate cut points used | Low risk | Comment: FPG 5.6–7.8; 2‐h BG 7.8–11.0 |
| Glycaemic status measurement: same method and setting of measurement of the glycaemic status for all study participants | Low risk | Yes |
| Outcome measurement: clear definition of the outcome provided | Unclear risk | Comment: FPG ≥ 7.8, 2‐h BG ≥ 11.1; reported diabetes |
| Outcome measurement: method of outcome measurement used valid & reliable | Unclear risk | Non‐standard FPG thresholds |
| Outcome measurement: same method & setting of outcome measurement for all study participants | Low risk | Yes |
| Study confounding: important confounders measured | Unclear risk | Comment: some confounders were measured |
| Study confounding: clear definitions of important confounders provided | Unclear risk | Comment: scarce data |
| Study confounding: measurement of confounders valid & reliable | Unclear risk | Comment: scarce data |
| Study confounding: same method & setting for measurements of confounders for all study participants | Low risk | Yes |
| Study confounding: appropriate methods used if missing confounder data imputed | Unclear risk | Not reported |
| Study confounding: important potential confounders accounted for in study design | Low risk | Yes |
| Study confounding: important potential confounders accounted for in the analysis | Low risk | Yes |
| Statistical analysis & reporting: sufficient presentation of data to assess adequacy of the analytic strategy | Low risk | Cumulative incidence, odds ratio |
| Statistical analysis & reporting: the statistical model is adequate for the design of the study | Low risk | Multiple multinomial logistic regression |
| Name of study | Bruneck Study | |
| Inclusion criteria | White men and women, aged 40–79 years | |
| Exclusion criteria | Not reported | |
| Notes | No baseline data (except white participants aged > 40 years, N = 919) | |
| Risk of bias | ||
| Bias | Authors' judgement | Support for judgement |
| Study participation: description of source population or population of interest | Low risk | Bruneck study, a long‐term prospective population‐based study of atherosclerosis and its risk factors |
| Study participation: description of glycaemic status at baseline | Low risk | Yes |
| Study participation: adequate description of sampling frame & recruitment | Low risk | Yes |
| Study participation: adequate description of period & recruitment place | Low risk | Yes |
| Study participation: adequate description of inclusion & exclusion criteria | Low risk | Inclusion criteria described |
| Study attrition: description of attempts to collect information on participants who dropped out | Low risk | Yes |
| Study attrition: reasons for loss to follow‐up provided | Low risk | Yes |
| Study attrition: adequate description of participants lost to follow‐up | High risk | Scarce data |
| Study attrition: no important differences between participants who completed the study and those who did not | Unclear risk | Not reported |
| Glycaemic status measurement: provision of clear definition or description of glycaemic status | Unclear risk | HbA1c categories, IFG (additional analyses) |
| Glycaemic status measurement: valid and reliable method of glycaemic status measurement | Low risk | Yes |
| Glycaemic status measurement: continuous variables reported or appropriate cut points used | Low risk | HbA1: 6.0–6.49; IFG: not defined, probably FPG 5.6–6.9 |
| Glycaemic status measurement: same method and setting of measurement of the glycaemic status for all study participants | Low risk | Yes |
| Outcome measurement: clear definition of the outcome provided | Low risk | FPG ≥ 7.0; HbA1c ≥ 6.5; diabetes treatment |
| Outcome measurement: method of outcome measurement used valid & reliable | Low risk | Yes |
| Outcome measurement: same method & setting of outcome measurement for all study participants | Low risk | Yes |
| Study confounding: important confounders measured | Low risk | Yes |
| Study confounding: clear definitions of important confounders provided | Low risk | Yes |
| Study confounding: measurement of confounders valid & reliable | Low risk | Yes |
| Study confounding: same method & setting for measurements of confounders for all study participants | Low risk | Yes |
| Study confounding: appropriate methods used if missing confounder data imputed | Unclear risk | Not reported |
| Study confounding: important potential confounders accounted for in study design | Low risk | Yes |
| Study confounding: important potential confounders accounted for in the analysis | Low risk | Yes |
| Statistical analysis & reporting: sufficient presentation of data to assess adequacy of the analytic strategy | Low risk | Cumulative incidence, incidence rate, hazard ratio |
| Statistical analysis & reporting: the statistical model is adequate for the design of the study | Low risk | Cox proportional hazards models; additional models were run with updates variables (HbA1c and other variables were assessed every 5 years during follow‐up) |
| Name of study | None | |
| Inclusion criteria | All inhabitants of the city of Oulo, Finland, born in 1935 | |
| Exclusion criteria | Diabetes at baseline | |
| Notes | Baseline data for the total cohort (N = 553), men (N = 223), women (N = 330) | |
| Risk of bias | ||
| Bias | Authors' judgement | Support for judgement |
| Study participation: description of source population or population of interest | Low risk | Part of a longer follow‐up study assessing type 2 diabetes and IGT |
| Study participation: description of glycaemic status at baseline | Low risk | Yes |
| Study participation: adequate description of sampling frame & recruitment | Low risk | Yes |
| Study participation: adequate description of period & recruitment place | Low risk | Yes |
| Study participation: adequate description of inclusion & exclusion criteria | Low risk | Inclusion and exclusion criteria described |
| Study attrition: description of attempts to collect information on participants who dropped out | Low risk | Yes |
| Study attrition: reasons for loss to follow‐up provided | Low risk | Yes |
| Study attrition: adequate description of participants lost to follow‐up | Low risk | Yes |
| Study attrition: no important differences between participants who completed the study and those who did not | Low risk | Yes |
| Glycaemic status measurement: provision of clear definition or description of glycaemic status | Low risk | IFG, IGT, IFG/IGT |
| Glycaemic status measurement: valid and reliable method of glycaemic status measurement | Low risk | Yes |
| Glycaemic status measurement: continuous variables reported or appropriate cut points used | Low risk | IFG: 6.1–6.9; 2‐h PG < 7.8; IGT: FPG > 7.0; 2‐h PG 7.8 to < 11.1; elevated HbA1c: 5.7–6.4 |
| Glycaemic status measurement: same method and setting of measurement of the glycaemic status for all study participants | Low risk | Yes |
| Outcome measurement: clear definition of the outcome provided | Low risk | Confirmed by 2 diabetic 75 g OGTTs (2‐h PG ≥ 11.1) and/or fasting values |
| Outcome measurement: method of outcome measurement used valid & reliable | Low risk | Yes |
| Outcome measurement: same method & setting of outcome measurement for all study participants | Low risk | Yes |
| Study confounding: important confounders measured | Unclear risk | Some confounders measured |
| Study confounding: clear definitions of important confounders provided | Low risk | Yes |
| Study confounding: measurement of confounders valid & reliable | Low risk | Yes |
| Study confounding: same method & setting for measurements of confounders for all study participants | Low risk | Yes |
| Study confounding: appropriate methods used if missing confounder data imputed | Unclear risk | Not reported |
| Study confounding: important potential confounders accounted for in study design | Low risk | Yes |
| Study confounding: important potential confounders accounted for in the analysis | Low risk | Yes |
| Statistical analysis & reporting: sufficient presentation of data to assess adequacy of the analytic strategy | Low risk | Cumulative incidence, risk ratio |
| Statistical analysis & reporting: the statistical model is adequate for the design of the study | Low risk | Log‐binomial regression |
| Name of study | European Prospective Investigation of Cancer (EPIC)‐Norfolk cohort | |
| Inclusion criteria | Participants aged 40–74 years from the Norfolk region, UK; individuals with HbA1c measurements at baseline and the second health assessment | |
| Exclusion criteria | Diabetes at baseline, missing data | |
| Notes | Baseline data for HbA1c 6.0–6.4 cohort (N = 370) | |
| Risk of bias | ||
| Bias | Authors' judgement | Support for judgement |
| Study participation: description of source population or population of interest | Low risk | Population‐based study monitoring individuals recruited from general practice in the Norfolk region, UK |
| Study participation: description of glycaemic status at baseline | Low risk | Yes |
| Study participation: adequate description of sampling frame & recruitment | Low risk | Yes |
| Study participation: adequate description of period & recruitment place | Low risk | Yes |
| Study participation: adequate description of inclusion & exclusion criteria | Low risk | Inclusion and exclusion criteria described |
| Study attrition: description of attempts to collect information on participants who dropped out | Low risk | Yes |
| Study attrition: reasons for loss to follow‐up provided | Low risk | Yes |
| Study attrition: adequate description of participants lost to follow‐up | Unclear risk | Scarce data |
| Study attrition: no important differences between participants who completed the study and those who did not | Unclear risk | Scarce data |
| Glycaemic status measurement: provision of clear definition or description of glycaemic status | Low risk | HbA1c (50% of all participants had information on this measure at baseline); analyses were limited to these individuals |
| Glycaemic status measurement: valid and reliable method of glycaemic status measurement | Low risk | Yes |
| Glycaemic status measurement: continuous variables reported or appropriate cut points used | Low risk | HbA1c 6.0–6.4 |
| Glycaemic status measurement: same method and setting of measurement of the glycaemic status for all study participants | Low risk | Yes |
| Outcome measurement: clear definition of the outcome provided | Low risk | HbA1c ≥ 6.5; reported physician‐diagnosed diabetes or diabetes medications; antihyperglycaemic medication; diagnosis through medical records, registers or death certificates; results for clinically and/or biochemically diagnosed diabetes were used |
| Outcome measurement: method of outcome measurement used valid & reliable | Low risk | Yes |
| Outcome measurement: same method & setting of outcome measurement for all study participants | Low risk | Yes |
| Study confounding: important confounders measured | Low risk | Yes |
| Study confounding: clear definitions of important confounders provided | Low risk | Yes |
| Study confounding: measurement of confounders valid & reliable | Low risk | Yes |
| Study confounding: same method & setting for measurements of confounders for all study participants | Low risk | Yes |
| Study confounding: appropriate methods used if missing confounder data imputed | Unclear risk | Not reported |
| Study confounding: important potential confounders accounted for in study design | Low risk | Yes |
| Study confounding: important potential confounders accounted for in the analysis | Low risk | Yes |
| Statistical analysis & reporting: sufficient presentation of data to assess adequacy of the analytic strategy | Low risk | Cumulative incidence, odds ratio |
| Statistical analysis & reporting: the statistical model is adequate for the design of the study | Low risk | Logistic regression (for every 0.5% increase in HbA1c as well as for different categories of HbA1c) |
| Name of study | Paris Prospective Study | |
| Inclusion criteria | Longitudinal epidemiologic study of cardiovascular risk factors in male employees of the Paris police, born in France between 1917–28 | |
| Exclusion criteria | No diabetes or cardiovascular disease | |
| Notes | Baseline data for individuals with IGT converting to T2DM (N = 32) | |
| Risk of bias | ||
| Bias | Authors' judgement | Support for judgement |
| Study participation: description of source population or population of interest | Low risk | Longitudinal epidemiologic study of cardiovascular risk factors in male employees of the Paris |
| Study participation: description of glycaemic status at baseline | Low risk | Yes |
| Study participation: adequate description of sampling frame & recruitment | Low risk | Yes |
| Study participation: adequate description of period & recruitment place | Low risk | Yes |
| Study participation: adequate description of inclusion & exclusion criteria | Low risk | Inclusion and exclusion criteria described |
| Study attrition: description of attempts to collect information on participants who dropped out | High risk | Not reported |
| Study attrition: reasons for loss to follow‐up provided | High risk | Not reported |
| Study attrition: adequate description of participants lost to follow‐up | High risk | Not reported |
| Study attrition: no important differences between participants who completed the study and those who did not | Unclear risk | Not reported |
| Glycaemic status measurement: provision of clear definition or description of glycaemic status | Low risk | IGT |
| Glycaemic status measurement: valid and reliable method of glycaemic status measurement | Low risk | Yes |
| Glycaemic status measurement: continuous variables reported or appropriate cut points used | Low risk | IGT: 2‐h PG ≥ 7.8 to < 11.1 (WHO 1985) |
| Glycaemic status measurement: same method and setting of measurement of the glycaemic status for all study participants | Low risk | Yes |
| Outcome measurement: clear definition of the outcome provided | Low risk | 2‐h PG ≥ 11.1 (WHO 1985); physician diagnosed diabetes |
| Outcome measurement: method of outcome measurement used valid & reliable | Low risk | Yes |
| Outcome measurement: same method & setting of outcome measurement for all study participants | Low risk | Yes |
| Study confounding: important confounders measured | Unclear risk | Cumulative incidence |
| Study confounding: clear definitions of important confounders provided | Low risk | Yes |
| Study confounding: measurement of confounders valid & reliable | Low risk | Yes |
| Study confounding: same method & setting for measurements of confounders for all study participants | Low risk | Yes |
| Study confounding: appropriate methods used if missing confounder data imputed | Unclear risk | Not reported |
| Study confounding: important potential confounders accounted for in study design | Low risk | Yes (see below) |
| Study confounding: important potential confounders accounted for in the analysis | Low risk | Yes |
| Statistical analysis & reporting: sufficient presentation of data to assess adequacy of the analytic strategy | Low risk | Cumulative incidence |
| Statistical analysis & reporting: the statistical model is adequate for the design of the study | Low risk | Multivariate logistic regression (odds ratio for an increase of 1 SD in the population of participants with NGT or IGT) |
| Name of study | None | |
| Inclusion criteria | Residents of Penghu, Taiwan aged 40–79 years were selected for a baseline diabetes prevalence study | |
| Exclusion criteria | Diabetes at baseline | |
| Notes | Baseline data for cohort converting to T2DM (N = 26) | |
| Risk of bias | ||
| Bias | Authors' judgement | Support for judgement |
| Study participation: description of source population or population of interest | Low risk | Random sample of residents of Penghu, Taipei were selected for a baseline diabetes prevalence survey |
| Study participation: description of glycaemic status at baseline | Low risk | Yes |
| Study participation: adequate description of sampling frame & recruitment | Low risk | Yes |
| Study participation: adequate description of period & recruitment place | Low risk | Yes |
| Study participation: adequate description of inclusion & exclusion criteria | Low risk | Inclusion and exclusion criteria reported |
| Study attrition: description of attempts to collect information on participants who dropped out | Low risk | Yes |
| Study attrition: reasons for loss to follow‐up provided | Low risk | Yes |
| Study attrition: adequate description of participants lost to follow‐up | Low risk | Yes |
| Study attrition: no important differences between participants who completed the study and those who did not | Low risk | Quote: "the 600 persons who were re‐examined did not significantly differ from the others" |
| Glycaemic status measurement: provision of clear definition or description of glycaemic status | Low risk | IFG |
| Glycaemic status measurement: valid and reliable method of glycaemic status measurement | Low risk | Yes |
| Glycaemic status measurement: continuous variables reported or appropriate cut points used | Low risk | IFG: FPG 6.1–7.0 |
| Glycaemic status measurement: same method and setting of measurement of the glycaemic status for all study participants | Low risk | Yes |
| Outcome measurement: clear definition of the outcome provided | Low risk | FPG ≥ 7.0 |
| Outcome measurement: method of outcome measurement used valid & reliable | Low risk | Yes |
| Outcome measurement: same method & setting of outcome measurement for all study participants | Low risk | Yes |
| Study confounding: important confounders measured | Unclear risk | Some confounders measured |
| Study confounding: clear definitions of important confounders provided | Low risk | Yes |
| Study confounding: measurement of confounders valid & reliable | Low risk | Yes |
| Study confounding: same method & setting for measurements of confounders for all study participants | Low risk | Yes |
| Study confounding: appropriate methods used if missing confounder data imputed | Unclear risk | Not reported |
| Study confounding: important potential confounders accounted for in study design | Low risk | Yes |
| Study confounding: important potential confounders accounted for in the analysis | Unclear risk | Age‐sex adjusted odds ratio |
| Statistical analysis & reporting: sufficient presentation of data to assess adequacy of the analytic strategy | Low risk | Cumulative incidence, odds ratio |
| Statistical analysis & reporting: the statistical model is adequate for the design of the study | Low risk | Multiple logistic regression (selected risk factors) |
| Name of study | None | |
| Inclusion criteria | Participants with complete 3 year follow‐up and non‐pharmacological interventions | |
| Exclusion criteria | Participants aged 0–60 years, incomplete baseline data, diabetes at baseline | |
| Notes | Baseline data for i‐IFG/i‐IGTand IFG/IGT across age groups < 40 years + > 60 years (data indicate range across groups) (i‐IFG < 40 years: N = 51 and > 60 years: N = 278; i‐IGT < 40 years: N = 41 and > 60 years: N = 151; IFG/IGT: < 40 years: N = 34 and > 60 years: N = 175) | |
| Risk of bias | ||
| Bias | Authors' judgement | Support for judgement |
| Study participation: description of source population or population of interest | Low risk | Permanent participants of Fujian province (China), part of the baseline survey from the REACTION study investigating the association between diabetes and cancer |
| Study participation: description of glycaemic status at baseline | Low risk | Yes |
| Study participation: adequate description of sampling frame & recruitment | Low risk | Yes |
| Study participation: adequate description of period & recruitment place | Low risk | Yes |
| Study participation: adequate description of inclusion & exclusion criteria | Low risk | Inclusion and exclusion criteria described |
| Study attrition: description of attempts to collect information on participants who dropped out | Unclear risk | Not reported |
| Study attrition: reasons for loss to follow‐up provided | Unclear risk | Not reported |
| Study attrition: adequate description of participants lost to follow‐up | Unclear risk | Not reported |
| Study attrition: no important differences between participants who completed the study and those who did not | Unclear risk | Not reported |
| Glycaemic status measurement: provision of clear definition or description of glycaemic status | Low risk | IFG, IGT, IFG/IGT |
| Glycaemic status measurement: valid and reliable method of glycaemic status measurement | Low risk | Yes |
| Glycaemic status measurement: continuous variables reported or appropriate cut points used | Low risk | IFG: FPG 5.6–6.9 + 2‐h PG ≤ 7.8; IGT: FPG < 5.6 + 2‐h PG 7.8 to ≤ 11.0; IFG/IGT: FPG 5.6–6.9 + 2‐h PG 7.8 to ≤ 11.0 |
| Glycaemic status measurement: same method and setting of measurement of the glycaemic status for all study participants | Low risk | Yes |
| Outcome measurement: clear definition of the outcome provided | Low risk | FPG ≥ 7.0; 2‐h PG ≥ 11.1; previously diagnosed diabetes |
| Outcome measurement: method of outcome measurement used valid & reliable | Low risk | Yes |
| Outcome measurement: same method & setting of outcome measurement for all study participants | Low risk | Yes |
| Study confounding: important confounders measured | Low risk | Confounder adjustment for HOMA‐IR and HOMA‐B |
| Study confounding: clear definitions of important confounders provided | Low risk | Yes |
| Study confounding: measurement of confounders valid & reliable | Low risk | Yes |
| Study confounding: same method & setting for measurements of confounders for all study participants | Low risk | Yes |
| Study confounding: appropriate methods used if missing confounder data imputed | Unclear risk | Not reported |
| Study confounding: important potential confounders accounted for in study design | Low risk | Yes |
| Study confounding: important potential confounders accounted for in the analysis | Low risk | Yes (HOMA‐IR, HOMA‐B) |
| Statistical analysis & reporting: sufficient presentation of data to assess adequacy of the analytic strategy | Low risk | Cumulative incidence |
| Statistical analysis & reporting: the statistical model is adequate for the design of the study | Low risk | Stepwise multiple regression analysis (for HOMA‐IR or HOMA‐B) |
| Name of study | None | |
| Inclusion criteria | Healthy Mexicans | |
| Exclusion criteria | Previous diabetes diagnosis, various diseases and medications affecting glucose metabolism | |
| Notes | Baseline characteristics for the prediabetic cohort (N = 217) | |
| Risk of bias | ||
| Bias | Authors' judgement | Support for judgement |
| Study participation: description of source population or population of interest | Low risk | Personnel working for Petróleos Mexicanos with annual health‐checkups living in the metropolitan area of Mexico City |
| Study participation: description of glycaemic status at baseline | Unclear risk | Quote: "prediabetes" |
| Study participation: adequate description of sampling frame & recruitment | Low risk | Yes |
| Study participation: adequate description of period & recruitment place | Low risk | Yes |
| Study participation: adequate description of inclusion & exclusion criteria | Low risk | Inclusion and exclusion criteria described |
| Study attrition: description of attempts to collect information on participants who dropped out | Low risk | Yes |
| Study attrition: reasons for loss to follow‐up provided | Low risk | Yes |
| Study attrition: adequate description of participants lost to follow‐up | Unclear risk | Scarce data |
| Study attrition: no important differences between participants who completed the study and those who did not | Unclear risk | Not reported |
| Glycaemic status measurement: provision of clear definition or description of glycaemic status | Unclear risk | IFG and IGT (ADA 2007), vague definition |
| Glycaemic status measurement: valid and reliable method of glycaemic status measurement | Low risk | Yes |
| Glycaemic status measurement: continuous variables reported or appropriate cut points used | Unclear risk | IFG and IGT: 5.6–6.9 and 7.8 to < 11.1 (ADA 2007), vague definition |
| Glycaemic status measurement: same method and setting of measurement of the glycaemic status for all study participants | Low risk | Yes |
| Outcome measurement: clear definition of the outcome provided | Unclear risk | FPG ≥ 7.0 or 2‐h PG ≥ 11.1 (ADA 2007), vague definition |
| Outcome measurement: method of outcome measurement used valid & reliable | Low risk | Yes |
| Outcome measurement: same method & setting of outcome measurement for all study participants | Low risk | Yes |
| Study confounding: important confounders measured | Unclear risk | Scarce data |
| Study confounding: clear definitions of important confounders provided | Unclear risk | Scarce data |
| Study confounding: measurement of confounders valid & reliable | Unclear risk | Scarce data |
| Study confounding: same method & setting for measurements of confounders for all study participants | Unclear risk | Scarce data |
| Study confounding: appropriate methods used if missing confounder data imputed | Unclear risk | Not reported |
| Study confounding: important potential confounders accounted for in study design | Unclear risk | Scarce data |
| Study confounding: important potential confounders accounted for in the analysis | Unclear risk | Not reported |
| Statistical analysis & reporting: sufficient presentation of data to assess adequacy of the analytic strategy | Low risk | Cumulative incidence, relative risk |
| Statistical analysis & reporting: the statistical model is adequate for the design of the study | Low risk | Logistic regression |
| Name of study | Blue Mountains Eye Study (BMES) | |
| Inclusion criteria | Survey of vision and common eye diseases in 2 postcode areas west of Sydney; all permanent non‐institutionalised residents with birth date prior to January 1943 (aged 49+ at baseline) were invited to attend a detailed eye examination at a local clinic | |
| Exclusion criteria | Nursing home residents, diabetes at baseline, missing data | |
| Notes | Baseline data for BMES I study, people without diabetes (N = 3437/3654) | |
| Risk of bias | ||
| Bias | Authors' judgement | Support for judgement |
| Study participation: description of source population or population of interest | Low risk | Older community within the geographically defined area west of Sydney, Australia; population‐based survey of vision and common eye diseases |
| Study participation: description of glycaemic status at baseline | Low risk | Yes |
| Study participation: adequate description of sampling frame & recruitment | Low risk | Yes |
| Study participation: adequate description of period & recruitment place | Low risk | Yes |
| Study participation: adequate description of inclusion & exclusion criteria | Low risk | Inclusion and exclusion criteria described |
| Study attrition: description of attempts to collect information on participants who dropped out | Low risk | Yes |
| Study attrition: reasons for loss to follow‐up provided | Low risk | Yes |
| Study attrition: adequate description of participants lost to follow‐up | Low risk | Yes |
| Study attrition: no important differences between participants who completed the study and those who did not | Low risk | Yes, for most variables |
| Glycaemic status measurement: provision of clear definition or description of glycaemic status | Low risk | IFG |
| Glycaemic status measurement: valid and reliable method of glycaemic status measurement | Low risk | Yes |
| Glycaemic status measurement: continuous variables reported or appropriate cut points used | Low risk | IFG: FPG 5.6 ‐6.9 (originally FPG ≥ 6.1 to < 7.0) |
| Glycaemic status measurement: same method and setting of measurement of the glycaemic status for all study participants | Low risk | Yes |
| Outcome measurement: clear definition of the outcome provided | Low risk | FPG ≥ 7.0; self‐reported diabetes history; antihyperglycaemic medication |
| Outcome measurement: method of outcome measurement used valid & reliable | Low risk | Yes |
| Outcome measurement: same method & setting of outcome measurement for all study participants | Low risk | Yes |
| Study confounding: important confounders measured | Unclear risk | Few variables (adjustment for age and sex) |
| Study confounding: clear definitions of important confounders provided | Low risk | Yes |
| Study confounding: measurement of confounders valid & reliable | Low risk | Yes |
| Study confounding: same method & setting for measurements of confounders for all study participants | Low risk | Yes |
| Study confounding: appropriate methods used if missing confounder data imputed | Unclear risk | Not reported |
| Study confounding: important potential confounders accounted for in study design | Unclear risk | Few variables |
| Study confounding: important potential confounders accounted for in the analysis | Unclear risk | Few variables |
| Statistical analysis & reporting: sufficient presentation of data to assess adequacy of the analytic strategy | Low risk | Cumulative incidence, odds ratio |
| Statistical analysis & reporting: the statistical model is adequate for the design of the study | Low risk | Multivariate‐adjusted discrete logistic models, few variables |
| Name of study | Geelong Osteoporosis Study (GOS) | |
| Inclusion criteria | Female arm of the GOS | |
| Exclusion criteria | No FPG level or self‐report of antihyperglycaemic medication or diabetes status | |
| Notes | Baseline data for IFG cohort at baseline (N = 187) | |
| Risk of bias | ||
| Bias | Authors' judgement | Support for judgement |
| Study participation: description of source population or population of interest | Low risk | Utilised data from the female arm of the Geelong Osteoporosis Study, Australia |
| Study participation: description of glycaemic status at baseline | Low risk | Yes |
| Study participation: adequate description of sampling frame & recruitment | Low risk | Yes |
| Study participation: adequate description of period & recruitment place | Low risk | Yes |
| Study participation: adequate description of inclusion & exclusion criteria | Low risk | Inclusion and exclusion criteria described |
| Study attrition: description of attempts to collect information on participants who dropped out | Low risk | Yes |
| Study attrition: reasons for loss to follow‐up provided | Low risk | Yes |
| Study attrition: adequate description of participants lost to follow‐up | Low risk | Yes |
| Study attrition: no important differences between participants who completed the study and those who did not | Low risk | Yes |
| Glycaemic status measurement: provision of clear definition or description of glycaemic status | Low risk | IFG |
| Glycaemic status measurement: valid and reliable method of glycaemic status measurement | Low risk | Yes |
| Glycaemic status measurement: continuous variables reported or appropriate cut points used | Low risk | IFG: 5.5–6.9 |
| Glycaemic status measurement: same method and setting of measurement of the glycaemic status for all study participants | Low risk | Yes |
| Outcome measurement: clear definition of the outcome provided | Low risk | FPG ≥ 7.0; self‐reported; antihyperglycaemic medication |
| Outcome measurement: method of outcome measurement used valid & reliable | Low risk | Yes |
| Outcome measurement: same method & setting of outcome measurement for all study participants | Low risk | Yes |
| Study confounding: important confounders measured | Low risk | Yes, also age‐standardised incidence rate and additional covariates reported (metabolic syndrome, fasting glucose at baseline) (see Appendix 16 and Appendix 17) |
| Study confounding: clear definitions of important confounders provided | Low risk | Yes |
| Study confounding: measurement of confounders valid & reliable | Low risk | Yes |
| Study confounding: same method & setting for measurements of confounders for all study participants | Low risk | Yes |
| Study confounding: appropriate methods used if missing confounder data imputed | Unclear risk | Not reported |
| Study confounding: important potential confounders accounted for in study design | Low risk | Yes |
| Study confounding: important potential confounders accounted for in the analysis | Low risk | Yes |
| Statistical analysis & reporting: sufficient presentation of data to assess adequacy of the analytic strategy | Low risk | Cumulative incidence, incidence rate, odds ratio |
| Statistical analysis & reporting: the statistical model is adequate for the design of the study | Low risk | Logistic regression |
| Name of study | Cohort on Diabetes and Atherosclerosis Maastricht (CODAM) | |
| Inclusion criteria | Individuals with an elevated risk of type 2 diabetes and cardiovascular disease | |
| Exclusion criteria | Previously diagnosed type 2 diabetes at baseline, who did not undergo an OGTT and incomplete OGTT data | |
| Notes | Baseline data for prediabetic group (N = 122) | |
| Risk of bias | ||
| Bias | Authors' judgement | Support for judgement |
| Study participation: description of source population or population of interest | Low risk | Participants of the Cohort on Diabetes and Atherosclerosis Masstricht (CODAM) study on natural progression of glucose tolerance |
| Study participation: description of glycaemic status at baseline | Low risk | Yes |
| Study participation: adequate description of sampling frame & recruitment | Low risk | Yes |
| Study participation: adequate description of period & recruitment place | Low risk | Yes |
| Study participation: adequate description of inclusion & exclusion criteria | Low risk | Inclusion and exclusion criteria described |
| Study attrition: description of attempts to collect information on participants who dropped out | Low risk | Yes |
| Study attrition: reasons for loss to follow‐up provided | Low risk | Yes |
| Study attrition: adequate description of participants lost to follow‐up | Low risk | Analyses restricted individuals without T2DM who participated in the follow‐up measurements |
| Study attrition: no important differences between participants who completed the study and those who did not | Unclear risk | Scarce data |
| Glycaemic status measurement: provision of clear definition or description of glycaemic status | Low risk | IFG and IGT |
| Glycaemic status measurement: valid and reliable method of glycaemic status measurement | Low risk | Yes |
| Glycaemic status measurement: continuous variables reported or appropriate cut points used | Low risk | FPG 6.1–6.9; 2‐h PG 7.8–11.1 |
| Glycaemic status measurement: same method and setting of measurement of the glycaemic status for all study participants | Low risk | Yes |
| Outcome measurement: clear definition of the outcome provided | Low risk | FPG ≥ 7.0; 2‐h PG ≥ 11.1 |
| Outcome measurement: method of outcome measurement used valid & reliable | Low risk | Yes |
| Outcome measurement: same method & setting of outcome measurement for all study participants | Low risk | Yes |
| Study confounding: important confounders measured | Unclear risk | Not reported, cumulative incidence |
| Study confounding: clear definitions of important confounders provided | Unclear risk | Not reported |
| Study confounding: measurement of confounders valid & reliable | Unclear risk | Not reported |
| Study confounding: same method & setting for measurements of confounders for all study participants | Unclear risk | Not reported |
| Study confounding: appropriate methods used if missing confounder data imputed | Unclear risk | Not reported |
| Study confounding: important potential confounders accounted for in study design | Unclear risk | Not reported |
| Study confounding: important potential confounders accounted for in the analysis | Unclear risk | Not reported |
| Statistical analysis & reporting: sufficient presentation of data to assess adequacy of the analytic strategy | Low risk | Cumulative incidence |
| Statistical analysis & reporting: the statistical model is adequate for the design of the study | Low risk | Discriminatory ability of beta‐cell functions indices to predict 'prediabetes' and T2DM by means of ROC curves |
| Name of study | Tehran Lipid and Glucose Study (TLGS) | |
| Inclusion criteria | 3 separate analyses to investigate incidence of type 2 diabetes, hypertension and chronic kidney disease | |
| Exclusion criteria | Individuals aged < 20 years, type 2 diabetes at baseline, missing data, no follow‐ups | |
| Notes | Baseline data for 'prediabetes' group with normal blood pressure (IFG and/or IGT, N = 523) | |
| Risk of bias | ||
| Bias | Authors' judgement | Support for judgement |
| Study participation: description of source population or population of interest | Low risk | Population‐based study on a representative sample of the population of Tehran to determine the prevalence and incidence of non‐communicable diseases and their risk factors |
| Study participation: description of glycaemic status at baseline | Low risk | Yes |
| Study participation: adequate description of sampling frame & recruitment | Low risk | Yes |
| Study participation: adequate description of period & recruitment place | Low risk | Yes |
| Study participation: adequate description of inclusion & exclusion criteria | Low risk | Inclusion and exclusion criteria described |
| Study attrition: description of attempts to collect information on participants who dropped out | Low risk | Yes |
| Study attrition: reasons for loss to follow‐up provided | Low risk | Yes |
| Study attrition: adequate description of participants lost to follow‐up | Low risk | Yes |
| Study attrition: no important differences between participants who completed the study and those who did not | Unclear risk | Not reported |
| Glycaemic status measurement: provision of clear definition or description of glycaemic status | Unclear risk | Quote: "prediabetes" (IFG and IGT) |
| Glycaemic status measurement: valid and reliable method of glycaemic status measurement | Low risk | Yes |
| Glycaemic status measurement: continuous variables reported or appropriate cut points used | Low risk | 5.55 ≤ FPG < 7.0; 7.77 ≤ 2‐h PG ≤ 11.1; no antihyperglycaemic medication |
| Glycaemic status measurement: same method and setting of measurement of the glycaemic status for all study participants | Low risk | Yes |
| Outcome measurement: clear definition of the outcome provided | Low risk | FPG ≥ 7.0; 2‐h PG ≥ 11.1; antihyperglycaemic medication |
| Outcome measurement: method of outcome measurement used valid & reliable | Low risk | Yes |
| Outcome measurement: same method & setting of outcome measurement for all study participants | Low risk | Yes |
| Study confounding: important confounders measured | Low risk | Yes |
| Study confounding: clear definitions of important confounders provided | Low risk | Yes |
| Study confounding: measurement of confounders valid & reliable | Low risk | Yes |
| Study confounding: same method & setting for measurements of confounders for all study participants | Low risk | Yes |
| Study confounding: appropriate methods used if missing confounder data imputed | Low risk | Multiple imputation |
| Study confounding: important potential confounders accounted for in study design | Low risk | Yes |
| Study confounding: important potential confounders accounted for in the analysis | Low risk | Yes |
| Statistical analysis & reporting: sufficient presentation of data to assess adequacy of the analytic strategy | Low risk | Incidence rate, hazard ratio |
| Statistical analysis & reporting: the statistical model is adequate for the design of the study | Low risk | Cox proportional hazard models |
| Name of study | Nauru Study | |
| Inclusion criteria | All Nauruans aged 20 years and over; this survey included 266 individuals who were not diabetic in the combined 1975/76 survey; individuals who had previously attended either or both the 1975/76 and 1982 surveys; individuals with at least one parent identified as being of Nauruan heritage | |
| Exclusion criteria | Diabetes | |
| Notes | No baseline data | |
| Risk of bias | ||
| Bias | Authors' judgement | Support for judgement |
| Study participation: description of source population or population of interest | Low risk | Nauruan population, persons of Micronesian ancestry |
| Study participation: description of glycaemic status at baseline | Low risk | Yes |
| Study participation: adequate description of sampling frame & recruitment | Low risk | Yes |
| Study participation: adequate description of period & recruitment place | Low risk | Yes |
| Study participation: adequate description of inclusion & exclusion criteria | Low risk | Description of inclusion and exclusion criteria |
| Study attrition: description of attempts to collect information on participants who dropped out | Low risk | Yes |
| Study attrition: reasons for loss to follow‐up provided | Low risk | Some reasons provided |
| Study attrition: adequate description of participants lost to follow‐up | Unclear risk | Scarce data |
| Study attrition: no important differences between participants who completed the study and those who did not | Unclear risk | Scarce data |
| Glycaemic status measurement: provision of clear definition or description of glycaemic status | Low risk | IGT |
| Glycaemic status measurement: valid and reliable method of glycaemic status measurement | Low risk | Yes |
| Glycaemic status measurement: continuous variables reported or appropriate cut points used | Low risk | IGT: FPG < 7.8 and 2‐h PG ≥ 7.8 ‐ < 11.1 |
| Glycaemic status measurement: same method and setting of measurement of the glycaemic status for all study participants | Low risk | Yes |
| Outcome measurement: clear definition of the outcome provided | Low risk | 2‐h PG ≥ 11.1 (WHO 1985); FPG ≥ 7.8 |
| Outcome measurement: method of outcome measurement used valid & reliable | Low risk | Yes |
| Outcome measurement: same method & setting of outcome measurement for all study participants | Low risk | Yes |
| Study confounding: important confounders measured | Unclear risk | Some confounders were measured |
| Study confounding: clear definitions of important confounders provided | Unclear risk | Yes |
| Study confounding: measurement of confounders valid & reliable | Unclear risk | Yes |
| Study confounding: same method & setting for measurements of confounders for all study participants | Unclear risk | Yes |
| Study confounding: appropriate methods used if missing confounder data imputed | Unclear risk | Not reported |
| Study confounding: important potential confounders accounted for in study design | Unclear risk | Yes |
| Study confounding: important potential confounders accounted for in the analysis | Unclear risk | Yes |
| Statistical analysis & reporting: sufficient presentation of data to assess adequacy of the analytic strategy | Low risk | Cumulative incidence, incidence rate, odds ratio |
| Statistical analysis & reporting: the statistical model is adequate for the design of the study | Low risk | Multiple logistic regression models |
| Name of study | Mexico City Diabetes Study | |
| Inclusion criteria | Population‐based study of diabetes and cardiovascular risk factors in low‐income neighbourhoods in Mexico City, participants aged 35–64 years | |
| Exclusion criteria | Type 2 diabetes, type 1 diabetes, pregnant women | |
| Notes | Baseline characteristics provided for a range across different definitions of 'prediabetes' | |
| Risk of bias | ||
| Bias | Authors' judgement | Support for judgement |
| Study participation: description of source population or population of interest | Low risk | Data were collected as part of the Mexico City Diabetes Study |
| Study participation: description of glycaemic status at baseline | Low risk | Yes |
| Study participation: adequate description of sampling frame & recruitment | Low risk | Yes |
| Study participation: adequate description of period & recruitment place | Low risk | Yes |
| Study participation: adequate description of inclusion & exclusion criteria | Low risk | Description of inclusion and exclusion criteria |
| Study attrition: description of attempts to collect information on participants who dropped out | Unclear risk | Not reported |
| Study attrition: reasons for loss to follow‐up provided | Low risk | Yes |
| Study attrition: adequate description of participants lost to follow‐up | Low risk | Yes |
| Study attrition: no important differences between participants who completed the study and those who did not | Unclear risk | Unclear, limited data |
| Glycaemic status measurement: provision of clear definition or description of glycaemic status | Low risk | (i)IFG, (i)IGT |
| Glycaemic status measurement: valid and reliable method of glycaemic status measurement | Low risk | Yes |
| Glycaemic status measurement: continuous variables reported or appropriate cut points used | Low risk | IFG: FPG 6.1–6.9; IGT: FPG < 7.0 and 2‐h PG 7.8–11.1; i‐IFG6.1/i‐IFG5.6: 2‐h PG < 7.8 and FPG 6.1–6.9/5.6–6.1; i‐IGT/i‐IGT6.1/i‐IGT5.6 |
| Glycaemic status measurement: same method and setting of measurement of the glycaemic status for all study participants | Low risk | Yes |
| Outcome measurement: clear definition of the outcome provided | Low risk | FPG ≥ 7.0; 2‐h PG ≥ 11.1 |
| Outcome measurement: method of outcome measurement used valid & reliable | Low risk | Yes |
| Outcome measurement: same method & setting of outcome measurement for all study participants | Low risk | Yes |
| Study confounding: important confounders measured | Unclear risk | Not for transition data (intermediate hyperglycaemia to T2DM) |
| Study confounding: clear definitions of important confounders provided | Low risk | Yes |
| Study confounding: measurement of confounders valid & reliable | Low risk | Yes |
| Study confounding: same method & setting for measurements of confounders for all study participants | Low risk | Yes |
| Study confounding: appropriate methods used if missing confounder data imputed | Unclear risk | Not reported |
| Study confounding: important potential confounders accounted for in study design | Unclear risk | Scarce data |
| Study confounding: important potential confounders accounted for in the analysis | Unclear risk | Scarce data |
| Statistical analysis & reporting: sufficient presentation of data to assess adequacy of the analytic strategy | Low risk | Cumulative incidence, relative risk (multiple model odds ratios were calculated for 1 SD of the population value of that variable, in order to compare the relative importance of the variables (sex, familial diabetes, age, BMI, FPG, 2‐h PG) |
| Statistical analysis & reporting: the statistical model is adequate for the design of the study | Unclear risk | Logistic regression (for calculation of odds ratios, see above) |
| Name of study | ATTICA (province of Attica, Greece) | |
| Inclusion criteria | 1 participant per household, inhabitants from the Attica province | |
| Exclusion criteria | People living in institutions; people with CVD and of those with chronic viral infections | |
| Notes | Baseline data for IFG5.6 cohort | |
| Risk of bias | ||
| Bias | Authors' judgement | Support for judgement |
| Study participation: description of source population or population of interest | Low risk | ATTICA study |
| Study participation: description of glycaemic status at baseline | Low risk | Yes |
| Study participation: adequate description of sampling frame & recruitment | Low risk | Yes |
| Study participation: adequate description of period & recruitment place | Low risk | Yes |
| Study participation: adequate description of inclusion & exclusion criteria | Low risk | Inclusion and exclusion criteria described (participants with no diabetes and no CVD at baseline) |
| Study attrition: description of attempts to collect information on participants who dropped out | Low risk | Yes (85% participation rate) |
| Study attrition: reasons for loss to follow‐up provided | Low risk | Yes |
| Study attrition: adequate description of participants lost to follow‐up | Low risk | Yes |
| Study attrition: no important differences between participants who completed the study and those who did not | Unclear risk | Not reported |
| Glycaemic status measurement: provision of clear definition or description of glycaemic status | Low risk | IFG5.6 |
| Glycaemic status measurement: valid and reliable method of glycaemic status measurement | Low risk | Yes |
| Glycaemic status measurement: continuous variables reported or appropriate cut points used | Low risk | FBG 5.6–6.9 |
| Glycaemic status measurement: same method and setting of measurement of the glycaemic status for all study participants | Low risk | Yes |
| Outcome measurement: clear definition of the outcome provided | Low risk | FBG > 6.9; use of antidiabetic medication |
| Outcome measurement: method of outcome measurement used valid & reliable | Low risk | Yes |
| Outcome measurement: same method & setting of outcome measurement for all study participants | Low risk | Yes |
| Study confounding: important confounders measured | Unclear risk | Some confounders measured |
| Study confounding: clear definitions of important confounders provided | Low risk | Yes |
| Study confounding: measurement of confounders valid & reliable | Low risk | Yes |
| Study confounding: same method & setting for measurements of confounders for all study participants | Low risk | Yes |
| Study confounding: appropriate methods used if missing confounder data imputed | Unclear risk | Not reported |
| Study confounding: important potential confounders accounted for in study design | Unclear risk | Some confounders included |
| Study confounding: important potential confounders accounted for in the analysis | Unclear risk | Some confounders analysed |
| Statistical analysis & reporting: sufficient presentation of data to assess adequacy of the analytic strategy | Low risk | Cumulative incidence, odds ratio |
| Statistical analysis & reporting: the statistical model is adequate for the design of the study | Low risk | Multiple logistic regression models |
| Name of study | Ely Study (Cambridgeshire, UK) | |
| Inclusion criteria | All adults free of known diabetes registered with a single practice serving Ely, adults aged 40–69 years | |
| Exclusion criteria | Diabetes | |
| Notes | Baseline data for the IFG6.1 cohort (N = 257) Cumulative incidence increased across increasing age groups and was higher in men than in women | |
| Risk of bias | ||
| Bias | Authors' judgement | Support for judgement |
| Study participation: description of source population or population of interest | Low risk | The Ely Study (Cambridgeshire, UK) was a prospective study of the aetiology of T2DM |
| Study participation: description of glycaemic status at baseline | Low risk | Yes |
| Study participation: adequate description of sampling frame & recruitment | Low risk | Yes |
| Study participation: adequate description of period & recruitment place | Low risk | Yes |
| Study participation: adequate description of inclusion & exclusion criteria | Low risk | Inclusion and exclusion criteria described |
| Study attrition: description of attempts to collect information on participants who dropped out | Low risk | Yes |
| Study attrition: reasons for loss to follow‐up provided | Low risk | Yes |
| Study attrition: adequate description of participants lost to follow‐up | Low risk | Yes |
| Study attrition: no important differences between participants who completed the study and those who did not | Unclear risk | Scarce data |
| Glycaemic status measurement: provision of clear definition or description of glycaemic status | Low risk | IFG |
| Glycaemic status measurement: valid and reliable method of glycaemic status measurement | Low risk | Yes |
| Glycaemic status measurement: continuous variables reported or appropriate cut points used | Low risk | IFG6.1: FPG 6.1–6.9 (FPG < 7.0 and 2‐h PG < 11.1) and IFG5.6: FPG 5.6–6.0 |
| Glycaemic status measurement: same method and setting of measurement of the glycaemic status for all study participants | Low risk | Yes |
| Outcome measurement: clear definition of the outcome provided | Low risk | FPG ≥ 7.0; 2‐h PG ≥ 11.1; physician diagnosis or treatment for diabetes |
| Outcome measurement: method of outcome measurement used valid & reliable | Low risk | Yes |
| Outcome measurement: same method & setting of outcome measurement for all study participants | Low risk | Yes |
| Study confounding: important confounders measured | Unclear risk | Some confounders measured |
| Study confounding: clear definitions of important confounders provided | Low risk | Yes |
| Study confounding: measurement of confounders valid & reliable | Low risk | Yes |
| Study confounding: same method & setting for measurements of confounders for all study participants | Low risk | Yes |
| Study confounding: appropriate methods used if missing confounder data imputed | Unclear risk | Not reported |
| Study confounding: important potential confounders accounted for in study design | Low risk | Yes |
| Study confounding: important potential confounders accounted for in the analysis | Low risk | Yes |
| Statistical analysis & reporting: sufficient presentation of data to assess adequacy of the analytic strategy | Low risk | Cumulative incidence, incidence rate, hazard ratio |
| Statistical analysis & reporting: the statistical model is adequate for the design of the study | Low risk | Cox regression (cumulative hazard curves by glucose status) |
| Name of study | Sacramento Area Latino Study on Aging (SALSA) | |
| Inclusion criteria | Older Mexican Americans residing in the Sacramento metropolitan statistical area | |
| Exclusion criteria | Missing baseline diabetes status, certain neighbourhoods | |
| Notes | Baseline data for the IFG cohort (N = 310) | |
| Risk of bias | ||
| Bias | Authors' judgement | Support for judgement |
| Study participation: description of source population or population of interest | Low risk | Participants were from the Sacramento Area Latino Study on Aging (SALSA), a longitudinal cohort study of physical and cognitive impairment and cardiovascular diseases in community‐dwelling older Mexican Americans residing in the Sacramento Metropolltan Statistical Area |
| Study participation: description of glycaemic status at baseline | Low risk | Yes |
| Study participation: adequate description of sampling frame & recruitment | Low risk | Yes |
| Study participation: adequate description of period & recruitment place | Low risk | Yes |
| Study participation: adequate description of inclusion & exclusion criteria | Low risk | Inclusion and exclusion criteria reported |
| Study attrition: description of attempts to collect information on participants who dropped out | Low risk | Yes |
| Study attrition: reasons for loss to follow‐up provided | Low risk | Yes |
| Study attrition: adequate description of participants lost to follow‐up | Low risk | Yes |
| Study attrition: no important differences between participants who completed the study and those who did not | Low risk | Not reported but only 12/1789 participants were excluded |
| Glycaemic status measurement: provision of clear definition or description of glycaemic status | Low risk | IFG |
| Glycaemic status measurement: valid and reliable method of glycaemic status measurement | Low risk | Yes |
| Glycaemic status measurement: continuous variables reported or appropriate cut points used | Low risk | FBG 5.6–6.9 |
| Glycaemic status measurement: same method and setting of measurement of the glycaemic status for all study participants | Low risk | Yes |
| Outcome measurement: clear definition of the outcome provided | Low risk | FPG ≥ 7.0; self‐reported; antihyperglycaemic medication; diabetes comedication at death |
| Outcome measurement: method of outcome measurement used valid & reliable | Low risk | Yes |
| Outcome measurement: same method & setting of outcome measurement for all study participants | Low risk | Yes |
| Study confounding: important confounders measured | Unclear risk | Some confounders measured |
| Study confounding: clear definitions of important confounders provided | Low risk | Yes |
| Study confounding: measurement of confounders valid & reliable | Low risk | Yes |
| Study confounding: same method & setting for measurements of confounders for all study participants | Low risk | Yes |
| Study confounding: appropriate methods used if missing confounder data imputed | Unclear risk | Not reported |
| Study confounding: important potential confounders accounted for in study design | Low risk | Multistate Markov models |
| Study confounding: important potential confounders accounted for in the analysis | Low risk | Multistate Markov models |
| Statistical analysis & reporting: sufficient presentation of data to assess adequacy of the analytic strategy | Low risk | Cumulative incidence (hazard ratio was calculated for the association between neighbourhood scocioeconomic position (NSEP) scores and transitions between various (pre)diabetic stages) |
| Statistical analysis & reporting: the statistical model is adequate for the design of the study | Low risk | Multistate Markov models |
| Name of study | Data from an Epidemiological Study on the Insulin Resistance Syndrome (DESIR) cohort | |
| Inclusion criteria | Men and women aged 30–64 years recruited from volunteers who were offered periodic health examinations free of charge by the French Social Security at 10 health centres in western France | |
| Exclusion criteria | Diabetes at baseline, individuals with unknown diabetes status at the 9‐year examination | |
| Notes | No baseline data for cohort with intermediate hyperglycaemia | |
| Risk of bias | ||
| Bias | Authors' judgement | Support for judgement |
| Study participation: description of source population or population of interest | Low risk | Participants of the Data from an Epidemiological Study on the Insulin Resistance Syndrome (DESIR) cohort who had IFG at baseline |
| Study participation: description of glycaemic status at baseline | Low risk | Yes |
| Study participation: adequate description of sampling frame & recruitment | Unclear risk | Key characteristics unclear |
| Study participation: adequate description of period & recruitment place | Unclear risk | Time frame unclear |
| Study participation: adequate description of inclusion & exclusion criteria | Low risk | Inclusion and exclusion criteria described |
| Study attrition: description of attempts to collect information on participants who dropped out | High risk | Not reported |
| Study attrition: reasons for loss to follow‐up provided | Unclear risk | Scarce data |
| Study attrition: adequate description of participants lost to follow‐up | Unclear risk | Scarce data |
| Study attrition: no important differences between participants who completed the study and those who did not | Unclear risk | Not reported |
| Glycaemic status measurement: provision of clear definition or description of glycaemic status | Low risk | IFG |
| Glycaemic status measurement: valid and reliable method of glycaemic status measurement | Low risk | Yes |
| Glycaemic status measurement: continuous variables reported or appropriate cut points used | Low risk | IFG: FPG 5.6–6.9 |
| Glycaemic status measurement: same method and setting of measurement of the glycaemic status for all study participants | Low risk | Yes |
| Outcome measurement: clear definition of the outcome provided | Low risk | FPG ≥ 7.0; treatment for diabetes (at 1 of the 3‐yearly examinations) |
| Outcome measurement: method of outcome measurement used valid & reliable | Low risk | Yes |
| Outcome measurement: same method & setting of outcome measurement for all study participants | Low risk | Yes |
| Study confounding: important confounders measured | Low risk | Some confounders measured |
| Study confounding: clear definitions of important confounders provided | Low risk | Yes |
| Study confounding: measurement of confounders valid & reliable | Low risk | Yes |
| Study confounding: same method & setting for measurements of confounders for all study participants | Unclear risk | Yes |
| Study confounding: appropriate methods used if missing confounder data imputed | Unclear risk | Not reported |
| Study confounding: important potential confounders accounted for in study design | Low risk | Yes (see below) |
| Study confounding: important potential confounders accounted for in the analysis | Low risk | Yes (see below) |
| Statistical analysis & reporting: sufficient presentation of data to assess adequacy of the analytic strategy | Low risk | Cumulative incidence (odds ratios for 9‐year incident diabetes per 1 SD change in waist circumference and weight in IFG) |
| Statistical analysis & reporting: the statistical model is adequate for the design of the study | Low risk | Logistic models (for increases in waist circumference and weight) |
| Name of study | None | |
| Inclusion criteria | Adults ≥ 35 years attending a general practitioner for any reason | |
| Exclusion criteria | Known diabetes, acute illness, pregnancy, use of antihyperglycaemic medication | |
| Notes | Baseline data for the total cohort (N = 772) | |
| Risk of bias | ||
| Bias | Authors' judgement | Support for judgement |
| Study participation: description of source population or population of interest | Low risk | Longitudinal observational study conducted in a healthcare centre in Floridablanca, Colombia |
| Study participation: description of glycaemic status at baseline | Low risk | Yes |
| Study participation: adequate description of sampling frame & recruitment | Low risk | The sub‐sample of people with intermediate hyperglycaemia was followed for diabetes incidence |
| Study participation: adequate description of period & recruitment place | Low risk | Yes |
| Study participation: adequate description of inclusion & exclusion criteria | Low risk | Inclusion and exclusion criteria described |
| Study attrition: description of attempts to collect information on participants who dropped out | High risk | Not reported |
| Study attrition: reasons for loss to follow‐up provided | High risk | Not reported |
| Study attrition: adequate description of participants lost to follow‐up | High risk | Not reported |
| Study attrition: no important differences between participants who completed the study and those who did not | Unclear risk | Not reported |
| Glycaemic status measurement: provision of clear definition or description of glycaemic status | Low risk | Intermediate hyperglycaemia as measured by FPG, OGTT, HbA1c; FINDRISC score |
| Glycaemic status measurement: valid and reliable method of glycaemic status measurement | Low risk | Yes |
| Glycaemic status measurement: continuous variables reported or appropriate cut points used | Low risk | IFG: ≥ 5.6 to < 7.0; IGT: ≥ 7.8 to < 11.1; HbA1c ≥ 5.7 to ≤ 6.4 |
| Glycaemic status measurement: same method and setting of measurement of the glycaemic status for all study participants | Low risk | Yes |
| Outcome measurement: clear definition of the outcome provided | Low risk | FPG ≥ 7.0; OGTT ≥ 11.1; HbA1c ≥ 6.5 |
| Outcome measurement: method of outcome measurement used valid & reliable | Low risk | Yes |
| Outcome measurement: same method & setting of outcome measurement for all study participants | Low risk | Yes |
| Study confounding: important confounders measured | Unclear risk | Age and sex‐adjusted odds ratios for FINDRISC score |
| Study confounding: clear definitions of important confounders provided | Low risk | Yes |
| Study confounding: measurement of confounders valid & reliable | Low risk | Yes |
| Study confounding: same method & setting for measurements of confounders for all study participants | Low risk | Yes |
| Study confounding: appropriate methods used if missing confounder data imputed | Unclear risk | Not reported |
| Study confounding: important potential confounders accounted for in study design | Low risk | For FINDRISC score |
| Study confounding: important potential confounders accounted for in the analysis | Unclear risk | Age and sex‐adjusted odds ratios |
| Statistical analysis & reporting: sufficient presentation of data to assess adequacy of the analytic strategy | Low risk | Cumulative incidence, incidence rate |
| Statistical analysis & reporting: the statistical model is adequate for the design of the study | Low risk | Multivariate logistic regression for the association between the FINDRISC score and incident T2DM |
| Name of study | None | |
| Inclusion criteria | Men and non‐pregnant women, aged 20–64 years, were recruited from the city of Durango, northern Mexico; with NGT or IGT | |
| Exclusion criteria | Participants who failed to attend 2 or more visits | |
| Notes | Baseline data for IGT cohort at baseline progressing to T2DM (N = 20); all individuals were counselled on the importance of diet and physical exercise (standard care for the whole cohort) | |
| Risk of bias | ||
| Bias | Authors' judgement | Support for judgement |
| Study participation: description of source population or population of interest | Low risk | Cohort study in healthy Mexicans to determine predictors for the development of metabolic disorders |
| Study participation: description of glycaemic status at baseline | Low risk | Yes |
| Study participation: adequate description of sampling frame & recruitment | Unclear risk | Time frame unclear |
| Study participation: adequate description of period & recruitment place | Unclear risk | Period of recruitment unclear |
| Study participation: adequate description of inclusion & exclusion criteria | Low risk | Inclusion and exclusion criteria described |
| Study attrition: description of attempts to collect information on participants who dropped out | Unclear risk | Not reported |
| Study attrition: reasons for loss to follow‐up provided | Unclear risk | Not reported |
| Study attrition: adequate description of participants lost to follow‐up | Unclear risk | Not reported |
| Study attrition: no important differences between participants who completed the study and those who did not | Unclear risk | Not reported |
| Glycaemic status measurement: provision of clear definition or description of glycaemic status | Low risk | IGT |
| Glycaemic status measurement: valid and reliable method of glycaemic status measurement | Low risk | Yes |
| Glycaemic status measurement: continuous variables reported or appropriate cut points used | Low risk | IGT: 2‐h PG ≥ 7.8 to < 11.1 |
| Glycaemic status measurement: same method and setting of measurement of the glycaemic status for all study participants | Low risk | Yes |
| Outcome measurement: clear definition of the outcome provided | Low risk | 2‐h PG: ≥ 11.1 |
| Outcome measurement: method of outcome measurement used valid & reliable | Low risk | Yes |
| Outcome measurement: same method & setting of outcome measurement for all study participants | Low risk | Yes |
| Study confounding: important confounders measured | Unclear risk | Some covariates measured (for association between beta‐cell function and IGT/T2DM) (see Appendix 16 and Appendix 17) |
| Study confounding: clear definitions of important confounders provided | Unclear risk | Not reported |
| Study confounding: measurement of confounders valid & reliable | Unclear risk | Not reported |
| Study confounding: same method & setting for measurements of confounders for all study participants | Low risk | Yes |
| Study confounding: appropriate methods used if missing confounder data imputed | Unclear risk | Not reported |
| Study confounding: important potential confounders accounted for in study design | Low risk | For beta‐cell function and IGT/T2DM |
| Study confounding: important potential confounders accounted for in the analysis | Unclear risk | Some confounders measured |
| Statistical analysis & reporting: sufficient presentation of data to assess adequacy of the analytic strategy | Low risk | Cumulative incidence, incidence rate |
| Statistical analysis & reporting: the statistical model is adequate for the design of the study | Low risk | Multivariate logistic regression on relative risk of IGT or T2DM associated with beta‐cell function |
| Name of study | Ansung‐Ansan cohort study, part of the Korean Genome and Epidemiology Study (KoGES), to investigate the trends in diabetes and associated risk factors | |
| Inclusion criteria | Urban (Ansan) and rural (Ansung) communities (within 60 km of Seoul) | |
| Exclusion criteria | Unknown glucose status, individuals with known diabetes, participants who were newly diagnosed with type 2 diabetes at baseline examination; persons with a history of malignant diseases, | |
| Notes | Baseline data for i‐IFG, i‐IGT and IFG/IGT | |
| Risk of bias | ||
| Bias | Authors' judgement | Support for judgement |
| Study participation: description of source population or population of interest | Low risk | Ansung‐Ansan Cohort Study, part of the Korean Genome and Epidemiology Study (KoGES) |
| Study participation: description of glycaemic status at baseline | Low risk | Yes |
| Study participation: adequate description of sampling frame & recruitment | Low risk | Yes |
| Study participation: adequate description of period & recruitment place | Low risk | Yes |
| Study participation: adequate description of inclusion & exclusion criteria | Low risk | Inclusion and exclusion criteria described |
| Study attrition: description of attempts to collect information on participants who dropped out | Low risk | Yes |
| Study attrition: reasons for loss to follow‐up provided | Low risk | Yes (follow‐up rate at 12 years 60.6%) |
| Study attrition: adequate description of participants lost to follow‐up | Low risk | Yes |
| Study attrition: no important differences between participants who completed the study and those who did not | Unclear risk | Not reported |
| Glycaemic status measurement: provision of clear definition or description of glycaemic status | Low risk | Yes |
| Glycaemic status measurement: valid and reliable method of glycaemic status measurement | Low risk | Yes |
| Glycaemic status measurement: continuous variables reported or appropriate cut points used | Low risk | IFG: FPG 5.6–6.9 and no diagnosis of diabetes; IGT: 2‐h PG 7.8 to < 11.1; i‐IFG5.6: IFG without IGT; i‐IGT: IGT without IFG; IGT/IGT: IFG+IGT; 'prediabetes': IFG or IGT |
| Glycaemic status measurement: same method and setting of measurement of the glycaemic status for all study participants | Low risk | Yes |
| Outcome measurement: clear definition of the outcome provided | Low risk | FPG ≥ 7.0; 2‐h PG ≥ 11.1; HbA1c ≥ 6.5; current antihyperglycaemic treatment |
| Outcome measurement: method of outcome measurement used valid & reliable | Low risk | Yes |
| Outcome measurement: same method & setting of outcome measurement for all study participants | Low risk | Yes |
| Study confounding: important confounders measured | Low risk | Yes |
| Study confounding: clear definitions of important confounders provided | Low risk | Yes |
| Study confounding: measurement of confounders valid & reliable | Low risk | Yes |
| Study confounding: same method & setting for measurements of confounders for all study participants | Low risk | Yes |
| Study confounding: appropriate methods used if missing confounder data imputed | Unclear risk | Not reported |
| Study confounding: important potential confounders accounted for in study design | Low risk | Yes |
| Study confounding: important potential confounders accounted for in the analysis | Low risk | Yes |
| Statistical analysis & reporting: sufficient presentation of data to assess adequacy of the analytic strategy | Low risk | Cumulative incidence, incidence rate, hazard ratio |
| Statistical analysis & reporting: the statistical model is adequate for the design of the study | Low risk | Multivariate Cox proportional hazard model |
| Name of study | Insulin Resistance Atherosclerosis Study (IRAS) | |
| Inclusion criteria | 4 clinical centres (Oakland, Los Angeles ‐ non‐Hispanic whites and blacks recruited from Kaiser Permanente) and San Antonio, San Luis Valley (non‐Hispanic whites and Hispanics): from 2 population‐based studies (San Antonio Heart Study and the San Luis Valley Diabetes study) | |
| Exclusion criteria | Participants with inflammatory diseases; diabetes; no information on metabolic variables of interest and follow‐up glucose tolerance status | |
| Notes | Baseline data for diabetic cohort at follow‐up (N = 131); participants were recruited from 2 population‐based studies: the San Antonio Heart Study and the San Luis Valley diabetes study | |
| Risk of bias | ||
| Bias | Authors' judgement | Support for judgement |
| Study participation: description of source population or population of interest | Low risk | Observational study of the relationship between insulin resistance, cardiovascular disease and its known risk factors in different ethnic groups and varying states of glucose tolerance; the study was conducted at 4 clinical centres; report on individuals who were nondiabetic at baseline and for whom information was available on metabolic variables of interest and follow‐up glucose tolerance status |
| Study participation: description of glycaemic status at baseline | Low risk | Yes |
| Study participation: adequate description of sampling frame & recruitment | Low risk | Yes |
| Study participation: adequate description of period & recruitment place | Low risk | Yes |
| Study participation: adequate description of inclusion & exclusion criteria | Low risk | Inclusion and exclusion criteria described |
| Study attrition: description of attempts to collect information on participants who dropped out | Low risk | Response rate 81% |
| Study attrition: reasons for loss to follow‐up provided | Unclear risk | Scarce data |
| Study attrition: adequate description of participants lost to follow‐up | Unclear risk | Scarce data |
| Study attrition: no important differences between participants who completed the study and those who did not | Low risk | Yes |
| Glycaemic status measurement: provision of clear definition or description of glycaemic status | Low risk | Yes |
| Glycaemic status measurement: valid and reliable method of glycaemic status measurement | Unclear risk | Yes |
| Glycaemic status measurement: continuous variables reported or appropriate cut points used | Low risk | IFG, IGT (WHO 1999) |
| Glycaemic status measurement: same method and setting of measurement of the glycaemic status for all study participants | Low risk | Yes |
| Outcome measurement: clear definition of the outcome provided | High risk | Not specified |
| Outcome measurement: method of outcome measurement used valid & reliable | Low risk | Yes |
| Outcome measurement: same method & setting of outcome measurement for all study participants | Low risk | Yes |
| Study confounding: important confounders measured | Unclear risk | Some covariates measured (see Appendix 16 and Appendix 17) |
| Study confounding: clear definitions of important confounders provided | Low risk | Yes |
| Study confounding: measurement of confounders valid & reliable | Low risk | Yes |
| Study confounding: same method & setting for measurements of confounders for all study participants | Low risk | Yes |
| Study confounding: appropriate methods used if missing confounder data imputed | Unclear risk | Not reported |
| Study confounding: important potential confounders accounted for in study design | Unclear risk | Some covariates measured (see Appendix 16 and Appendix 17) |
| Study confounding: important potential confounders accounted for in the analysis | Unclear risk | Some covariates (age, sex, clinical centre, ethnicity) (see Appendix 16 and Appendix 17) |
| Statistical analysis & reporting: sufficient presentation of data to assess adequacy of the analytic strategy | Low risk | Cumulative incidence, odds ratio |
| Statistical analysis & reporting: the statistical model is adequate for the design of the study | Low risk | Logistic regression |
| Name of study | Toranomon Hospital Health Management Center Study (TOPICS) | |
| Inclusion criteria | Participants from the TOPICS: apparently healthy Japanese government employees who underwent annual multiphasic health screening examinations; the study attempted to elucidate the incidence of and risk factors for various diseases among the Japanese population | |
| Exclusion criteria | Diabetes at baseline, missing data at baseline | |
| Notes | Baseline data for the total cohort (N = 6241) | |
| Risk of bias | ||
| Bias | Authors' judgement | Support for judgement |
| Study participation: description of source population or population of interest | Low risk | Healthy Japanese government employees who underwent annual examinations for health screening |
| Study participation: description of glycaemic status at baseline | Low risk | Yes |
| Study participation: adequate description of sampling frame & recruitment | Low risk | Yes |
| Study participation: adequate description of period & recruitment place | Low risk | Yes |
| Study participation: adequate description of inclusion & exclusion criteria | Low risk | Inclusion and exclusion criteria described |
| Study attrition: description of attempts to collect information on participants who dropped out | Unclear risk | Scarce data |
| Study attrition: reasons for loss to follow‐up provided | Unclear risk | Not reported |
| Study attrition: adequate description of participants lost to follow‐up | Unclear risk | Not reported |
| Study attrition: no important differences between participants who completed the study and those who did not | Unclear risk | Not reported |
| Glycaemic status measurement: provision of clear definition or description of glycaemic status | Low risk | Yes |
| Glycaemic status measurement: valid and reliable method of glycaemic status measurement | Low risk | Yes |
| Glycaemic status measurement: continuous variables reported or appropriate cut points used | Low risk | IFG: FPG 5.6–6.9 or FPG 6.1–6.9; HbA1c 5.7 ‐6.4 or 6.0–6.4; IFG/HbA1c = 'prediabetes' |
| Glycaemic status measurement: same method and setting of measurement of the glycaemic status for all study participants | Low risk | Yes |
| Outcome measurement: clear definition of the outcome provided | Low risk | FPG ≥ 7.0; HbA1c ≥ 6.5%; self‐reported clinician‐diagnosed diabetes |
| Outcome measurement: method of outcome measurement used valid & reliable | Low risk | Yes |
| Outcome measurement: same method & setting of outcome measurement for all study participants | Low risk | Yes |
| Study confounding: important confounders measured | Low risk | Yes |
| Study confounding: clear definitions of important confounders provided | Low risk | Yes |
| Study confounding: measurement of confounders valid & reliable | Low risk | Yes |
| Study confounding: same method & setting for measurements of confounders for all study participants | Low risk | Yes |
| Study confounding: appropriate methods used if missing confounder data imputed | Unclear risk | Not reported |
| Study confounding: important potential confounders accounted for in study design | Low risk | Yes |
| Study confounding: important potential confounders accounted for in the analysis | Low risk | Yes |
| Statistical analysis & reporting: sufficient presentation of data to assess adequacy of the analytic strategy | Low risk | Cumulative incidence, incidence rate, hazard ratio |
| Statistical analysis & reporting: the statistical model is adequate for the design of the study | Low risk | Cox regression, multivariate model |
| Name of study | None | |
| Inclusion criteria | Non‐obese participants with IGT and 22 normal control persons were selected from the participants of a health screening programme | |
| Exclusion criteria | People with liver or kidney diseases | |
| Notes | Baseline data for the IGT cohort (N = 37) | |
| Risk of bias | ||
| Bias | Authors' judgement | Support for judgement |
| Study participation: description of source population or population of interest | Unclear risk | Participants of a health screening programme |
| Study participation: description of glycaemic status at baseline | Low risk | Yes |
| Study participation: adequate description of sampling frame & recruitment | Unclear risk | Scarce data |
| Study participation: adequate description of period & recruitment place | Unclear risk | Scarce data |
| Study participation: adequate description of inclusion & exclusion criteria | Low risk | Inclusion and exclusion criteria described |
| Study attrition: description of attempts to collect information on participants who dropped out | Unclear risk | Not reported |
| Study attrition: reasons for loss to follow‐up provided | Unclear risk | Not reported |
| Study attrition: adequate description of participants lost to follow‐up | Unclear risk | Not reported |
| Study attrition: no important differences between participants who completed the study and those who did not | Unclear risk | Not reported |
| Glycaemic status measurement: provision of clear definition or description of glycaemic status | Low risk | IGT |
| Glycaemic status measurement: valid and reliable method of glycaemic status measurement | Low risk | Yes |
| Glycaemic status measurement: continuous variables reported or appropriate cut points used | Low risk | IGT: ≥ 7.8 to < 11.1 (presumed WHO 1985) |
| Glycaemic status measurement: same method and setting of measurement of the glycaemic status for all study participants | Low risk | Yes |
| Outcome measurement: clear definition of the outcome provided | Low risk | IGT: ≥ 11.1 (presumed WHO 1985) |
| Outcome measurement: method of outcome measurement used valid & reliable | Low risk | Yes |
| Outcome measurement: same method & setting of outcome measurement for all study participants | Low risk | Yes |
| Study confounding: important confounders measured | Unclear risk | Not reported, cumulative incidence data |
| Study confounding: clear definitions of important confounders provided | Unclear risk | Not reported |
| Study confounding: measurement of confounders valid & reliable | Unclear risk | Not reported |
| Study confounding: same method & setting for measurements of confounders for all study participants | Unclear risk | Not reported |
| Study confounding: appropriate methods used if missing confounder data imputed | Unclear risk | Not reported |
| Study confounding: important potential confounders accounted for in study design | Unclear risk | Not reported, cumulative incidence data |
| Study confounding: important potential confounders accounted for in the analysis | Unclear risk | Not reported |
| Statistical analysis & reporting: sufficient presentation of data to assess adequacy of the analytic strategy | Low risk | Cumulative incidence |
| Statistical analysis & reporting: the statistical model is adequate for the design of the study | Low risk | Kruskal‐Wallis test |
| Name of study | Isfahan Diabetes Prevention Study (IDPS) | |
| Inclusion criteria | Participants with a family history of type 2 diabetes, being non‐diabetic | |
| Exclusion criteria | Type 1 diabetes, pregnancy | |
| Notes | Baseline data for i‐IFG, i‐IGT and IFG/IGT cohort (N = 770); first‐degree relatives of people with T2DM; data on the cohort without hypertension at baseline | |
| Risk of bias | ||
| Bias | Authors' judgement | Support for judgement |
| Study participation: description of source population or population of interest | Low risk | Ongoing cohort in central Iran to assess the various potential risk factors for diabetes in people with a family history of T2DM |
| Study participation: description of glycaemic status at baseline | Low risk | Yes |
| Study participation: adequate description of sampling frame & recruitment | Low risk | Yes |
| Study participation: adequate description of period & recruitment place | Low risk | Yes |
| Study participation: adequate description of inclusion & exclusion criteria | Low risk | Description of inclusion and exclusion criteria |
| Study attrition: description of attempts to collect information on participants who dropped out | Low risk | Yes |
| Study attrition: reasons for loss to follow‐up provided | Low risk | Yes |
| Study attrition: adequate description of participants lost to follow‐up | Low risk | Yes |
| Study attrition: no important differences between participants who completed the study and those who did not | Low risk | Yes |
| Glycaemic status measurement: provision of clear definition or description of glycaemic status | Low risk | Yes |
| Glycaemic status measurement: valid and reliable method of glycaemic status measurement | Low risk | Yes |
| Glycaemic status measurement: continuous variables reported or appropriate cut points used | Low risk | i‐IGT: FPG < 5.6 and 2‐h PG 7.8–11.1; i‐IFG: 5.6–6.9 and 2‐h PG < 7.8; IFG/IGT: 5.6–6.9 and 2‐h PG 7.8–11.1 |
| Glycaemic status measurement: same method and setting of measurement of the glycaemic status for all study participants | Low risk | Yes |
| Outcome measurement: clear definition of the outcome provided | Low risk | FPG ≥ 11.1; antihyperglycaemic medication; 2nd FPG ≥ 7.0; 2‐h PG ≥ 11.1 |
| Outcome measurement: method of outcome measurement used valid & reliable | Low risk | Yes |
| Outcome measurement: same method & setting of outcome measurement for all study participants | Low risk | Yes |
| Study confounding: important confounders measured | Unclear risk | Some covariates measured (see Appendix 16 and Appendix 17) |
| Study confounding: clear definitions of important confounders provided | Low risk | Yes |
| Study confounding: measurement of confounders valid & reliable | Low risk | Yes |
| Study confounding: same method & setting for measurements of confounders for all study participants | Low risk | Yes |
| Study confounding: appropriate methods used if missing confounder data imputed | Unclear risk | Not reported |
| Study confounding: important potential confounders accounted for in study design | Unclear risk | Some covariates measured (age, sex, BMI, triglycerides, total cholesterol) (see Appendix 16 and Appendix 17) |
| Study confounding: important potential confounders accounted for in the analysis | Unclear risk | Some covariates measured (age, sex, BMI, triglycerides, total cholesterol) (see Appendix 16 and Appendix 17) |
| Statistical analysis & reporting: sufficient presentation of data to assess adequacy of the analytic strategy | Low risk | Cumulative incidence, incidence rate, hazard ratio |
| Statistical analysis & reporting: the statistical model is adequate for the design of the study | Low risk | Cox proportional hazards model |
| Name of study | None | |
| Inclusion criteria | Obese Thai children and adolescents aged 8–15 years, Pediatric Endocrine Clinic at Songklanagarind Hospital (Hat Yai, Songkhia Thailand) | |
| Exclusion criteria | No clinical findings of secondary obesity, not on corticosteroids | |
| Notes | Baseline data for IGT cohort (N = 27) | |
| Risk of bias | ||
| Bias | Authors' judgement | Support for judgement |
| Study participation: description of source population or population of interest | Low risk | Yes |
| Study participation: description of glycaemic status at baseline | Low risk | Yes |
| Study participation: adequate description of sampling frame & recruitment | Low risk | Yes |
| Study participation: adequate description of period & recruitment place | Low risk | Yes |
| Study participation: adequate description of inclusion & exclusion criteria | Low risk | Inclusion and exclusion criteria described |
| Study attrition: description of attempts to collect information on participants who dropped out | Unclear risk | Scarce data |
| Study attrition: reasons for loss to follow‐up provided | High risk | Not reported |
| Study attrition: adequate description of participants lost to follow‐up | Unclear risk | Scarce data |
| Study attrition: no important differences between participants who completed the study and those who did not | Unclear risk | Not reported |
| Glycaemic status measurement: provision of clear definition or description of glycaemic status | Low risk | Yes |
| Glycaemic status measurement: valid and reliable method of glycaemic status measurement | Low risk | Yes |
| Glycaemic status measurement: continuous variables reported or appropriate cut points used | Low risk | (i)‐IGT: FPG < 5.6 and 2‐h PG 7.8 to < 11.1 |
| Glycaemic status measurement: same method and setting of measurement of the glycaemic status for all study participants | Low risk | Yes |
| Outcome measurement: clear definition of the outcome provided | Low risk | FPG > 7.0; 2‐h PG ≥ 11.1 |
| Outcome measurement: method of outcome measurement used valid & reliable | Low risk | Yes |
| Outcome measurement: same method & setting of outcome measurement for all study participants | Low risk | Yes |
| Study confounding: important confounders measured | Unclear risk | Cumulative incidence |
| Study confounding: clear definitions of important confounders provided | Unclear risk | Not reported |
| Study confounding: measurement of confounders valid & reliable | Unclear risk | Not reported |
| Study confounding: same method & setting for measurements of confounders for all study participants | Unclear risk | Not reported |
| Study confounding: appropriate methods used if missing confounder data imputed | Unclear risk | Not reported |
| Study confounding: important potential confounders accounted for in study design | Unclear risk | Not reported |
| Study confounding: important potential confounders accounted for in the analysis | Unclear risk | Not reported |
| Statistical analysis & reporting: sufficient presentation of data to assess adequacy of the analytic strategy | Low risk | Cumulative incidence |
| Statistical analysis & reporting: the statistical model is adequate for the design of the study | Low risk | Cox regression analysis for ROC curves (cut‐off FPG levels) |
| Name of study | None | |
| Inclusion criteria | People older 20 years living in the rural area of Dalseong County near Daegu visiting community health centres | |
| Exclusion criteria | Not reported | |
| Notes | 1287 participants were re‐evaluated in 2008 and 187 new participants "added to the study"; baseline data for participants with incident diabetes (N = 135) | |
| Risk of bias | ||
| Bias | Authors' judgement | Support for judgement |
| Study participation: description of source population or population of interest | Low risk | Population‐based survey to determine the prevalence and incidence of 'prediabetes' and diabetes |
| Study participation: description of glycaemic status at baseline | Low risk | Yes |
| Study participation: adequate description of sampling frame & recruitment | Low risk | Yes |
| Study participation: adequate description of period & recruitment place | Low risk | Yes |
| Study participation: adequate description of inclusion & exclusion criteria | Unclear risk | Only inclusion criteria described |
| Study attrition: description of attempts to collect information on participants who dropped out | High risk | Several surveys plus new recruitment; follow‐up rate 80.5%; no description of dropouts |
| Study attrition: reasons for loss to follow‐up provided | High risk | Not reported |
| Study attrition: adequate description of participants lost to follow‐up | High risk | Not reported |
| Study attrition: no important differences between participants who completed the study and those who did not | Unclear risk | Not reported |
| Glycaemic status measurement: provision of clear definition or description of glycaemic status | Low risk | Yes |
| Glycaemic status measurement: valid and reliable method of glycaemic status measurement | Low risk | Yes |
| Glycaemic status measurement: continuous variables reported or appropriate cut points used | Low risk | IFG: FPG ≥ 5.6 to < 7.0; IGT: 2‐h PG ≥ 7.8 to < 11.1; 'prediabetes': IFG or IGT |
| Glycaemic status measurement: same method and setting of measurement of the glycaemic status for all study participants | Low risk | Yes |
| Outcome measurement: clear definition of the outcome provided | Low risk | FPG ≥ 7.0; 2‐h PG ≥ 11.1 |
| Outcome measurement: method of outcome measurement used valid & reliable | Low risk | Yes |
| Outcome measurement: same method & setting of outcome measurement for all study participants | Low risk | Yes |
| Study confounding: important confounders measured | Low risk | Several covariates were measured (see Appendix 16 and Appendix 17) |
| Study confounding: clear definitions of important confounders provided | Unclear risk | Not reported |
| Study confounding: measurement of confounders valid & reliable | Unclear risk | Not reported |
| Study confounding: same method & setting for measurements of confounders for all study participants | Low risk | Yes |
| Study confounding: appropriate methods used if missing confounder data imputed | Unclear risk | Not reported |
| Study confounding: important potential confounders accounted for in study design | Low risk | Yes |
| Study confounding: important potential confounders accounted for in the analysis | Low risk | Yes |
| Statistical analysis & reporting: sufficient presentation of data to assess adequacy of the analytic strategy | Unclear risk | Odds ratio |
| Statistical analysis & reporting: the statistical model is adequate for the design of the study | Low risk | Logistic regression models |
| Name of study | None | |
| Inclusion criteria | Individuals 35 years or older participating in the annual physical checkup at least twice during the years 2001–2005 | |
| Exclusion criteria | People with diabetes | |
| Notes | Baseline data for total cohort becoming diabetic at follow‐up (N = 48) | |
| Risk of bias | ||
| Bias | Authors' judgement | Support for judgement |
| Study participation: description of source population or population of interest | Low risk | University hospital employees |
| Study participation: description of glycaemic status at baseline | Low risk | Yes |
| Study participation: adequate description of sampling frame & recruitment | Low risk | Yes |
| Study participation: adequate description of period & recruitment place | Low risk | Yes |
| Study participation: adequate description of inclusion & exclusion criteria | Low risk | Inclusion and exclusion criteria described |
| Study attrition: description of attempts to collect information on participants who dropped out | Unclear risk | Not reported |
| Study attrition: reasons for loss to follow‐up provided | Unclear risk | Not reported |
| Study attrition: adequate description of participants lost to follow‐up | Unclear risk | Not reported |
| Study attrition: no important differences between participants who completed the study and those who did not | Unclear risk | Not reported |
| Glycaemic status measurement: provision of clear definition or description of glycaemic status | Low risk | Yes |
| Glycaemic status measurement: valid and reliable method of glycaemic status measurement | Low risk | Yes |
| Glycaemic status measurement: continuous variables reported or appropriate cut points used | Low risk | IFG: FPG ≥ 5.6 to < 7.0 |
| Glycaemic status measurement: same method and setting of measurement of the glycaemic status for all study participants | Low risk | Yes |
| Outcome measurement: clear definition of the outcome provided | Low risk | FPG ≥ 7.0 |
| Outcome measurement: method of outcome measurement used valid & reliable | Low risk | Yes |
| Outcome measurement: same method & setting of outcome measurement for all study participants | Low risk | Yes |
| Study confounding: important confounders measured | Unclear risk | Logistic regression on hepatic enzymes; incidence rate: few covariates (see Appendix 16 and Appendix 17) |
| Study confounding: clear definitions of important confounders provided | Unclear risk | Logistic regression on hepatic enzymes |
| Study confounding: measurement of confounders valid & reliable | Unclear risk | Logistic regression on hepatic enzymes |
| Study confounding: same method & setting for measurements of confounders for all study participants | Unclear risk | Logistic regression on hepatic enzymes |
| Study confounding: appropriate methods used if missing confounder data imputed | Unclear risk | Logistic regression on hepatic enzymes |
| Study confounding: important potential confounders accounted for in study design | Unclear risk | lLogistic regression on hepatic enzymes |
| Study confounding: important potential confounders accounted for in the analysis | Unclear risk | Logistic regression on hepatic enzymes |
| Statistical analysis & reporting: sufficient presentation of data to assess adequacy of the analytic strategy | Low risk | Cumulative incidence, incidence rate |
| Statistical analysis & reporting: the statistical model is adequate for the design of the study | Low risk | Logistic regression (independent variables: hepatic enzymes) and Poisson regression analyses |
| Name of study | None | |
| Inclusion criteria | People visiting the Health Promotion Centre of Samsung Medical Center for a physical health check‐up | |
| Exclusion criteria | Diabetes | |
| Notes | Baseline data for FPG group 4 (6.1–7.0) with baseline and follow‐up (N = 276) | |
| Risk of bias | ||
| Bias | Authors' judgement | Support for judgement |
| Study participation: description of source population or population of interest | Low risk | Yes |
| Study participation: description of glycaemic status at baseline | Low risk | Yes (FPG categories) |
| Study participation: adequate description of sampling frame & recruitment | Low risk | Yes |
| Study participation: adequate description of period & recruitment place | Low risk | Yes |
| Study participation: adequate description of inclusion & exclusion criteria | Low risk | Inclusion and exclusion criteria described |
| Study attrition: description of attempts to collect information on participants who dropped out | Unclear risk | Participation rate 20.9% in group 4; scarce data |
| Study attrition: reasons for loss to follow‐up provided | Unclear risk | Not reported |
| Study attrition: adequate description of participants lost to follow‐up | Unclear risk | Not reported |
| Study attrition: no important differences between participants who completed the study and those who did not | Unclear risk | Not reported |
| Glycaemic status measurement: provision of clear definition or description of glycaemic status | Low risk | Yes |
| Glycaemic status measurement: valid and reliable method of glycaemic status measurement | Low risk | Yes |
| Glycaemic status measurement: continuous variables reported or appropriate cut points used | Low risk | IFG: FPG 6.1 to < 7.0 (group 4) |
| Glycaemic status measurement: same method and setting of measurement of the glycaemic status for all study participants | Low risk | Yes |
| Outcome measurement: clear definition of the outcome provided | Low risk | FPG ≥ 7.0; antihyperglycaemic treatment |
| Outcome measurement: method of outcome measurement used valid & reliable | Low risk | Yes |
| Outcome measurement: same method & setting of outcome measurement for all study participants | Low risk | Yes |
| Study confounding: important confounders measured | Low risk | Several covariates measured (see Appendix 16 and Appendix 17) |
| Study confounding: clear definitions of important confounders provided | Unclear risk | Scarce data |
| Study confounding: measurement of confounders valid & reliable | Unclear risk | Scarce data |
| Study confounding: same method & setting for measurements of confounders for all study participants | Low risk | Yes |
| Study confounding: appropriate methods used if missing confounder data imputed | Unclear risk | Not reported |
| Study confounding: important potential confounders accounted for in study design | Low risk | Yes |
| Study confounding: important potential confounders accounted for in the analysis | Low risk | Yes |
| Statistical analysis & reporting: sufficient presentation of data to assess adequacy of the analytic strategy | Low risk | Cumulative incidence, hazard ratio |
| Statistical analysis & reporting: the statistical model is adequate for the design of the study | Low risk | Cox regression analysis |
| Name of study | None | |
| Inclusion criteria | Individuals undergoing a medical examination at Inha University Hospital with a follow‐up medical examination 2 years later | |
| Exclusion criteria | Individuals diagnosed with diabetes at baseline | |
| Notes | Baseline data for IFG5.6/IFG6.1 cohort (N = 1335/N = 494) | |
| Risk of bias | ||
| Bias | Authors' judgement | Support for judgement |
| Study participation: description of source population or population of interest | Low risk | Participants who underwent a medical examination at Inha University Hospital and had either NGT or IFG |
| Study participation: description of glycaemic status at baseline | Low risk | Yes |
| Study participation: adequate description of sampling frame & recruitment | Low risk | Yes |
| Study participation: adequate description of period & recruitment place | Low risk | Yes |
| Study participation: adequate description of inclusion & exclusion criteria | Low risk | Inclusion and exclusion criteria described |
| Study attrition: description of attempts to collect information on participants who dropped out | Unclear risk | Participants diagnosed with diabetes in 2002 were excluded |
| Study attrition: reasons for loss to follow‐up provided | Unclear risk | Scarce data |
| Study attrition: adequate description of participants lost to follow‐up | Unclear risk | Scarce data |
| Study attrition: no important differences between participants who completed the study and those who did not | Unclear risk | Not reported |
| Glycaemic status measurement: provision of clear definition or description of glycaemic status | Low risk | Yes |
| Glycaemic status measurement: valid and reliable method of glycaemic status measurement | Low risk | Yes |
| Glycaemic status measurement: continuous variables reported or appropriate cut points used | Low risk | IFG5.6: FPG 5.6–7.0; IFG6.1: FPG 6.1–7.0 |
| Glycaemic status measurement: same method and setting of measurement of the glycaemic status for all study participants | Low risk | Yes |
| Outcome measurement: clear definition of the outcome provided | Low risk | FPG ≥ 7.0 |
| Outcome measurement: method of outcome measurement used valid & reliable | Low risk | Yes |
| Outcome measurement: same method & setting of outcome measurement for all study participants | Low risk | Yes |
| Study confounding: important confounders measured | Unclear risk | Measurement of cumulative incidence |
| Study confounding: clear definitions of important confounders provided | Unclear risk | Not reported |
| Study confounding: measurement of confounders valid & reliable | Unclear risk | Not reported |
| Study confounding: same method & setting for measurements of confounders for all study participants | Unclear risk | Not reported |
| Study confounding: appropriate methods used if missing confounder data imputed | Unclear risk | Not reported |
| Study confounding: important potential confounders accounted for in study design | Unclear risk | Not reported |
| Study confounding: important potential confounders accounted for in the analysis | Unclear risk | Measurement of cumulative incidence |
| Statistical analysis & reporting: sufficient presentation of data to assess adequacy of the analytic strategy | Low risk | Cumulative incidence |
| Statistical analysis & reporting: the statistical model is adequate for the design of the study | Low risk | ROC curves for predicting the future onset of diabetes |
| Name of study | None | |
| Inclusion criteria | Pre‐screened individuals with 'prediabetes' visiting the diabetes clinic at Seoul National University Bundang Hospital (SNUB) in 2005/06 after they were diagnosed with prediabetes at their health check‐up or primary clinic | |
| Exclusion criteria | Taking oral hypoglycaemic agents or insulin | |
| Notes | Baseline data for i‐IFG (N = 158)/i‐IGT (N = 65)/IFG/IGT (N = 119)/i‐HbA1c (N = 64); total: N = 406 | |
| Risk of bias | ||
| Bias | Authors' judgement | Support for judgement |
| Study participation: description of source population or population of interest | Low risk | Pres‐screened individuals with 'prediabetes' |
| Study participation: description of glycaemic status at baseline | Low risk | Yes |
| Study participation: adequate description of sampling frame & recruitment | Low risk | Yes |
| Study participation: adequate description of period & recruitment place | Low risk | Yes |
| Study participation: adequate description of inclusion & exclusion criteria | Low risk | Inclusion and exclusion criteria described |
| Study attrition: description of attempts to collect information on participants who dropped out | Low risk | Pre‐defined participants with intermediate hyperglycaemia |
| Study attrition: reasons for loss to follow‐up provided | Unclear risk | Not reported |
| Study attrition: adequate description of participants lost to follow‐up | Unclear risk | Not reported |
| Study attrition: no important differences between participants who completed the study and those who did not | Unclear risk | Not reported |
| Glycaemic status measurement: provision of clear definition or description of glycaemic status | Low risk | Yes |
| Glycaemic status measurement: valid and reliable method of glycaemic status measurement | Low risk | Yes |
| Glycaemic status measurement: continuous variables reported or appropriate cut points used | Low risk | i‐IFG: FPG 5.6–6.9 and 2‐h PG < 7.8; i‐IGT: 2‐h PG 7.8–11.1 and FPG < 5.6; IFG/IGT: combined glucose intolerance; HbA1c: 5.7–6.4 |
| Glycaemic status measurement: same method and setting of measurement of the glycaemic status for all study participants | Low risk | Yes |
| Outcome measurement: clear definition of the outcome provided | Low risk | FPG ≥ 7.0; 2‐h PG ≥ 11.1; HbA1c ≥ 6.5 |
| Outcome measurement: method of outcome measurement used valid & reliable | Low risk | Yes |
| Outcome measurement: same method & setting of outcome measurement for all study participants | Low risk | Yes |
| Study confounding: important confounders measured | Unclear risk | For C‐peptide |
| Study confounding: clear definitions of important confounders provided | Unclear risk | For C‐peptide |
| Study confounding: measurement of confounders valid & reliable | Unclear risk | For C‐peptide |
| Study confounding: same method & setting for measurements of confounders for all study participants | Unclear risk | For C‐peptide |
| Study confounding: appropriate methods used if missing confounder data imputed | Unclear risk | Not reported |
| Study confounding: important potential confounders accounted for in study design | Unclear risk | For C‐peptide |
| Study confounding: important potential confounders accounted for in the analysis | Unclear risk | For C‐peptide |
| Statistical analysis & reporting: sufficient presentation of data to assess adequacy of the analytic strategy | Low risk | Cumulative incidence |
| Statistical analysis & reporting: the statistical model is adequate for the design of the study | Low risk | Multiple logistic regression for association of T2DM development and C‐peptide levels |
| Name of study | None | |
| Inclusion criteria | Medical examinations at the Health Screening and Promotion Center at Asan Medical Center (Seoul, Korea) | |
| Exclusion criteria | History of diabetes mellitus, taking antihyperglycaemic medications, FPG ≥ 7.0 mmol/L or HbA1c ≥ 6.5% at baseline | |
| Notes | 2 baseline data cohorts: 'prediabetes' by FPG and HbA1c (N = 3544 and N = 1713) | |
| Risk of bias | ||
| Bias | Authors' judgement | Support for judgement |
| Study participation: description of source population or population of interest | Unclear risk | Participants who underwent medical examinations in a health screening and promotion centre |
| Study participation: description of glycaemic status at baseline | Low risk | Yes |
| Study participation: adequate description of sampling frame & recruitment | Low risk | Yes |
| Study participation: adequate description of period & recruitment place | Low risk | Yes |
| Study participation: adequate description of inclusion & exclusion criteria | Low risk | Inclusion and exclusion criteria described |
| Study attrition: description of attempts to collect information on participants who dropped out | Unclear risk | Not reported |
| Study attrition: reasons for loss to follow‐up provided | Unclear risk | Not reported |
| Study attrition: adequate description of participants lost to follow‐up | Unclear risk | Not reported |
| Study attrition: no important differences between participants who completed the study and those who did not | Unclear risk | Not reported |
| Glycaemic status measurement: provision of clear definition or description of glycaemic status | Low risk | Yes |
| Glycaemic status measurement: valid and reliable method of glycaemic status measurement | Low risk | Yes |
| Glycaemic status measurement: continuous variables reported or appropriate cut points used | Low risk | FPG 5.6–6.9; HbA1c 5.7–6.4 |
| Glycaemic status measurement: same method and setting of measurement of the glycaemic status for all study participants | Low risk | FPG ≥ 7.0; HbA1c ≥ 6.5; antihyperglycaemic medications |
| Outcome measurement: clear definition of the outcome provided | Low risk | Yes |
| Outcome measurement: method of outcome measurement used valid & reliable | Low risk | Yes |
| Outcome measurement: same method & setting of outcome measurement for all study participants | Low risk | Yes |
| Study confounding: important confounders measured | Low risk | Several covariates measured (see Appendix 16 and Appendix 17) |
| Study confounding: clear definitions of important confounders provided | Low risk | Yes |
| Study confounding: measurement of confounders valid & reliable | Low risk | Yes |
| Study confounding: same method & setting for measurements of confounders for all study participants | Low risk | Yes |
| Study confounding: appropriate methods used if missing confounder data imputed | Unclear risk | Not reported |
| Study confounding: important potential confounders accounted for in study design | Low risk | Yes |
| Study confounding: important potential confounders accounted for in the analysis | Low risk | Yes |
| Statistical analysis & reporting: sufficient presentation of data to assess adequacy of the analytic strategy | Low risk | Cumulative incidence, odds ratio |
| Statistical analysis & reporting: the statistical model is adequate for the design of the study | Low risk | Multivariate logistic regression |
| Name of study | None | |
| Inclusion criteria | Obese children and adolescents aged 10‐17 years with IGT attending the outpatient centre (Department of Paediatric Nutrition Medicine, Witten/Herdecke Germany) | |
| Exclusion criteria | Not reported | |
| Notes | Baseline data for IGT cohort (N = 79) | |
| Risk of bias | ||
| Bias | Authors' judgement | Support for judgement |
| Study participation: description of source population or population of interest | Low risk | Obese white children and adolescents with IGT attending an outpatient centre |
| Study participation: description of glycaemic status at baseline | Low risk | Yes |
| Study participation: adequate description of sampling frame & recruitment | Low risk | Yes |
| Study participation: adequate description of period & recruitment place | Unclear risk | Time of recruitment unclear |
| Study participation: adequate description of inclusion & exclusion criteria | Unclear risk | No exclusion criteria reported |
| Study attrition: description of attempts to collect information on participants who dropped out | Low risk | Probably no dropouts |
| Study attrition: reasons for loss to follow‐up provided | Unclear risk | Not reported |
| Study attrition: adequate description of participants lost to follow‐up | Unclear risk | Not reported |
| Study attrition: no important differences between participants who completed the study and those who did not | Unclear risk | Not reported |
| Glycaemic status measurement: provision of clear definition or description of glycaemic status | Low risk | Yes |
| Glycaemic status measurement: valid and reliable method of glycaemic status measurement | Low risk | Yes |
| Glycaemic status measurement: continuous variables reported or appropriate cut points used | Low risk | IGT: 2‐h PG > 7.7: IFG: FPG ≥ 5.5 |
| Glycaemic status measurement: same method and setting of measurement of the glycaemic status for all study participants | Low risk | Yes |
| Outcome measurement: clear definition of the outcome provided | Low risk | T2DM by ADA 2000 guidelines |
| Outcome measurement: method of outcome measurement used valid & reliable | Low risk | Yes |
| Outcome measurement: same method & setting of outcome measurement for all study participants | Low risk | Yes |
| Study confounding: important confounders measured | Unclear risk | Cumulative incidence |
| Study confounding: clear definitions of important confounders provided | Unclear risk | Not reported |
| Study confounding: measurement of confounders valid & reliable | Unclear risk | Not reported |
| Study confounding: same method & setting for measurements of confounders for all study participants | Unclear risk | Not reported |
| Study confounding: appropriate methods used if missing confounder data imputed | Unclear risk | Not reported |
| Study confounding: important potential confounders accounted for in study design | Unclear risk | Not reported |
| Study confounding: important potential confounders accounted for in the analysis | Unclear risk | Not reported |
| Statistical analysis & reporting: sufficient presentation of data to assess adequacy of the analytic strategy | Low risk | Cumulative incidence |
| Statistical analysis & reporting: the statistical model is adequate for the design of the study | Low risk | Multiple linear regression |
| Name of study | None | |
| Inclusion criteria | Obese white children with IGT without medication or endocrine/syndromal disorders, aged 10‐17 years not participating in the intervention part of the study | |
| Exclusion criteria | Children in the intervention part of the study | |
| Notes | Baseline data for IFG cohort (N = 128) | |
| Risk of bias | ||
| Bias | Authors' judgement | Support for judgement |
| Study participation: description of source population or population of interest | Low risk | Obese children and adolescents with IGT not attending an intervention trial |
| Study participation: description of glycaemic status at baseline | Low risk | Yes |
| Study participation: adequate description of sampling frame & recruitment | Low risk | Yes |
| Study participation: adequate description of period & recruitment place | Unclear risk | Yes |
| Study participation: adequate description of inclusion & exclusion criteria | Low risk | Inclusion and exclusion criteria described |
| Study attrition: description of attempts to collect information on participants who dropped out | Low risk | Yes |
| Study attrition: reasons for loss to follow‐up provided | Low risk | Yes |
| Study attrition: adequate description of participants lost to follow‐up | Low risk | Yes |
| Study attrition: no important differences between participants who completed the study and those who did not | Low risk | Yes |
| Glycaemic status measurement: provision of clear definition or description of glycaemic status | Low risk | Yes |
| Glycaemic status measurement: valid and reliable method of glycaemic status measurement | Low risk | Yes |
| Glycaemic status measurement: continuous variables reported or appropriate cut points used | Low risk | IGT: not reported (presumed 7.8–11.1) |
| Glycaemic status measurement: same method and setting of measurement of the glycaemic status for all study participants | Low risk | Yes |
| Outcome measurement: clear definition of the outcome provided | Low risk | "ADA" (2000 criteria ‐ 2‐h PG ≥ 11.1) |
| Outcome measurement: method of outcome measurement used valid & reliable | Low risk | Yes |
| Outcome measurement: same method & setting of outcome measurement for all study participants | Low risk | Yes |
| Study confounding: important confounders measured | Unclear risk | Measurement of cumulative incidence |
| Study confounding: clear definitions of important confounders provided | Unclear risk | Not reported |
| Study confounding: measurement of confounders valid & reliable | Unclear risk | Npt reported |
| Study confounding: same method & setting for measurements of confounders for all study participants | Unclear risk | Not reported |
| Study confounding: appropriate methods used if missing confounder data imputed | Unclear risk | Not reported |
| Study confounding: important potential confounders accounted for in study design | Unclear risk | Not reported |
| Study confounding: important potential confounders accounted for in the analysis | Unclear risk | Not reported |
| Statistical analysis & reporting: sufficient presentation of data to assess adequacy of the analytic strategy | Low risk | Cumulative incidence |
| Statistical analysis & reporting: the statistical model is adequate for the design of the study | Low risk | Multiple linear regression |
| Name of study | None | |
| Inclusion criteria | Chinese participants with IGT | |
| Exclusion criteria | Not reported | |
| Notes | Letter to the editor | |
| Risk of bias | ||
| Bias | Authors' judgement | Support for judgement |
| Study participation: description of source population or population of interest | Low risk | Chinese participants with IGT |
| Study participation: description of glycaemic status at baseline | Low risk | WHO/NDGG 1979 |
| Study participation: adequate description of sampling frame & recruitment | Unclear risk | Scarce data |
| Study participation: adequate description of period & recruitment place | Low risk | Yes |
| Study participation: adequate description of inclusion & exclusion criteria | Unclear risk | Only inclusion criteria described |
| Study attrition: description of attempts to collect information on participants who dropped out | Unclear risk | Not reported (IGT cohort) |
| Study attrition: reasons for loss to follow‐up provided | Unclear risk | Not reported (IGT cohort) |
| Study attrition: adequate description of participants lost to follow‐up | Unclear risk | Not reported (IGT cohort) |
| Study attrition: no important differences between participants who completed the study and those who did not | Unclear risk | Not applicable (IGT cohort) |
| Glycaemic status measurement: provision of clear definition or description of glycaemic status | Low risk | IGT (WHO/NDDG 1979 definition) |
| Glycaemic status measurement: valid and reliable method of glycaemic status measurement | Low risk | Yes |
| Glycaemic status measurement: continuous variables reported or appropriate cut points used | Low risk | Yes |
| Glycaemic status measurement: same method and setting of measurement of the glycaemic status for all study participants | Low risk | Yes |
| Outcome measurement: clear definition of the outcome provided | Low risk | Assumed WHO/NDDG 1979 definition |
| Outcome measurement: method of outcome measurement used valid & reliable | Low risk | Yes |
| Outcome measurement: same method & setting of outcome measurement for all study participants | Low risk | Yes |
| Study confounding: important confounders measured | Unclear risk | Cumulative incidence |
| Study confounding: clear definitions of important confounders provided | Unclear risk | Cumulative incidence |
| Study confounding: measurement of confounders valid & reliable | Unclear risk | Cumulative incidence |
| Study confounding: same method & setting for measurements of confounders for all study participants | Unclear risk | Cumulative incidence |
| Study confounding: appropriate methods used if missing confounder data imputed | Unclear risk | Cumulative incidence |
| Study confounding: important potential confounders accounted for in study design | Unclear risk | Cumulative incidence |
| Study confounding: important potential confounders accounted for in the analysis | Unclear risk | Cumulative incidence |
| Statistical analysis & reporting: sufficient presentation of data to assess adequacy of the analytic strategy | Low risk | Cumulative incidence |
| Statistical analysis & reporting: the statistical model is adequate for the design of the study | Unclear risk | Cox regression analysis (to predict the progression to diabetes with age, sex, BMI, blood pressure, HbA1c, FPG, 1‐h PG and 2‐h PG as predictor variables) |
| Name of study | None | |
| Inclusion criteria | The Diabetes and Endocrine Centre of the prince of Wales Hospital in Hong Kong screened individuals with risk factors for glucose intolerance (family history of diabetes, history of gestational diabetes, overweight, hypertension) by OGTT | |
| Exclusion criteria | Diabetes at baseline | |
| Notes | Baseline data for IFG cohort (N = 55) | |
| Risk of bias | ||
| Bias | Authors' judgement | Support for judgement |
| Study participation: description of source population or population of interest | Low risk | Individuals with risk factors for glucose intolerance undergoing screening for diabetes |
| Study participation: description of glycaemic status at baseline | Low risk | Yes |
| Study participation: adequate description of sampling frame & recruitment | Low risk | Yes |
| Study participation: adequate description of period & recruitment place | Low risk | Yes |
| Study participation: adequate description of inclusion & exclusion criteria | Low risk | Inclusion and exclusion criteria described |
| Study attrition: description of attempts to collect information on participants who dropped out | Low risk | Yes |
| Study attrition: reasons for loss to follow‐up provided | Unclear risk | Not reported |
| Study attrition: adequate description of participants lost to follow‐up | Low risk | Yes |
| Study attrition: no important differences between participants who completed the study and those who did not | Low risk | Yes |
| Glycaemic status measurement: provision of clear definition or description of glycaemic status | Low risk | Yes |
| Glycaemic status measurement: valid and reliable method of glycaemic status measurement | Low risk | Yes |
| Glycaemic status measurement: continuous variables reported or appropriate cut points used | Low risk | IFG: FPG 6.1–6.9 |
| Glycaemic status measurement: same method and setting of measurement of the glycaemic status for all study participants | Low risk | Yes |
| Outcome measurement: clear definition of the outcome provided | Low risk | FPG ≥ 7.0 |
| Outcome measurement: method of outcome measurement used valid & reliable | Low risk | Yes |
| Outcome measurement: same method & setting of outcome measurement for all study participants | Low risk | Yes |
| Study confounding: important confounders measured | Unclear risk | Measurement of cumulative incidence |
| Study confounding: clear definitions of important confounders provided | Low risk | Yes |
| Study confounding: measurement of confounders valid & reliable | Low risk | Yes |
| Study confounding: same method & setting for measurements of confounders for all study participants | Low risk | Yes |
| Study confounding: appropriate methods used if missing confounder data imputed | Unclear risk | Not reported |
| Study confounding: important potential confounders accounted for in study design | Unclear risk | No ratios reported |
| Study confounding: important potential confounders accounted for in the analysis | Unclear risk | No ratios reported |
| Statistical analysis & reporting: sufficient presentation of data to assess adequacy of the analytic strategy | Low risk | Cumulative incidence |
| Statistical analysis & reporting: the statistical model is adequate for the design of the study | Low risk | Kaplan‐Meier analysis, Cox regression analysis (to predict the progression to diabetes with age, sex, BMI, blood pressure, FPG, gestational diabetes, HbA1c, smoking habit and IFG status being independent variables ‐ no hazard ratios provided) |
| Name of study | None | |
| Inclusion criteria | Postmenopausal women aged 55–57 years in a health screening programme; random sample of 265/1843 invited for follow‐up (new OGTT); 1843 women were grouped according to WHO and ADA glucose tolerance criteria | |
| Exclusion criteria | Not reported | |
| Notes | Baseline data for (i)‐IGT (N = 66)/(i)‐IFG (N = 42)/IFG/IGT (N = 30); 265 follow‐up participants were randomly sampled from each glucose tolerance group of the original cohort and invited for follow‐up; NGT at baseline vs follow‐up: FPG < 5.3 vs < 6.1; FPG 5.3: 15% conversion factor as recommended by the WHO (blood glucose > plasma glucose) | |
| Risk of bias | ||
| Bias | Authors' judgement | Support for judgement |
| Study participation: description of source population or population of interest | Unclear risk | Postmenopausal women participating in a health screening programme; follow‐up: a random sample of the original cohort |
| Study participation: description of glycaemic status at baseline | Low risk | Yes |
| Study participation: adequate description of sampling frame & recruitment | Low risk | Yes |
| Study participation: adequate description of period & recruitment place | Low risk | Yes |
| Study participation: adequate description of inclusion & exclusion criteria | Unclear risk | No exclusion criteria reported |
| Study attrition: description of attempts to collect information on participants who dropped out | Unclear risk | Not reported |
| Study attrition: reasons for loss to follow‐up provided | Unclear risk | Not reported |
| Study attrition: adequate description of participants lost to follow‐up | Unclear risk | Not reported |
| Study attrition: no important differences between participants who completed the study and those who did not | Unclear risk | Not reported |
| Glycaemic status measurement: provision of clear definition or description of glycaemic status | Low risk | Yes |
| Glycaemic status measurement: valid and reliable method of glycaemic status measurement | Low risk | Yes |
| Glycaemic status measurement: continuous variables reported or appropriate cut points used | Low risk | (i)‐IFG: BG 5.3–5.9 and 2‐h BG < 7.8; (i)‐IGT: FPG < 5.3 and 2‐h BG 7.8–11.0; IFG/IGT: BG 5.3–5.9 and 2‐h BG 7.8–11.0 |
| Glycaemic status measurement: same method and setting of measurement of the glycaemic status for all study participants | Low risk | Yes |
| Outcome measurement: clear definition of the outcome provided | Low risk | FPG ≥ 7.0; 2‐h PG ≥ 11.1 |
| Outcome measurement: method of outcome measurement used valid & reliable | Low risk | Yes |
| Outcome measurement: same method & setting of outcome measurement for all study participants | Low risk | Yes |
| Study confounding: important confounders measured | Unclear risk | Measurement of cumulative incidence |
| Study confounding: clear definitions of important confounders provided | Unclear risk | Not reported |
| Study confounding: measurement of confounders valid & reliable | Unclear risk | Not reported |
| Study confounding: same method & setting for measurements of confounders for all study participants | Unclear risk | Not reported |
| Study confounding: appropriate methods used if missing confounder data imputed | Unclear risk | Not reported |
| Study confounding: important potential confounders accounted for in study design | Unclear risk | Not reported |
| Study confounding: important potential confounders accounted for in the analysis | Unclear risk | Not reported |
| Statistical analysis & reporting: sufficient presentation of data to assess adequacy of the analytic strategy | Low risk | Cumulative incidence |
| Statistical analysis & reporting: the statistical model is adequate for the design of the study | Low risk | Chi‐squared test |
| Name of study | None | |
| Inclusion criteria | Residents aged over 20 years | |
| Exclusion criteria | Not reported | |
| Notes | Baseline for prediabetic cohort becoming diabetic at follow‐up | |
| Risk of bias | ||
| Bias | Authors' judgement | Support for judgement |
| Study participation: description of source population or population of interest | Low risk | First phase of prevalence study of the metabolic syndrome and its related factors in Ahvaz Diabetes Research Centre, Iran |
| Study participation: description of glycaemic status at baseline | Low risk | Yes |
| Study participation: adequate description of sampling frame & recruitment | Low risk | Yes |
| Study participation: adequate description of period & recruitment place | Low risk | Yes |
| Study participation: adequate description of inclusion & exclusion criteria | Unclear risk | No exclusion criteria reported |
| Study attrition: description of attempts to collect information on participants who dropped out | Unclear risk | Not reported |
| Study attrition: reasons for loss to follow‐up provided | Unclear risk | Not reported |
| Study attrition: adequate description of participants lost to follow‐up | Unclear risk | Not reported |
| Study attrition: no important differences between participants who completed the study and those who did not | Unclear risk | Not reported |
| Glycaemic status measurement: provision of clear definition or description of glycaemic status | Low risk | Yes |
| Glycaemic status measurement: valid and reliable method of glycaemic status measurement | Low risk | Yes |
| Glycaemic status measurement: continuous variables reported or appropriate cut points used | Low risk | 5.6 ≤ FPG < 7.0 |
| Glycaemic status measurement: same method and setting of measurement of the glycaemic status for all study participants | Low risk | Yes |
| Outcome measurement: clear definition of the outcome provided | Low risk | FPG ≥ 7.0; antihyperglycaemic medication |
| Outcome measurement: method of outcome measurement used valid & reliable | Low risk | Yes |
| Outcome measurement: same method & setting of outcome measurement for all study participants | Low risk | Yes |
| Study confounding: important confounders measured | Unclear risk | Several covariates measured (see Appendix 16 and Appendix 17) |
| Study confounding: clear definitions of important confounders provided | Low risk | Yes |
| Study confounding: measurement of confounders valid & reliable | Low risk | Yes |
| Study confounding: same method & setting for measurements of confounders for all study participants | Low risk | Yes |
| Study confounding: appropriate methods used if missing confounder data imputed | Unclear risk | Not reported |
| Study confounding: important potential confounders accounted for in study design | Unclear risk | Some covariates (see Appendix 16 and Appendix 17) |
| Study confounding: important potential confounders accounted for in the analysis | Unclear risk | Some covariates (see Appendix 16 and Appendix 17) |
| Statistical analysis & reporting: sufficient presentation of data to assess adequacy of the analytic strategy | Unclear risk | Cumulative incidence, incidence rate |
| Statistical analysis & reporting: the statistical model is adequate for the design of the study | Unclear risk | Multiple logistic regression of factors affecting the incidence of diabetes and prediabetes among healthy people in phase 1 (baseline) |
| Name of study | None | |
| Inclusion criteria | People with IFG recruited from medical check‐ups by the French social security system in the 9 preventive health centres of IRSA (Institut Interrégional pur la Santé) | |
| Exclusion criteria | No personal history of diabetes, no hypoglycaemic drug treatment | |
| Notes | Baseline data for IFG cohort attending both examinations (N = 743) | |
| Risk of bias | ||
| Bias | Authors' judgement | Support for judgement |
| Study participation: description of source population or population of interest | Low risk | Yes |
| Study participation: description of glycaemic status at baseline | Low risk | Yes |
| Study participation: adequate description of sampling frame & recruitment | Low risk | Yes |
| Study participation: adequate description of period & recruitment place | Low risk | Yes |
| Study participation: adequate description of inclusion & exclusion criteria | Low risk | Yes |
| Study attrition: description of attempts to collect information on participants who dropped out | Low risk | Yes |
| Study attrition: reasons for loss to follow‐up provided | Unclear risk | Not reported |
| Study attrition: adequate description of participants lost to follow‐up | Unclear risk | Not reported |
| Study attrition: no important differences between participants who completed the study and those who did not | Unclear risk | Not reported |
| Glycaemic status measurement: provision of clear definition or description of glycaemic status | Low risk | Yes |
| Glycaemic status measurement: valid and reliable method of glycaemic status measurement | Low risk | Yes |
| Glycaemic status measurement: continuous variables reported or appropriate cut points used | Low risk | IFG: FPG 6.1–6.9; no personal history of diabetes; no hypoglycaemic treatment |
| Glycaemic status measurement: same method and setting of measurement of the glycaemic status for all study participants | Low risk | Yes |
| Outcome measurement: clear definition of the outcome provided | Low risk | FPG ≥ 7.0; personal history of diabetes; antihyperglycaemic treatment |
| Outcome measurement: method of outcome measurement used valid & reliable | Low risk | Yes |
| Outcome measurement: same method & setting of outcome measurement for all study participants | Low risk | Yes |
| Study confounding: important confounders measured | Unclear risk | Measurement of cumulative incidence |
| Study confounding: clear definitions of important confounders provided | Low risk | Yes |
| Study confounding: measurement of confounders valid & reliable | Low risk | Yes |
| Study confounding: same method & setting for measurements of confounders for all study participants | Low risk | Yes |
| Study confounding: appropriate methods used if missing confounder data imputed | Unclear risk | Not reported |
| Study confounding: important potential confounders accounted for in study design | Unclear risk | Univariate analyses, some covariates measured (see Appendix 16 and Appendix 17) |
| Study confounding: important potential confounders accounted for in the analysis | Unclear risk | Some covariates, univariate analyses (see Appendix 16 and Appendix 17) |
| Statistical analysis & reporting: sufficient presentation of data to assess adequacy of the analytic strategy | Low risk | Cumulative incidence |
| Statistical analysis & reporting: the statistical model is adequate for the design of the study | Low risk | Logistic regression, univariate analyses on risk factors for developing diabetes |
| Name of study | None | |
| Inclusion criteria | Individuals undergoing health checkups at a single medical institution (Gangneung Asian Hospital) | |
| Exclusion criteria | Previously diagnosed with diabetes, history of diabetes medication use, only 1 measurement | |
| Notes | Baseline data for the total cohort (N = 3497) | |
| Risk of bias | ||
| Bias | Authors' judgement | Support for judgement |
| Study participation: description of source population or population of interest | Low risk | Yes |
| Study participation: description of glycaemic status at baseline | Low risk | Yes |
| Study participation: adequate description of sampling frame & recruitment | Low risk | Yes |
| Study participation: adequate description of period & recruitment place | Low risk | Yes |
| Study participation: adequate description of inclusion & exclusion criteria | Low risk | Inclusion and exclusion criteria described |
| Study attrition: description of attempts to collect information on participants who dropped out | Unclear risk | Not reported |
| Study attrition: reasons for loss to follow‐up provided | Unclear risk | Not reported |
| Study attrition: adequate description of participants lost to follow‐up | Unclear risk | Not reported |
| Study attrition: no important differences between participants who completed the study and those who did not | Unclear risk | Not reported |
| Glycaemic status measurement: provision of clear definition or description of glycaemic status | Low risk | Yes |
| Glycaemic status measurement: valid and reliable method of glycaemic status measurement | Low risk | Yes |
| Glycaemic status measurement: continuous variables reported or appropriate cut points used | Low risk | HbA1c 5.7–6.4 |
| Glycaemic status measurement: same method and setting of measurement of the glycaemic status for all study participants | Low risk | Yes |
| Outcome measurement: clear definition of the outcome provided | Low risk | HbA1c ≥ 6.5 |
| Outcome measurement: method of outcome measurement used valid & reliable | Low risk | Yes |
| Outcome measurement: same method & setting of outcome measurement for all study participants | Low risk | Yes |
| Study confounding: important confounders measured | Unclear risk | Measurement of cumulative incidence |
| Study confounding: clear definitions of important confounders provided | Low risk | Yes for coffee consumption |
| Study confounding: measurement of confounders valid & reliable | Low risk | Yes |
| Study confounding: same method & setting for measurements of confounders for all study participants | Low risk | Yes |
| Study confounding: appropriate methods used if missing confounder data imputed | Unclear risk | Not reported |
| Study confounding: important potential confounders accounted for in study design | Unclear risk | 1 covariate |
| Study confounding: important potential confounders accounted for in the analysis | Unclear risk | No ratios reported |
| Statistical analysis & reporting: sufficient presentation of data to assess adequacy of the analytic strategy | Unclear risk | Cumulative incidence |
| Statistical analysis & reporting: the statistical model is adequate for the design of the study | Low risk | Kaplan‐Meier survival analysis for progression to diabetes according to coffee consumption |
| Name of study | Programa de Investigación de Factores de Riesgo de Enfermedad Cardiovascular (PIFRECV) | |
| Inclusion criteria | Study participants were recruited in 2005 by the 'Programa de Investigación de Factores de Riesgo de Enfermedad Cardiovascular' (PIFRECV); participants had to have an FPG 5.6–6.9 mmol/L | |
| Exclusion criteria | Diabetes, individuals on corticosteroid treatment, pregnant women, individuals with cardiovascular complications | |
| Notes | Most baseline data for cohort becoming diabetic at follow‐up (N = 94 with IFG) | |
| Risk of bias | ||
| Bias | Authors' judgement | Support for judgement |
| Study participation: description of source population or population of interest | Low risk | Yes |
| Study participation: description of glycaemic status at baseline | Low risk | Yes |
| Study participation: adequate description of sampling frame & recruitment | Low risk | Yes |
| Study participation: adequate description of period & recruitment place | Low risk | Yes |
| Study participation: adequate description of inclusion & exclusion criteria | Low risk | Inclusion and exclusion criteria described |
| Study attrition: description of attempts to collect information on participants who dropped out | Low risk | Yes |
| Study attrition: reasons for loss to follow‐up provided | Low risk | Yes |
| Study attrition: adequate description of participants lost to follow‐up | Unclear risk | Scarce data |
| Study attrition: no important differences between participants who completed the study and those who did not | Unclear risk | Not reported |
| Glycaemic status measurement: provision of clear definition or description of glycaemic status | Low risk | Yes |
| Glycaemic status measurement: valid and reliable method of glycaemic status measurement | Low risk | Yes |
| Glycaemic status measurement: continuous variables reported or appropriate cut points used | Low risk | IFG: 5.6–7.0 (low range: 5.6–6.1; high range: 6.1–6.9) |
| Glycaemic status measurement: same method and setting of measurement of the glycaemic status for all study participants | Low risk | Yes |
| Outcome measurement: clear definition of the outcome provided | Low risk | FPG ≥ 7.0 (on 2 consecutive days); HbA1c ≥ 6.5 |
| Outcome measurement: method of outcome measurement used valid & reliable | Low risk | Yes |
| Outcome measurement: same method & setting of outcome measurement for all study participants | Low risk | Yes |
| Study confounding: important confounders measured | Unclear risk | Some covariates were measured (see Appendix 16 and Appendix 17) |
| Study confounding: clear definitions of important confounders provided | Low risk | Yes |
| Study confounding: measurement of confounders valid & reliable | Low risk | Yes |
| Study confounding: same method & setting for measurements of confounders for all study participants | Low risk | Yes |
| Study confounding: appropriate methods used if missing confounder data imputed | Unclear risk | Not reported |
| Study confounding: important potential confounders accounted for in study design | Unclear risk | Some covariates planned (see Appendix 16 and Appendix 17) |
| Study confounding: important potential confounders accounted for in the analysis | Unclear risk | Some covariates analysed (see Appendix 16 and Appendix 17) |
| Statistical analysis & reporting: sufficient presentation of data to assess adequacy of the analytic strategy | Low risk | Cumulative incidence, odds ratio |
| Statistical analysis & reporting: the statistical model is adequate for the design of the study | Low risk | Cox regression analysis (comparing 'high range' glycaemia (> 6.1 mmol/L) with 'low range' glycaemia (< 6.1 mmol/L) |
| Name of study | Framingham Heart Study | |
| Inclusion criteria | Participants were drawn from the Framingham Offspring cohort; participants who attended examinations (referred to as index examinations) | |
| Exclusion criteria | Participants with CHD or diabetes | |
| Notes | Baseline data for individuals on first exam, free of CVD (N = 4058) | |
| Risk of bias | ||
| Bias | Authors' judgement | Support for judgement |
| Study participation: description of source population or population of interest | Low risk | Yes |
| Study participation: description of glycaemic status at baseline | Low risk | Yes |
| Study participation: adequate description of sampling frame & recruitment | Low risk | Yes |
| Study participation: adequate description of period & recruitment place | Low risk | Yes |
| Study participation: adequate description of inclusion & exclusion criteria | Low risk | Inclusion and exclusion criteria reported |
| Study attrition: description of attempts to collect information on participants who dropped out | Unclear risk | Not reported |
| Study attrition: reasons for loss to follow‐up provided | Unclear risk | Not reported |
| Study attrition: adequate description of participants lost to follow‐up | Unclear risk | Not reported |
| Study attrition: no important differences between participants who completed the study and those who did not | Unclear risk | Not reported |
| Glycaemic status measurement: provision of clear definition or description of glycaemic status | Low risk | Yes |
| Glycaemic status measurement: valid and reliable method of glycaemic status measurement | Low risk | Yes |
| Glycaemic status measurement: continuous variables reported or appropriate cut points used | Low risk | IFG5.6: FPG 5.6–6.9; IFG6.1: FPG 6.1–6.9 |
| Glycaemic status measurement: same method and setting of measurement of the glycaemic status for all study participants | Low risk | Yes |
| Outcome measurement: clear definition of the outcome provided | Low risk | FPG ≥ 7.0; antihyperglycaemic medication |
| Outcome measurement: method of outcome measurement used valid & reliable | Low risk | Yes |
| Outcome measurement: same method & setting of outcome measurement for all study participants | Low risk | Yes |
| Study confounding: important confounders measured | Unclear risk | Some covariates measured (see Appendix 16 and Appendix 17) |
| Study confounding: clear definitions of important confounders provided | Low risk | Yes |
| Study confounding: measurement of confounders valid & reliable | Low risk | Yes |
| Study confounding: same method & setting for measurements of confounders for all study participants | Low risk | Yes |
| Study confounding: appropriate methods used if missing confounder data imputed | Unclear risk | Not reported |
| Study confounding: important potential confounders accounted for in study design | Unclear risk | Some covariates included (see Appendix 16 and Appendix 17) |
| Study confounding: important potential confounders accounted for in the analysis | Unclear risk | Some covariates analysed (see Appendix 16 and Appendix 17) |
| Statistical analysis & reporting: sufficient presentation of data to assess adequacy of the analytic strategy | Low risk | Cumulative incidence, odds ratio |
| Statistical analysis & reporting: the statistical model is adequate for the design of the study | Low risk | Pooled logistic regression, multivariable models |
| Name of study | Kinmen Study (study in Kin‐Chen, Kinmen, Taiwan) | |
| Inclusion criteria | Individuals aged ≥ 30 years in Kin‐Chen; FPG 5.6–7.0 and 2‐h PG < 11.1 | |
| Exclusion criteria | Diabetes | |
| Notes | Baseline data for i‐IGT (N = 118)/i‐IFG (N = 42)/IFG/IGT (N = 49) cohorts | |
| Risk of bias | ||
| Bias | Authors' judgement | Support for judgement |
| Study participation: description of source population or population of interest | Low risk | Yes, series of community‐based epidemiological surveys of diabetes |
| Study participation: description of glycaemic status at baseline | Low risk | Yes |
| Study participation: adequate description of sampling frame & recruitment | Low risk | Yes |
| Study participation: adequate description of period & recruitment place | Low risk | Yes |
| Study participation: adequate description of inclusion & exclusion criteria | Low risk | Inclusion and exclusion criteria described |
| Study attrition: description of attempts to collect information on participants who dropped out | Unclear risk | Not reported |
| Study attrition: reasons for loss to follow‐up provided | Unclear risk | Not reported |
| Study attrition: adequate description of participants lost to follow‐up | Unclear risk | Not reported |
| Study attrition: no important differences between participants who completed the study and those who did not | Unclear risk | Not reported |
| Glycaemic status measurement: provision of clear definition or description of glycaemic status | Low risk | Yes |
| Glycaemic status measurement: valid and reliable method of glycaemic status measurement | Low risk | Yes |
| Glycaemic status measurement: continuous variables reported or appropriate cut points used | Low risk | i‐iFG: FPG 6.1–7.0 and 2‐h PG < 7.8; i‐IGT: FPG < 6.1 and 2‐h PG 7.8–11.1; IFG/IGT: FPG 6.1–7.0 and 2‐h PG 7.8–11.1 |
| Glycaemic status measurement: same method and setting of measurement of the glycaemic status for all study participants | Low risk | Yes |
| Outcome measurement: clear definition of the outcome provided | Low risk | FPG ≥ 7.0; 2‐h PG ≥ 11.0; antihyperglycaemic medication |
| Outcome measurement: method of outcome measurement used valid & reliable | Low risk | Yes |
| Outcome measurement: same method & setting of outcome measurement for all study participants | Low risk | Yes |
| Study confounding: important confounders measured | Unclear risk | Some covariates measured (see Appendix 16 and Appendix 17) |
| Study confounding: clear definitions of important confounders provided | Low risk | Yes |
| Study confounding: measurement of confounders valid & reliable | Low risk | Yes |
| Study confounding: same method & setting for measurements of confounders for all study participants | Low risk | Yes |
| Study confounding: appropriate methods used if missing confounder data imputed | Unclear risk | Not reported |
| Study confounding: important potential confounders accounted for in study design | Unclear risk | Some covariates included (see Appendix 16 and Appendix 17) |
| Study confounding: important potential confounders accounted for in the analysis | Unclear risk | Some covariates analysed (see Appendix 16 and Appendix 17) |
| Statistical analysis & reporting: sufficient presentation of data to assess adequacy of the analytic strategy | Low risk | Cumulative incidence, incidence rate, hazard ratio |
| Statistical analysis & reporting: the statistical model is adequate for the design of the study | Low risk | Cox proportional hazard model (hazard ratios of T2DM for relative insulin resistance, beta‐cell dysfunction and varying degrees of glucose intolerance) |
| Name of study | Rotterdam study, targeting cardiovascular, endocrine, hepatic, neurological, ophthalmic, psychiatric, dermatological, oncological and respiratory diseases | |
| Inclusion criteria | Community dwelling population aged 45/55 years and older in Rotterdam, no diabetes at baseline | |
| Exclusion criteria | No valid baseline fasting glucose measurement, no informed consent | |
| Notes | Baseline data for prediabetic cohort (N = 1382) | |
| Risk of bias | ||
| Bias | Authors' judgement | Support for judgement |
| Study participation: description of source population or population of interest | Low risk | Yes |
| Study participation: description of glycaemic status at baseline | Low risk | Yes |
| Study participation: adequate description of sampling frame & recruitment | Low risk | Yes |
| Study participation: adequate description of period & recruitment place | Low risk | Yes |
| Study participation: adequate description of inclusion & exclusion criteria | Low risk | Inclusion and exclusion criteria described |
| Study attrition: description of attempts to collect information on participants who dropped out | Unclear risk | Not reported |
| Study attrition: reasons for loss to follow‐up provided | Unclear risk | Not reported |
| Study attrition: adequate description of participants lost to follow‐up | Unclear risk | Not reported |
| Study attrition: no important differences between participants who completed the study and those who did not | Unclear risk | Not reported |
| Glycaemic status measurement: provision of clear definition or description of glycaemic status | Low risk | Yes |
| Glycaemic status measurement: valid and reliable method of glycaemic status measurement | Low risk | Yes |
| Glycaemic status measurement: continuous variables reported or appropriate cut points used | Low risk | FBG > 6.0 and < 7.0; non‐fasting BG > 7.7 and < 11.1 |
| Glycaemic status measurement: same method and setting of measurement of the glycaemic status for all study participants | Low risk | Yes |
| Outcome measurement: clear definition of the outcome provided | Low risk | FBG ≥ 7.0; non‐fasting BG ≥ 11.1; antihyperglycaemic medication |
| Outcome measurement: method of outcome measurement used valid & reliable | Low risk | Yes |
| Outcome measurement: same method & setting of outcome measurement for all study participants | Low risk | Yes |
| Study confounding: important confounders measured | Unclear risk | Some covariates for lifetime risk of diabetes (see Appendix 16 and Appendix 17) |
| Study confounding: clear definitions of important confounders provided | Low risk | Yes |
| Study confounding: measurement of confounders valid & reliable | Low risk | Yes |
| Study confounding: same method & setting for measurements of confounders for all study participants | Unclear risk | Yes |
| Study confounding: appropriate methods used if missing confounder data imputed | Unclear risk | Not reported |
| Study confounding: important potential confounders accounted for in study design | Unclear risk | For lifetime risk of diabetes |
| Study confounding: important potential confounders accounted for in the analysis | Unclear risk | For lifetime risk of diabetes |
| Statistical analysis & reporting: sufficient presentation of data to assess adequacy of the analytic strategy | Low risk | Incidence rate |
| Statistical analysis & reporting: the statistical model is adequate for the design of the study | Unclear risk | Modified version of survival analysis to calculate the lifetime risk of diabetes |
| Name of study | Health, Aging, and Body Composition study (Health ABC) | |
| Inclusion criteria | Aged 70–79 years from Pittsburgh (PA) and Memphis (TN); no difficulty performing activities of daily living, walking 0.25 mile (402 m) or climbing 10 steps without resting; no reported need of assistive devices (e.g. cane, walker); no active treatment for cancer in the prior 3 years; no life‐threatening illness; and no plans to leave the area for 3 years | |
| Exclusion criteria | Not surviving baseline, diagnosed diabetes, missing HbA1c or FPG values at baseline, without adequate follow‐up after baseline | |
| Notes | Baseline data for i‐IFG (N = 189)/i‐HbA1c5.7 (N = 207)/IFG/HbA1c (N = 169) cohorts | |
| Risk of bias | ||
| Bias | Authors' judgement | Support for judgement |
| Study participation: description of source population or population of interest | Low risk | Yes |
| Study participation: description of glycaemic status at baseline | Low risk | Yes |
| Study participation: adequate description of sampling frame & recruitment | Low risk | Yes |
| Study participation: adequate description of period & recruitment place | Low risk | Yes |
| Study participation: adequate description of inclusion & exclusion criteria | Low risk | Inclusion and exclusion criteria reported |
| Study attrition: description of attempts to collect information on participants who dropped out | Unclear risk | Not reported |
| Study attrition: reasons for loss to follow‐up provided | Unclear risk | Not reported |
| Study attrition: adequate description of participants lost to follow‐up | Unclear risk | Not reported |
| Study attrition: no important differences between participants who completed the study and those who did not | Unclear risk | Not reported |
| Glycaemic status measurement: provision of clear definition or description of glycaemic status | Low risk | Yes |
| Glycaemic status measurement: valid and reliable method of glycaemic status measurement | Low risk | Yes |
| Glycaemic status measurement: continuous variables reported or appropriate cut points used | Low risk | i‐IFG: FPG 5.6–6.9 and HbA1c < 5.7; i‐HbA1c: 5.7–6.4 and FPG > 5.6; IFG and HbA1c: FPG 5.6–6.9 and HbA1c 5.7–6.4 |
| Glycaemic status measurement: same method and setting of measurement of the glycaemic status for all study participants | Low risk | Yes |
| Outcome measurement: clear definition of the outcome provided | Low risk | Single HbA1c ≥ 6.5 (years 2,6,7); self‐report of physician diagnosis (annually); antihyperglycaemic medication (years 1,2,4,6,7) |
| Outcome measurement: method of outcome measurement used valid & reliable | Low risk | Yes |
| Outcome measurement: same method & setting of outcome measurement for all study participants | Low risk | Yes |
| Study confounding: important confounders measured | Low risk | Multiple covariates measured (see Appendix 16 and Appendix 17) |
| Study confounding: clear definitions of important confounders provided | Low risk | Yes |
| Study confounding: measurement of confounders valid & reliable | Low risk | Yes |
| Study confounding: same method & setting for measurements of confounders for all study participants | Low risk | Yes |
| Study confounding: appropriate methods used if missing confounder data imputed | Unclear risk | Not reported |
| Study confounding: important potential confounders accounted for in study design | Low risk | Yes |
| Study confounding: important potential confounders accounted for in the analysis | Low risk | Yes |
| Statistical analysis & reporting: sufficient presentation of data to assess adequacy of the analytic strategy | Low risk | Cumulative incidence, odds ratio |
| Statistical analysis & reporting: the statistical model is adequate for the design of the study | Low risk | Multivariable logistic regression |
| Name of study | None | |
| Inclusion criteria | Individuals from the JiangSu province of China, aged 35–74 years, to trace the incidence of CVD and diabetes; individuals participating twice in the study | |
| Exclusion criteria | Individuals suffering from cancer, severe disability, severe psychiatric disturbances; individuals with diabetes, missing data | |
| Notes | Baseline data for non‐diabetic participants (N = 1844); men (N = 788)/women (N = 1056) | |
| Risk of bias | ||
| Bias | Authors' judgement | Support for judgement |
| Study participation: description of source population or population of interest | Low risk | Yes |
| Study participation: description of glycaemic status at baseline | Low risk | Yes |
| Study participation: adequate description of sampling frame & recruitment | Low risk | Yes |
| Study participation: adequate description of period & recruitment place | Low risk | Yes |
| Study participation: adequate description of inclusion & exclusion criteria | Low risk | Inclusion and exclusion criteria described |
| Study attrition: description of attempts to collect information on participants who dropped out | Unclear risk | Not reported |
| Study attrition: reasons for loss to follow‐up provided | Unclear risk | Not reported |
| Study attrition: adequate description of participants lost to follow‐up | Unclear risk | Not reported |
| Study attrition: no important differences between participants who completed the study and those who did not | Unclear risk | Not reported |
| Glycaemic status measurement: provision of clear definition or description of glycaemic status | Low risk | Yes |
| Glycaemic status measurement: valid and reliable method of glycaemic status measurement | Low risk | Yes |
| Glycaemic status measurement: continuous variables reported or appropriate cut points used | Low risk | IFG 5.6–6.9 |
| Glycaemic status measurement: same method and setting of measurement of the glycaemic status for all study participants | Low risk | Yes |
| Outcome measurement: clear definition of the outcome provided | Low risk | FPG ≥ 7.0; 2‐h PG ≥ 11.0; antihyperglycaemic medication |
| Outcome measurement: method of outcome measurement used valid & reliable | Low risk | Yes |
| Outcome measurement: same method & setting of outcome measurement for all study participants | Low risk | Yes |
| Study confounding: important confounders measured | Unclear risk | Some covariates measured (see Appendix 16 and Appendix 17) |
| Study confounding: clear definitions of important confounders provided | Unclear risk | Not reported |
| Study confounding: measurement of confounders valid & reliable | Unclear risk | Not reported |
| Study confounding: same method & setting for measurements of confounders for all study participants | Low risk | Yes |
| Study confounding: appropriate methods used if missing confounder data imputed | Unclear risk | Not reported |
| Study confounding: important potential confounders accounted for in study design | Unclear risk | Some covariates included (see Appendix 16 and Appendix 17) |
| Study confounding: important potential confounders accounted for in the analysis | Unclear risk | Some covariates analysed (see Appendix 16 and Appendix 17) |
| Statistical analysis & reporting: sufficient presentation of data to assess adequacy of the analytic strategy | Low risk | Cumulative incidence, incidence rate, relative risk |
| Statistical analysis & reporting: the statistical model is adequate for the design of the study | Low risk | Cox proportional hazards regression |
| Name of study | None | |
| Inclusion criteria | Shanghai residents | |
| Exclusion criteria | Not reported | |
| Notes | Baseline data for the prediabetic cohort converting to T2DM (N = 78) | |
| Risk of bias | ||
| Bias | Authors' judgement | Support for judgement |
| Study participation: description of source population or population of interest | Low risk | Yes |
| Study participation: description of glycaemic status at baseline | Low risk | Yes |
| Study participation: adequate description of sampling frame & recruitment | Low risk | Yes |
| Study participation: adequate description of period & recruitment place | Low risk | Yes |
| Study participation: adequate description of inclusion & exclusion criteria | Unclear risk | Only inclusion criteria reported |
| Study attrition: description of attempts to collect information on participants who dropped out | Low risk | Yes |
| Study attrition: reasons for loss to follow‐up provided | Low risk | Yes |
| Study attrition: adequate description of participants lost to follow‐up | Unclear risk | Scarce data |
| Study attrition: no important differences between participants who completed the study and those who did not | Unclear risk | Not reported |
| Glycaemic status measurement: provision of clear definition or description of glycaemic status | Unclear risk | "WHO criteria" |
| Glycaemic status measurement: valid and reliable method of glycaemic status measurement | Unclear risk | Scarce data |
| Glycaemic status measurement: continuous variables reported or appropriate cut points used | Unclear risk | Scarce data; IFG or GT |
| Glycaemic status measurement: same method and setting of measurement of the glycaemic status for all study participants | Low risk | Yes |
| Outcome measurement: clear definition of the outcome provided | Unclear risk | "WHO criteria" |
| Outcome measurement: method of outcome measurement used valid & reliable | Unclear risk | Scarce data |
| Outcome measurement: same method & setting of outcome measurement for all study participants | Low risk | Yes |
| Study confounding: important confounders measured | Unclear risk | Cumulative incidence |
| Study confounding: clear definitions of important confounders provided | Unclear risk | Not reported |
| Study confounding: measurement of confounders valid & reliable | Unclear risk | Not reported |
| Study confounding: same method & setting for measurements of confounders for all study participants | Unclear risk | Not reported |
| Study confounding: appropriate methods used if missing confounder data imputed | Unclear risk | Not reported |
| Study confounding: important potential confounders accounted for in study design | Unclear risk | Not reported |
| Study confounding: important potential confounders accounted for in the analysis | Unclear risk | Not reported |
| Statistical analysis & reporting: sufficient presentation of data to assess adequacy of the analytic strategy | Low risk | Cumulative incidence |
| Statistical analysis & reporting: the statistical model is adequate for the design of the study | Low risk | Analysis of variance |
| Name of study | Beijing Longitudinal Study on Aging (BLSA) | |
| Inclusion criteria | Chinese elders free of diabetes at baseline | |
| Exclusion criteria | Diabetes at baseline | |
| Notes | Baseline data for participants without diabetes at baseline (N = 1857) | |
| Risk of bias | ||
| Bias | Authors' judgement | Support for judgement |
| Study participation: description of source population or population of interest | Low risk | Yes |
| Study participation: description of glycaemic status at baseline | Low risk | Yes |
| Study participation: adequate description of sampling frame & recruitment | Low risk | Yes |
| Study participation: adequate description of period & recruitment place | Low risk | Yes |
| Study participation: adequate description of inclusion & exclusion criteria | Low risk | Inclusion and exclusion criteria described |
| Study attrition: description of attempts to collect information on participants who dropped out | Low risk | Yes |
| Study attrition: reasons for loss to follow‐up provided | Low risk | Yes |
| Study attrition: adequate description of participants lost to follow‐up | Unclear risk | Scarce data |
| Study attrition: no important differences between participants who completed the study and those who did not | Unclear risk | Not reported |
| Glycaemic status measurement: provision of clear definition or description of glycaemic status | Low risk | Yes |
| Glycaemic status measurement: valid and reliable method of glycaemic status measurement | Low risk | Yes |
| Glycaemic status measurement: continuous variables reported or appropriate cut points used | Low risk | FPG 6.1–6.9 |
| Glycaemic status measurement: same method and setting of measurement of the glycaemic status for all study participants | Low risk | Yes |
| Outcome measurement: clear definition of the outcome provided | Low risk | FPG ≥ 7.0; self‐reported; antihyperglycaemic medication |
| Outcome measurement: method of outcome measurement used valid & reliable | Low risk | Yes |
| Outcome measurement: same method & setting of outcome measurement for all study participants | Low risk | Yes |
| Study confounding: important confounders measured | Unclear risk | Some covariates measured (see Appendix 16 and Appendix 17) |
| Study confounding: clear definitions of important confounders provided | Low risk | Yes |
| Study confounding: measurement of confounders valid & reliable | Low risk | Yes |
| Study confounding: same method & setting for measurements of confounders for all study participants | Low risk | Yes |
| Study confounding: appropriate methods used if missing confounder data imputed | Unclear risk | Not reported |
| Study confounding: important potential confounders accounted for in study design | Unclear risk | Some covariates included (see Appendix 16 and Appendix 17) |
| Study confounding: important potential confounders accounted for in the analysis | Unclear risk | Some covariates analysed (see Appendix 16 and Appendix 17) |
| Statistical analysis & reporting: sufficient presentation of data to assess adequacy of the analytic strategy | Low risk | Hazard ratio |
| Statistical analysis & reporting: the statistical model is adequate for the design of the study | Low risk | Subdistribution hazards model |
| Name of study | China Multicenter Collaborative Study of Cardiovascular Epidemiology (ChinaMUCA) | |
| Inclusion criteria | 2 studies: China Multicenter Collaborative Study of Cardiovascular Epidemiology (ChinaMUCA) study and the China Cardiovascular Health Study | |
| Exclusion criteria | Individuals with missing baseline glucose information, individuals from Deyang, Sichuan (earthquake) and individuals with ASCVD at baseline | |
| Notes | Baseline data for IFG cohort at baseline (N = 3607) | |
| Risk of bias | ||
| Bias | Authors' judgement | Support for judgement |
| Study participation: description of source population or population of interest | Low risk | Yes |
| Study participation: description of glycaemic status at baseline | Low risk | Yes |
| Study participation: adequate description of sampling frame & recruitment | Low risk | Yes |
| Study participation: adequate description of period & recruitment place | Low risk | Yes |
| Study participation: adequate description of inclusion & exclusion criteria | Low risk | Inclusion and exclusion criteria described |
| Study attrition: description of attempts to collect information on participants who dropped out | Low risk | Yes |
| Study attrition: reasons for loss to follow‐up provided | Low risk | Yes |
| Study attrition: adequate description of participants lost to follow‐up | Low risk | Yes |
| Study attrition: no important differences between participants who completed the study and those who did not | Unclear risk | Participants lost to follow‐up e.g. were younger, had lower BMI levels and higher physical activity levels |
| Glycaemic status measurement: provision of clear definition or description of glycaemic status | Low risk | Yes |
| Glycaemic status measurement: valid and reliable method of glycaemic status measurement | Low risk | Yes |
| Glycaemic status measurement: continuous variables reported or appropriate cut points used | Low risk | FBG 5.6–6.9 |
| Glycaemic status measurement: same method and setting of measurement of the glycaemic status for all study participants | Low risk | Yes |
| Outcome measurement: clear definition of the outcome provided | Low risk | FBG ≥ 7.0; using insulin/antihyperglycaemic medications; self‐reported |
| Outcome measurement: method of outcome measurement used valid & reliable | Low risk | Yes |
| Outcome measurement: same method & setting of outcome measurement for all study participants | Low risk | Yes |
| Study confounding: important confounders measured | Unclear risk | Some covariates measured (see Appendix 16 and Appendix 17) |
| Study confounding: clear definitions of important confounders provided | Low risk | Yes |
| Study confounding: measurement of confounders valid & reliable | Low risk | Yes |
| Study confounding: same method & setting for measurements of confounders for all study participants | Low risk | Yes |
| Study confounding: appropriate methods used if missing confounder data imputed | Unclear risk | Not reported |
| Study confounding: important potential confounders accounted for in study design | Unclear risk | Some covariates included (see Appendix 16 and Appendix 17) |
| Study confounding: important potential confounders accounted for in the analysis | Unclear risk | Some covariates analysed (see Appendix 16 and Appendix 17) |
| Statistical analysis & reporting: sufficient presentation of data to assess adequacy of the analytic strategy | Low risk | Odds ratio |
| Statistical analysis & reporting: the statistical model is adequate for the design of the study | Low risk | Cox proportional hazard regression |
| Name of study | San Antonio Heart Study (SAHS) | |
| Inclusion criteria | Mexican‐Americans and non‐Hispanic whites participating in a study of type 2 diabetes and cardiovascular disease | |
| Exclusion criteria | Phase 1 participants (waist circumference was not measured), and those in phase 2 with diabetes at baseline | |
| Notes | Baseline data for cohort converting to T2DM (N = 195) | |
| Risk of bias | ||
| Bias | Authors' judgement | Support for judgement |
| Study participation: description of source population or population of interest | Low risk | Yes |
| Study participation: description of glycaemic status at baseline | Low risk | Yes |
| Study participation: adequate description of sampling frame & recruitment | Low risk | Yes |
| Study participation: adequate description of period & recruitment place | Low risk | Yes |
| Study participation: adequate description of inclusion & exclusion criteria | Low risk | Inclusion and exclusion criteria described |
| Study attrition: description of attempts to collect information on participants who dropped out | Unclear risk | Scarce data |
| Study attrition: reasons for loss to follow‐up provided | Unclear risk | Scarce data |
| Study attrition: adequate description of participants lost to follow‐up | Unclear risk | Scarce data |
| Study attrition: no important differences between participants who completed the study and those who did not | Unclear risk | Not reported |
| Glycaemic status measurement: provision of clear definition or description of glycaemic status | Low risk | Yes |
| Glycaemic status measurement: valid and reliable method of glycaemic status measurement | Low risk | Yes |
| Glycaemic status measurement: continuous variables reported or appropriate cut points used | Low risk | IFG: FPG 6.1–6.9; IGT: 2‐h PG 7.8 to < 11.1 (WHO 1999) |
| Glycaemic status measurement: same method and setting of measurement of the glycaemic status for all study participants | Low risk | Yes |
| Outcome measurement: clear definition of the outcome provided | Low risk | FPG: ≥ 7.0; 2‐h PHG: ≥ 11.1 (WHO 1999/1985) |
| Outcome measurement: method of outcome measurement used valid & reliable | Low risk | Yes |
| Outcome measurement: same method & setting of outcome measurement for all study participants | Low risk | Yes |
| Study confounding: important confounders measured | Unclear risk | Some covariates measured (see Appendix 16 and Appendix 17) |
| Study confounding: clear definitions of important confounders provided | Low risk | Yes |
| Study confounding: measurement of confounders valid & reliable | Low risk | Yes |
| Study confounding: same method & setting for measurements of confounders for all study participants | Low risk | Yes |
| Study confounding: appropriate methods used if missing confounder data imputed | Unclear risk | Not reported |
| Study confounding: important potential confounders accounted for in study design | Unclear risk | Some covariates included (see Appendix 16 and Appendix 17) |
| Study confounding: important potential confounders accounted for in the analysis | Unclear risk | Some covariates analysed (see Appendix 16 and Appendix 17) |
| Statistical analysis & reporting: sufficient presentation of data to assess adequacy of the analytic strategy | Low risk | Cumulative incidence, odds ratio |
| Statistical analysis & reporting: the statistical model is adequate for the design of the study | Low risk | Multiple logistic regression (diabetes risk of the metabolic syndrome and components of the metabolic syndrome) |
| Name of study | Botnia Study | |
| Inclusion criteria | People with type 2 diabetes in western Finland were invited to participate together with their family members; nondiabetic individuals were invited (family members or 'controls' (spouses), aged 18–73 years; prospective visits every 2–3 years; at least 2 OGTTs | |
| Exclusion criteria | MODY, individuals with missing data | |
| Notes | Baseline data for IFG‐IGT individuals who converted to T2DM (N = 86) | |
| Risk of bias | ||
| Bias | Authors' judgement | Support for judgement |
| Study participation: description of source population or population of interest | Low risk | Yes |
| Study participation: description of glycaemic status at baseline | Low risk | Yes |
| Study participation: adequate description of sampling frame & recruitment | Low risk | Yes |
| Study participation: adequate description of period & recruitment place | Low risk | Yes |
| Study participation: adequate description of inclusion & exclusion criteria | Low risk | Description of inclusion and exclusion criteria |
| Study attrition: description of attempts to collect information on participants who dropped out | Unclear risk | Not reported |
| Study attrition: reasons for loss to follow‐up provided | Unclear risk | Not reported |
| Study attrition: adequate description of participants lost to follow‐up | Unclear risk | Not reported |
| Study attrition: no important differences between participants who completed the study and those who did not | Unclear risk | Not reported |
| Glycaemic status measurement: provision of clear definition or description of glycaemic status | Low risk | Yes |
| Glycaemic status measurement: valid and reliable method of glycaemic status measurement | Low risk | Yes |
| Glycaemic status measurement: continuous variables reported or appropriate cut points used | Low risk | IFG: FPG ≥ 6.1 (WHO 1999 criteria) |
| Glycaemic status measurement: same method and setting of measurement of the glycaemic status for all study participants | Low risk | Yes |
| Outcome measurement: clear definition of the outcome provided | Low risk | WHO 1999 criteria |
| Outcome measurement: method of outcome measurement used valid & reliable | Low risk | Yes |
| Outcome measurement: same method & setting of outcome measurement for all study participants | Low risk | Yes |
| Study confounding: important confounders measured | Unclear risk | Univariate analyses |
| Study confounding: clear definitions of important confounders provided | Low risk | Yes |
| Study confounding: measurement of confounders valid & reliable | Low risk | Yes |
| Study confounding: same method & setting for measurements of confounders for all study participants | Low risk | Yes |
| Study confounding: appropriate methods used if missing confounder data imputed | Unclear risk | Not reported |
| Study confounding: important potential confounders accounted for in study design | Unclear risk | Univariate analyses |
| Study confounding: important potential confounders accounted for in the analysis | Unclear risk | Univariate analyses |
| Statistical analysis & reporting: sufficient presentation of data to assess adequacy of the analytic strategy | Low risk | Cumulative incidence, hazard ratio |
| Statistical analysis & reporting: the statistical model is adequate for the design of the study | Low risk | Univariate Cox proportional hazards model (adjusted for BMI) |
| Name of study | Australian Diabetes, Obesity and Lifestyle Study (AusDiab) | |
| Inclusion criteria | National population‐based survey in adults aged ≥ 25 years | |
| Exclusion criteria | Participants refusing further contact, deceased, moved overseas or into a nursing facility classified for high care, had a terminal illness | |
| Notes | Baseline data for cohort becoming diabetic at follow‐up (N = 224/5842) | |
| Risk of bias | ||
| Bias | Authors' judgement | Support for judgement |
| Study participation: description of source population or population of interest | Low risk | Yes |
| Study participation: description of glycaemic status at baseline | Low risk | Yes |
| Study participation: adequate description of sampling frame & recruitment | Low risk | Yes |
| Study participation: adequate description of period & recruitment place | Low risk | Yes |
| Study participation: adequate description of inclusion & exclusion criteria | Low risk | Inclusion and exclusion criteria described |
| Study attrition: description of attempts to collect information on participants who dropped out | Unclear risk | Scarce data |
| Study attrition: reasons for loss to follow‐up provided | Unclear risk | Scarce data |
| Study attrition: adequate description of participants lost to follow‐up | Unclear risk | Scarce data |
| Study attrition: no important differences between participants who completed the study and those who did not | Unclear risk | Not reported |
| Glycaemic status measurement: provision of clear definition or description of glycaemic status | Low risk | Yes |
| Glycaemic status measurement: valid and reliable method of glycaemic status measurement | Low risk | Yes |
| Glycaemic status measurement: continuous variables reported or appropriate cut points used | Low risk | IFG: FPG 6.1–6.9 and 2‐h PG < 7.8; IGT: FPG < 7.0 and 2‐h PG ≤ 7.8 to < 11.1 |
| Glycaemic status measurement: same method and setting of measurement of the glycaemic status for all study participants | Low risk | Yes |
| Outcome measurement: clear definition of the outcome provided | Low risk | FPG ≥ 7.0; 2‐h PG ≥ 11.1; current antihyperglycaemic medication |
| Outcome measurement: method of outcome measurement used valid & reliable | Low risk | Yes |
| Outcome measurement: same method & setting of outcome measurement for all study participants | Low risk | Yes |
| Study confounding: important confounders measured | Low risk | Multiple covariates included (see Appendix 16 and Appendix 17) |
| Study confounding: clear definitions of important confounders provided | Low risk | Yes |
| Study confounding: measurement of confounders valid & reliable | Low risk | Yes |
| Study confounding: same method & setting for measurements of confounders for all study participants | Low risk | Yes |
| Study confounding: appropriate methods used if missing confounder data imputed | Unclear risk | Not reported |
| Study confounding: important potential confounders accounted for in study design | Low risk | Yes |
| Study confounding: important potential confounders accounted for in the analysis | Low risk | ORs per SD changes in FPG and HbA1c |
| Statistical analysis & reporting: sufficient presentation of data to assess adequacy of the analytic strategy | Low risk | Cumulative incidence, incidence rate per year, odds ratio |
| Statistical analysis & reporting: the statistical model is adequate for the design of the study | Low risk | Multivariate logistic regression (logFRPG and logHbA1c) |
| Name of study | Singapore Malay Eye Study (SIMES) | |
| Inclusion criteria | Malay adults in Singapore aged 40–80 years; SIMES aims to assess the prevalence, incidence, progression, associated factors and impact of major eye disease as well as access to eye care by Asian Malays | |
| Exclusion criteria | Diabetes, missing data | |
| Notes | Baseline data for incident diabetes cohort (N = 127) | |
| Risk of bias | ||
| Bias | Authors' judgement | Support for judgement |
| Study participation: description of source population or population of interest | Low risk | Yes |
| Study participation: description of glycaemic status at baseline | Low risk | Yes |
| Study participation: adequate description of sampling frame & recruitment | Low risk | Yes |
| Study participation: adequate description of period & recruitment place | Low risk | Yes |
| Study participation: adequate description of inclusion & exclusion criteria | Low risk | Inclusion and exclusion criteria described |
| Study attrition: description of attempts to collect information on participants who dropped out | Unclear risk | Scarce data |
| Study attrition: reasons for loss to follow‐up provided | Unclear risk | Scarce data |
| Study attrition: adequate description of participants lost to follow‐up | Unclear risk | Scarce data |
| Study attrition: no important differences between participants who completed the study and those who did not | Low risk | Yes |
| Glycaemic status measurement: provision of clear definition or description of glycaemic status | Low risk | Yes |
| Glycaemic status measurement: valid and reliable method of glycaemic status measurement | Low risk | Yes |
| Glycaemic status measurement: continuous variables reported or appropriate cut points used | Low risk | HbA1c 5.7–6.4; no self‐reported diabetes or antihyperglycaemic medication |
| Glycaemic status measurement: same method and setting of measurement of the glycaemic status for all study participants | Low risk | Yes |
| Outcome measurement: clear definition of the outcome provided | Low risk | Random glucose ≥ 11.1 or HbA1c > 6.4; self‐reported history or antihyperglycaemic medication |
| Outcome measurement: method of outcome measurement used valid & reliable | Low risk | Yes |
| Outcome measurement: same method & setting of outcome measurement for all study participants | Low risk | Yes |
| Study confounding: important confounders measured | Unclear risk | Some covariates measured (see Appendix 16 and Appendix 17) |
| Study confounding: clear definitions of important confounders provided | Low risk | Yes |
| Study confounding: measurement of confounders valid & reliable | Low risk | Yes |
| Study confounding: same method & setting for measurements of confounders for all study participants | Low risk | Yes |
| Study confounding: appropriate methods used if missing confounder data imputed | Unclear risk | Not reported |
| Study confounding: important potential confounders accounted for in study design | Unclear risk | Some covariates included (see Appendix 16 and Appendix 17) |
| Study confounding: important potential confounders accounted for in the analysis | Unclear risk | Not reported |
| Statistical analysis & reporting: sufficient presentation of data to assess adequacy of the analytic strategy | Low risk | Cumulative incidence, incidence rate, risk ratio |
| Statistical analysis & reporting: the statistical model is adequate for the design of the study | Low risk | Multivariate analyses using modified Poission regression models to estimate adjusted risk ratios |
| Name of study | San Luis Valley Diabetes Study | |
| Inclusion criteria | The San Luis Valley Diabetes Study determined the prevalence and incidence of NIDDM among Hispanic and non‐Hispanic white adults; sample without prior diabetes diagnosis aged 30–74 years; IGT at the initial visit | |
| Exclusion criteria | Unavailability of complete data | |
| Notes | Baseline data for IGT cohort converting to T2DM (N = 20) | |
| Risk of bias | ||
| Bias | Authors' judgement | Support for judgement |
| Study participation: description of source population or population of interest | Low risk | Yes |
| Study participation: description of glycaemic status at baseline | Low risk | Yes |
| Study participation: adequate description of sampling frame & recruitment | Low risk | Yes |
| Study participation: adequate description of period & recruitment place | Low risk | Yes |
| Study participation: adequate description of inclusion & exclusion criteria | Low risk | Inclusion and exclusion criteria described |
| Study attrition: description of attempts to collect information on participants who dropped out | Unclear risk | Scarce data |
| Study attrition: reasons for loss to follow‐up provided | Unclear risk | Scarce data |
| Study attrition: adequate description of participants lost to follow‐up | Unclear risk | Scarce data |
| Study attrition: no important differences between participants who completed the study and those who did not | Unclear risk | Not reported |
| Glycaemic status measurement: provision of clear definition or description of glycaemic status | Low risk | Yes |
| Glycaemic status measurement: valid and reliable method of glycaemic status measurement | Low risk | Yes |
| Glycaemic status measurement: continuous variables reported or appropriate cut points used | Low risk | IGT: 2‐h PG ≥ 7.8 to < 11.1 (WHO 1985) |
| Glycaemic status measurement: same method and setting of measurement of the glycaemic status for all study participants | Low risk | Yes |
| Outcome measurement: clear definition of the outcome provided | Low risk | 2‐h PG ≥ 11.1 (WHO 1985) |
| Outcome measurement: method of outcome measurement used valid & reliable | Low risk | Yes |
| Outcome measurement: same method & setting of outcome measurement for all study participants | Low risk | Yes |
| Study confounding: important confounders measured | Unclear risk | Cumulative incidence |
| Study confounding: clear definitions of important confounders provided | Unclear risk | Cumulative incidence |
| Study confounding: measurement of confounders valid & reliable | Unclear risk | Cumulative incidence |
| Study confounding: same method & setting for measurements of confounders for all study participants | Unclear risk | Cumulative incidence |
| Study confounding: appropriate methods used if missing confounder data imputed | Unclear risk | Cumulative incidence |
| Study confounding: important potential confounders accounted for in study design | Unclear risk | Cumulative incidence |
| Study confounding: important potential confounders accounted for in the analysis | Unclear risk | Cumulative incidence |
| Statistical analysis & reporting: sufficient presentation of data to assess adequacy of the analytic strategy | Low risk | Cumulative incidence |
| Statistical analysis & reporting: the statistical model is adequate for the design of the study | Low risk | Multiple logistic regression (baseline dietary risk factors to predict the development of diabetes; glucose levels as continuous variables) |
| Name of study | Japanese American Community Diabetes Study | |
| Inclusion criteria | Second‐generation (Nisei) and third‐generation (Sansei) Japanese‐American participants residing in Kong County, Washington | |
| Exclusion criteria | Individuals with diabetes at baseline | |
| Notes | Baseline data for cohort converting to T2DM at 5–6 years (N = 50)/10 years (N = 74) | |
| Risk of bias | ||
| Bias | Authors' judgement | Support for judgement |
| Study participation: description of source population or population of interest | Low risk | Yes |
| Study participation: description of glycaemic status at baseline | Low risk | Yes |
| Study participation: adequate description of sampling frame & recruitment | Unclear risk | Scarce data |
| Study participation: adequate description of period & recruitment place | Unclear risk | Scarce data |
| Study participation: adequate description of inclusion & exclusion criteria | Low risk | Inclusion and exclusion criteria described |
| Study attrition: description of attempts to collect information on participants who dropped out | Low risk | Yes |
| Study attrition: reasons for loss to follow‐up provided | Low risk | Yes |
| Study attrition: adequate description of participants lost to follow‐up | Low risk | Yes |
| Study attrition: no important differences between participants who completed the study and those who did not | Unclear risk | Some difference reported |
| Glycaemic status measurement: provision of clear definition or description of glycaemic status | Low risk | Yes |
| Glycaemic status measurement: valid and reliable method of glycaemic status measurement | Low risk | Yes |
| Glycaemic status measurement: continuous variables reported or appropriate cut points used | Low risk | IFG: FPG ≥ 6.1 to < 7.0; IGT: 2‐h PG ≥ 7.8 to < 11.1 |
| Glycaemic status measurement: same method and setting of measurement of the glycaemic status for all study participants | Low risk | Yes |
| Outcome measurement: clear definition of the outcome provided | Low risk | FPG ≥ 7.0; 2‐h PG ≥ 11.1; antihyperglycaemic medication prescribed by a physician |
| Outcome measurement: method of outcome measurement used valid & reliable | Low risk | Yes |
| Outcome measurement: same method & setting of outcome measurement for all study participants | Low risk | Yes |
| Study confounding: important confounders measured | Unclear risk | Cumulative incidence |
| Study confounding: clear definitions of important confounders provided | Unclear risk | Cumulative incidence |
| Study confounding: measurement of confounders valid & reliable | Unclear risk | Cumulative incidence |
| Study confounding: same method & setting for measurements of confounders for all study participants | Unclear risk | Cumulative incidence |
| Study confounding: appropriate methods used if missing confounder data imputed | Unclear risk | Cumulative incidence |
| Study confounding: important potential confounders accounted for in study design | Unclear risk | Cumulative incidence |
| Study confounding: important potential confounders accounted for in the analysis | Unclear risk | Cumulative incidence |
| Statistical analysis & reporting: sufficient presentation of data to assess adequacy of the analytic strategy | Low risk | Cumulative incidence |
| Statistical analysis & reporting: the statistical model is adequate for the design of the study | Low risk | Logistic regression (ROC‐curves, clinical model) |
| Name of study | Baltimore Longitudinal Study of Aging (BLSA) | |
| Inclusion criteria | Community dwelling volunteers, largely from the Baltimore (MD) and Washington, D.C. areas; primarily white middle‐ and upper‐middle socioeconomic class aged 21–96 years, being examined approximately every 2 years; open cohort design with dropouts replaced (around 1000 persons at each study cycle); attending at least 3 examinations and an OGTT within an 8‐year period | |
| Exclusion criteria | 2 or fewer OGTTs or > 4 years elapsed between any 2 OGTTs | |
| Notes | Baseline data for the IFG‐IGT cohort (N = 265); follow‐up time: at least 6 years 77%, at least 10 years 44%, at least 16 years 16%, at least 20 years 4.5% | |
| Risk of bias | ||
| Bias | Authors' judgement | Support for judgement |
| Study participation: description of source population or population of interest | Low risk | Yes |
| Study participation: description of glycaemic status at baseline | Low risk | Yes |
| Study participation: adequate description of sampling frame & recruitment | Low risk | Yes |
| Study participation: adequate description of period & recruitment place | Low risk | Yes |
| Study participation: adequate description of inclusion & exclusion criteria | Low risk | Inclusion and exclusion criteria described |
| Study attrition: description of attempts to collect information on participants who dropped out | High risk | Scarce data |
| Study attrition: reasons for loss to follow‐up provided | Unclear risk | Scarce data |
| Study attrition: adequate description of participants lost to follow‐up | Unclear risk | Scarce data |
| Study attrition: no important differences between participants who completed the study and those who did not | Unclear risk | Not reported |
| Glycaemic status measurement: provision of clear definition or description of glycaemic status | Low risk | Yes |
| Glycaemic status measurement: valid and reliable method of glycaemic status measurement | Low risk | Yes |
| Glycaemic status measurement: continuous variables reported or appropriate cut points used | Low risk | IFG: FPG 6.1–6.9 and 2‐h PG ≤ 7.8; IGT: FPG < 6.1 and 2‐h PG 7.8–11.0; IFG/IGT |
| Glycaemic status measurement: same method and setting of measurement of the glycaemic status for all study participants | Low risk | Yes |
| Outcome measurement: clear definition of the outcome provided | Low risk | FPG ≥ 7.0; 2‐h PG ≥ 11.1 (IFG‐IGT: diabetes defined by OGTT) |
| Outcome measurement: method of outcome measurement used valid & reliable | Low risk | Yes |
| Outcome measurement: same method & setting of outcome measurement for all study participants | Low risk | Yes |
| Study confounding: important confounders measured | Unclear risk | Cumulative incidence, incidence rates |
| Study confounding: clear definitions of important confounders provided | Unclear risk | Cumulative incidence, incidence rates |
| Study confounding: measurement of confounders valid & reliable | Unclear risk | Cumulative incidence, incidence rates |
| Study confounding: same method & setting for measurements of confounders for all study participants | Unclear risk | Cumulative incidence, incidence rates |
| Study confounding: appropriate methods used if missing confounder data imputed | Unclear risk | Cumulative incidence, incidence rates |
| Study confounding: important potential confounders accounted for in study design | Unclear risk | Cumulative incidence, incidence rates |
| Study confounding: important potential confounders accounted for in the analysis | Unclear risk | Cumulative incidence, incidence rates |
| Statistical analysis & reporting: sufficient presentation of data to assess adequacy of the analytic strategy | Low risk | Cumulative incidence, incidence rate |
| Statistical analysis & reporting: the statistical model is adequate for the design of the study | Low risk | Kaplan‐Meier product limit estimates |
| Name of study | Chennai Urban Population Study‐19 (CUPS‐19) | |
| Inclusion criteria | Participants of 2 residential colonies in Chennai, India, representing the middle and lower income groups ≥ 20 years of age | |
| Exclusion criteria | Individuals with diabetes | |
| Notes | Baseline data for cohort becoming diabetic at follow‐up (N = 64/476) | |
| Risk of bias | ||
| Bias | Authors' judgement | Support for judgement |
| Study participation: description of source population or population of interest | Low risk | Yes |
| Study participation: description of glycaemic status at baseline | Low risk | Yes |
| Study participation: adequate description of sampling frame & recruitment | Low risk | Yes |
| Study participation: adequate description of period & recruitment place | Low risk | Yes |
| Study participation: adequate description of inclusion & exclusion criteria | Low risk | Inclusion and exclusion criteria described |
| Study attrition: description of attempts to collect information on participants who dropped out | Low risk | Yes |
| Study attrition: reasons for loss to follow‐up provided | Low risk | Yes |
| Study attrition: adequate description of participants lost to follow‐up | Low risk | Yes |
| Study attrition: no important differences between participants who completed the study and those who did not | Low risk | Yes |
| Glycaemic status measurement: provision of clear definition or description of glycaemic status | Low risk | Yes |
| Glycaemic status measurement: valid and reliable method of glycaemic status measurement | Low risk | Yes |
| Glycaemic status measurement: continuous variables reported or appropriate cut points used | Low risk | IFG: FPG ≥ 6.1 to < 7; IGT: 2‐h PG ≥ 7.8 to < 11.1 |
| Glycaemic status measurement: same method and setting of measurement of the glycaemic status for all study participants | Low risk | Yes |
| Outcome measurement: clear definition of the outcome provided | Low risk | FPG ≥ 7; 2‐h PG ≥ 11.1 |
| Outcome measurement: method of outcome measurement used valid & reliable | Low risk | Yes |
| Outcome measurement: same method & setting of outcome measurement for all study participants | Low risk | Yes |
| Study confounding: important confounders measured | Unclear risk | Cumulative incidence, incidence rate |
| Study confounding: clear definitions of important confounders provided | Unclear risk | Cumulative incidence, incidence rate |
| Study confounding: measurement of confounders valid & reliable | Unclear risk | Cumulative incidence, incidence rate |
| Study confounding: same method & setting for measurements of confounders for all study participants | Unclear risk | Cumulative incidence, incidence rate |
| Study confounding: appropriate methods used if missing confounder data imputed | Unclear risk | Cumulative incidence, incidence rate |
| Study confounding: important potential confounders accounted for in study design | Unclear risk | Cumulative incidence, incidence rate |
| Study confounding: important potential confounders accounted for in the analysis | Unclear risk | Cumulative incidence, incidence rate |
| Statistical analysis & reporting: sufficient presentation of data to assess adequacy of the analytic strategy | Low risk | Cumulative incidence, incidence rate |
| Statistical analysis & reporting: the statistical model is adequate for the design of the study | Low risk | Cox regression analysis (effects of various risk factors but not intermediate hyperglycaemia on diabetes) |
| Name of study | None | |
| Inclusion criteria | South African Indians, mainly living in Durban (1984); survey to determine the prevalence of NIDDM among South African Indians; non‐pregnant participants > 15 years of age | |
| Exclusion criteria | Not reported | |
| Notes | Baseline data for responders (both baseline and follow‐up examination) (N = 563) | |
| Risk of bias | ||
| Bias | Authors' judgement | Support for judgement |
| Study participation: description of source population or population of interest | Low risk | Yes |
| Study participation: description of glycaemic status at baseline | Low risk | Yes |
| Study participation: adequate description of sampling frame & recruitment | Low risk | Yes |
| Study participation: adequate description of period & recruitment place | Low risk | Yes |
| Study participation: adequate description of inclusion & exclusion criteria | Unclear risk | Only inclusion criteria reported |
| Study attrition: description of attempts to collect information on participants who dropped out | Low risk | Yes |
| Study attrition: reasons for loss to follow‐up provided | Low risk | Yes |
| Study attrition: adequate description of participants lost to follow‐up | Low risk | Yes |
| Study attrition: no important differences between participants who completed the study and those who did not | Low risk | Yes |
| Glycaemic status measurement: provision of clear definition or description of glycaemic status | Low risk | Yes |
| Glycaemic status measurement: valid and reliable method of glycaemic status measurement | Low risk | Yes |
| Glycaemic status measurement: continuous variables reported or appropriate cut points used | Low risk | IGT: FPG < 7.8 and 2‐h PG 7.8 to < 11.1 (WHO 1985) |
| Glycaemic status measurement: same method and setting of measurement of the glycaemic status for all study participants | Low risk | Yes |
| Outcome measurement: clear definition of the outcome provided | Low risk | FPG ≥ 7.8; 2‐h PG ≥ 11.1 (WHO 1985) |
| Outcome measurement: method of outcome measurement used valid & reliable | Low risk | Yes |
| Outcome measurement: same method & setting of outcome measurement for all study participants | Low risk | Yes |
| Study confounding: important confounders measured | Unclear risk | Cumulative incidence |
| Study confounding: clear definitions of important confounders provided | Unclear risk | Cumulative incidence |
| Study confounding: measurement of confounders valid & reliable | Unclear risk | Cumulative incidence |
| Study confounding: same method & setting for measurements of confounders for all study participants | Unclear risk | Cumulative incidence |
| Study confounding: appropriate methods used if missing confounder data imputed | Unclear risk | Cumulative incidence |
| Study confounding: important potential confounders accounted for in study design | Unclear risk | Cumulative incidence |
| Study confounding: important potential confounders accounted for in the analysis | Unclear risk | Cumulative incidence |
| Statistical analysis & reporting: sufficient presentation of data to assess adequacy of the analytic strategy | Low risk | Cumulative incidence |
| Statistical analysis & reporting: the statistical model is adequate for the design of the study | Low risk | Multiple logistic regression (to evaluate the effect of various predictor variables for type 2 diabetes) |
| Name of study | Italian Longitudinal Study on Aging (ILSA) | |
| Inclusion criteria | Elderly participants aged 65–84 years involved in ILSA studies | |
| Exclusion criteria | Not reported | |
| Notes | No baseline characteristics provided | |
| Risk of bias | ||
| Bias | Authors' judgement | Support for judgement |
| Study participation: description of source population or population of interest | Low risk | Yes |
| Study participation: description of glycaemic status at baseline | Low risk | Yes |
| Study participation: adequate description of sampling frame & recruitment | Low risk | Yes |
| Study participation: adequate description of period & recruitment place | Low risk | Yes |
| Study participation: adequate description of inclusion & exclusion criteria | Unclear risk | Only inclusion criteria described |
| Study attrition: description of attempts to collect information on participants who dropped out | Unclear risk | Not reported |
| Study attrition: reasons for loss to follow‐up provided | Unclear risk | Not reported |
| Study attrition: adequate description of participants lost to follow‐up | Unclear risk | Not reported |
| Study attrition: no important differences between participants who completed the study and those who did not | Unclear risk | Not reported |
| Glycaemic status measurement: provision of clear definition or description of glycaemic status | Low risk | Yes |
| Glycaemic status measurement: valid and reliable method of glycaemic status measurement | Low risk | Yes |
| Glycaemic status measurement: continuous variables reported or appropriate cut points used | Low risk | IFG: 6.1 to < 7.0 |
| Glycaemic status measurement: same method and setting of measurement of the glycaemic status for all study participants | Low risk | Yes |
| Outcome measurement: clear definition of the outcome provided | Low risk | FPG ≥ 7.0 |
| Outcome measurement: method of outcome measurement used valid & reliable | Low risk | Yes |
| Outcome measurement: same method & setting of outcome measurement for all study participants | Low risk | Yes |
| Study confounding: important confounders measured | Unclear risk | Cumulative incidence |
| Study confounding: clear definitions of important confounders provided | Unclear risk | Cumulative incidence |
| Study confounding: measurement of confounders valid & reliable | Unclear risk | Cumulative incidence |
| Study confounding: same method & setting for measurements of confounders for all study participants | Unclear risk | Cumulative incidence |
| Study confounding: appropriate methods used if missing confounder data imputed | Unclear risk | Cumulative incidence |
| Study confounding: important potential confounders accounted for in study design | Unclear risk | Cumulative incidence |
| Study confounding: important potential confounders accounted for in the analysis | Unclear risk | Cumulative incidence |
| Statistical analysis & reporting: sufficient presentation of data to assess adequacy of the analytic strategy | Low risk | Cumulative incidence |
| Statistical analysis & reporting: the statistical model is adequate for the design of the study | Low risk | t‐test |
| Name of study | None | |
| Inclusion criteria | Participants from Kuopio, Finland | |
| Exclusion criteria | Diabetes at baseline, incomplete OGTT at the follow‐up examination | |
| Notes | Baseline data for cohort developing T2DM (N = 69) | |
| Risk of bias | ||
| Bias | Authors' judgement | Support for judgement |
| Study participation: description of source population or population of interest | Low risk | Yes |
| Study participation: description of glycaemic status at baseline | Low risk | Yes |
| Study participation: adequate description of sampling frame & recruitment | Low risk | Yes |
| Study participation: adequate description of period & recruitment place | Low risk | Yes |
| Study participation: adequate description of inclusion & exclusion criteria | Low risk | Inclusion and exclusion criteria described |
| Study attrition: description of attempts to collect information on participants who dropped out | Unclear risk | Scarce data |
| Study attrition: reasons for loss to follow‐up provided | Unclear risk | Scarce data |
| Study attrition: adequate description of participants lost to follow‐up | Unclear risk | Scarce data |
| Study attrition: no important differences between participants who completed the study and those who did not | Unclear risk | Not reported |
| Glycaemic status measurement: provision of clear definition or description of glycaemic status | Low risk | Yes |
| Glycaemic status measurement: valid and reliable method of glycaemic status measurement | Low risk | Yes |
| Glycaemic status measurement: continuous variables reported or appropriate cut points used | Low risk | IGT: FPG < 7.8 and 2‐h PG 7.8–11.1 (WHO 1985) |
| Glycaemic status measurement: same method and setting of measurement of the glycaemic status for all study participants | Low risk | Yes |
| Outcome measurement: clear definition of the outcome provided | Low risk | FPG ≥ 7.8; 2‐h PG ≥ 11.1 (WHO 1985) |
| Outcome measurement: method of outcome measurement used valid & reliable | Low risk | Yes |
| Outcome measurement: same method & setting of outcome measurement for all study participants | Low risk | Yes |
| Study confounding: important confounders measured | Unclear risk | Cumulative incidence |
| Study confounding: clear definitions of important confounders provided | Unclear risk | Cumulative incidence |
| Study confounding: measurement of confounders valid & reliable | Unclear risk | Cumulative incidence |
| Study confounding: same method & setting for measurements of confounders for all study participants | Unclear risk | Cumulative incidence |
| Study confounding: appropriate methods used if missing confounder data imputed | Unclear risk | Not reported |
| Study confounding: important potential confounders accounted for in study design | Unclear risk | Cumulative incidence |
| Study confounding: important potential confounders accounted for in the analysis | Unclear risk | Cumulative incidence |
| Statistical analysis & reporting: sufficient presentation of data to assess adequacy of the analytic strategy | Low risk | Cumulative incidence, odds ratio |
| Statistical analysis & reporting: the statistical model is adequate for the design of the study | Unclear risk | ANCOVA, odds ratios (risk of developing diabetes associated with various risk factors) |
| Name of study | Kurihashi Lifestyle Cohort Study | |
| Inclusion criteria | Baseline health check‐ups at Kurihashi Hospital | |
| Exclusion criteria | People < 30 years or ≥ 80 years, diabetes at baseline, people with chronic diseases, missing covariate data | |
| Notes | Baseline data for cohort converting to T2DM (N = 99) | |
| Risk of bias | ||
| Bias | Authors' judgement | Support for judgement |
| Study participation: description of source population or population of interest | Low risk | Yes |
| Study participation: description of glycaemic status at baseline | Low risk | Yes |
| Study participation: adequate description of sampling frame & recruitment | Low risk | Yes |
| Study participation: adequate description of period & recruitment place | Low risk | Yes |
| Study participation: adequate description of inclusion & exclusion criteria | Low risk | Inclusion and exclusion criteria described |
| Study attrition: description of attempts to collect information on participants who dropped out | Low risk | Yes |
| Study attrition: reasons for loss to follow‐up provided | Unclear risk | Scarce data |
| Study attrition: adequate description of participants lost to follow‐up | Unclear risk | Scarce data |
| Study attrition: no important differences between participants who completed the study and those who did not | Unclear risk | Scarce data |
| Glycaemic status measurement: provision of clear definition or description of glycaemic status | Low risk | Yes |
| Glycaemic status measurement: valid and reliable method of glycaemic status measurement | Low risk | Yes |
| Glycaemic status measurement: continuous variables reported or appropriate cut points used | Low risk | FPG 5.5–6.9; HbA1c 5.7–6.4 |
| Glycaemic status measurement: same method and setting of measurement of the glycaemic status for all study participants | Low risk | Yes |
| Outcome measurement: clear definition of the outcome provided | Low risk | FPG ≥ 7.0, HbA1c ≥ 6.5; physician diagnosis of diabetes |
| Outcome measurement: method of outcome measurement used valid & reliable | Low risk | Yes |
| Outcome measurement: same method & setting of outcome measurement for all study participants | Low risk | Yes |
| Study confounding: important confounders measured | Unclear risk | Some covariates measured (see Appendix 16 and Appendix 17) |
| Study confounding: clear definitions of important confounders provided | Low risk | Yes |
| Study confounding: measurement of confounders valid & reliable | Low risk | Yes |
| Study confounding: same method & setting for measurements of confounders for all study participants | Low risk | Yes |
| Study confounding: appropriate methods used if missing confounder data imputed | Unclear risk | Not reported |
| Study confounding: important potential confounders accounted for in study design | Unclear risk | Some covariates measured (see Appendix 16 and Appendix 17) |
| Study confounding: important potential confounders accounted for in the analysis | Unclear risk | Some covariates measured (see Appendix 16 and Appendix 17) |
| Statistical analysis & reporting: sufficient presentation of data to assess adequacy of the analytic strategy | Low risk | Cumulative incidence, hazard ratio (associated with a 1 SD increase in the levels of FPG or HbA1c) |
| Statistical analysis & reporting: the statistical model is adequate for the design of the study | Low risk | Cox proportional hazards models |
| Name of study | None | |
| Inclusion criteria | Employees of Company A, one of the largest building contractors in Japan (in major cities around Japan); Japanese men aged 35–59 years with no prior history of coronary heart disease or stroke | |
| Exclusion criteria | Not participating in all the consecutive annual health examinations | |
| Notes | Baseline characteristics for IFG cohort (N = 246) | |
| Risk of bias | ||
| Bias | Authors' judgement | Support for judgement |
| Study participation: description of source population or population of interest | Low risk | Yes |
| Study participation: description of glycaemic status at baseline | Low risk | Yes |
| Study participation: adequate description of sampling frame & recruitment | Low risk | Yes |
| Study participation: adequate description of period & recruitment place | Low risk | Yes |
| Study participation: adequate description of inclusion & exclusion criteria | Unclear risk | Inclusion and exclusion criteria described |
| Study attrition: description of attempts to collect information on participants who dropped out | Unclear risk | Scarce data |
| Study attrition: reasons for loss to follow‐up provided | Unclear risk | Scarce data |
| Study attrition: adequate description of participants lost to follow‐up | Unclear risk | Scarce data |
| Study attrition: no important differences between participants who completed the study and those who did not | Unclear risk | Not reported |
| Glycaemic status measurement: provision of clear definition or description of glycaemic status | Low risk | Yes |
| Glycaemic status measurement: valid and reliable method of glycaemic status measurement | Low risk | Yes |
| Glycaemic status measurement: continuous variables reported or appropriate cut points used | Low risk | IFG: FPG 6.1–6.9 |
| Glycaemic status measurement: same method and setting of measurement of the glycaemic status for all study participants | Low risk | Yes |
| Outcome measurement: clear definition of the outcome provided | Low risk | FPG ≥ 7.0; antihyperglycaemic medication |
| Outcome measurement: method of outcome measurement used valid & reliable | Low risk | Yes |
| Outcome measurement: same method & setting of outcome measurement for all study participants | Low risk | Yes |
| Study confounding: important confounders measured | Unclear risk | Some covariates measured (see Appendix 16 and Appendix 17) |
| Study confounding: clear definitions of important confounders provided | Low risk | Yes |
| Study confounding: measurement of confounders valid & reliable | Low risk | Yes |
| Study confounding: same method & setting for measurements of confounders for all study participants | Low risk | Yes |
| Study confounding: appropriate methods used if missing confounder data imputed | Unclear risk | Not reported |
| Study confounding: important potential confounders accounted for in study design | Unclear risk | Some covariates measured (see Appendix 16 and Appendix 17) |
| Study confounding: important potential confounders accounted for in the analysis | Unclear risk | Some covariates measured (see Appendix 16 and Appendix 17) |
| Statistical analysis & reporting: sufficient presentation of data to assess adequacy of the analytic strategy | Low risk | Cumulative incidence, incidence rate, relative risk (adjusted for all other components and clustering of components of the metabolic syndrome at study entry) |
| Statistical analysis & reporting: the statistical model is adequate for the design of the study | Low risk | Cox proportional hazards model |
| Name of study | Japanese Public‐Health Center‐based prospective (Diabetes) Study (JPHC Study) | |
| Inclusion criteria | All registered Japanese inhabitants in 11 public health center areas aged 40–59 years old in cohort I and 40–69 years old in cohort II; inhabitants who received annual health‐checkups; authors included those who were 51–70 years of age at the time of the baseline survey of diabetes | |
| Exclusion criteria | Missing data, casual blood samples in any of the 2 health check‐ups; known diabetes or an FPG of 125 mg/dL or more at baseline | |
| Notes | Baseline characteristics for the total cohort (N = 2207) | |
| Risk of bias | ||
| Bias | Authors' judgement | Support for judgement |
| Study participation: description of source population or population of interest | Low risk | Yes |
| Study participation: description of glycaemic status at baseline | Low risk | Yes |
| Study participation: adequate description of sampling frame & recruitment | Low risk | Yes |
| Study participation: adequate description of period & recruitment place | Low risk | Yes |
| Study participation: adequate description of inclusion & exclusion criteria | Unclear risk | Inclusion and exclusion criteria described |
| Study attrition: description of attempts to collect information on participants who dropped out | Low risk | Yes |
| Study attrition: reasons for loss to follow‐up provided | Unclear risk | Scarce data |
| Study attrition: adequate description of participants lost to follow‐up | Unclear risk | Scarce data |
| Study attrition: no important differences between participants who completed the study and those who did not | Unclear risk | Scarce data |
| Glycaemic status measurement: provision of clear definition or description of glycaemic status | Low risk | Yes |
| Glycaemic status measurement: valid and reliable method of glycaemic status measurement | Low risk | Yes |
| Glycaemic status measurement: continuous variables reported or appropriate cut points used | Low risk | Taken from table 2: FPG levels: IFG 5.6 and 6.1 |
| Glycaemic status measurement: same method and setting of measurement of the glycaemic status for all study participants | Low risk | Yes |
| Outcome measurement: clear definition of the outcome provided | Low risk | FPG ≥ 7.0; HbA1c ≥ 6.1%; self‐reported |
| Outcome measurement: method of outcome measurement used valid & reliable | Low risk | Yes |
| Outcome measurement: same method & setting of outcome measurement for all study participants | Low risk | Yes |
| Study confounding: important confounders measured | Unclear risk | Cumulative incidence |
| Study confounding: clear definitions of important confounders provided | Unclear risk | Cumulative incidence |
| Study confounding: measurement of confounders valid & reliable | Unclear risk | Cumulative incidence |
| Study confounding: same method & setting for measurements of confounders for all study participants | Unclear risk | Cumulative incidence |
| Study confounding: appropriate methods used if missing confounder data imputed | Unclear risk | Cumulative incidence |
| Study confounding: important potential confounders accounted for in study design | Unclear risk | Cumulative incidence |
| Study confounding: important potential confounders accounted for in the analysis | Unclear risk | Cumulative incidence |
| Statistical analysis & reporting: sufficient presentation of data to assess adequacy of the analytic strategy | Low risk | Cumulative incidence |
| Statistical analysis & reporting: the statistical model is adequate for the design of the study | Low risk | Crude incidence, ROC curves |
| Name of study | None | |
| Inclusion criteria | Korean men employed at a semiconductor manufacturing facility in Korea participating in an annual health examination at a university hospital | |
| Exclusion criteria | Diabetes, failing to undergo subsequent examinations within 2 years; missing data | |
| Notes | Baseline data for incident diabetic participants with IFG at baseline (N = 40) | |
| Risk of bias | ||
| Bias | Authors' judgement | Support for judgement |
| Study participation: description of source population or population of interest | Low risk | Yes |
| Study participation: description of glycaemic status at baseline | Low risk | Yes |
| Study participation: adequate description of sampling frame & recruitment | Low risk | Yes |
| Study participation: adequate description of period & recruitment place | Low risk | Yes |
| Study participation: adequate description of inclusion & exclusion criteria | Low risk | Inclusion and exclusion criteria described |
| Study attrition: description of attempts to collect information on participants who dropped out | Low risk | Yes |
| Study attrition: reasons for loss to follow‐up provided | Unclear risk | Scarce data |
| Study attrition: adequate description of participants lost to follow‐up | Unclear risk | Scarce data |
| Study attrition: no important differences between participants who completed the study and those who did not | Unclear risk | Scarce data |
| Glycaemic status measurement: provision of clear definition or description of glycaemic status | Low risk | Yes |
| Glycaemic status measurement: valid and reliable method of glycaemic status measurement | Low risk | Yes |
| Glycaemic status measurement: continuous variables reported or appropriate cut points used | Low risk | IFG: FPG ≥ 5.6 |
| Glycaemic status measurement: same method and setting of measurement of the glycaemic status for all study participants | Low risk | Yes |
| Outcome measurement: clear definition of the outcome provided | Low risk | FPG ≥ 7.0 |
| Outcome measurement: method of outcome measurement used valid & reliable | Low risk | Yes |
| Outcome measurement: same method & setting of outcome measurement for all study participants | Low risk | Yes |
| Study confounding: important confounders measured | Unclear risk | Cumulative incidence, incidence rate |
| Study confounding: clear definitions of important confounders provided | Low risk | Yes |
| Study confounding: measurement of confounders valid & reliable | Low risk | Yes |
| Study confounding: same method & setting for measurements of confounders for all study participants | Low risk | Yes |
| Study confounding: appropriate methods used if missing confounder data imputed | Unclear risk | Not reported |
| Study confounding: important potential confounders accounted for in study design | Unclear risk | Cumulative incidence, incidence rate |
| Study confounding: important potential confounders accounted for in the analysis | Unclear risk | Cumulative incidence, incidence rate |
| Statistical analysis & reporting: sufficient presentation of data to assess adequacy of the analytic strategy | Low risk | Cumulative incidence, incidence rate |
| Statistical analysis & reporting: the statistical model is adequate for the design of the study | Low risk | Cox proportional hazards models (for sequential changes in FPG levels) |
| Name of study | Follow‐up of a cohort originally from the population‐based Västerbotten Intervention Program (VIP), a strategy to reach all middle‐aged persons individually at ages 40, 50 and 60 years, by inviting them to participate in systematic risk factor screening and individual counselling about healthy lifestyle habits; neuropathy study part of the VIP | |
| Inclusion criteria | All individuals who became 40, 50 or 60 years and who belonged to the list for a specific primary care centre or lived within the area for that centre | |
| Exclusion criteria | People not participating in the neuropathy study | |
| Notes | Baseline data for IGT cohort (N = 29) | |
| Risk of bias | ||
| Bias | Authors' judgement | Support for judgement |
| Study participation: description of source population or population of interest | Low risk | Yes |
| Study participation: description of glycaemic status at baseline | Low risk | Yes |
| Study participation: adequate description of sampling frame & recruitment | Low risk | Yes |
| Study participation: adequate description of period & recruitment place | Low risk | Yes |
| Study participation: adequate description of inclusion & exclusion criteria | Low risk | Inclusion and exclusion criteria described |
| Study attrition: description of attempts to collect information on participants who dropped out | Low risk | Yes |
| Study attrition: reasons for loss to follow‐up provided | Low risk | Yes |
| Study attrition: adequate description of participants lost to follow‐up | Low risk | Yes |
| Study attrition: no important differences between participants who completed the study and those who did not | Low risk | Yes |
| Glycaemic status measurement: provision of clear definition or description of glycaemic status | Low risk | Yes |
| Glycaemic status measurement: valid and reliable method of glycaemic status measurement | Low risk | Yes |
| Glycaemic status measurement: continuous variables reported or appropriate cut points used | Low risk | IGT: FPG < 7.0 and 2‐h PG ≥ 7.8 to < 11.1 |
| Glycaemic status measurement: same method and setting of measurement of the glycaemic status for all study participants | Low risk | Yes |
| Outcome measurement: clear definition of the outcome provided | Low risk | Yes |
| Outcome measurement: method of outcome measurement used valid & reliable | Low risk | FPG ≥ 7.0; 2‐h PG ≥ 11.1 |
| Outcome measurement: same method & setting of outcome measurement for all study participants | Low risk | Yes |
| Study confounding: important confounders measured | Unclear risk | Cumulative incidence |
| Study confounding: clear definitions of important confounders provided | Unclear risk | Cumulative incidence |
| Study confounding: measurement of confounders valid & reliable | Unclear risk | Cumulative incidence |
| Study confounding: same method & setting for measurements of confounders for all study participants | Unclear risk | Cumulative incidence |
| Study confounding: appropriate methods used if missing confounder data imputed | Unclear risk | Cumulative incidence |
| Study confounding: important potential confounders accounted for in study design | Unclear risk | Cumulative incidence |
| Study confounding: important potential confounders accounted for in the analysis | Unclear risk | Cumulative incidence |
| Statistical analysis & reporting: sufficient presentation of data to assess adequacy of the analytic strategy | Low risk | ANOVA, regression analyses |
| Statistical analysis & reporting: the statistical model is adequate for the design of the study | Unclear risk | Cumulative incidence |
| Name of study | None | |
| Inclusion criteria | Shanghai residents | |
| Exclusion criteria | Not reported | |
| Notes | Baseline data for cohort progressing to T2DM (N = 377) | |
| Risk of bias | ||
| Bias | Authors' judgement | Support for judgement |
| Study participation: description of source population or population of interest | Low risk | Yes |
| Study participation: description of glycaemic status at baseline | Low risk | Yes |
| Study participation: adequate description of sampling frame & recruitment | Low risk | Yes |
| Study participation: adequate description of period & recruitment place | Low risk | Yes |
| Study participation: adequate description of inclusion & exclusion criteria | Unclear risk | Only inclusion criteria reported |
| Study attrition: description of attempts to collect information on participants who dropped out | Unclear risk | Not reported |
| Study attrition: reasons for loss to follow‐up provided | Unclear risk | Not reported |
| Study attrition: adequate description of participants lost to follow‐up | Unclear risk | Not reported |
| Study attrition: no important differences between participants who completed the study and those who did not | Unclear risk | Not reported |
| Glycaemic status measurement: provision of clear definition or description of glycaemic status | Low risk | Yes |
| Glycaemic status measurement: valid and reliable method of glycaemic status measurement | Low risk | Yes |
| Glycaemic status measurement: continuous variables reported or appropriate cut points used | Low risk | i‐IFG: 6.1–6.9 and 2‐h PG < 7.8; i‐IGT: < 6.1 and 2‐h PG 7.8–11.0; IFG/IGT: 6.1–6.9 and 2‐h PG 7.8–11.0 |
| Glycaemic status measurement: same method and setting of measurement of the glycaemic status for all study participants | Low risk | Yes |
| Outcome measurement: clear definition of the outcome provided | Low risk | FPG ≥ 7.0; 2‐h PG ≥ 11.1 |
| Outcome measurement: method of outcome measurement used valid & reliable | Low risk | Yes |
| Outcome measurement: same method & setting of outcome measurement for all study participants | Low risk | Yes |
| Study confounding: important confounders measured | Unclear risk | Cumulative incidence |
| Study confounding: clear definitions of important confounders provided | Unclear risk | Cumulative incidence |
| Study confounding: measurement of confounders valid & reliable | Low risk | Yes |
| Study confounding: same method & setting for measurements of confounders for all study participants | Low risk | Yes |
| Study confounding: appropriate methods used if missing confounder data imputed | Unclear risk | Not reported |
| Study confounding: important potential confounders accounted for in study design | Unclear risk | Cumulative incidence |
| Study confounding: important potential confounders accounted for in the analysis | Unclear risk | Cumulative incidence |
| Statistical analysis & reporting: sufficient presentation of data to assess adequacy of the analytic strategy | Low risk | Cumulative incidence |
| Statistical analysis & reporting: the statistical model is adequate for the design of the study | Low risk | Logistic regression (to assess the potential contributing factors to diabetes incidence) |
| Name of study | None | |
| Inclusion criteria | Inhabitants in Oulu (northern Finland) recruited from the official population register to investigate the prevalence of diabetes and IGT, reasons for early retirement and the prevalence of depression | |
| Exclusion criteria | Previoulsy diagnosed diabetic people | |
| Notes | Only few baseline data for IGT cohort (N = 171); new cases identified by OGTTs in 1994 and 1996–8 | |
| Risk of bias | ||
| Bias | Authors' judgement | Support for judgement |
| Study participation: description of source population or population of interest | Low risk | Yes |
| Study participation: description of glycaemic status at baseline | Low risk | Yes |
| Study participation: adequate description of sampling frame & recruitment | Low risk | Yes |
| Study participation: adequate description of period & recruitment place | Low risk | Yes |
| Study participation: adequate description of inclusion & exclusion criteria | Low risk | Inclusion and exclusion criteria described |
| Study attrition: description of attempts to collect information on participants who dropped out | Low risk | Yes |
| Study attrition: reasons for loss to follow‐up provided | Low risk | Yes |
| Study attrition: adequate description of participants lost to follow‐up | Unclear risk | Scarce data |
| Study attrition: no important differences between participants who completed the study and those who did not | Unclear risk | Prevalence of hypertension was higher among people lost to follow‐up |
| Glycaemic status measurement: provision of clear definition or description of glycaemic status | Low risk | Yes |
| Glycaemic status measurement: valid and reliable method of glycaemic status measurement | Low risk | Yes |
| Glycaemic status measurement: continuous variables reported or appropriate cut points used | Low risk | IGT: 2‐h PG 7.8 to < 11.1 |
| Glycaemic status measurement: same method and setting of measurement of the glycaemic status for all study participants | Low risk | Yes |
| Outcome measurement: clear definition of the outcome provided | Low risk | 2‐h PG ≥ 11.1; 2 × FPG ≥ 6.7 |
| Outcome measurement: method of outcome measurement used valid & reliable | Low risk | Yes |
| Outcome measurement: same method & setting of outcome measurement for all study participants | Low risk | Yes |
| Study confounding: important confounders measured | Unclear risk | Cumulative incidence, incidence rate |
| Study confounding: clear definitions of important confounders provided | Low risk | Yes |
| Study confounding: measurement of confounders valid & reliable | Low risk | Yes |
| Study confounding: same method & setting for measurements of confounders for all study participants | Low risk | Yes |
| Study confounding: appropriate methods used if missing confounder data imputed | Unclear risk | Cumulative incidence, incidence rate |
| Study confounding: important potential confounders accounted for in study design | Unclear risk | Cumulative incidence, incidence rate |
| Study confounding: important potential confounders accounted for in the analysis | Unclear risk | Cumulative incidence, incidence rate |
| Statistical analysis & reporting: sufficient presentation of data to assess adequacy of the analytic strategy | Low risk | Cumulative incidence, incidence rate |
| Statistical analysis & reporting: the statistical model is adequate for the design of the study | Low risk | Multiple logistic regression (for effects of hypertension and antihypertensive medications) |
| Name of study | None | |
| Inclusion criteria | Indian individuals with IGT | |
| Exclusion criteria | Not reported | |
| Notes | Baseline data for the diabetic cohort at follow‐up (N = 39) | |
| Risk of bias | ||
| Bias | Authors' judgement | Support for judgement |
| Study participation: description of source population or population of interest | High risk | Not reported |
| Study participation: description of glycaemic status at baseline | Low risk | Yes |
| Study participation: adequate description of sampling frame & recruitment | Unclear risk | Scarce data |
| Study participation: adequate description of period & recruitment place | Unclear risk | Scarce data |
| Study participation: adequate description of inclusion & exclusion criteria | Unclear risk | Only inclusion criteria reported |
| Study attrition: description of attempts to collect information on participants who dropped out | Unclear risk | Not reported |
| Study attrition: reasons for loss to follow‐up provided | Unclear risk | Not reported |
| Study attrition: adequate description of participants lost to follow‐up | Unclear risk | Not reported |
| Study attrition: no important differences between participants who completed the study and those who did not | Unclear risk | Not reported |
| Glycaemic status measurement: provision of clear definition or description of glycaemic status | Low risk | Yes |
| Glycaemic status measurement: valid and reliable method of glycaemic status measurement | Low risk | Yes |
| Glycaemic status measurement: continuous variables reported or appropriate cut points used | Low risk | IGT: 7.8–11.0 (presumed NDDG 1979) |
| Glycaemic status measurement: same method and setting of measurement of the glycaemic status for all study participants | Low risk | Yes |
| Outcome measurement: clear definition of the outcome provided | Low risk | 2‐h PG > 11.0 (presumed NDDG 1979) |
| Outcome measurement: method of outcome measurement used valid & reliable | Low risk | Yes |
| Outcome measurement: same method & setting of outcome measurement for all study participants | Low risk | Yes |
| Study confounding: important confounders measured | Unclear risk | Cumulative incidence |
| Study confounding: clear definitions of important confounders provided | Unclear risk | Cumulative incidence |
| Study confounding: measurement of confounders valid & reliable | Unclear risk | Cumulative incidence |
| Study confounding: same method & setting for measurements of confounders for all study participants | Unclear risk | Cumulative incidence |
| Study confounding: appropriate methods used if missing confounder data imputed | Unclear risk | Cumulative incidence |
| Study confounding: important potential confounders accounted for in study design | Unclear risk | Cumulative incidence |
| Study confounding: important potential confounders accounted for in the analysis | Unclear risk | Cumulative incidence |
| Statistical analysis & reporting: sufficient presentation of data to assess adequacy of the analytic strategy | Low risk | Cumulative incidence |
| Statistical analysis & reporting: the statistical model is adequate for the design of the study | Unclear risk | Not reported |
| Name of study | Anglo‐Danish‐Dutch study of Intensive Treatment in People with Screen Detected Diabetes in Primary Care (ADDITION) | |
| Inclusion criteria | Population‐based high‐risk screening and intervention study for type 2 diabetes; persons aged 40–69 years registered with the participating practices in 5 counties in Denmark with a risk score of 5 points or more; measurement of fasting capillary blood glucose and OGTT; annual glucose measurement recommended for individuals with IFG and IGT; individuals with 2 diabetic glucose values on separate days were included in the intervention programme | |
| Exclusion criteria | Severe concurrent illness, alcohol abuse or subsequently treated by general practitioners not in the addition study; individuals with diabetes | |
| Notes | Baseline data for IFG (N = 607)/IGT cohort (N = 903) | |
| Risk of bias | ||
| Bias | Authors' judgement | Support for judgement |
| Study participation: description of source population or population of interest | Low risk | Yes |
| Study participation: description of glycaemic status at baseline | Low risk | Yes |
| Study participation: adequate description of sampling frame & recruitment | Low risk | Yes |
| Study participation: adequate description of period & recruitment place | Low risk | Yes |
| Study participation: adequate description of inclusion & exclusion criteria | Low risk | Inclusion and exclusion criteria described |
| Study attrition: description of attempts to collect information on participants who dropped out | Low risk | Yes |
| Study attrition: reasons for loss to follow‐up provided | Unclear risk | Scarce data |
| Study attrition: adequate description of participants lost to follow‐up | Unclear risk | Scarce data |
| Study attrition: no important differences between participants who completed the study and those who did not | Low risk | Yes |
| Glycaemic status measurement: provision of clear definition or description of glycaemic status | Low risk | Yes |
| Glycaemic status measurement: valid and reliable method of glycaemic status measurement | Unclear risk | Yes |
| Glycaemic status measurement: continuous variables reported or appropriate cut points used | Low risk | IFG (i‐IFG): FBG 5.6 to < 6.1 and 2‐h BG < 7.8; IGT (i‐IGT): FBG < 6.1 and 2‐h BG 7.8 to < 11.1; IFG/IGT |
| Glycaemic status measurement: same method and setting of measurement of the glycaemic status for all study participants | Unclear risk | Yes |
| Outcome measurement: clear definition of the outcome provided | Low risk | FBG ≥ 6.1 or 2‐h BG ≥ 11.1 |
| Outcome measurement: method of outcome measurement used valid & reliable | Low risk | Yes |
| Outcome measurement: same method & setting of outcome measurement for all study participants | Low risk | Yes |
| Study confounding: important confounders measured | Unclear risk | Cumulative incidence, incidence rate |
| Study confounding: clear definitions of important confounders provided | Low risk | Yes |
| Study confounding: measurement of confounders valid & reliable | Low risk | Yes |
| Study confounding: same method & setting for measurements of confounders for all study participants | Low risk | Yes |
| Study confounding: appropriate methods used if missing confounder data imputed | Unclear risk | Not reported |
| Study confounding: important potential confounders accounted for in study design | Unclear risk | Cumulative incidence, incidence rate |
| Study confounding: important potential confounders accounted for in the analysis | Unclear risk | Cumulative incidence, incidence rate |
| Statistical analysis & reporting: sufficient presentation of data to assess adequacy of the analytic strategy | Low risk | Cumulative incidence, incidence rate |
| Statistical analysis & reporting: the statistical model is adequate for the design of the study | Low risk | Regression models (for sequential changes in some covariates) |
| Name of study | Kooperative Gesundheitsforschung in der Region Augsburg (KORA S4/F4) | |
| Inclusion criteria | People living in Augsburg and surroundings; KORA was follow‐up of MONICA WHO‐Project (Monitoring Trends and determinants in Cardiovascular Disease); S1: 25–64 years, S2/S3/S4: 25–74 years | |
| Exclusion criteria | People with known diabetes | |
| Notes | Baseline characteristics for total cohort (participants of the follow‐up; age‐group 55–74 years; N = 887) | |
| Risk of bias | ||
| Bias | Authors' judgement | Support for judgement |
| Study participation: description of source population or population of interest | Low risk | Yes |
| Study participation: description of glycaemic status at baseline | Low risk | Yes |
| Study participation: adequate description of sampling frame & recruitment | Low risk | Yes |
| Study participation: adequate description of period & recruitment place | Low risk | Yes |
| Study participation: adequate description of inclusion & exclusion criteria | Low risk | Inclusion and exclusion criteria described |
| Study attrition: description of attempts to collect information on participants who dropped out | Low risk | Yes |
| Study attrition: reasons for loss to follow‐up provided | Low risk | Yes |
| Study attrition: adequate description of participants lost to follow‐up | Low risk | Yes |
| Study attrition: no important differences between participants who completed the study and those who did not | Unclear risk | Some differences reported |
| Glycaemic status measurement: provision of clear definition or description of glycaemic status | Low risk | Yes |
| Glycaemic status measurement: valid and reliable method of glycaemic status measurement | Low risk | Yes |
| Glycaemic status measurement: continuous variables reported or appropriate cut points used | Low risk | IFG: FPG 6.1–6.9; IGT: 2‐h PG 7.8 to < 11.1; 'prediabetes': i‐IFG, i‐IGT and IFG/IGT |
| Glycaemic status measurement: same method and setting of measurement of the glycaemic status for all study participants | Low risk | Yes |
| Outcome measurement: clear definition of the outcome provided | Low risk | FPG ≥ 7.0; 2‐h PG ≥ 11.1; validated physician diagnosis |
| Outcome measurement: method of outcome measurement used valid & reliable | Low risk | Yes |
| Outcome measurement: same method & setting of outcome measurement for all study participants | Low risk | Yes |
| Study confounding: important confounders measured | Unclear risk | Some covariates measured (see Appendix 16 and Appendix 17) |
| Study confounding: clear definitions of important confounders provided | Low risk | Yes |
| Study confounding: measurement of confounders valid & reliable | Low risk | Yes |
| Study confounding: same method & setting for measurements of confounders for all study participants | Low risk | Yes |
| Study confounding: appropriate methods used if missing confounder data imputed | Unclear risk | Not reported |
| Study confounding: important potential confounders accounted for in study design | Unclear risk | Some covariates included (see Appendix 16 and Appendix 17) |
| Study confounding: important potential confounders accounted for in the analysis | Unclear risk | Some covariates analyses (see Appendix 16 and Appendix 17) |
| Statistical analysis & reporting: sufficient presentation of data to assess adequacy of the analytic strategy | Low risk | Cumulative incidence, incidence rate, odds ratio |
| Statistical analysis & reporting: the statistical model is adequate for the design of the study | Low risk | Logistic regression models |
| Name of study | Hoorn Study | |
| Inclusion criteria | General Dutch population (Hoorn) aged 50–75 years at baseline; participants completing both measurements in 1989 and 1996 | |
| Exclusion criteria | People using antihyperglycaemic medications or diet for diabetes were marked as known diabetes mellitus; missing information of plasma glucose values | |
| Notes | Baseline data for IFG6.1 (N = 149)/IFG5.6 (N = 488) | |
| Risk of bias | ||
| Bias | Authors' judgement | Support for judgement |
| Study participation: description of source population or population of interest | Low risk | Yes |
| Study participation: description of glycaemic status at baseline | Low risk | Yes |
| Study participation: adequate description of sampling frame & recruitment | Low risk | Yes |
| Study participation: adequate description of period & recruitment place | Low risk | Yes |
| Study participation: adequate description of inclusion & exclusion criteria | Low risk | Inclusion and exclusion criteria described |
| Study attrition: description of attempts to collect information on participants who dropped out | Low risk | Yes |
| Study attrition: reasons for loss to follow‐up provided | Low risk | Yes |
| Study attrition: adequate description of participants lost to follow‐up | Low risk | Yes |
| Study attrition: no important differences between participants who completed the study and those who did not | Low risk | No substantial differences |
| Glycaemic status measurement: provision of clear definition or description of glycaemic status | Low risk | Yes |
| Glycaemic status measurement: valid and reliable method of glycaemic status measurement | Low risk | Yes |
| Glycaemic status measurement: continuous variables reported or appropriate cut points used | Low risk | IFG5.6: FPG 5.6–7.0; IFG6.1: FPG 6.1–7.0; IGT: 2‐h PG 7.8 to < 11.1 |
| Glycaemic status measurement: same method and setting of measurement of the glycaemic status for all study participants | Low risk | Yes |
| Outcome measurement: clear definition of the outcome provided | Low risk | FPG ≥ 7.0; 2‐h PG: ≥ 11.1 |
| Outcome measurement: method of outcome measurement used valid & reliable | Low risk | Yes |
| Outcome measurement: same method & setting of outcome measurement for all study participants | Low risk | Yes |
| Study confounding: important confounders measured | Unclear risk | Some covariates measured (see Appendix 16 and Appendix 17) |
| Study confounding: clear definitions of important confounders provided | Low risk | Yes |
| Study confounding: measurement of confounders valid & reliable | Low risk | Yes |
| Study confounding: same method & setting for measurements of confounders for all study participants | Low risk | Yes |
| Study confounding: appropriate methods used if missing confounder data imputed | Unclear risk | Not reported |
| Study confounding: important potential confounders accounted for in study design | Unclear risk | Some covariates included (see Appendix 16 and Appendix 17) |
| Study confounding: important potential confounders accounted for in the analysis | Unclear risk | Some covariates analysed (see Appendix 16 and Appendix 17) |
| Statistical analysis & reporting: sufficient presentation of data to assess adequacy of the analytic strategy | Low risk | Cumulative incidence, incidence rate, odds ratio |
| Statistical analysis & reporting: the statistical model is adequate for the design of the study | Low risk | Cox proportional hazards models |
| Name of study | Isfahan Cohort Study (ICS), baseline survey of the Isfahan Healthy Heart Program (IHHP) | |
| Inclusion criteria | Participants of the baseline survey of the Isfahan Healthy Heart Program, a community trial for prevention and control of CVD | |
| Exclusion criteria | Diabetes at baseline | |
| Notes | Baseline data for prediabetic cohort at baseline becoming diabetic at follow‐up (N = 131) | |
| Risk of bias | ||
| Bias | Authors' judgement | Support for judgement |
| Study participation: description of source population or population of interest | Low risk | Yes |
| Study participation: description of glycaemic status at baseline | Low risk | Yes |
| Study participation: adequate description of sampling frame & recruitment | Low risk | Yes |
| Study participation: adequate description of period & recruitment place | Low risk | Yes |
| Study participation: adequate description of inclusion & exclusion criteria | Low risk | Inclusion and exclusion criteria described |
| Study attrition: description of attempts to collect information on participants who dropped out | Low risk | Yes |
| Study attrition: reasons for loss to follow‐up provided | Unclear risk | Scarce data |
| Study attrition: adequate description of participants lost to follow‐up | Unclear risk | Scarce data |
| Study attrition: no important differences between participants who completed the study and those who did not | Low risk | Yes |
| Glycaemic status measurement: provision of clear definition or description of glycaemic status | Low risk | Yes |
| Glycaemic status measurement: valid and reliable method of glycaemic status measurement | Low risk | Yes |
| Glycaemic status measurement: continuous variables reported or appropriate cut points used | Low risk | IFG: FPG ≥ 5.5 and < 7.0; IGT: 2‐h OGTT ≥ 7.8 and < 11.1 |
| Glycaemic status measurement: same method and setting of measurement of the glycaemic status for all study participants | Low risk | Yes |
| Outcome measurement: clear definition of the outcome provided | Low risk | FPG > 7.0; 2‐h OGTT > 11.1; IFG/IGT; antihyperglycaemic medication |
| Outcome measurement: method of outcome measurement used valid & reliable | Low risk | Yes |
| Outcome measurement: same method & setting of outcome measurement for all study participants | Low risk | Yes |
| Study confounding: important confounders measured | Unclear risk | Some covariates measured (see Appendix 16 and Appendix 17) |
| Study confounding: clear definitions of important confounders provided | Low risk | Yes |
| Study confounding: measurement of confounders valid & reliable | Low risk | Yes |
| Study confounding: same method & setting for measurements of confounders for all study participants | Low risk | Yes |
| Study confounding: appropriate methods used if missing confounder data imputed | Low risk | Stochastic regression methods |
| Study confounding: important potential confounders accounted for in study design | Unclear risk | Some covariates included (see Appendix 16 and Appendix 17) |
| Study confounding: important potential confounders accounted for in the analysis | Unclear risk | Some covariates analysed (see Appendix 16 and Appendix 17) |
| Statistical analysis & reporting: sufficient presentation of data to assess adequacy of the analytic strategy | Low risk | Cumulative incidence, incidence rate, odds ratio |
| Statistical analysis & reporting: the statistical model is adequate for the design of the study | Low risk | Multivariate logistic regression |
| Name of study | None | |
| Inclusion criteria | Epidemiological survey on diabetes mellitus in Osaka, Japan and follow‐up study | |
| Exclusion criteria | Not reported | |
| Notes | Baseline data for the IGT cohort (N = 13) | |
| Risk of bias | ||
| Bias | Authors' judgement | Support for judgement |
| Study participation: description of source population or population of interest | Low risk | Yes |
| Study participation: description of glycaemic status at baseline | Low risk | Yes |
| Study participation: adequate description of sampling frame & recruitment | Low risk | Yes |
| Study participation: adequate description of period & recruitment place | Low risk | Yes |
| Study participation: adequate description of inclusion & exclusion criteria | Unclear risk | Only inclusion criteria described |
| Study attrition: description of attempts to collect information on participants who dropped out | Low risk | Yes |
| Study attrition: reasons for loss to follow‐up provided | Unclear risk | Scarce data |
| Study attrition: adequate description of participants lost to follow‐up | Unclear risk | Scarce data |
| Study attrition: no important differences between participants who completed the study and those who did not | Low risk | Yes |
| Glycaemic status measurement: provision of clear definition or description of glycaemic status | Low risk | Yes |
| Glycaemic status measurement: valid and reliable method of glycaemic status measurement | Low risk | Yes |
| Glycaemic status measurement: continuous variables reported or appropriate cut points used | Low risk | IGT: FPG < 7.8 and 2‐h PG 7.8–11.1 (WHO 1980) |
| Glycaemic status measurement: same method and setting of measurement of the glycaemic status for all study participants | Low risk | Yes |
| Outcome measurement: clear definition of the outcome provided | Low risk | FPG ≥ 7.8 or 2‐h PG ≥ 11.1 (WHO 1980) |
| Outcome measurement: method of outcome measurement used valid & reliable | Low risk | Yes |
| Outcome measurement: same method & setting of outcome measurement for all study participants | Low risk | Yes |
| Study confounding: important confounders measured | Unclear risk | Cumulative incidence |
| Study confounding: clear definitions of important confounders provided | Unclear risk | Scarce data |
| Study confounding: measurement of confounders valid & reliable | Unclear risk | Scarce data |
| Study confounding: same method & setting for measurements of confounders for all study participants | Unclear risk | Scarce data |
| Study confounding: appropriate methods used if missing confounder data imputed | Unclear risk | Not reported |
| Study confounding: important potential confounders accounted for in study design | Unclear risk | Cumulative incidence |
| Study confounding: important potential confounders accounted for in the analysis | Unclear risk | Cumulative incidence, incidence rate |
| Statistical analysis & reporting: sufficient presentation of data to assess adequacy of the analytic strategy | Low risk | Cumulative incidence |
| Statistical analysis & reporting: the statistical model is adequate for the design of the study | Unclear risk | Multiple logistic regression (standardised regression coefficients for single covariates) |
| Name of study | Kansai Healthcare Study | |
| Inclusion criteria | Japanese male employees of a company in the area of Kansai, aged 40–55 years, not taking an oral antihyperglycaemic or insulin at study entry and considered to be involved in sedentary jobs | |
| Exclusion criteria | Not reported | |
| Notes | Baseline data for cohort becoming diabetic at follow‐up (N = 659/6804); non‐standard categories for elevated HbA1c values were used (Table 1, p 645 of the publication) | |
| Risk of bias | ||
| Bias | Authors' judgement | Support for judgement |
| Study participation: description of source population or population of interest | Low risk | Yes |
| Study participation: description of glycaemic status at baseline | Low risk | Yes |
| Study participation: adequate description of sampling frame & recruitment | Low risk | Yes |
| Study participation: adequate description of period & recruitment place | Low risk | Yes |
| Study participation: adequate description of inclusion & exclusion criteria | Unclear risk | Only inclusion criteria reported |
| Study attrition: description of attempts to collect information on participants who dropped out | Unclear risk | Scarce data |
| Study attrition: reasons for loss to follow‐up provided | Unclear risk | Scarce data |
| Study attrition: adequate description of participants lost to follow‐up | Unclear risk | Scarce data |
| Study attrition: no important differences between participants who completed the study and those who did not | Unclear risk | Not reported |
| Glycaemic status measurement: provision of clear definition or description of glycaemic status | Low risk | Yes |
| Glycaemic status measurement: valid and reliable method of glycaemic status measurement | Low risk | Yes |
| Glycaemic status measurement: continuous variables reported or appropriate cut points used | Low risk | Table 1: IFG: FPG group 6.1–6.9; HbA1c‐group: 6.0–6.4 |
| Glycaemic status measurement: same method and setting of measurement of the glycaemic status for all study participants | Low risk | Yes |
| Outcome measurement: clear definition of the outcome provided | Low risk | FPG ≥ 7.0; antihyperglycaemic medication |
| Outcome measurement: method of outcome measurement used valid & reliable | Low risk | Yes |
| Outcome measurement: same method & setting of outcome measurement for all study participants | Low risk | Yes |
| Study confounding: important confounders measured | Low risk | Yes |
| Study confounding: clear definitions of important confounders provided | Low risk | Yes |
| Study confounding: measurement of confounders valid & reliable | Low risk | Yes |
| Study confounding: same method & setting for measurements of confounders for all study participants | Low risk | Yes |
| Study confounding: appropriate methods used if missing confounder data imputed | Unclear risk | Not reported |
| Study confounding: important potential confounders accounted for in study design | Low risk | Yes |
| Study confounding: important potential confounders accounted for in the analysis | Low risk | Yes |
| Statistical analysis & reporting: sufficient presentation of data to assess adequacy of the analytic strategy | Low risk | Odds ratio |
| Statistical analysis & reporting: the statistical model is adequate for the design of the study | Low risk | Multiple logistic regression (FPG, HbA1c categories) |
| Name of study | Study within the WHO‐assisted National Diabetes Programme | |
| Inclusion criteria | Within the framework of the WHO‐assisted National Diabetes Programme a cohort of Maltese people was investigated | |
| Exclusion criteria | Known diabetic persons | |
| Notes | Baseline data for diabetic cohort at follow‐up (N = 166) | |
| Risk of bias | ||
| Bias | Authors' judgement | Support for judgement |
| Study participation: description of source population or population of interest | Low risk | Yes |
| Study participation: description of glycaemic status at baseline | Low risk | Yes |
| Study participation: adequate description of sampling frame & recruitment | Unclear risk | Scarce data |
| Study participation: adequate description of period & recruitment place | Low risk | Yes |
| Study participation: adequate description of inclusion & exclusion criteria | Low risk | Yes |
| Study attrition: description of attempts to collect information on participants who dropped out | Unclear risk | Not reported |
| Study attrition: reasons for loss to follow‐up provided | Unclear risk | Not reported |
| Study attrition: adequate description of participants lost to follow‐up | Unclear risk | Not reported |
| Study attrition: no important differences between participants who completed the study and those who did not | Unclear risk | Not reported |
| Glycaemic status measurement: provision of clear definition or description of glycaemic status | Low risk | Yes |
| Glycaemic status measurement: valid and reliable method of glycaemic status measurement | Low risk | Yes |
| Glycaemic status measurement: continuous variables reported or appropriate cut points used | Low risk | IGT: 2‐h PG ≥ 7.8 to < 11.1 (WHO 1985) |
| Glycaemic status measurement: same method and setting of measurement of the glycaemic status for all study participants | Low risk | Yes |
| Outcome measurement: clear definition of the outcome provided | Low risk | 2‐h PG ≥ 11.1 (WHO 1985) |
| Outcome measurement: method of outcome measurement used valid & reliable | Low risk | Yes |
| Outcome measurement: same method & setting of outcome measurement for all study participants | Low risk | Yes |
| Study confounding: important confounders measured | Unclear risk | Cumulative incidence |
| Study confounding: clear definitions of important confounders provided | Unclear risk | Cumulative incidence |
| Study confounding: measurement of confounders valid & reliable | Unclear risk | Cumulative incidence |
| Study confounding: same method & setting for measurements of confounders for all study participants | Unclear risk | Cumulative incidence |
| Study confounding: appropriate methods used if missing confounder data imputed | Unclear risk | Cumulative incidence |
| Study confounding: important potential confounders accounted for in study design | Unclear risk | Cumulative incidence |
| Study confounding: important potential confounders accounted for in the analysis | Unclear risk | Cumulative incidence |
| Statistical analysis & reporting: sufficient presentation of data to assess adequacy of the analytic strategy | Low risk | Cumulative incidence |
| Statistical analysis & reporting: the statistical model is adequate for the design of the study | Unclear risk | Not reported |
| Name of study | Zanjan Healthy Heart Study | |
| Inclusion criteria | Participants from the Zanjan Healthy Heart Study, aged 21–75 years, individuals with IFG | |
| Exclusion criteria | Not reported | |
| Notes | Baseline data for active participants (N = 123) of the IFG cohort | |
| Risk of bias | ||
| Bias | Authors' judgement | Support for judgement |
| Study participation: description of source population or population of interest | Low risk | Yes |
| Study participation: description of glycaemic status at baseline | Low risk | Yes |
| Study participation: adequate description of sampling frame & recruitment | Low risk | Yes |
| Study participation: adequate description of period & recruitment place | Low risk | Yes |
| Study participation: adequate description of inclusion & exclusion criteria | Unclear risk | Only inclusion criteria reported |
| Study attrition: description of attempts to collect information on participants who dropped out | Low risk | Yes |
| Study attrition: reasons for loss to follow‐up provided | Low risk | Yes |
| Study attrition: adequate description of participants lost to follow‐up | Unclear risk | High attrition rate (> 50%) |
| Study attrition: no important differences between participants who completed the study and those who did not | Low risk | Yes |
| Glycaemic status measurement: provision of clear definition or description of glycaemic status | Low risk | Yes |
| Glycaemic status measurement: valid and reliable method of glycaemic status measurement | Low risk | Yes |
| Glycaemic status measurement: continuous variables reported or appropriate cut points used | Low risk | FPG 5.6–7.0 |
| Glycaemic status measurement: same method and setting of measurement of the glycaemic status for all study participants | Low risk | Yes |
| Outcome measurement: clear definition of the outcome provided | Low risk | FPG > 7.0 (2 measurements); diabetes diagnosis based on documents |
| Outcome measurement: method of outcome measurement used valid & reliable | Low risk | Yes |
| Outcome measurement: same method & setting of outcome measurement for all study participants | Low risk | Yes |
| Study confounding: important confounders measured | Unclear risk | Cumulative incidence |
| Study confounding: clear definitions of important confounders provided | Low risk | Yes |
| Study confounding: measurement of confounders valid & reliable | Low risk | Yes |
| Study confounding: same method & setting for measurements of confounders for all study participants | Low risk | Yes |
| Study confounding: appropriate methods used if missing confounder data imputed | Unclear risk | Not reported |
| Study confounding: important potential confounders accounted for in study design | Unclear risk | Cumulative incidence |
| Study confounding: important potential confounders accounted for in the analysis | Unclear risk | Cumulative incidence |
| Statistical analysis & reporting: sufficient presentation of data to assess adequacy of the analytic strategy | Low risk | Cumulative incidence |
| Statistical analysis & reporting: the statistical model is adequate for the design of the study | Unclear risk | Logistic regression (BMI and physical activity for prediction of diabetes) |
| Name of study | Yonchon study | |
| Inclusion criteria | Individuals living in Yonchon County (South Korea), free of diabetes aged ≥ 30 years | |
| Exclusion criteria | Diabetes | |
| Notes | Baseline data for individuals converting to T2DM (N = 67) | |
| Risk of bias | ||
| Bias | Authors' judgement | Support for judgement |
| Study participation: description of source population or population of interest | Low risk | Yes |
| Study participation: description of glycaemic status at baseline | Low risk | Yes |
| Study participation: adequate description of sampling frame & recruitment | Low risk | Yes |
| Study participation: adequate description of period & recruitment place | Low risk | Yes |
| Study participation: adequate description of inclusion & exclusion criteria | Low risk | Inclusion and exclusion criteria described |
| Study attrition: description of attempts to collect information on participants who dropped out | Unclear risk | Scarce data |
| Study attrition: reasons for loss to follow‐up provided | Unclear risk | Scarce data |
| Study attrition: adequate description of participants lost to follow‐up | Unclear risk | Scarce data |
| Study attrition: no important differences between participants who completed the study and those who did not | Unclear risk | Not reported |
| Glycaemic status measurement: provision of clear definition or description of glycaemic status | Unclear risk | Scarce data |
| Glycaemic status measurement: valid and reliable method of glycaemic status measurement | Unclear risk | Scarce data |
| Glycaemic status measurement: continuous variables reported or appropriate cut points used | Unclear risk | Assumed WHO 1985 criteria |
| Glycaemic status measurement: same method and setting of measurement of the glycaemic status for all study participants | Unclear risk | Scarce data |
| Outcome measurement: clear definition of the outcome provided | Low risk | "WHO criteria"; antihyperglycaemic medication |
| Outcome measurement: method of outcome measurement used valid & reliable | Unclear risk | Scarce data |
| Outcome measurement: same method & setting of outcome measurement for all study participants | Unclear risk | Scarce data |
| Study confounding: important confounders measured | Unclear risk | Cumulative incidence |
| Study confounding: clear definitions of important confounders provided | Unclear risk | Yes |
| Study confounding: measurement of confounders valid & reliable | Low risk | Yes |
| Study confounding: same method & setting for measurements of confounders for all study participants | Low risk | Yes |
| Study confounding: appropriate methods used if missing confounder data imputed | Unclear risk | Not reported |
| Study confounding: important potential confounders accounted for in study design | Unclear risk | Cumulative incidence |
| Study confounding: important potential confounders accounted for in the analysis | Unclear risk | Cumulative incidence |
| Statistical analysis & reporting: sufficient presentation of data to assess adequacy of the analytic strategy | Low risk | Cumulative incidence |
| Statistical analysis & reporting: the statistical model is adequate for the design of the study | Low risk | Multiple logistic regression (1 mmol/L difference for FPG and 2‐h plasma glucose) |
| Name of study | Korean Genome Epidemiology Study‐Kangwha Study (KoGES) | |
| Inclusion criteria | People aged ≥ 40 years | |
| Exclusion criteria | Missing key variables, history of stroke, angina pectoris or myocardial infarction, diabetes | |
| Notes | Baseline data for prediabetic cohort (men: N = 154; women: N = 167; total: N = 321); ranges for men ‐ women | |
| Risk of bias | ||
| Bias | Authors' judgement | Support for judgement |
| Study participation: description of source population or population of interest | Low risk | Yes |
| Study participation: description of glycaemic status at baseline | Low risk | Yes |
| Study participation: adequate description of sampling frame & recruitment | Low risk | Yes |
| Study participation: adequate description of period & recruitment place | Low risk | Yes |
| Study participation: adequate description of inclusion & exclusion criteria | Low risk | Inclusion and exclusion criteria described |
| Study attrition: description of attempts to collect information on participants who dropped out | Low risk | Yes |
| Study attrition: reasons for loss to follow‐up provided | Low risk | Yes |
| Study attrition: adequate description of participants lost to follow‐up | Unclear risk | Scarce data |
| Study attrition: no important differences between participants who completed the study and those who did not | Unclear risk | Responders had relatively low FPG and HbA1c at baseline compared to non‐responders |
| Glycaemic status measurement: provision of clear definition or description of glycaemic status | Low risk | Yes |
| Glycaemic status measurement: valid and reliable method of glycaemic status measurement | Low risk | Yes |
| Glycaemic status measurement: continuous variables reported or appropriate cut points used | Low risk | IFG: FPG 5.6–6.9 |
| Glycaemic status measurement: same method and setting of measurement of the glycaemic status for all study participants | Low risk | Yes |
| Outcome measurement: clear definition of the outcome provided | Low risk | FPG ≥ 7.0; HbA1c ≥ 6.5; antihyperglycaemic medication |
| Outcome measurement: method of outcome measurement used valid & reliable | Low risk | Yes |
| Outcome measurement: same method & setting of outcome measurement for all study participants | Low risk | Yes |
| Study confounding: important confounders measured | Low risk | Yes |
| Study confounding: clear definitions of important confounders provided | Low risk | Yes |
| Study confounding: measurement of confounders valid & reliable | Low risk | Yes |
| Study confounding: same method & setting for measurements of confounders for all study participants | Low risk | Yes |
| Study confounding: appropriate methods used if missing confounder data imputed | Unclear risk | Not reported |
| Study confounding: important potential confounders accounted for in study design | Low risk | Yes |
| Study confounding: important potential confounders accounted for in the analysis | Low risk | Yes |
| Statistical analysis & reporting: sufficient presentation of data to assess adequacy of the analytic strategy | Unclear risk | Cumulative incidence, relative risk |
| Statistical analysis & reporting: the statistical model is adequate for the design of the study | Low risk | Generalised linear models |
| Name of study | None | |
| Inclusion criteria | Survey of the prevalence of T2DM in an urban community; eligible permanent inhabitants 15–74 years | |
| Exclusion criteria | Not reported | |
| Notes | Baseline data for prediabetic cohort (N = 334) | |
| Risk of bias | ||
| Bias | Authors' judgement | Support for judgement |
| Study participation: description of source population or population of interest | Low risk | Yes |
| Study participation: description of glycaemic status at baseline | Low risk | Yes |
| Study participation: adequate description of sampling frame & recruitment | Low risk | Yes |
| Study participation: adequate description of period & recruitment place | Low risk | Yes |
| Study participation: adequate description of inclusion & exclusion criteria | Unclear risk | Only inclusion criteria reported |
| Study attrition: description of attempts to collect information on participants who dropped out | Low risk | Yes |
| Study attrition: reasons for loss to follow‐up provided | Low risk | Yes |
| Study attrition: adequate description of participants lost to follow‐up | Low risk | Yes |
| Study attrition: no important differences between participants who completed the study and those who did not | Low risk | Yes |
| Glycaemic status measurement: provision of clear definition or description of glycaemic status | Low risk | Yes |
| Glycaemic status measurement: valid and reliable method of glycaemic status measurement | Low risk | Yes |
| Glycaemic status measurement: continuous variables reported or appropriate cut points used | Low risk | IFG: FG 5.6–6.9; IGT: 2‐h G 7.8–11.0 |
| Glycaemic status measurement: same method and setting of measurement of the glycaemic status for all study participants | Low risk | Yes |
| Outcome measurement: clear definition of the outcome provided | Low risk | IFG ≥ 7.0; 2‐h G ≥ 11.0; HbA1c ≥ 6.5; self‐reported |
| Outcome measurement: method of outcome measurement used valid & reliable | Low risk | Yes |
| Outcome measurement: same method & setting of outcome measurement for all study participants | Low risk | Yes |
| Study confounding: important confounders measured | Unclear risk | Cumulative incidence |
| Study confounding: clear definitions of important confounders provided | Low risk | Yes |
| Study confounding: measurement of confounders valid & reliable | Low risk | Yes |
| Study confounding: same method & setting for measurements of confounders for all study participants | Low risk | Yes |
| Study confounding: appropriate methods used if missing confounder data imputed | Unclear risk | Not reported |
| Study confounding: important potential confounders accounted for in study design | Unclear risk | Cumulative incidence |
| Study confounding: important potential confounders accounted for in the analysis | Unclear risk | Cumulative incidence |
| Statistical analysis & reporting: sufficient presentation of data to assess adequacy of the analytic strategy | Low risk | Cumulative incidence |
| Statistical analysis & reporting: the statistical model is adequate for the design of the study | Low risk | Logistic regression models (sex‐related risk factors associated with the development of diabetes) |
| Name of study | Pizarra study, evaluating the prevalence of latent autoimmune diabetes of adults (LADA) in the context of the overall prevalence of diabetes in Southern Spain | |
| Inclusion criteria | People aged 18–65 years from Pizarra, Malaga | |
| Exclusion criteria | Institutionalised persons, pregnant women, severe clinical or psychological disorder | |
| Notes | Baseline data for final sample of follow‐up (N = 714); diabetes diagnosis according to capillary blood glucose levels > 6.1 mmol/L or post OGTT BG > 11.1 mmol/L | |
| Risk of bias | ||
| Bias | Authors' judgement | Support for judgement |
| Study participation: description of source population or population of interest | Low risk | Yes |
| Study participation: description of glycaemic status at baseline | Low risk | Yes |
| Study participation: adequate description of sampling frame & recruitment | Low risk | Yes |
| Study participation: adequate description of period & recruitment place | Low risk | Yes |
| Study participation: adequate description of inclusion & exclusion criteria | Low risk | Inclusion and exclusion criteria described |
| Study attrition: description of attempts to collect information on participants who dropped out | Low risk | Yes |
| Study attrition: reasons for loss to follow‐up provided | Low risk | Yes |
| Study attrition: adequate description of participants lost to follow‐up | Low risk | Yes |
| Study attrition: no important differences between participants who completed the study and those who did not | Unclear risk | Scarce data |
| Glycaemic status measurement: provision of clear definition or description of glycaemic status | Low risk | Yes |
| Glycaemic status measurement: valid and reliable method of glycaemic status measurement | Unclear risk | Yes |
| Glycaemic status measurement: continuous variables reported or appropriate cut points used | Low risk | IFG: BG 5.6–6.1 and 2‐h BG < 7.8; IGT: BG < 5.6 and 2‐h BG 7.8–11.1 |
| Glycaemic status measurement: same method and setting of measurement of the glycaemic status for all study participants | Low risk | Yes |
| Outcome measurement: clear definition of the outcome provided | Low risk | BG > 6.1 or 2‐h BG > 11.1 |
| Outcome measurement: method of outcome measurement used valid & reliable | Low risk | Yes |
| Outcome measurement: same method & setting of outcome measurement for all study participants | Low risk | Yes |
| Study confounding: important confounders measured | Unclear risk | Some covariates measured (see Appendix 16 and Appendix 17) |
| Study confounding: clear definitions of important confounders provided | Low risk | Yes |
| Study confounding: measurement of confounders valid & reliable | Low risk | Yes |
| Study confounding: same method & setting for measurements of confounders for all study participants | Low risk | Yes |
| Study confounding: appropriate methods used if missing confounder data imputed | Unclear risk | Not reported |
| Study confounding: important potential confounders accounted for in study design | Unclear risk | Some covariates included (see Appendix 16 and Appendix 17) |
| Study confounding: important potential confounders accounted for in the analysis | Unclear risk | Some covariates analysed (see Appendix 16 and Appendix 17) |
| Statistical analysis & reporting: sufficient presentation of data to assess adequacy of the analytic strategy | Low risk | Cumulative incidence, incidence rate, relative risk |
| Statistical analysis & reporting: the statistical model is adequate for the design of the study | Low risk | Multivariate logistic regression |
| Name of study | Finnish Cohorts of the Seven Countries Study | |
| Inclusion criteria | Elderly Finnish men, survivors of the Finnish cohorts of the Seven‐Countries Study (studying mortality, morbidity and risk factor levels of cardiovascular diseases in different countries), aged 65–84 years at baseline | |
| Exclusion criteria | Not reported | |
| Notes | Baseline data for IGT cohort converting to T2DM (N = 17) | |
| Risk of bias | ||
| Bias | Authors' judgement | Support for judgement |
| Study participation: description of source population or population of interest | Low risk | Yes |
| Study participation: description of glycaemic status at baseline | Low risk | Yes |
| Study participation: adequate description of sampling frame & recruitment | Low risk | Yes |
| Study participation: adequate description of period & recruitment place | Low risk | Yes |
| Study participation: adequate description of inclusion & exclusion criteria | Unclear risk | Only inclusion criteria reported |
| Study attrition: description of attempts to collect information on participants who dropped out | Unclear risk | Scarce data |
| Study attrition: reasons for loss to follow‐up provided | Unclear risk | Scarce data |
| Study attrition: adequate description of participants lost to follow‐up | Unclear risk | Not reported |
| Study attrition: no important differences between participants who completed the study and those who did not | Unclear risk | Not reported |
| Glycaemic status measurement: provision of clear definition or description of glycaemic status | Low risk | Yes |
| Glycaemic status measurement: valid and reliable method of glycaemic status measurement | Low risk | Yes |
| Glycaemic status measurement: continuous variables reported or appropriate cut points used | Low risk | IGT: 2‐h PG 7.8–11.1 |
| Glycaemic status measurement: same method and setting of measurement of the glycaemic status for all study participants | Low risk | Yes |
| Outcome measurement: clear definition of the outcome provided | Low risk | 2‐h PG ≥ 11.1 (WHO 1985); antihyperglycaemic medications |
| Outcome measurement: method of outcome measurement used valid & reliable | Low risk | Yes |
| Outcome measurement: same method & setting of outcome measurement for all study participants | Low risk | Yes |
| Study confounding: important confounders measured | Unclear risk | Some covariates measured (see Appendix 16 and Appendix 17) |
| Study confounding: clear definitions of important confounders provided | Low risk | Yes |
| Study confounding: measurement of confounders valid & reliable | Low risk | Yes |
| Study confounding: same method & setting for measurements of confounders for all study participants | Low risk | Yes |
| Study confounding: appropriate methods used if missing confounder data imputed | Unclear risk | Not reported |
| Study confounding: important potential confounders accounted for in study design | Unclear risk | Some covariates included (see Appendix 16 and Appendix 17) |
| Study confounding: important potential confounders accounted for in the analysis | Unclear risk | Some covariates analysed (see Appendix 16 and Appendix 17) |
| Statistical analysis & reporting: sufficient presentation of data to assess adequacy of the analytic strategy | Low risk | Cumulative incidence, odds ratio |
| Statistical analysis & reporting: the statistical model is adequate for the design of the study | Low risk | Multiple logistic regression |
| Name of study | None | |
| Inclusion criteria | Population based survey in Mauritius, 3 cohorts of nonpregnant participants aged 25–79 years with classifiable data from 2 separate surveys | |
| Exclusion criteria | Not reported | |
| Notes | Baseline data for cohort 1987–1998 (N = 2631), 10 years follow‐up; 3 cohorts 1987–1992 (N = 3680), 1992–1998 (N = 4178), 1987–1998 (N = 2631) | |
| Risk of bias | ||
| Bias | Authors' judgement | Support for judgement |
| Study participation: description of source population or population of interest | Low risk | Yes |
| Study participation: description of glycaemic status at baseline | Low risk | Yes |
| Study participation: adequate description of sampling frame & recruitment | Low risk | Yes |
| Study participation: adequate description of period & recruitment place | Low risk | Yes |
| Study participation: adequate description of inclusion & exclusion criteria | Unclear risk | Only inclusion criteria reported |
| Study attrition: description of attempts to collect information on participants who dropped out | Unclear risk | Scarce data |
| Study attrition: reasons for loss to follow‐up provided | Unclear risk | Scarce data |
| Study attrition: adequate description of participants lost to follow‐up | Unclear risk | Scarce data |
| Study attrition: no important differences between participants who completed the study and those who did not | Unclear risk | Not reported |
| Glycaemic status measurement: provision of clear definition or description of glycaemic status | Low risk | Yes |
| Glycaemic status measurement: valid and reliable method of glycaemic status measurement | Low risk | Yes |
| Glycaemic status measurement: continuous variables reported or appropriate cut points used | Low risk | IFG: FPG ≥ 6.1 to < 7.0 and 2‐h PG < 7.8; IGT: FPF < 7.0 and 2‐h PG ≥ 7.8 to < 11.1 |
| Glycaemic status measurement: same method and setting of measurement of the glycaemic status for all study participants | Low risk | Yes |
| Outcome measurement: clear definition of the outcome provided | Low risk | FPG ≥ 7.0; 2‐h PG ≥ 11.1 |
| Outcome measurement: method of outcome measurement used valid & reliable | Low risk | Yes |
| Outcome measurement: same method & setting of outcome measurement for all study participants | Low risk | Yes |
| Study confounding: important confounders measured | Unclear risk | Cumulative incidence, incidence rate |
| Study confounding: clear definitions of important confounders provided | Unclear risk | Cumulative incidence, incidence rate |
| Study confounding: measurement of confounders valid & reliable | Unclear risk | Cumulative incidence, incidence rate |
| Study confounding: same method & setting for measurements of confounders for all study participants | Unclear risk | Cumulative incidence, incidence rate |
| Study confounding: appropriate methods used if missing confounder data imputed | Unclear risk | Cumulative incidence, incidence rate |
| Study confounding: important potential confounders accounted for in study design | Unclear risk | Cumulative incidence, incidence rate |
| Study confounding: important potential confounders accounted for in the analysis | Unclear risk | Cumulative incidence, incidence rate |
| Statistical analysis & reporting: sufficient presentation of data to assess adequacy of the analytic strategy | Low risk | Cumulative incidence, incidence rate |
| Statistical analysis & reporting: the statistical model is adequate for the design of the study | Low risk | Calculation of incidence rate ratios, Poisson regression analysis to estimate sex effects between 1987 and 1998 allowing for adjustments |
| Name of study | None | |
| Inclusion criteria | Japanese mal workers of a railroad company receiving a health‐check at Nishimatsuzono Clinic, IFG and/or IGT cohort | |
| Exclusion criteria | People with type B or C hepatitis virus infections | |
| Notes | Baseline data for cohort becoming diabetic at follow‐up (N = 36/128);participants with IFG and/or IGT were given advice about lifestyle modifications once or twice a year | |
| Risk of bias | ||
| Bias | Authors' judgement | Support for judgement |
| Study participation: description of source population or population of interest | Low risk | Yes |
| Study participation: description of glycaemic status at baseline | Low risk | Yes |
| Study participation: adequate description of sampling frame & recruitment | Low risk | Yes |
| Study participation: adequate description of period & recruitment place | Low risk | Yes |
| Study participation: adequate description of inclusion & exclusion criteria | Low risk | Inclusion and exclusion criteria described |
| Study attrition: description of attempts to collect information on participants who dropped out | Unclear risk | Not reported |
| Study attrition: reasons for loss to follow‐up provided | Unclear risk | Not reported |
| Study attrition: adequate description of participants lost to follow‐up | Unclear risk | Not reported |
| Study attrition: no important differences between participants who completed the study and those who did not | Unclear risk | Not reported |
| Glycaemic status measurement: provision of clear definition or description of glycaemic status | Low risk | Yes |
| Glycaemic status measurement: valid and reliable method of glycaemic status measurement | Low risk | Yes |
| Glycaemic status measurement: continuous variables reported or appropriate cut points used | Low risk | IFG: FPG 6.1–6.9 and 2‐h PG < 7.8; IGT: FPG < 7.0 and 2‐h PG 7.8–11.1 |
| Glycaemic status measurement: same method and setting of measurement of the glycaemic status for all study participants | Low risk | Yes |
| Outcome measurement: clear definition of the outcome provided | Low risk | FPG ≥ 7.0; 2‐h PG > 11.1; non‐fasting PG > 11.1 |
| Outcome measurement: method of outcome measurement used valid & reliable | Low risk | Yes |
| Outcome measurement: same method & setting of outcome measurement for all study participants | Low risk | Yes |
| Study confounding: important confounders measured | Unclear risk | Cumulative incidence |
| Study confounding: clear definitions of important confounders provided | Low risk | Yes |
| Study confounding: measurement of confounders valid & reliable | Unclear risk | Yes |
| Study confounding: same method & setting for measurements of confounders for all study participants | Low risk | Yes |
| Study confounding: appropriate methods used if missing confounder data imputed | Unclear risk | Not reported |
| Study confounding: important potential confounders accounted for in study design | Unclear risk | Cumulative incidence |
| Study confounding: important potential confounders accounted for in the analysis | Unclear risk | Cumulative incidence |
| Statistical analysis & reporting: sufficient presentation of data to assess adequacy of the analytic strategy | Low risk | Cumulative incidence |
| Statistical analysis & reporting: the statistical model is adequate for the design of the study | Low risk | Cox proportional hazards model (multivariate analysis of independent risk factors and recovery factors) |
| Name of study | None | |
| Inclusion criteria | Telephone company employees in the age range 40–59 years were screened in the province of Naples for major cardiovascular risk factors | |
| Exclusion criteria | Taking antihyperglycaemic medication, previous diabetes diagnosis | |
| Notes | Baseline data for total cohort (follow‐up examination; N = 560) | |
| Risk of bias | ||
| Bias | Authors' judgement | Support for judgement |
| Study participation: description of source population or population of interest | Low risk | Yes |
| Study participation: description of glycaemic status at baseline | Low risk | Yes |
| Study participation: adequate description of sampling frame & recruitment | Low risk | Yes |
| Study participation: adequate description of period & recruitment place | Low risk | Yes |
| Study participation: adequate description of inclusion & exclusion criteria | Low risk | Inclusion and exclusion criteria described |
| Study attrition: description of attempts to collect information on participants who dropped out | Low risk | Yes |
| Study attrition: reasons for loss to follow‐up provided | Low risk | Yes |
| Study attrition: adequate description of participants lost to follow‐up | Unclear risk | Scarce data |
| Study attrition: no important differences between participants who completed the study and those who did not | Unclear risk | Those lost to follow‐up were older and more frequently women |
| Glycaemic status measurement: provision of clear definition or description of glycaemic status | Low risk | Yes |
| Glycaemic status measurement: valid and reliable method of glycaemic status measurement | Unclear risk | Unusual thresholds |
| Glycaemic status measurement: continuous variables reported or appropriate cut points used | Unclear risk | IFG: FPG 5.6–6.0; IGT: 2‐h PG 6.7–9.9 |
| Glycaemic status measurement: same method and setting of measurement of the glycaemic status for all study participants | Low risk | Yes |
| Outcome measurement: clear definition of the outcome provided | Low risk | FPG ≥ 7.0; antihyperglycaemic medication |
| Outcome measurement: method of outcome measurement used valid & reliable | Low risk | Yes |
| Outcome measurement: same method & setting of outcome measurement for all study participants | Low risk | Yes |
| Study confounding: important confounders measured | Unclear risk | Not reported |
| Study confounding: clear definitions of important confounders provided | Unclear risk | Not reported |
| Study confounding: measurement of confounders valid & reliable | Unclear risk | Not reported |
| Study confounding: same method & setting for measurements of confounders for all study participants | Unclear risk | Not reported |
| Study confounding: appropriate methods used if missing confounder data imputed | Unclear risk | Not reported |
| Study confounding: important potential confounders accounted for in study design | Unclear risk | Not reported |
| Study confounding: important potential confounders accounted for in the analysis | Unclear risk | Not reported |
| Statistical analysis & reporting: sufficient presentation of data to assess adequacy of the analytic strategy | Low risk | Cumulative incidence, odds ratio (probably unadjusted) |
| Statistical analysis & reporting: the statistical model is adequate for the design of the study | Unclear risk | Quote: "standard methods" |
| Name of study | Asturias Study (Asturias) | |
| Inclusion criteria | Survey of diabetes and cardiovascular risk factors in the principality of Asturias, northern Spain; participants from basic health area | |
| Exclusion criteria | Type 1 diabetes, pregnancy, severe disease, hospitalisation, use of diabetogenic drugs, missing data; diabetes | |
| Notes | Baseline data for IFG 5.6–6.1 (N = 114)/IFG 6.1–6.9 (N = 52) | |
| Risk of bias | ||
| Bias | Authors' judgement | Support for judgement |
| Study participation: description of source population or population of interest | Low risk | Yes |
| Study participation: description of glycaemic status at baseline | Low risk | Yes |
| Study participation: adequate description of sampling frame & recruitment | Low risk | Yes |
| Study participation: adequate description of period & recruitment place | Low risk | Yes |
| Study participation: adequate description of inclusion & exclusion criteria | Low risk | Inclusion and exclusion criteria described |
| Study attrition: description of attempts to collect information on participants who dropped out | Low risk | Yes |
| Study attrition: reasons for loss to follow‐up provided | Low risk | Yes |
| Study attrition: adequate description of participants lost to follow‐up | Unclear risk | Scarce data |
| Study attrition: no important differences between participants who completed the study and those who did not | Unclear risk | Not reported |
| Glycaemic status measurement: provision of clear definition or description of glycaemic status | Low risk | Yes |
| Glycaemic status measurement: valid and reliable method of glycaemic status measurement | Low risk | Yes |
| Glycaemic status measurement: continuous variables reported or appropriate cut points used | Low risk | IFG5.6: 5.6–6.1; IFG6.1: 6.1–6.9 |
| Glycaemic status measurement: same method and setting of measurement of the glycaemic status for all study participants | Low risk | Yes |
| Outcome measurement: clear definition of the outcome provided | Low risk | FPG ≥ 7.0; 2‐h PG ≥ 11.1; clinical diabetes diagnosis; antihyperglycaemic medication, diet |
| Outcome measurement: method of outcome measurement used valid & reliable | Low risk | Yes |
| Outcome measurement: same method & setting of outcome measurement for all study participants | Low risk | Yes |
| Study confounding: important confounders measured | Unclear risk | Some covariates measured (see Appendix 16 and Appendix 17) |
| Study confounding: clear definitions of important confounders provided | Low risk | Yes |
| Study confounding: measurement of confounders valid & reliable | Low risk | Yes |
| Study confounding: same method & setting for measurements of confounders for all study participants | Low risk | Yes |
| Study confounding: appropriate methods used if missing confounder data imputed | Unclear risk | Not reported |
| Study confounding: important potential confounders accounted for in study design | Unclear risk | Some covariates included (see Appendix 16 and Appendix 17) |
| Study confounding: important potential confounders accounted for in the analysis | Unclear risk | Some covariates analysed (see Appendix 16 and Appendix 17) |
| Statistical analysis & reporting: sufficient presentation of data to assess adequacy of the analytic strategy | Low risk | Cumulative incidence, incidence rate, odds ratio |
| Statistical analysis & reporting: the statistical model is adequate for the design of the study | Low risk | Multivariate logistic regression |
| Name of study | None | |
| Inclusion criteria | Participants were 10–19 years of age at first examination without diabetes, and at least 1 follow‐up examination before the 40th birthday | |
| Exclusion criteria | History of possibly taking metformin at baseline | |
| Notes | Baseline data for adults (A)/children (C ) with HbA1c 5.7–6.4 (children: N = 62, adults: N = 168) | |
| Risk of bias | ||
| Bias | Authors' judgement | Support for judgement |
| Study participation: description of source population or population of interest | Low risk | Yes |
| Study participation: description of glycaemic status at baseline | Low risk | Yes |
| Study participation: adequate description of sampling frame & recruitment | Low risk | Yes |
| Study participation: adequate description of period & recruitment place | Low risk | Yes |
| Study participation: adequate description of inclusion & exclusion criteria | Low risk | Inclusion and exclusion criteria described |
| Study attrition: description of attempts to collect information on participants who dropped out | Unclear risk | Not reported |
| Study attrition: reasons for loss to follow‐up provided | Unclear risk | Not reported |
| Study attrition: adequate description of participants lost to follow‐up | Unclear risk | Not reported |
| Study attrition: no important differences between participants who completed the study and those who did not | Unclear risk | Not reported |
| Glycaemic status measurement: provision of clear definition or description of glycaemic status | Low risk | Yes |
| Glycaemic status measurement: valid and reliable method of glycaemic status measurement | Low risk | Yes |
| Glycaemic status measurement: continuous variables reported or appropriate cut points used | Low risk | FPG 5.6–6.9; 2‐h PG 7.8–11.9; HbA1c 5.7–6.4 |
| Glycaemic status measurement: same method and setting of measurement of the glycaemic status for all study participants | Low risk | Yes |
| Outcome measurement: clear definition of the outcome provided | Low risk | FPG ≥ 7.0; 2‐h PG ≥ 11.1; previous clinical diagnosis |
| Outcome measurement: method of outcome measurement used valid & reliable | Low risk | Yes |
| Outcome measurement: same method & setting of outcome measurement for all study participants | Low risk | Yes |
| Study confounding: important confounders measured | Unclear risk | Cumulative incidence, incidence rate |
| Study confounding: clear definitions of important confounders provided | Unclear risk | Cumulative incidence, incidence rate |
| Study confounding: measurement of confounders valid & reliable | Unclear risk | Cumulative incidence, incidence rate |
| Study confounding: same method & setting for measurements of confounders for all study participants | Unclear risk | Cumulative incidence, incidence rate |
| Study confounding: appropriate methods used if missing confounder data imputed | Unclear risk | Cumulative incidence, incidence rate |
| Study confounding: important potential confounders accounted for in study design | Unclear risk | Cumulative incidence, incidence rate |
| Study confounding: important potential confounders accounted for in the analysis | Unclear risk | Cumulative incidence, incidence rate |
| Statistical analysis & reporting: sufficient presentation of data to assess adequacy of the analytic strategy | Low risk | Cumulative incidence, incidence rate |
| Statistical analysis & reporting: the statistical model is adequate for the design of the study | Low risk | ROC curves, increments in HbA1c and FPG or 2‐h PG to calculate 10‐year cumulative incidence |
| Name of study | None | |
| Inclusion criteria | Programme on primary prevention of diabetes in the population and in high risk people (positive family history of diabetes); individuals with at least 2 follow‐up visits; participants were given advice on preventive measures such as dietary modifications and regular exercise | |
| Exclusion criteria | Known history of diabetes, newly diagnosed diabetes during screening | |
| Notes | Baseline data for IGT group (N = 619); participants were given advice on preventive measures such as dietary modifications and regular exercise | |
| Risk of bias | ||
| Bias | Authors' judgement | Support for judgement |
| Study participation: description of source population or population of interest | Low risk | Yes |
| Study participation: description of glycaemic status at baseline | Low risk | Yes |
| Study participation: adequate description of sampling frame & recruitment | Unclear risk | Scarce data |
| Study participation: adequate description of period & recruitment place | Unclear risk | Scarce data |
| Study participation: adequate description of inclusion & exclusion criteria | Low risk | Inclusion and exclusion criteria described |
| Study attrition: description of attempts to collect information on participants who dropped out | Unclear risk | Not reported |
| Study attrition: reasons for loss to follow‐up provided | Unclear risk | Not reported |
| Study attrition: adequate description of participants lost to follow‐up | Unclear risk | Not reported |
| Study attrition: no important differences between participants who completed the study and those who did not | Unclear risk | Not reported |
| Glycaemic status measurement: provision of clear definition or description of glycaemic status | Low risk | Yes |
| Glycaemic status measurement: valid and reliable method of glycaemic status measurement | Low risk | Yes |
| Glycaemic status measurement: continuous variables reported or appropriate cut points used | Low risk | IGT: 2‐h PG 7.8 to < 11.1 |
| Glycaemic status measurement: same method and setting of measurement of the glycaemic status for all study participants | Low risk | Yes |
| Outcome measurement: clear definition of the outcome provided | Unclear risk | Not defined, presumably by OGTT |
| Outcome measurement: method of outcome measurement used valid & reliable | Unclear risk | Scarce data |
| Outcome measurement: same method & setting of outcome measurement for all study participants | Unclear risk | Scarce data |
| Study confounding: important confounders measured | Unclear risk | Some covariates measured (see Appendix 16 and Appendix 17) |
| Study confounding: clear definitions of important confounders provided | Unclear risk | Not reported |
| Study confounding: measurement of confounders valid & reliable | Unclear risk | Not reported |
| Study confounding: same method & setting for measurements of confounders for all study participants | Low risk | Yes |
| Study confounding: appropriate methods used if missing confounder data imputed | Unclear risk | Not reported |
| Study confounding: important potential confounders accounted for in study design | Unclear risk | Some covariates included (see Appendix 16 and Appendix 17) |
| Study confounding: important potential confounders accounted for in the analysis | Unclear risk | Some covariates analysed (see Appendix 16 and Appendix 17) |
| Statistical analysis & reporting: sufficient presentation of data to assess adequacy of the analytic strategy | Low risk | Cumulative incidence, odds ratio |
| Statistical analysis & reporting: the statistical model is adequate for the design of the study | Low risk | Multiple logistic regression, Cox regression analysis |
| Name of study | Beijing Project as part of the National Diabetes Survey | |
| Inclusion criteria | Inhabitants of Beijing aged 25 years or older | |
| Exclusion criteria | Newly diagnosed diabetes or CHD at baseline, known diabetes | |
| Notes | Baseline data for cohort with incident diabetes and no CHD (N = 67) | |
| Risk of bias | ||
| Bias | Authors' judgement | Support for judgement |
| Study participation: description of source population or population of interest | Low risk | Yes |
| Study participation: description of glycaemic status at baseline | Low risk | Yes |
| Study participation: adequate description of sampling frame & recruitment | Low risk | Yes |
| Study participation: adequate description of period & recruitment place | Low risk | Yes |
| Study participation: adequate description of inclusion & exclusion criteria | Low risk | Inclusion and exclusion criteria described |
| Study attrition: description of attempts to collect information on participants who dropped out | Low risk | Yes |
| Study attrition: reasons for loss to follow‐up provided | Low risk | Yes |
| Study attrition: adequate description of participants lost to follow‐up | Low risk | Yes |
| Study attrition: no important differences between participants who completed the study and those who did not | Low risk | Yes |
| Glycaemic status measurement: provision of clear definition or description of glycaemic status | Low risk | Yes |
| Glycaemic status measurement: valid and reliable method of glycaemic status measurement | Low risk | Yes |
| Glycaemic status measurement: continuous variables reported or appropriate cut points used | Low risk | IFG: FPG 6.1–6.9; IGT: 2‐h PG 7.8–11.0 |
| Glycaemic status measurement: same method and setting of measurement of the glycaemic status for all study participants | Low risk | Yes |
| Outcome measurement: clear definition of the outcome provided | Low risk | FPG ≥ 7.0; 2‐h PG ≥ 11.1 |
| Outcome measurement: method of outcome measurement used valid & reliable | Low risk | Yes |
| Outcome measurement: same method & setting of outcome measurement for all study participants | Low risk | Yes |
| Study confounding: important confounders measured | Unclear risk | Some covariates measured (see Appendix 16 and Appendix 17) |
| Study confounding: clear definitions of important confounders provided | Low risk | Yes |
| Study confounding: measurement of confounders valid & reliable | Low risk | Yes |
| Study confounding: same method & setting for measurements of confounders for all study participants | Low risk | Yes |
| Study confounding: appropriate methods used if missing confounder data imputed | Unclear risk | Not reported |
| Study confounding: important potential confounders accounted for in study design | Unclear risk | Some covariates included (see Appendix 16 and Appendix 17) |
| Study confounding: important potential confounders accounted for in the analysis | Unclear risk | Some covariates analysed (see Appendix 16 and Appendix 17) |
| Statistical analysis & reporting: sufficient presentation of data to assess adequacy of the analytic strategy | Low risk | Cumulative incidence, risk ratio |
| Statistical analysis & reporting: the statistical model is adequate for the design of the study | Low risk | Multiple logistic regression |
| Name of study | Strong Heart Study (SHS) | |
| Inclusion criteria | Data collected from American Indians at the baseline and second exams from those participants who had HbA1c and FPG measured | |
| Exclusion criteria | Antihyperglycaemic medications, renal dialysis, kidney transplant | |
| Notes | No baseline data reported | |
| Risk of bias | ||
| Bias | Authors' judgement | Support for judgement |
| Study participation: description of source population or population of interest | Low risk | Yes |
| Study participation: description of glycaemic status at baseline | Low risk | Yes |
| Study participation: adequate description of sampling frame & recruitment | Low risk | Yes |
| Study participation: adequate description of period & recruitment place | Low risk | Yes |
| Study participation: adequate description of inclusion & exclusion criteria | Low risk | Inclusion and exclusion criteria described |
| Study attrition: description of attempts to collect information on participants who dropped out | Low risk | Yes |
| Study attrition: reasons for loss to follow‐up provided | Unclear risk | Scarce data |
| Study attrition: adequate description of participants lost to follow‐up | Unclear risk | Scarce data |
| Study attrition: no important differences between participants who completed the study and those who did not | Unclear risk | Those lost to follow‐up had lower BMI |
| Glycaemic status measurement: provision of clear definition or description of glycaemic status | Low risk | Yes |
| Glycaemic status measurement: valid and reliable method of glycaemic status measurement | Low risk | Yes |
| Glycaemic status measurement: continuous variables reported or appropriate cut points used | Low risk | IFG: 5.6 to < 7.0; HbA1c 6.0 to < 6.5 |
| Glycaemic status measurement: same method and setting of measurement of the glycaemic status for all study participants | Low risk | Yes |
| Outcome measurement: clear definition of the outcome provided | Low risk | FPG ≥ 7.0; HbA1c ≥ 6.5; FPG/HbA1c: ≥ 6.5 or FPG ≥ 7.0; antihyperglycaemic medication |
| Outcome measurement: method of outcome measurement used valid & reliable | Low risk | Yes |
| Outcome measurement: same method & setting of outcome measurement for all study participants | Low risk | Yes |
| Study confounding: important confounders measured | Unclear risk | Some covariates measured (see Appendix 16 and Appendix 17) |
| Study confounding: clear definitions of important confounders provided | Low risk | Yes |
| Study confounding: measurement of confounders valid & reliable | Low risk | Yes |
| Study confounding: same method & setting for measurements of confounders for all study participants | Low risk | Yes |
| Study confounding: appropriate methods used if missing confounder data imputed | Unclear risk | Not reported |
| Study confounding: important potential confounders accounted for in study design | Unclear risk | Some covariates included (see Appendix 16 and Appendix 17) |
| Study confounding: important potential confounders accounted for in the analysis | Unclear risk | Some covariates analysed (see Appendix 16 and Appendix 17) |
| Statistical analysis & reporting: sufficient presentation of data to assess adequacy of the analytic strategy | Low risk | Odds ratio |
| Statistical analysis & reporting: the statistical model is adequate for the design of the study | Low risk | Logistic regression |
| Name of study | Atherosclerosis Risk in Communities study (ARIC) | |
| Inclusion criteria | Adults aged 45–64 years from the communities of Jackson, MS; Forsyth County, NC; suburban Minneapolis, MN; and Washington County, MD, USA | |
| Exclusion criteria | Participants with prevalent diabetes, chronic kidney disease, atherosclerotic cardiovascular disease, or peripheral arterial disease, those who were missing variables of interest, or those who fasted for < 10 h | |
| Notes | 2 different baseline cohorts; 4 prediabetes definitions (visit 2: IFG 5.6–6.9: N = 4112; HbA1c 5.7–6.4: N = 2027; visit 4: IFG 5.6–6.9: N = 2142; IGT: N = 2009) | |
| Risk of bias | ||
| Bias | Authors' judgement | Support for judgement |
| Study participation: description of source population or population of interest | Low risk | Yes |
| Study participation: description of glycaemic status at baseline | Low risk | Yes |
| Study participation: adequate description of sampling frame & recruitment | Low risk | Yes |
| Study participation: adequate description of period & recruitment place | Low risk | Yes |
| Study participation: adequate description of inclusion & exclusion criteria | Low risk | Inclusion and exclusion criteria described |
| Study attrition: description of attempts to collect information on participants who dropped out | Low risk | Yes |
| Study attrition: reasons for loss to follow‐up provided | Unclear risk | Scarce data |
| Study attrition: adequate description of participants lost to follow‐up | Unclear risk | Scarce data |
| Study attrition: no important differences between participants who completed the study and those who did not | Unclear risk | Not reported |
| Glycaemic status measurement: provision of clear definition or description of glycaemic status | Low risk | Yes |
| Glycaemic status measurement: valid and reliable method of glycaemic status measurement | Low risk | Yes |
| Glycaemic status measurement: continuous variables reported or appropriate cut points used | Low risk | FPG 5.6–6.9 (ADA); FG 6.1–6.9 (WHO); 2‐h 7.8–11.0 (ADA); HbA1c 5.7–6.4 (ADA); 6.0–6.4 (IEC) |
| Glycaemic status measurement: same method and setting of measurement of the glycaemic status for all study participants | Low risk | Yes |
| Outcome measurement: clear definition of the outcome provided | Unclear risk | Self‐report of physician diagnosis; antihyperglycaemic medication reported during a study visit or annual telephone call |
| Outcome measurement: method of outcome measurement used valid & reliable | Unclear risk | Missing lab measurements |
| Outcome measurement: same method & setting of outcome measurement for all study participants | Low risk | Yes |
| Study confounding: important confounders measured | Unclear risk | Some covariates measured (see Appendix 16 and Appendix 17) |
| Study confounding: clear definitions of important confounders provided | Low risk | Yes |
| Study confounding: measurement of confounders valid & reliable | Low risk | Yes |
| Study confounding: same method & setting for measurements of confounders for all study participants | Low risk | Yes |
| Study confounding: appropriate methods used if missing confounder data imputed | Unclear risk | Not reported |
| Study confounding: important potential confounders accounted for in study design | Unclear risk | Some covariates included (see Appendix 16 and Appendix 17) |
| Study confounding: important potential confounders accounted for in the analysis | Low risk | Some covariates analysed (see Appendix 16 and Appendix 17) |
| Statistical analysis & reporting: sufficient presentation of data to assess adequacy of the analytic strategy | Low risk | Hazard ratio |
| Statistical analysis & reporting: the statistical model is adequate for the design of the study | Low risk | Cox proportional hazards models |
| Name of study | Hong Kong Cardiovascular Risk Factor Prevalence Study | |
| Inclusion criteria | Follow‐up of the Hong Kong Cardiovascular Risk Factor Prevalence Study in Hong Kong Chinese aged 25–74 years; persons with IGT (matched controls from the same population with normal glucose tolerance), investigation of the development of appropriate population‐wide coronary heart disease prevention strategies and monitoring their long‐term impact | |
| Exclusion criteria | Diabetes at baseline | |
| Notes | Baseline data for IGT cohort (N = 322) | |
| Risk of bias | ||
| Bias | Authors' judgement | Support for judgement |
| Study participation: description of source population or population of interest | Low risk | Yes |
| Study participation: description of glycaemic status at baseline | Low risk | Yes |
| Study participation: adequate description of sampling frame & recruitment | Low risk | Yes |
| Study participation: adequate description of period & recruitment place | Low risk | Yes |
| Study participation: adequate description of inclusion & exclusion criteria | Low risk | Inclusion and exclusion criteria described |
| Study attrition: description of attempts to collect information on participants who dropped out | Unclear risk | Scarce data |
| Study attrition: reasons for loss to follow‐up provided | Unclear risk | Scarce data |
| Study attrition: adequate description of participants lost to follow‐up | Unclear risk | Not reported |
| Study attrition: no important differences between participants who completed the study and those who did not | Unclear risk | Not reported |
| Glycaemic status measurement: provision of clear definition or description of glycaemic status | Low risk | Yes |
| Glycaemic status measurement: valid and reliable method of glycaemic status measurement | Low risk | Yes |
| Glycaemic status measurement: continuous variables reported or appropriate cut points used | Low risk | IGT: FPG < 7.8 and 2‐h PG 7.8 to < 11.1 |
| Glycaemic status measurement: same method and setting of measurement of the glycaemic status for all study participants | Low risk | Yes |
| Outcome measurement: clear definition of the outcome provided | Low risk | FPG ≥ 7.8; 2‐h PG ≥ 11.1 |
| Outcome measurement: method of outcome measurement used valid & reliable | Low risk | Yes |
| Outcome measurement: same method & setting of outcome measurement for all study participants | Low risk | Yes |
| Study confounding: important confounders measured | Unclear risk | Cumulative incidence |
| Study confounding: clear definitions of important confounders provided | Low risk | Yes |
| Study confounding: measurement of confounders valid & reliable | Low risk | Yes |
| Study confounding: same method & setting for measurements of confounders for all study participants | Low risk | Yes |
| Study confounding: appropriate methods used if missing confounder data imputed | Unclear risk | Not reported |
| Study confounding: important potential confounders accounted for in study design | Unclear risk | Cumulative incidence |
| Study confounding: important potential confounders accounted for in the analysis | Unclear risk | Cumulative incidence |
| Statistical analysis & reporting: sufficient presentation of data to assess adequacy of the analytic strategy | Low risk | Cumulative incidence |
| Statistical analysis & reporting: the statistical model is adequate for the design of the study | Low risk | Logistic regression (per unit increase for some covariates) |
| Name of study | None | |
| Inclusion criteria | Obese children and adolescents aged 4–18 years were recruited from the Yale Pediatric Obesity Clinic (New Haven, Conneticut, USA) | |
| Exclusion criteria | Participants with medical conditions, using medications that may affect glucose metabolism before their first OGTT | |
| Notes | Baseline data for IGT cohort (N = 33) | |
| Risk of bias | ||
| Bias | Authors' judgement | Support for judgement |
| Study participation: description of source population or population of interest | Unclear risk | Yes |
| Study participation: description of glycaemic status at baseline | Low risk | Yes |
| Study participation: adequate description of sampling frame & recruitment | Unclear risk | Scarce data |
| Study participation: adequate description of period & recruitment place | Unclear risk | Scarce data |
| Study participation: adequate description of inclusion & exclusion criteria | Low risk | Inclusion and exclusion criteria reported |
| Study attrition: description of attempts to collect information on participants who dropped out | Low risk | No dropouts |
| Study attrition: reasons for loss to follow‐up provided | Low risk | No dropouts |
| Study attrition: adequate description of participants lost to follow‐up | Low risk | No dropouts |
| Study attrition: no important differences between participants who completed the study and those who did not | Low risk | No dropouts |
| Glycaemic status measurement: provision of clear definition or description of glycaemic status | Low risk | Yes |
| Glycaemic status measurement: valid and reliable method of glycaemic status measurement | Low risk | Yes |
| Glycaemic status measurement: continuous variables reported or appropriate cut points used | Low risk | IGT: FPG < 5.6 and 2‐h PG 7.8–11.1 |
| Glycaemic status measurement: same method and setting of measurement of the glycaemic status for all study participants | Low risk | Yes |
| Outcome measurement: clear definition of the outcome provided | Low risk | FPG ≥ 7.0; 2‐h PG > 11.1; presentation of hyperglycaemia (more than 2 random glucose measurements > 11.1), glucosuria, polydipsia, and polyuria |
| Outcome measurement: method of outcome measurement used valid & reliable | Low risk | Yes |
| Outcome measurement: same method & setting of outcome measurement for all study participants | Low risk | Yes |
| Study confounding: important confounders measured | Unclear risk | Cumulative incidence |
| Study confounding: clear definitions of important confounders provided | Unclear risk | Cumulative incidence |
| Study confounding: measurement of confounders valid & reliable | Unclear risk | Cumulative incidence |
| Study confounding: same method & setting for measurements of confounders for all study participants | Unclear risk | Cumulative incidence |
| Study confounding: appropriate methods used if missing confounder data imputed | Unclear risk | Not reported |
| Study confounding: important potential confounders accounted for in study design | Unclear risk | Cumulative incidence |
| Study confounding: important potential confounders accounted for in the analysis | Unclear risk | Cumulative incidence |
| Statistical analysis & reporting: sufficient presentation of data to assess adequacy of the analytic strategy | Low risk | Cumulative incidence |
| Statistical analysis & reporting: the statistical model is adequate for the design of the study | Low risk | Mann‐Whitney U test and linear regression (to identify predictors of 2‐h glucose on the second OGTT) |
| Name of study | Pima Indian Study (Gila River Indian Community ‐ near Phoenix, Arizona) | |
| Inclusion criteria | Gila River Indian Community in Arizona (mostly Pima or Tohono Indians); children and adolescents 5–19 years who were nondiabetic at baseline and had at least 1 follow‐up examination | |
| Exclusion criteria | Not reported | |
| Notes | Baseline data for the full cohort (N = 5532); prediabetic cohort = non‐overweight (N = 37) + IGT group and overweight + IGT group (N = 132); 5–11 years/12–19 years); age‐stratified incidence data on overweight participants + IGT or overweight and either hypertension or hypercholesterolaemia + IGT (metabolic set (MSet)) | |
| Risk of bias | ||
| Bias | Authors' judgement | Support for judgement |
| Study participation: description of source population or population of interest | Low risk | Yes |
| Study participation: description of glycaemic status at baseline | Low risk | Yes |
| Study participation: adequate description of sampling frame & recruitment | Low risk | Yes |
| Study participation: adequate description of period & recruitment place | Low risk | Yes |
| Study participation: adequate description of inclusion & exclusion criteria | Unclear risk | Only inclusion criteria described |
| Study attrition: description of attempts to collect information on participants who dropped out | Unclear risk | Scarce data |
| Study attrition: reasons for loss to follow‐up provided | Unclear risk | Scarce data |
| Study attrition: adequate description of participants lost to follow‐up | Unclear risk | Scarce data |
| Study attrition: no important differences between participants who completed the study and those who did not | Unclear risk | Not reported |
| Glycaemic status measurement: provision of clear definition or description of glycaemic status | Low risk | Yes |
| Glycaemic status measurement: valid and reliable method of glycaemic status measurement | Low risk | Yes |
| Glycaemic status measurement: continuous variables reported or appropriate cut points used | Low risk | IGT: 2‐h PG ≥ 7.8 to < 11.1 |
| Glycaemic status measurement: same method and setting of measurement of the glycaemic status for all study participants | Low risk | Yes |
| Outcome measurement: clear definition of the outcome provided | Low risk | FPG ≥ 7.0; 2‐h PG ≥ 11.1; previous diagnosis |
| Outcome measurement: method of outcome measurement used valid & reliable | Low risk | Yes |
| Outcome measurement: same method & setting of outcome measurement for all study participants | Low risk | Yes |
| Study confounding: important confounders measured | Unclear risk | Cumulative incidence |
| Study confounding: clear definitions of important confounders provided | Low risk | Yes |
| Study confounding: measurement of confounders valid & reliable | Low risk | Yes |
| Study confounding: same method & setting for measurements of confounders for all study participants | Low risk | Yes |
| Study confounding: appropriate methods used if missing confounder data imputed | Unclear risk | Not reported |
| Study confounding: important potential confounders accounted for in study design | Unclear risk | Cumulative incidence |
| Study confounding: important potential confounders accounted for in the analysis | Unclear risk | Cumulative incidence |
| Statistical analysis & reporting: sufficient presentation of data to assess adequacy of the analytic strategy | Low risk | Cumulative incidence |
| Statistical analysis & reporting: the statistical model is adequate for the design of the study | Low risk | Cox regression model using each metabolic risk factor as a continuous variable; violation of the proportionality assumption was noted, therefore cumulative incidence rates were calculated from a Poisson regression model |
| Name of study | Singapore Impaired Glucose Tolerance Follow‐up Study | |
| Inclusion criteria | Representative sample of the Singapore population aged 18–69 years; persons with IGT and matched controls | |
| Exclusion criteria | Antihyperglycaemic medication, venepuncture failure; persons with IFG | |
| Notes | Baseline data for IGT group (N = 291) | |
| Risk of bias | ||
| Bias | Authors' judgement | Support for judgement |
| Study participation: description of source population or population of interest | Low risk | Yes |
| Study participation: description of glycaemic status at baseline | Low risk | Yes |
| Study participation: adequate description of sampling frame & recruitment | Low risk | Yes |
| Study participation: adequate description of period & recruitment place | Low risk | Yes |
| Study participation: adequate description of inclusion & exclusion criteria | Low risk | Inclusion and exclusion criteria described |
| Study attrition: description of attempts to collect information on participants who dropped out | Low risk | Yes |
| Study attrition: reasons for loss to follow‐up provided | Unclear risk | Scarce data |
| Study attrition: adequate description of participants lost to follow‐up | Unclear risk | Scarce data |
| Study attrition: no important differences between participants who completed the study and those who did not | Unclear risk | Scarce data |
| Glycaemic status measurement: provision of clear definition or description of glycaemic status | Low risk | Yes |
| Glycaemic status measurement: valid and reliable method of glycaemic status measurement | Low risk | Yes |
| Glycaemic status measurement: continuous variables reported or appropriate cut points used | Low risk | IGT: 2‐h PG ≥ 7.8 to < 11.1 |
| Glycaemic status measurement: same method and setting of measurement of the glycaemic status for all study participants | Low risk | Yes |
| Outcome measurement: clear definition of the outcome provided | Low risk | FPG ≥ 7.0; 2‐h PG ≥ 11.1; physician diagnosed diabetes |
| Outcome measurement: method of outcome measurement used valid & reliable | Low risk | Yes |
| Outcome measurement: same method & setting of outcome measurement for all study participants | Low risk | Yes |
| Study confounding: important confounders measured | Unclear risk | Cumulative incidence |
| Study confounding: clear definitions of important confounders provided | Unclear risk | Cumulative incidence |
| Study confounding: measurement of confounders valid & reliable | Unclear risk | Cumulative incidence |
| Study confounding: same method & setting for measurements of confounders for all study participants | Unclear risk | Cumulative incidence |
| Study confounding: appropriate methods used if missing confounder data imputed | Unclear risk | Cumulative incidence |
| Study confounding: important potential confounders accounted for in study design | Unclear risk | Cumulative incidence |
| Study confounding: important potential confounders accounted for in the analysis | Unclear risk | Not reported |
| Statistical analysis & reporting: sufficient presentation of data to assess adequacy of the analytic strategy | Low risk | Cumulative incidence |
| Statistical analysis & reporting: the statistical model is adequate for the design of the study | Low risk | ANCOVA using general linear models (comparisons between continuous variables) |
| Name of study | Multi‐Ethnic Study of Atherosclerosis (MESA) | |
| Inclusion criteria | Persons without known CVD at baseline from 6 US communities aged 45–84 years | |
| Exclusion criteria | Persons with a history of physician‐diagnosed myocardial infarction, angina, heart failure, stroke, or transient ischaemic attack, or who had undergone an invasive procedure for CVD (coronary artery bypass graft surgery, angioplasty, valve replacement, pacemaker placement, or other vascular surgeries) | |
| Notes | Baseline data for IFG cohort (N = 940) | |
| Risk of bias | ||
| Bias | Authors' judgement | Support for judgement |
| Study participation: description of source population or population of interest | Low risk | Yes |
| Study participation: description of glycaemic status at baseline | Low risk | Yes |
| Study participation: adequate description of sampling frame & recruitment | Low risk | Yes |
| Study participation: adequate description of period & recruitment place | Low risk | Yes |
| Study participation: adequate description of inclusion & exclusion criteria | Low risk | Inclusion and exclusion criteria described |
| Study attrition: description of attempts to collect information on participants who dropped out | Low risk | Yes |
| Study attrition: reasons for loss to follow‐up provided | Low risk | Yes |
| Study attrition: adequate description of participants lost to follow‐up | Unclear risk | Scarce data |
| Study attrition: no important differences between participants who completed the study and those who did not | Unclear risk | Scarce data |
| Glycaemic status measurement: provision of clear definition or description of glycaemic status | Low risk | Yes |
| Glycaemic status measurement: valid and reliable method of glycaemic status measurement | Low risk | Yes |
| Glycaemic status measurement: continuous variables reported or appropriate cut points used | Low risk | IFG: FPG 5.6–6.9 |
| Glycaemic status measurement: same method and setting of measurement of the glycaemic status for all study participants | Low risk | Yes |
| Outcome measurement: clear definition of the outcome provided | Low risk | FPG > 6.9; antihyperglycaemic medication during examinations 2,3,4 |
| Outcome measurement: method of outcome measurement used valid & reliable | Low risk | Yes |
| Outcome measurement: same method & setting of outcome measurement for all study participants | Low risk | Yes |
| Study confounding: important confounders measured | Low risk | Yes |
| Study confounding: clear definitions of important confounders provided | Low risk | Yes |
| Study confounding: measurement of confounders valid & reliable | Low risk | Yes |
| Study confounding: same method & setting for measurements of confounders for all study participants | Low risk | Yes |
| Study confounding: appropriate methods used if missing confounder data imputed | Unclear risk | Not reported |
| Study confounding: important potential confounders accounted for in study design | Low risk | Yes |
| Study confounding: important potential confounders accounted for in the analysis | Low risk | Yes |
| Statistical analysis & reporting: sufficient presentation of data to assess adequacy of the analytic strategy | Low risk | Cumulative incidence, hazard ratio |
| Statistical analysis & reporting: the statistical model is adequate for the design of the study | Low risk | Cox proportional hazards model |
| Name of study | None | |
| Inclusion criteria | All men residing in Uppsala were invited to a health survey in 1970; reinvestigation 20 years later (= baseline) at 70 years of age | |
| Exclusion criteria | Diabetes, antihyperglycaemic medications | |
| Notes | Baseline data for cohort converting to T2DM (N = 26) | |
| Risk of bias | ||
| Bias | Authors' judgement | Support for judgement |
| Study participation: description of source population or population of interest | Low risk | Yes |
| Study participation: description of glycaemic status at baseline | Low risk | Yes |
| Study participation: adequate description of sampling frame & recruitment | Low risk | Yes |
| Study participation: adequate description of period & recruitment place | Low risk | Yes |
| Study participation: adequate description of inclusion & exclusion criteria | Low risk | Inclusion and exclusion criteria described |
| Study attrition: description of attempts to collect information on participants who dropped out | Unclear risk | Not reported |
| Study attrition: reasons for loss to follow‐up provided | Unclear risk | Not reported |
| Study attrition: adequate description of participants lost to follow‐up | Unclear risk | Not reported |
| Study attrition: no important differences between participants who completed the study and those who did not | Unclear risk | Not reported |
| Glycaemic status measurement: provision of clear definition or description of glycaemic status | Low risk | Yes |
| Glycaemic status measurement: valid and reliable method of glycaemic status measurement | Low risk | Yes |
| Glycaemic status measurement: continuous variables reported or appropriate cut points used | Low risk | IGT: 2‐h PG 7.8 to < 11.1 |
| Glycaemic status measurement: same method and setting of measurement of the glycaemic status for all study participants | Unclear risk | Yes |
| Outcome measurement: clear definition of the outcome provided | Low risk | FPG ≥ 7.0; antihyperglycaemic medications |
| Outcome measurement: method of outcome measurement used valid & reliable | Low risk | Yes |
| Outcome measurement: same method & setting of outcome measurement for all study participants | Low risk | Yes |
| Study confounding: important confounders measured | Unclear risk | Some covariates measured (see Appendix 16 and Appendix 17) |
| Study confounding: clear definitions of important confounders provided | Low risk | Yes |
| Study confounding: measurement of confounders valid & reliable | Low risk | Yes |
| Study confounding: same method & setting for measurements of confounders for all study participants | Low risk | Yes |
| Study confounding: appropriate methods used if missing confounder data imputed | Unclear risk | Not reported |
| Study confounding: important potential confounders accounted for in study design | Unclear risk | Some covariates included (see Appendix 16 and Appendix 17) |
| Study confounding: important potential confounders accounted for in the analysis | Unclear risk | Some covariates analysed (see Appendix 16 and Appendix 17) |
| Statistical analysis & reporting: sufficient presentation of data to assess adequacy of the analytic strategy | Low risk | Odds ratio |
| Statistical analysis & reporting: the statistical model is adequate for the design of the study | Low risk | Logistic regression, multivariate models (adjusted for BMI, age at baseline and length of follow‐up) |
Note: for better readability all IFG/IGT and HbA1c measurements are reported in numerical format only (IFG and IGT were measured in mmol/L, HbA1c was measured in %)
ADA: American Diabetes Association; ANOVA: analysis of variance; BG: blood glucose; BMI: body mass index; CHD: coronary heart disease; CI: confidence interval; CVD: cardiovascular disease; FG: fasting glucose; FBG: fasting blood glucose; FINDRISC: Finnish Diabetes Risk Score; FPG: fasting plasma glucose; G6PD: glucose‐6‐P‐dehydrogenase test; HbA1c: glycosylated haemoglobin A1c; HbA1c5.7 : intermediate hyperglycaemia with HbA1c 5.7% as lower threshold (usually reflecting 5.7%–6.4%); HbA1c6.0 : intermediate hyperglycaemia with HbA1c 6.0% as lower threshold (usually reflecting 6.0%–6.4%); HOMA‐B: homeostatic model assessment beta‐cell function; HOMA‐IR: homeostatic model assessment for insulin resistance; HR: hazard ratio; IEC: International Expert Committee; IFG: impaired fasting glucose; IFG5.6 : impaired fasting glucose with 5.6 mmol/L as lower threshold; IFG6.1 : impaired fasting glucose with 6.1 mmol/L as lower threshold; IFG/IGT: both IFG and IGT; i‐IFG: isolated IFG; IGT: impaired glucose tolerance; i‐IGT: isolated IGT; JDS: Japanese Diabetes Society; MSet: metabolic set; NDDG: National Diabetes Data Group; NGSP: National Glycohemoglobin Standardization Program; NGT: normal glucose tolerance; OGTT: oral glucose tolerance test; OR: odds ratio; PG: postload glucose; ROC: receiver operating characteristics; RR: risk ratio, relative risk; T2DM: type 2 diabetes mellitus; WHO: World Health Organization.
Characteristics of excluded studies [ordered by study ID]
| Study | Reason for exclusion |
| No data on transition from intermediate hyperglycaemia to type 2 diabetes | |
| Intervention study | |
| No data on transition from intermediate hyperglycaemia to type 2 diabetes | |
| Not a prospective cohort study | |
| No data on transition from intermediate hyperglycaemia to type 2 diabetes (prevalence data) | |
| Only self‐reported diabetes, frequency matched population | |
| Non‐standard thresholds for intermediate hyperglycaemia | |
| No data on transition from intermediate hyperglycaemia to type 2 diabetes | |
| Long‐term follow‐up of an interventional study | |
| Hypertensive cohort | |
| No data on transition from intermediate hyperglycaemia to type 2 diabetes | |
| No data on transition from intermediate hyperglycaemia to type 2 diabetes | |
| Retrospective cohort study | |
| No data on transition from intermediate hyperglycaemia to type 2 diabetes | |
| No cohort with intermediate hyperglycaemia | |
| Intervention trial | |
| Investigation of the association between thyroid function and the development of intermediate hyperglycaemia/diabetes | |
| No data on transition from intermediate hyperglycaemia to type 2 diabetes | |
| Not a prospective cohort study | |
| No data on transition from intermediate hyperglycaemia to type 2 diabetes | |
| Not a prospective cohort study | |
| No valid data on transition from intermediate hyperglycaemia to type 2 diabetes | |
| Not a prospective cohort study | |
| Study design paper | |
| No data on transition from intermediate hyperglycaemia to type 2 diabetes | |
| Investigation of the association between gene variants and development of intermediate hyperglycaemia/diabetes | |
| Evaluation of the transition from normoglycaemia to intermediate hyperglycaemia | |
| No data on transition from intermediate hyperglycaemia to type 2 diabetes | |
| Aggregate data of 22 cohorts; no data on transition from intermediate hyperglycaemia to type 2 diabetes | |
| No data on diabetes incidence | |
| Not a prospective cohort study | |
| Not a prospective cohort study | |
| Cohort with depressive symptoms | |
| Not a prospective cohort study | |
| No cohort with intermediate hyperglycaemia | |
| Cross‐sectional study, no cohort with intermediate hyperglycaemia | |
| Non‐standard thresholds for intermediate hyperglycaemia | |
| Aggregated data on 6 prospective studies, no reliable additional data on transition from intermediate hyperglycaemia to type 2 diabetes | |
| Intervention trial | |
| No data on transition from intermediate hyperglycaemia to type 2 diabetes | |
| No data on transition from intermediate hyperglycaemia to type 2 diabetes | |
| No cohort with intermediate hyperglycaemia | |
| No data on transition from intermediate hyperglycaemia to type 2 diabetes | |
| No cohort with intermediate hyperglycaemia | |
| Diagnosis of type 2 diabetes incidence by database only | |
| No data on type 2 diabetes incidence | |
| Incidence established by register data | |
| No data on transition from intermediate hyperglycaemia to type 2 diabetes | |
| No data on transition from intermediate hyperglycaemia to type 2 diabetes | |
| No data on transition from intermediate hyperglycaemia to type 2 diabetes (database) | |
| Intervention trial, hypertensive cohort | |
| No data on transition from intermediate hyperglycaemia to type 2 diabetes | |
| No data on transition from intermediate hyperglycaemia to type 2 diabetes | |
| No data on transition from intermediate hyperglycaemia to type 2 diabetes | |
| No data on transition from intermediate hyperglycaemia to type 2 diabetes | |
| No data on transition from intermediate hyperglycaemia to type 2 diabetes, OGTTs were unit of analysis | |
| Investigation of the association of glycaemic index diets and glycaemic load diets with development of type 2 diabetes | |
| No cohort with intermediate hyperglycaemia | |
| No data on transition from intermediate hyperglycaemia to type 2 diabetes | |
| No cohort with intermediate hyperglycaemia | |
| Not a prospective cohort study | |
| Not a prospective cohort study (database) | |
| No data on transition from intermediate hyperglycaemia to type 2 diabetes | |
| Retrospective cohort study | |
| No data on transition from intermediate hyperglycaemia to type 2 diabetes | |
| Not a prospective cohort study | |
| No cohort with intermediate hyperglycaemia | |
| No cohort with intermediate hyperglycaemia | |
| Intervention trial | |
| No data on transition from intermediate hyperglycaemia to type 2 diabetes | |
| No cohort with intermediate hyperglycaemia, investigation of the association between birth weight and physical activity and cardiometabolic health | |
| No data on transition from intermediate hyperglycaemia to type 2 diabetes | |
| Diabetes incidence data for 'prediabetes' group only | |
| Non‐standard thresholds for intermediate hyperglycaemia | |
| No data on transition from intermediate hyperglycaemia to type 2 diabetes | |
| No data on transition from intermediate hyperglycaemia to type 2 diabetes | |
| Investigation of a prediction model for development of diabetes | |
| Not a prospective cohort study | |
| Diabetes incidence defined by register data | |
| Not a prospective cohort study | |
| No data on transition from intermediate hyperglycaemia to type 2 diabetes | |
| Not a prospective cohort study | |
| Not a prospective cohort study | |
| No data on transition from intermediate hyperglycaemia to type 2 diabetes | |
| No data on transition from intermediate hyperglycaemia to type 2 diabetes | |
| Investigation of the association between sleep duration and development of type 2 diabetes | |
| No data on transition from intermediate hyperglycaemia to type 2 diabetes | |
| No data on transition from intermediate hyperglycaemia to type 2 diabetes | |
| Non‐standard thresholds, no numerical data on transition from intermediate hyperglycaemia to type 2 diabetes | |
| No data on transition from intermediate hyperglycaemia to type 2 diabetes | |
| No data on transition from intermediate hyperglycaemia to type 2 diabetes | |
| Withdrawn publication | |
| No cohort with intermediate hyperglycaemia | |
| No data on transition from intermediate hyperglycaemia to type 2 diabetes | |
| Intervention trial | |
| Evaluation of a diabetes risk tool | |
| Participants of a diabetes prevention programme | |
| No data on transition from intermediate hyperglycaemia to type 2 diabetes | |
| No data on transition from intermediate hyperglycaemia to type 2 diabetes | |
| Investigation of the association between the bone resorption marker CTX and incident intermediate hyperglycaemia/diabetes | |
| Type 2 diabetes incidence measured mainly through registers; nested case‐control study; no transition data | |
| No cohort with intermediate hyperglycaemia | |
| No data on transition from intermediate hyperglycaemia to type 2 diabetes | |
| No data on transition from intermediate hyperglycaemia to type 2 diabetes | |
| No data on transition from intermediate hyperglycaemia to type 2 diabetes; no common thresholds for diagnosis of intermediate hyperglycaemia and type 2 diabetes | |
| No cohort with intermediate hyperglycaemia | |
| Investigation of the association between advanced glycation end products (AGE) and their receptor (RAGE) and type 2 diabetes incidence | |
| No data on transition from intermediate hyperglycaemia to type 2 diabetes | |
| No cohort with intermediate hyperglycaemia | |
| No data on transition from intermediate hyperglycaemia to type 2 diabetes | |
| No cohort with intermediate hyperglycaemia | |
| No data on transition from intermediate hyperglycaemia to type 2 diabetes | |
| Investigation of the association between liver transaminases and development of intermediate hyperglycaemia/type 2 diabetes | |
| No data on transition from intermediate hyperglycaemia to type 2 diabetes | |
| Not a prospective cohort study | |
| Not a prospective cohort study | |
| No data on transition from intermediate hyperglycaemia to type 2 diabetes | |
| No data on transition from intermediate hyperglycaemia to type 2 diabetes | |
| Not a prospective cohort study | |
| No data on transition from intermediate hyperglycaemia to type 2 diabetes | |
| No data on transition from intermediate hyperglycaemia to type 2 diabetes | |
| Non‐standard thresholds for intermediate hyperglycaemia | |
| Diabetes incidence data for prediabetic cohort only (FPG 5.6–6.9 or HbA1c 5.7%–6.4%) | |
| No data on transition from intermediate hyperglycaemia to type 2 diabetes | |
| Non‐standard IFG/IGT definition | |
| Non‐standard IFG/IGT definition | |
| No data on transition from intermediate hyperglycaemia to type 2 diabetes | |
| No data on transition from intermediate hyperglycaemia to type 2 diabetes | |
| Type 2 diabetes mellitus incidence not established by glucose measurements (questionnaires, reviews of primary care records, reviews of death certificates) | |
| Cross‐sectional study | |
| No data on transition from intermediate hyperglycaemia to type 2 diabetes | |
| Intervention trial (Women's Health Study) | |
| No data on transition from intermediate hyperglycaemia to type 2 diabetes | |
| Not a prospective cohort study | |
| No data on transition from intermediate hyperglycaemia to type 2 diabetes | |
| Not a prospective cohort study | |
| Development of a prediction model for HbA1c levels after 6 years in the non‐diabetic general population | |
| No data on transition from intermediate hyperglycaemia to type 2 diabetes | |
| No cohort with intermediate hyperglycaemia | |
| Investigation of patient activation to predict the course of type 2 diabetes | |
| No cohort with intermediate hyperglycaemia | |
| No data on transition from intermediate hyperglycaemia to type 2 diabetes | |
| No data on transition from intermediate hyperglycaemia to type 2 diabetes | |
| Diabetes incidence by self‐report only | |
| Evaluation of a diabetes risk score | |
| No individuals with intermediate hyperglycaemia at baseline | |
| Study design paper | |
| Not a prospective cohort study | |
| Mix of old an new participants in 2 study phases, participants with with both IFG and IGT were combined into an IFG group | |
| Not a prospective cohort study | |
| No data on transition from intermediate hyperglycaemia to type 2 diabetes | |
| No data on transition from intermediate hyperglycaemia to type 2 diabetes | |
| No cohort with intermediate hyperglycaemia | |
| No data on transition from intermediate hyperglycaemia to type 2 diabetes | |
| Evaluation of a new biomarker ('plasma lipidome') model | |
| No data on transition from intermediate hyperglycaemia to type 2 diabetes | |
| Aggregated data from several prevalence and incidence studies | |
| Cohort from intervention trial, no data on cohort with intermediate hyperglycaemia | |
| Not a prospective cohort study | |
| No data on transition from intermediate hyperglycaemia to type 2 diabetes | |
| No data on transition from intermediate hyperglycaemia to type 2 diabetes | |
| No data on transition from intermediate hyperglycaemia to type 2 diabetes | |
| No data on transition from intermediate hyperglycaemia to type 2 diabetes | |
| No data on transition from intermediate hyperglycaemia to type 2 diabetes | |
| New diabetes cases were identified through hospital records only | |
| No data on transition from intermediate hyperglycaemia to type 2 diabetes | |
| Investigation of the association between cardiorespiratory fitness and intermediate hyperglycaemia/type 2 diabetes mellitus | |
| No data on transition from intermediate hyperglycaemia to type 2 diabetes | |
| Investigation of genetic determinants of HbA1c on the development of type 2 diabetes | |
| No data on transition from intermediate hyperglycaemia to type 2 diabetes | |
| No data on transition from intermediate hyperglycaemia to type 2 diabetes | |
| No data on transition from intermediate hyperglycaemia to type 2 diabetes | |
| Intermediate hyperglycaemia determined through register data, retrospective study | |
| No data on transition from intermediate hyperglycaemia to type 2 diabetes | |
| Investigation of a prediction model for development of diabetes | |
| No data on transition from intermediate hyperglycaemia to type 2 diabetes | |
| No data on people with intermediate hyperglycaemia | |
| No data on type 2 diabetes incidence | |
| Retrospective cohort study | |
| Non‐standard thresholds for intermediate hyperglycaemia | |
| No data on transition from intermediate hyperglycaemia to type 2 diabetes | |
| No data on transition from intermediate hyperglycaemia to type 2 diabetes | |
| No data on transition from intermediate hyperglycaemia to type 2 diabetes, establishment of a predictive model | |
| No data on transition from intermediate hyperglycaemia to type 2 diabetes | |
| No data on transition from intermediate hyperglycaemia to type 2 diabetes | |
| No data on transition from intermediate hyperglycaemia to type 2 diabetes |
FPG: fasting plasma glucose; HbA1c: glycosylated haemoglobin A1c; IFG: impaired fasting glucose; IGT: impaired glucose tolerance.
Characteristics of studies awaiting assessment [ordered by study ID]
| Study name | Model development of diabetes in adult Chinese |
| Starting date | 1986, follow‐up 6 years |
| Contact information | Guangwei Li, Department of Endocrinology, China‐Japan Friendship Hospital, Beijing 100029 China |
| Notes | Establishment of a model for type 2 diabetes and the roles of insulin resistance and insulin secretion impairment; needs translation |
| Study name | Risk of diabetes and cardiovascular events in persons with early glucose metabolism impairments |
| Starting date | 2006, follow‐up 3 years |
| Contact information | Misnikova IV, Endocrinology, Moscow Regional Research Clinical Institute, Russian Federation |
| Notes | Conference abstract, no publication available |
| Study name | The effect of maximum body weight in lifetime on the development of type 2 diabetes (MAXWEL) |
| Starting date | August 2006 |
| Contact information | Professor Soo Lim, Seoul National University Bundang Hospital |
| Notes | Study completion date: September 2013; no publication available |
Characteristics of ongoing studies [ordered by study ID]
| Trial name or title | A survey to evaluate the cardiovascular risk status of subjects with pre‐diabetes in Hong Kong (JADE‐HK2) |
| Starting date | November 2008 |
| Contact information | Juliana Chan, Professor, Chinese University of Hong Kong |
| Notes | Estimated study completion date: December 2018 |
| Trial name or title | Assessing progression to type‐2 diabetes (APT‐2D): a prospective cohort study expanded from BRITE‐SPOT (Bio‐bank and Registry for StratIfication and Targeted intErventions in the Spectrum Of Type 2 Diabetes) (APT‐2D) |
| Starting date | March 2016 |
| Contact information | Sue‐Anne Toh, MBBChir, MSc, MA; +65 67722195; [email protected] |
| Notes | Estimated study completion date: December 2021 |
| Trial name or title | A population based study on metabolic syndrome complications, and mortality (MetSCoM) |
| Starting date | January 2005 |
| Contact information | Alireza Esteghamati, MD ([email protected]); Zahra Aryan, MD, MPH ([email protected]) |
| Notes | Estimated study completion date: January 2020 |
| Trial name or title | Prevalence, clinical features and risk assessment of pre‐diabetes in Spain: the prospective Mollerussa cohort study |
| Starting date | August 2011 |
| Contact information | Dr Didac Mauricio, MD; [email protected] |
| Notes | The Mollerussa study completed its recruitment phase in July 2014 and the 12 month follow‐up in July 2015. Participants will be followed up long‐term through annual extraction of data included in the individual's electronic medical records. |
Data and analyses
| Outcome or subgroup title | No. of studies | No. of participants | Statistical method | Effect size |
| 1 T2DM incidence (IFG5.6) Show forest plot | 8 | 34867 | Hazard Ratio (Random, 95% CI) | 4.32 [2.61, 7.12] |
| Analysis 1.1  Comparison 1 Hazard ratio as the effect measure for the development of T2DM, Outcome 1 T2DM incidence (IFG5.6). | ||||
| 1.1 Asia/Middle East | 4 | 14803 | Hazard Ratio (Random, 95% CI) | 5.07 [3.41, 7.53] |
| 1.2 Australia/Europe/North America | 3 | 18522 | Hazard Ratio (Random, 95% CI) | 4.15 [1.24, 13.87] |
| 1.3 American Indians/Islands | 1 | 1542 | Hazard Ratio (Random, 95% CI) | 2.38 [1.85, 3.06] |
| 2 T2DM incidence (IFG6.1) Show forest plot | 10 | 21475 | Hazard Ratio (Random, 95% CI) | 5.47 [3.50, 8.54] |
| Analysis 1.2  Comparison 1 Hazard ratio as the effect measure for the development of T2DM, Outcome 2 T2DM incidence (IFG6.1). | ||||
| 2.1 Asia/Middle East | 5 | 10810 | Hazard Ratio (Random, 95% CI) | 10.55 [3.61, 30.81] |
| 2.2 Australia/Europe/North America | 4 | 10571 | Hazard Ratio (Random, 95% CI) | 3.30 [2.32, 4.67] |
| 2.3 Latin America | 1 | 94 | Hazard Ratio (Random, 95% CI) | 2.06 [1.76, 2.41] |
| 3 T2DM incidence (IGT) Show forest plot | 5 | 16576 | Hazard Ratio (Random, 95% CI) | 3.61 [2.31, 5.64] |
| Analysis 1.3  Comparison 1 Hazard ratio as the effect measure for the development of T2DM, Outcome 3 T2DM incidence (IGT). | ||||
| 3.1 Asia/Middle East | 3 | 8475 | Hazard Ratio (Random, 95% CI) | 4.48 [2.81, 7.15] |
| 3.2 Australia/Europe/North America | 2 | 8101 | Hazard Ratio (Random, 95% CI) | 2.53 [1.52, 4.19] |
| 4 T2DM incidence (IFG + IGT) Show forest plot | 5 | 9757 | Hazard Ratio (Random, 95% CI) | 6.90 [4.15, 11.45] |
| Analysis 1.4  Comparison 1 Hazard ratio as the effect measure for the development of T2DM, Outcome 4 T2DM incidence (IFG + IGT). | ||||
| 4.1 Asia/Middle East | 3 | 7156 | Hazard Ratio (Random, 95% CI) | 10.20 [5.45, 19.09] |
| 4.2 Australia/Europe/North America | 1 | 1650 | Hazard Ratio (Random, 95% CI) | 3.80 [2.30, 6.28] |
| 4.3 American Indians/Islands | 1 | 951 | Hazard Ratio (Random, 95% CI) | 4.06 [3.05, 5.40] |
| 5 T2DM incidence (HbA1c5.7) Show forest plot | 4 | 25047 | Hazard Ratio (Random, 95% CI) | 5.55 [2.77, 11.12] |
| Analysis 1.5  Comparison 1 Hazard ratio as the effect measure for the development of T2DM, Outcome 5 T2DM incidence (HbA1c5.7). | ||||
| 5.1 Asia | 3 | 16805 | Hazard Ratio (Random, 95% CI) | 7.21 [5.14, 10.11] |
| 5.2 Australia/Europe/North America | 1 | 8242 | Hazard Ratio (Random, 95% CI) | 2.71 [2.48, 2.96] |
| 6 T2DM incidence (HbA1c6.0) Show forest plot | 6 | 30699 | Hazard Ratio (Random, 95% CI) | 10.10 [3.59, 28.43] |
| Analysis 1.6  Comparison 1 Hazard ratio as the effect measure for the development of T2DM, Outcome 6 T2DM incidence (HbA1c6.0). | ||||
| 6.1 Asia/Middle East | 4 | 22734 | Hazard Ratio (Random, 95% CI) | 13.12 [4.10, 41.96] |
| 6.2 Australia/Europe/North America | 2 | 7965 | Hazard Ratio (Random, 95% CI) | 5.09 [1.69, 15.37] |
| 7 T2DM incidence (HbA1c + IFG) Show forest plot | 1 | Hazard Ratio (Fixed, 95% CI) | Subtotals only | |
| Analysis 1.7  Comparison 1 Hazard ratio as the effect measure for the development of T2DM, Outcome 7 T2DM incidence (HbA1c + IFG). | ||||
| 7.1 HbA1c5.7 + IFG5.6 | 1 | 4559 | Hazard Ratio (Fixed, 95% CI) | 32.50 [23.00, 45.92] |
| 7.2 HbA1c5.7 + IFG6.1 | 1 | 5357 | Hazard Ratio (Fixed, 95% CI) | 37.90 [28.10, 51.12] |
| 7.3 HbA1c6.0 + IFG5.6 | 1 | 4628 | Hazard Ratio (Fixed, 95% CI) | 53.70 [38.40, 75.09] |
| 7.4 HbA1c6.0 + IFG6.1 | 1 | 5802 | Hazard Ratio (Fixed, 95% CI) | 52.30 [37.80, 72.37] |
| Outcome or subgroup title | No. of studies | No. of participants | Statistical method | Effect size |
| 1 T2DM incidence (IFG5.6) Show forest plot | 21 | 47647 | Odds Ratio (Random, 95% CI) | 4.15 [2.75, 6.28] |
| Analysis 2.1  Comparison 2 Odds ratio as the effect measure for the development of T2DM, Outcome 1 T2DM incidence (IFG5.6). | ||||
| 1.1 Asia/Middle East | 10 | 34577 | Odds Ratio (Random, 95% CI) | 2.94 [1.77, 4.86] |
| 1.2 Australia/Europe/North America | 9 | 9869 | Odds Ratio (Random, 95% CI) | 6.47 [3.81, 11.00] |
| 1.3 Latin America | 1 | 1659 | Odds Ratio (Random, 95% CI) | 4.28 [3.21, 5.71] |
| 1.4 American Indians/Islands | 1 | 1542 | Odds Ratio (Random, 95% CI) | 3.12 [2.31, 4.21] |
| 2 T2DM incidence (IFG6.1) Show forest plot | 15 | 36866 | Odds Ratio (Random, 95% CI) | 6.60 [4.18, 10.43] |
| Analysis 2.2  Comparison 2 Odds ratio as the effect measure for the development of T2DM, Outcome 2 T2DM incidence (IFG6.1). | ||||
| 2.1 Asia/Middle East | 7 | 28921 | Odds Ratio (Random, 95% CI) | 5.18 [2.32, 11.53] |
| 2.2 Australia/Europe/North America | 7 | 6334 | Odds Ratio (Random, 95% CI) | 8.69 [4.95, 15.24] |
| 2.3 Latin America | 1 | 1611 | Odds Ratio (Random, 95% CI) | 3.73 [2.18, 6.38] |
| 3 T2DM incidence (IGT) Show forest plot | 20 | 21552 | Odds Ratio (Random, 95% CI) | 4.61 [3.76, 5.64] |
| Analysis 2.3  Comparison 2 Odds ratio as the effect measure for the development of T2DM, Outcome 3 T2DM incidence (IGT). | ||||
| 3.1 Asia/Middle East | 6 | 8643 | Odds Ratio (Random, 95% CI) | 3.74 [2.83, 4.94] |
| 3.2 Australia/Europe/North America | 11 | 9165 | Odds Ratio (Random, 95% CI) | 5.20 [3.62, 7.45] |
| 3.3 Latin America | 2 | 3478 | Odds Ratio (Random, 95% CI) | 4.94 [3.15, 7.76] |
| 3.4 American Indians/Islands | 1 | 266 | Odds Ratio (Random, 95% CI) | 3.60 [1.40, 9.26] |
| 4 T2DM incidence (IFG + IGT) Show forest plot | 9 | 9656 | Odds Ratio (Random, 95% CI) | 13.14 [7.41, 23.30] |
| Analysis 2.4  Comparison 2 Odds ratio as the effect measure for the development of T2DM, Outcome 4 T2DM incidence (IFG + IGT). | ||||
| 4.1 Asia/Middle East | 3 | 4202 | Odds Ratio (Random, 95% CI) | 6.99 [3.09, 15.83] |
| 4.2 Australia/Europe/North America | 6 | 5454 | Odds Ratio (Random, 95% CI) | 20.95 [12.40, 35.40] |
| 5 T2DM incidence (HbA1c5.7) Show forest plot | 3 | 3468 | Odds Ratio (Random, 95% CI) | 4.43 [2.20, 8.88] |
| Analysis 2.5  Comparison 2 Odds ratio as the effect measure for the development of T2DM, Outcome 5 T2DM incidence (HbA1c5.7). | ||||
| 5.1 Asia/Middle East | 1 | 1137 | Odds Ratio (Random, 95% CI) | 4.54 [2.65, 7.78] |
| 5.2 Europe/North America | 2 | 2331 | Odds Ratio (Random, 95% CI) | 4.38 [1.36, 14.15] |
| 6 T2DM incidence (HbA1c6.0) Show forest plot | 3 | 18317 | Odds Ratio (Random, 95% CI) | 12.79 [4.56, 35.85] |
| Analysis 2.6  Comparison 2 Odds ratio as the effect measure for the development of T2DM, Outcome 6 T2DM incidence (HbA1c6.0). | ||||
| 6.1 Asia/Middle East | 1 | 11866 | Odds Ratio (Random, 95% CI) | 23.20 [18.70, 28.78] |
| 6.2 Australia/Europe/North America | 1 | 5735 | Odds Ratio (Random, 95% CI) | 15.60 [6.90, 35.27] |
| 6.3 American Indians/Islands | 1 | 716 | Odds Ratio (Random, 95% CI) | 5.89 [4.23, 8.20] |
| 7 T2DM incidence (HbA1c5.7 + IFG5.6) Show forest plot | 2 | 14006 | Odds Ratio (Random, 95% CI) | 35.91 [20.43, 63.12] |
| Analysis 2.7  Comparison 2 Odds ratio as the effect measure for the development of T2DM, Outcome 7 T2DM incidence (HbA1c5.7 + IFG5.6). | ||||
| 7.1 Australia/Europe/North America | 1 | 1294 | Odds Ratio (Random, 95% CI) | 26.20 [16.30, 42.11] |
| 7.2 Asia/Middle East | 1 | 12712 | Odds Ratio (Random, 95% CI) | 46.70 [33.60, 64.91] |
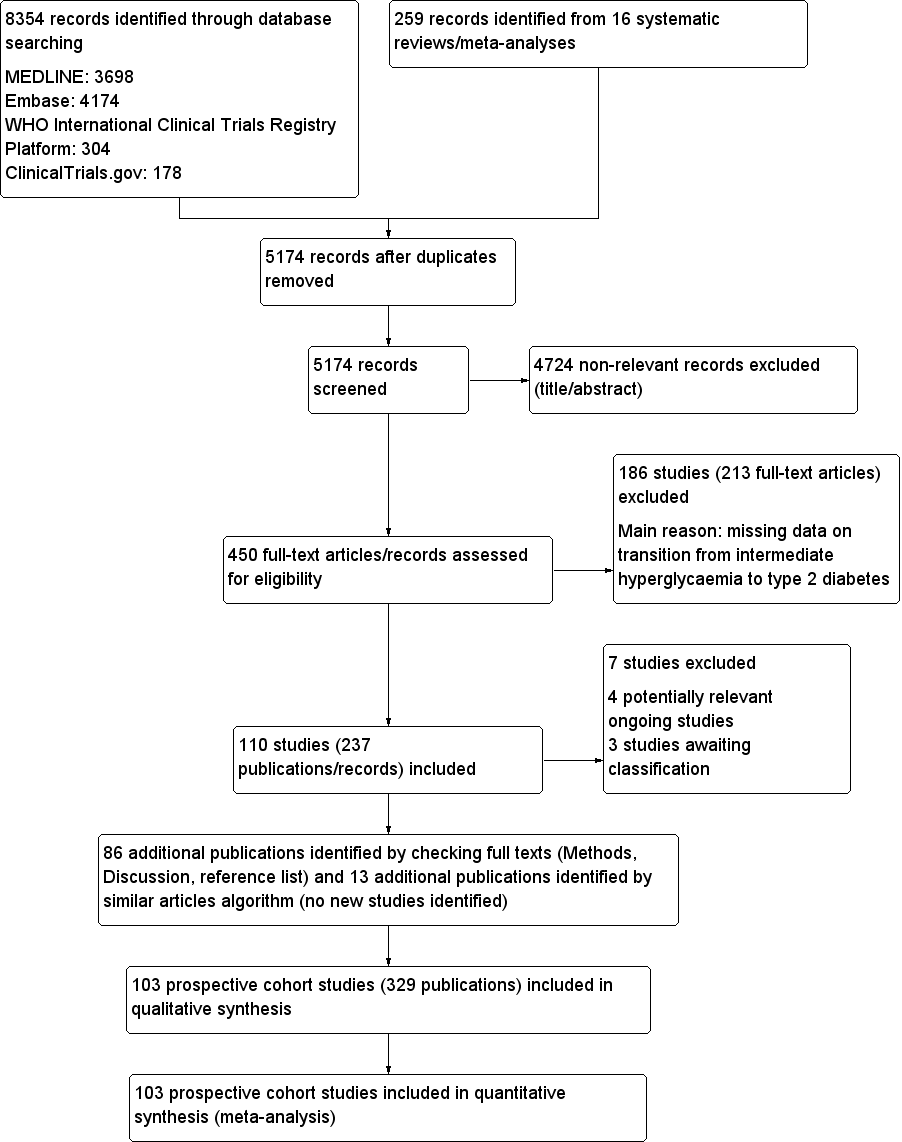
Study flow diagram

Risk of bias graph for studies of overall prognosis of people with intermediate hyperglycaemia for developing type 2 diabetes: review authors' judgements about each risk of bias item presented as percentages across all included studies
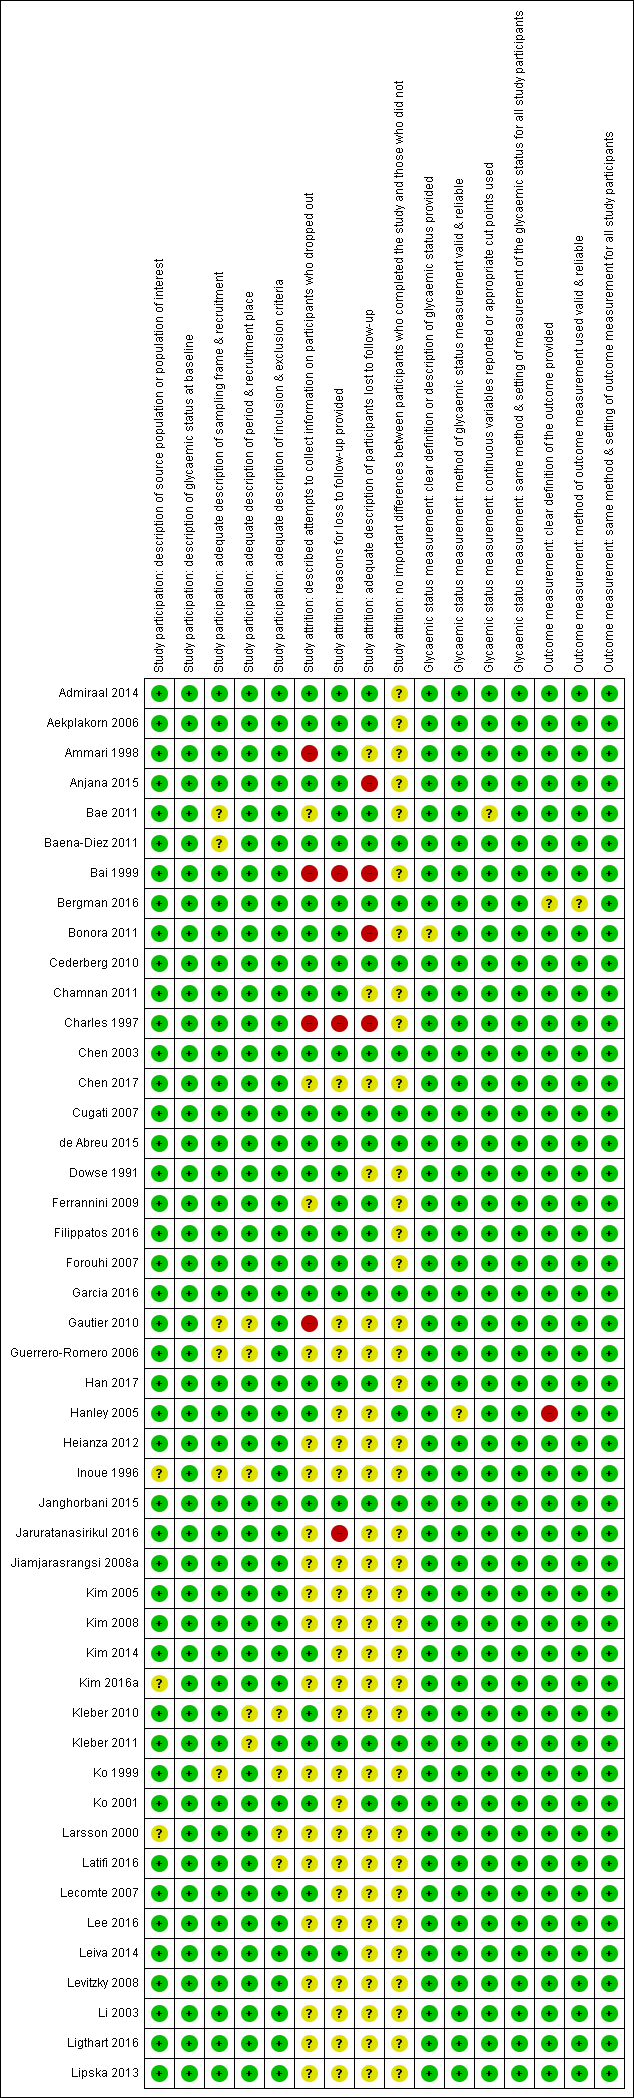
'Risk of bias' summary for studies of overall prognosis in people with intermediate hyperglycaemia for developing type 2 diabetes: review authors' judgements about each risk of bias item for each included study (part 1). The summary was split into part 1 (Figure 3) and part 2 (Figure 4) for better legibility

Risk of bias summary for studies of overall prognosis of people with intermediate hyperglycaemia for developing type 2 diabetes: review authors' judgements about each risk of bias item for each included study (part 2)
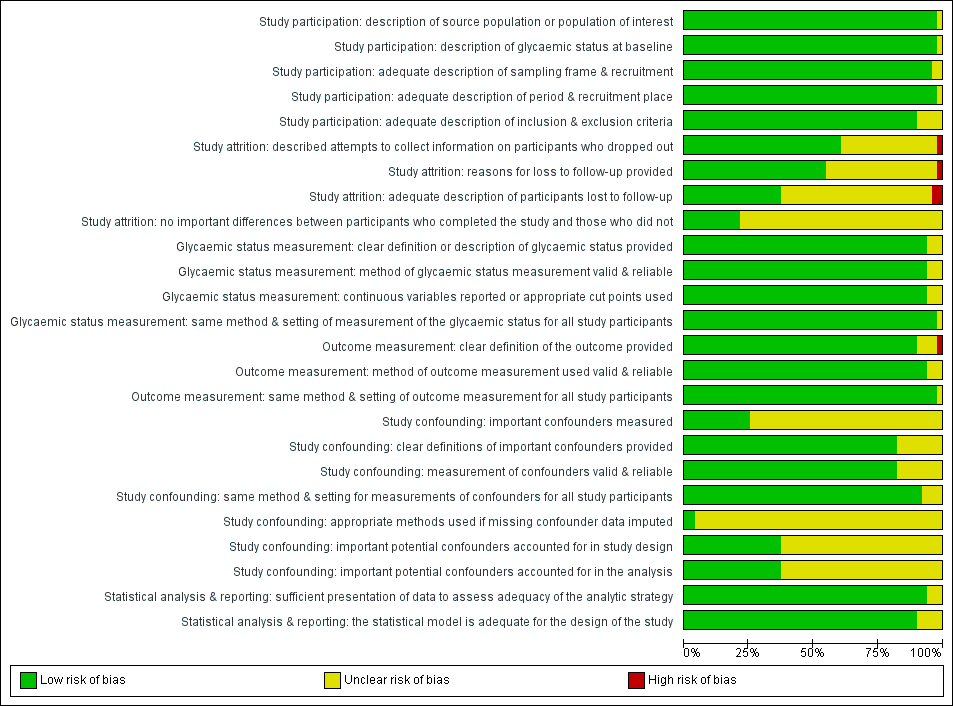
Risk of bias graph for studies of intermediate hyperglycaemia versus normoglycaemia as a prognostic factor for developing type 2 diabetes: review authors' judgements about each risk of bias item presented as percentages across all included studies

Risk of bias summary for studies of intermediate hyperglycaemia versus normoglycaemia as a prognostic factor for developing type 2 diabetes: review authors' judgements about each risk of bias item for each included study

Impaired fasting glucose 5.6 mmol/L (IFG5.6) threshold: association with cumulative type 2 diabetes mellitus (T2DM) incidence over 2–5 years
*Isolated IFG5.6
CI: confidence interval; M: men; n/N: events/number of participants; W: women
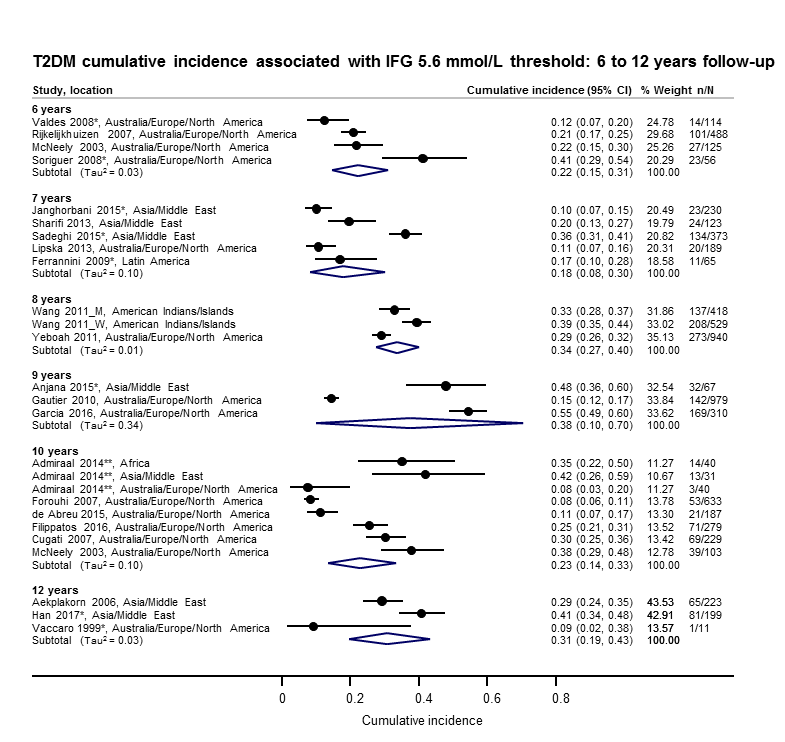
Impaired fasting glucose 5.6 mmol/L (IFG5.6) threshold: association with cumulative type 2 diabetes mellitus (T2DM) incidence over 6–12 years
*Isolated IFG5.6
**'Africa': African Surinamese cohort, 'Asia': Asian Surinamese cohort, 'Australia/Europe/North America': 'ethnic Dutch' cohort.
CI: confidence interval; M: men; n/N: events/number of participants; W: women
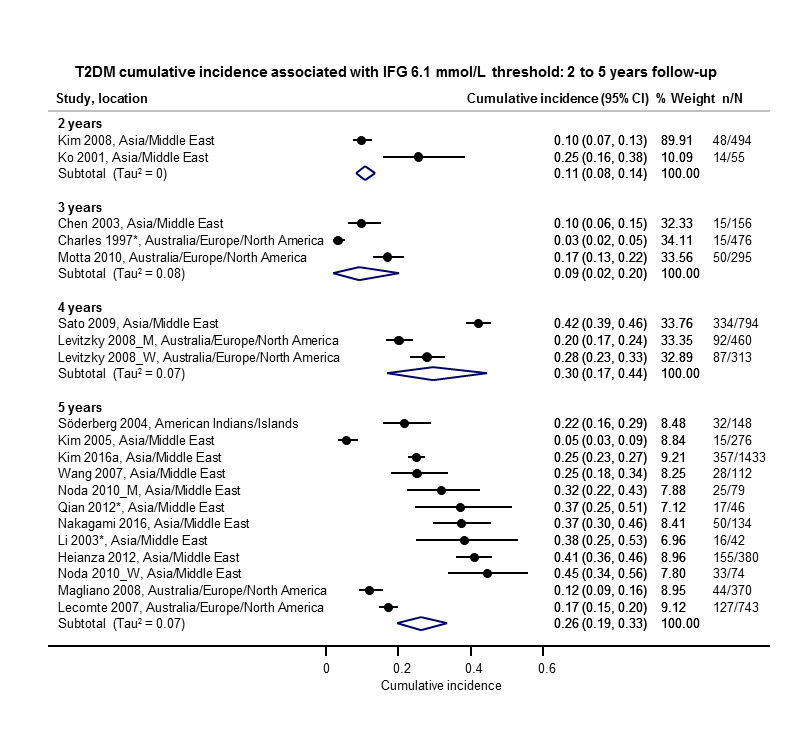
Impaired fasting glucose 6.1 mmol/L (IFG6.1) threshold: association with cumulative type 2 diabetes mellitus (T2DM) incidence over 2–5 years
*Isolated IFG6.1
CI: confidence interval; M: men; n/N: events/number of participants; W: women
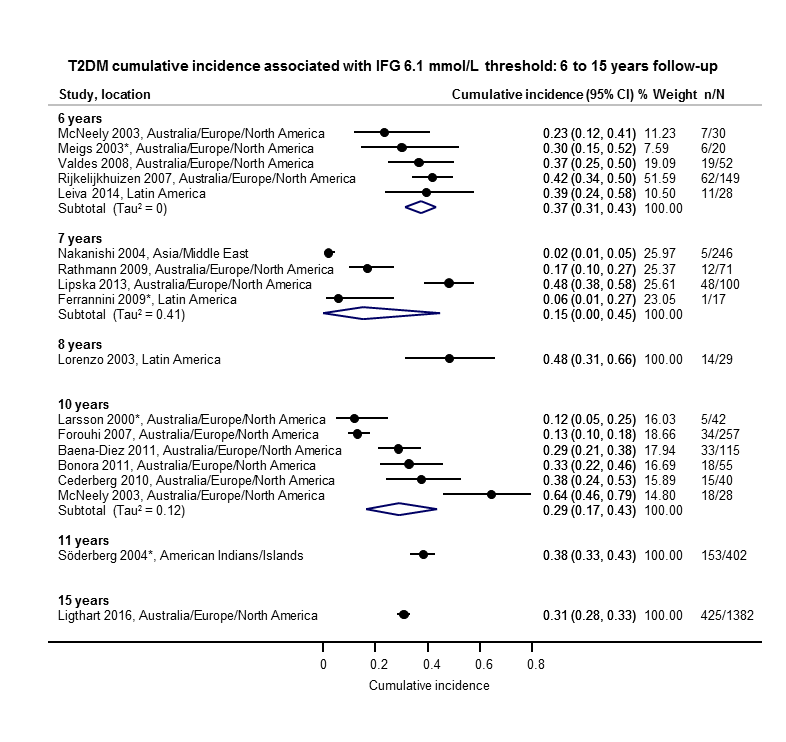
Impaired fasting glucose 6.1 mmol/L (IFG6.1) threshold: association with cumulative type 2 diabetes mellitus (T2DM) incidence over 6–15 years
*Isolated IFG6.1
CI: confidence interval; n/N: events/number of participants

Impaired glucose tolerance (IGT): association with cumulative type 2 diabetes mellitus (T2DM) incidence over 1–5 years
*Isolated IGT
CI: confidence interval; n/N: events/number of participants
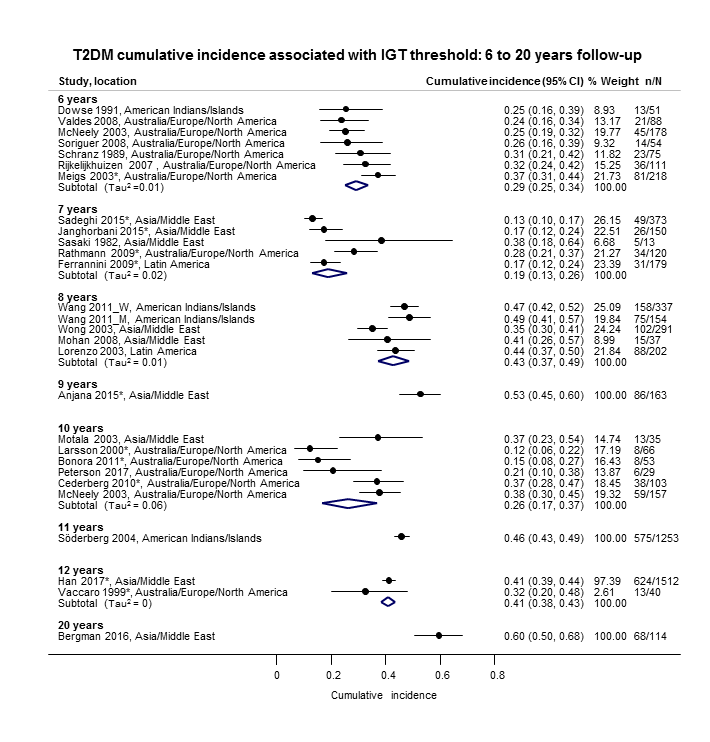
Impaired glucose tolerance (IGT): association with cumulative type 2 diabetes mellitus (T2DM) incidence over 6–20 years
*Isolated IGT
CI: confidence interval; M: men; n/N: events/number of participants; W: women

Combined impaired glucose tolerance (IGT) and impaired fasting glucose (IFG): association with cumulative type 2 diabetes mellitus (T2DM) incidence over 1–12 years
CI: confidence interval; M: men; n/N: events/number of participants; W: women
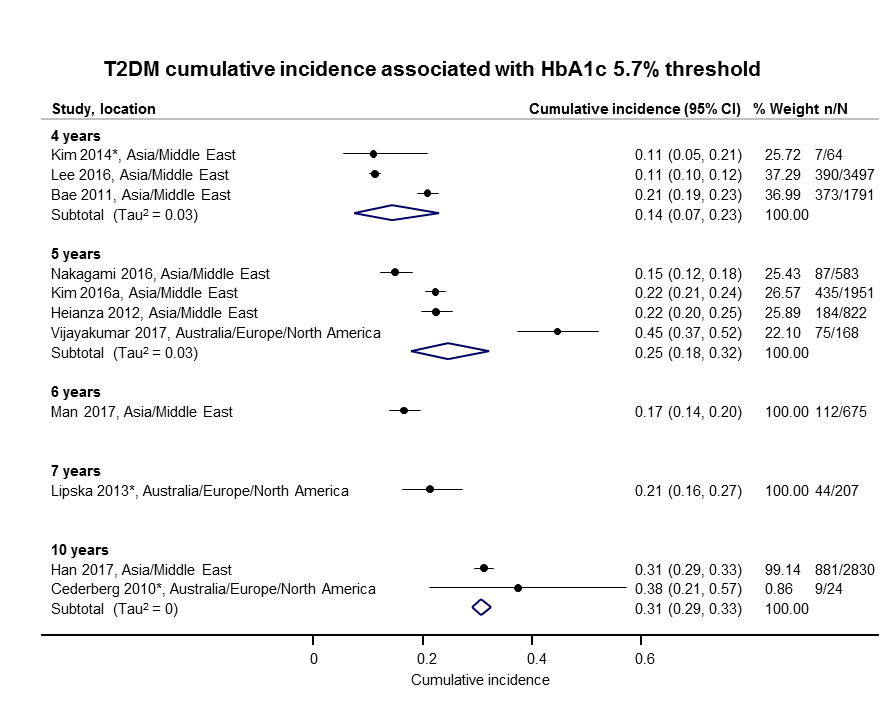
Elevated glycosylated haemoglobin A1c (HbA1c) 5.7% threshold: association with cumulative type 2 diabetes mellitus (T2DM) incidence over 4–10 years
CI: confidence interval; n/N: events/number of participants

Elevated glycosylated haemoglobin A1c (HbA1c) 6.0% threshold: association with cumulative type 2 diabetes mellitus (T2DM) incidence over 3–15 years
CI: confidence interval; n/N: events/number of participants

Cumulative type 2 diabetes mellitus (T2DM) incidence in children/adolescents over 1–10 years
CI: confidence interval; HbA1c 5.7: glycosylated haemoglobin A1c 5.7% threshold; (i‐)IGT: (isolated) impaired glucose tolerance; n/N: events/number of participants; NO: non‐overweight; OV: overweight

Regression from intermediate hyperglycaemia to normoglycaemia in adults over 1–5 years
CI: confidence interval; HbA1c5.7 : glycosylated haemoglobin A1c 5.7%; i‐IFG5.6/6.1 : (isolated) impaired fasting glucose 5.6/6.1 mmol/L threshold;IGT: impaired glucose tolerance; n/N: events/number of participants

Regression from intermediate hyperglycaemia to normoglycaemia in adults over 6–11 years
CI: confidence interval; i‐IFG5.6/6.1 : (isolated) impaired fasting glucose 5.6/6.1 mmol/L threshold; i‐IGT: (isolated) impaired glucose tolerance; n/N: events/number of participants
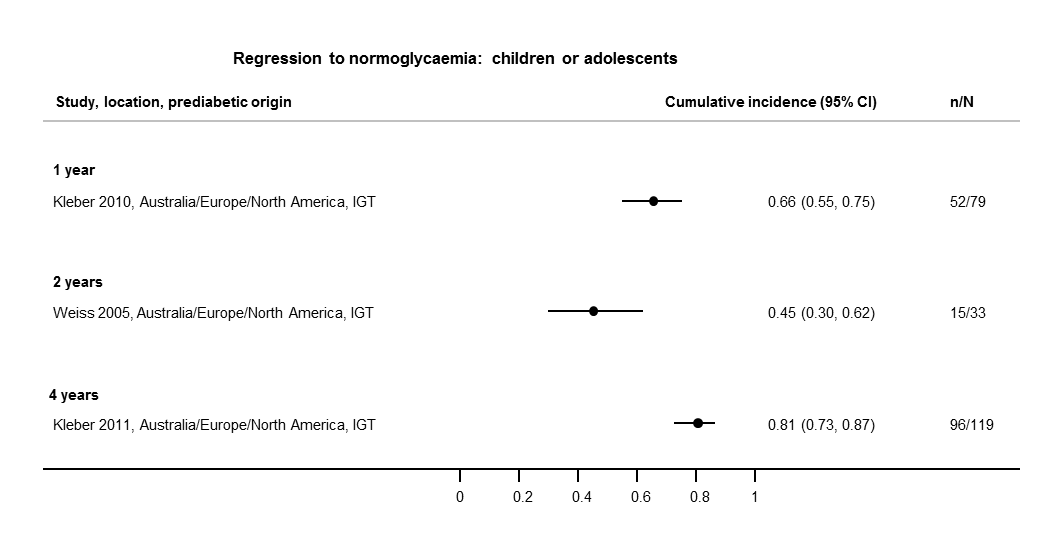
Regression from intermediate hyperglycaemia to normoglycaemia in children/adolescents over 1–4 years
CI: confidence interval; IGT: impaired glucose tolerance; n/N: events/number of participants
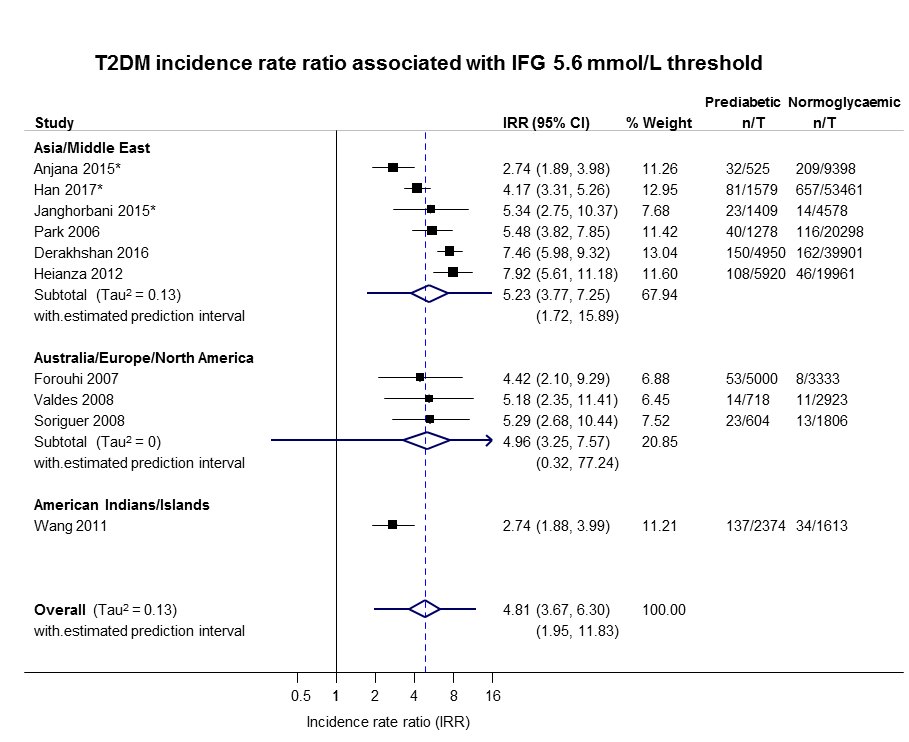
IFG: impaired fasting glucose; IRR: incidence rate ratio; n: number of cases; T: person‐time in years

IFG: impaired fasting glucose; IRR: incidence rate ratio; n: number of cases; T: person‐time in years

IGT: impaired glucose tolerance; IRR: incidence rate ratio; n: number of cases; T: person‐time in years

IFG: impaired fasting glucose; IGT: impaired glucose tolerance; IRR: incidence rate ratio; n: number of cases; T: person‐time in years
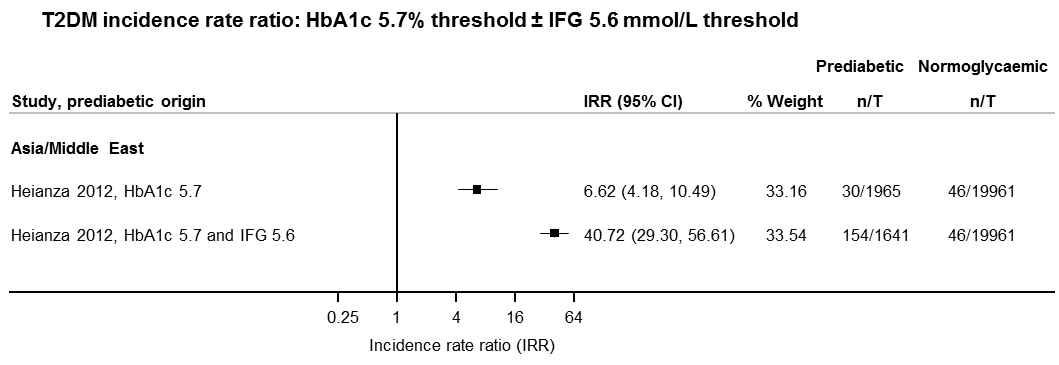
IFG: impaired fasting glucose; HbA1c: glycosylated haemoglobin A1c; IRR: incidence rate ratio; n: number of cases; T: person‐time in years
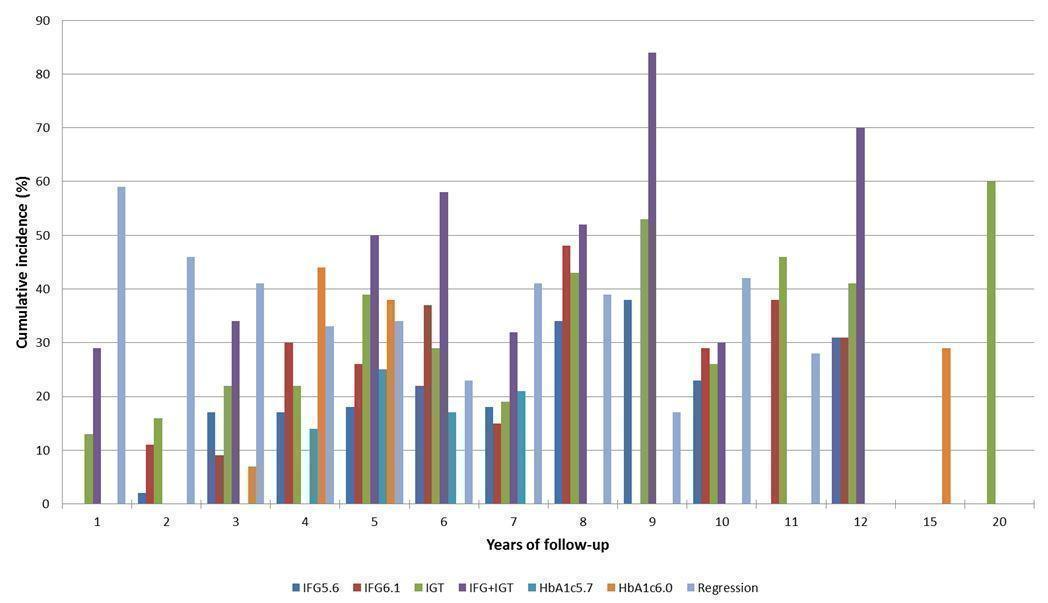
Overall prognosis of people with intermediate hyperglycaemia (cumulative type 2 diabetes incidence and regression to normoglycaemia) associated with measures of intermediate hyperglycaemia
HbA1c5.7/HbA1c6.0: glycosylated haemoglobin A1c 5.7%/6.0% threshold; IFG5.6/6.1: impaired fasting glucose 5.6/6.1 mmol/L threshold; IGT: impaired glucose tolerance

Intermediate hyperglycaemia versus normoglycaemia as a prognostic factor for developing type 2 diabetes (associated with different measures and relative risks of intermediate hyperglycaemia)
HbA1c5.7/HbA1c6.0: glycosylated haemoglobin A1c 5.7%/6.0% threshold; IFG5.6/6.1: impaired fasting glucose 5.6/6.1 mmol/L threshold; IGT: impaired glucose tolerance; IRR: incidence rate ratio; OR: odds ratio; HR: hazard ratio
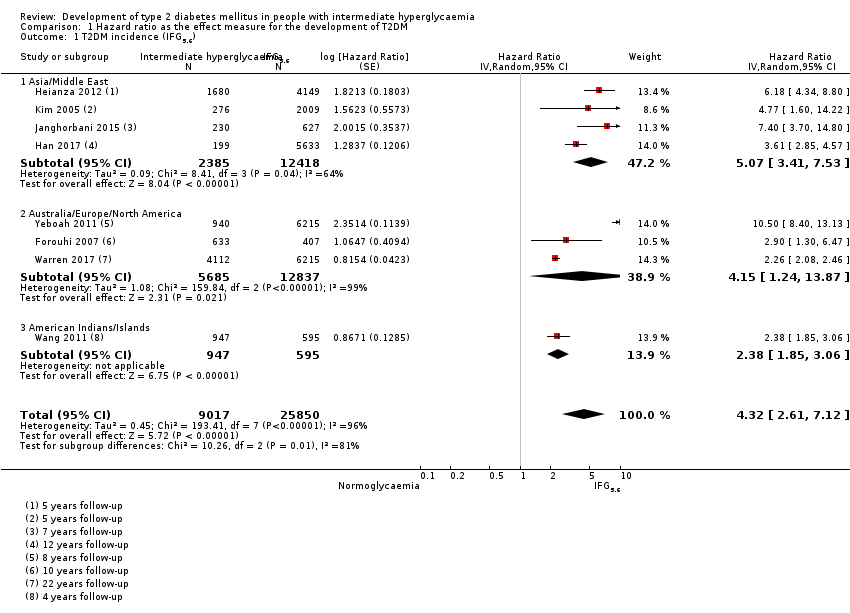
Comparison 1 Hazard ratio as the effect measure for the development of T2DM, Outcome 1 T2DM incidence (IFG5.6).

Comparison 1 Hazard ratio as the effect measure for the development of T2DM, Outcome 2 T2DM incidence (IFG6.1).

Comparison 1 Hazard ratio as the effect measure for the development of T2DM, Outcome 3 T2DM incidence (IGT).

Comparison 1 Hazard ratio as the effect measure for the development of T2DM, Outcome 4 T2DM incidence (IFG + IGT).

Comparison 1 Hazard ratio as the effect measure for the development of T2DM, Outcome 5 T2DM incidence (HbA1c5.7).
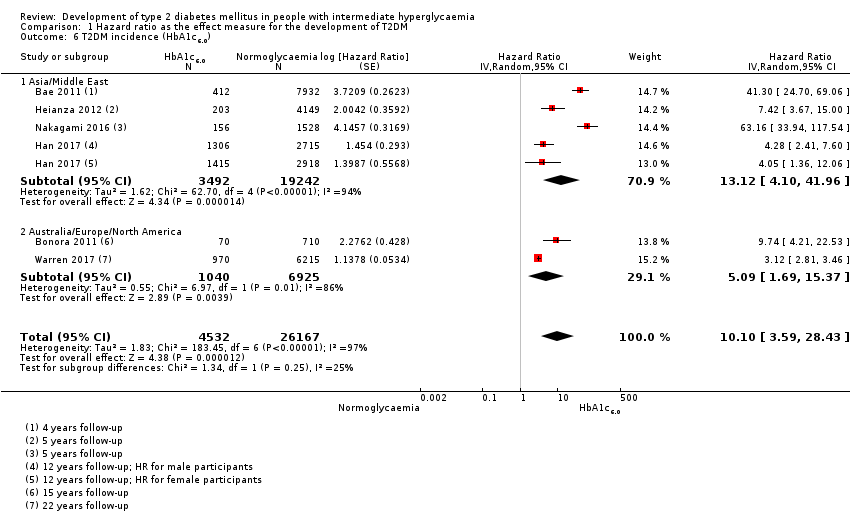
Comparison 1 Hazard ratio as the effect measure for the development of T2DM, Outcome 6 T2DM incidence (HbA1c6.0).
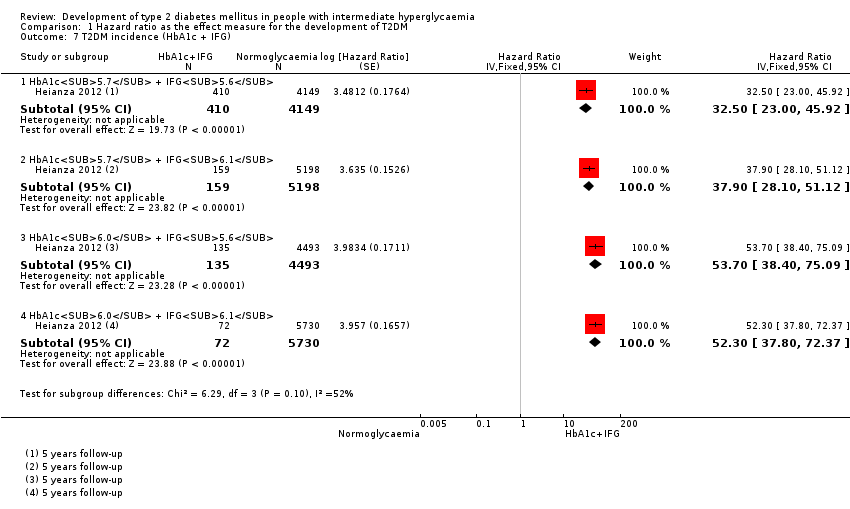
Comparison 1 Hazard ratio as the effect measure for the development of T2DM, Outcome 7 T2DM incidence (HbA1c + IFG).

Comparison 2 Odds ratio as the effect measure for the development of T2DM, Outcome 1 T2DM incidence (IFG5.6).

Comparison 2 Odds ratio as the effect measure for the development of T2DM, Outcome 2 T2DM incidence (IFG6.1).

Comparison 2 Odds ratio as the effect measure for the development of T2DM, Outcome 3 T2DM incidence (IGT).

Comparison 2 Odds ratio as the effect measure for the development of T2DM, Outcome 4 T2DM incidence (IFG + IGT).
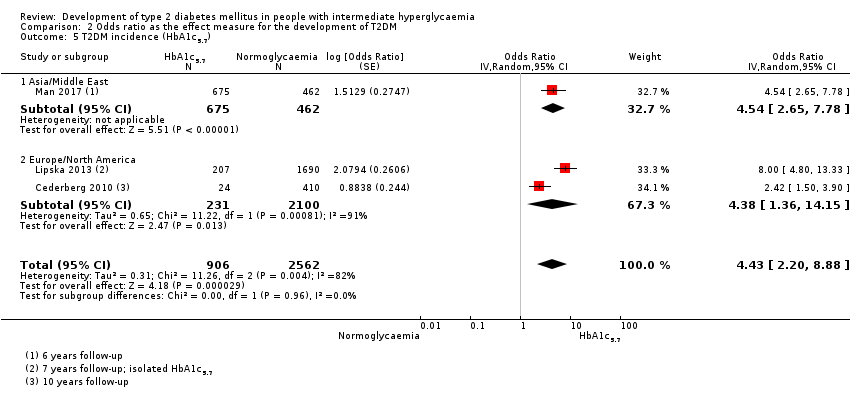
Comparison 2 Odds ratio as the effect measure for the development of T2DM, Outcome 5 T2DM incidence (HbA1c5.7).
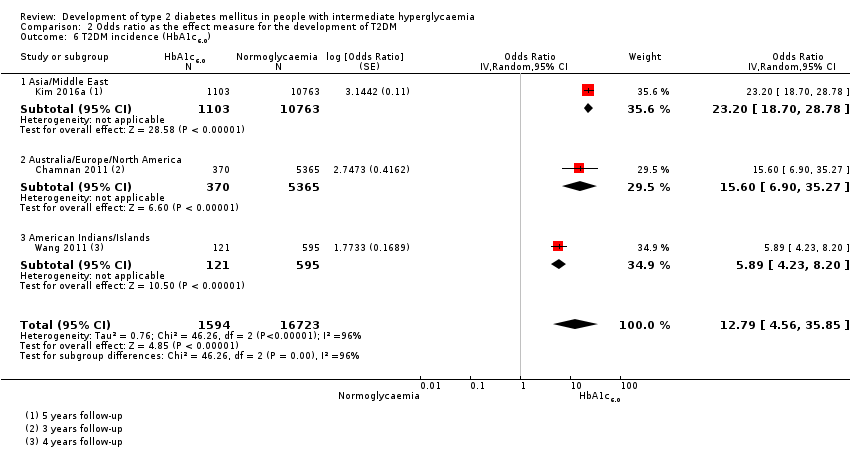
Comparison 2 Odds ratio as the effect measure for the development of T2DM, Outcome 6 T2DM incidence (HbA1c6.0).
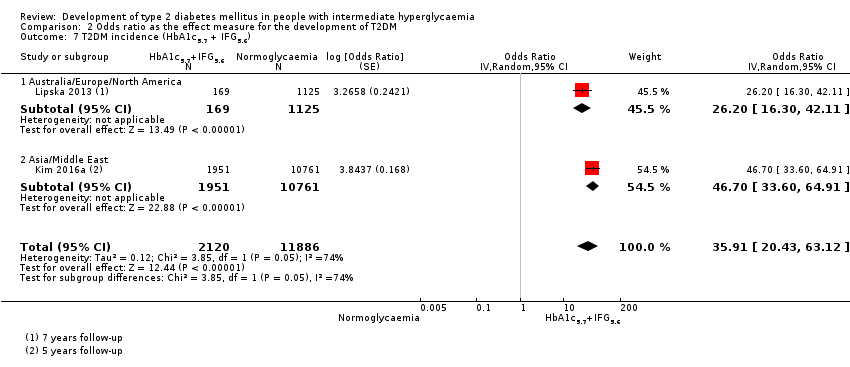
Comparison 2 Odds ratio as the effect measure for the development of T2DM, Outcome 7 T2DM incidence (HbA1c5.7 + IFG5.6).
| Outcome: development of T2DM | ||||||||
| Follow‐up | Cumulative T2DM incidence % (95% CI) | Regression from intermediate hyperglycaemia to normoglycaemia % (95% CI) | Overall certainty of the evidence (GRADE)a | |||||
| IFG5.6 | IFG6.1 | IGT | IFG + IGT | HbA1c5.7 | HbA1c6.0 | |||
| 1 | — | — | 13 (5–23) [3; 671] | 29 (23–36) [1; 207] | — | — | 59 (54–64) [2; 375] | ⊕⊕⊕⊝ |
| 2 | 2 (1–2) [1; 1335] | 11 (8–14) [2; 549] | 16 (9–26) [9; 1998] | — | — | — | 46 (36–55) [9; 2852] | |
| 3 | 17 (6–32) [3; 1091] | 9 (2–20) [3; 927] | 22 (18–27) [3; 417] | 34 (28–41) [1; 209]— | — | 7 (5–10) [1; 370] | 41 (24–69) [7; 1356] | |
| 4 | 17 (13–22) [3; 800] | 30 (17–44) [2; 1567] | 22 (12–34) [5; 1042] | — | 14 (7–23) [3; 5352] | 44 (40–48) [2; 627] | 33 (26–40) [3; 807] | |
| 5 | 18 (10–27) [7; 3530] | 26 (19–33) [11; 3837] | 39 (25–53) [12; 3444] | 50 (37–63) [5; 478] | 25 (18–32) [4; 3524] | 38 (26–51) [3; 1462] | 34 (27–42) [9; 2603] | |
| 6 | 22 (15–31) [4; 738] | 37 (31–43) [5; 279] | 29 (25–34) [7; 775] | 58 (48–67) [4; 106] | 17 (14–20) [1; 675] | — | 23 (3–53) [5; 1328] | |
| 7 | 18 (8–30) [5; 980] | 15 (0–45) [4; 434] | 19 (13–26) [5; 835] | 32 (20–45) [4; 753] | 21 (16–27) [1; 207] | — | 41 (37–45) [4; 679] | |
| 8 | 34 (27–40) [2; 1887] | 48 (31–66) [1;29] | 43 (37–49) [4; 1021] | 52 (47–57) [1; 356] | — | — | 39 (33–44) [2; 328] | |
| 9 | 38 (10–70) [3; 1356] | — | 53 (45–60) [1; 163] | 84 (74–91) [1; 69] | — | — | 17 (14–22) [1; 299] | |
| 10 | 23 (14–33) [6; 1542] | 29 (17–43) [6; 537] | 26 (17–37) [6; 443] | 30 (17–44) [2; 49] | 31 (29–33) [2; 2854] | — | 42 (22–63) [7; 894] | |
| 11 | — | 38 (33–43) [1; 402] | 46 (43–49) [1; 1253] | — | — | — | 28 (17–39) [2; 736] | |
| 12 | 31 (19–34) [3; 433] | 31 (28–33) [1; 1382] | 41 (38–43) [2; 1552] | 70 (63–76) [2; 207] | — | — | — | |
| 15 | — | — | — | — | — | 29 (19–40) [1; 70] | — | |
| 20 | — | — | 60 (5–68) [1; 114] | — | — | — | — | |
| CI: confidence interval; HbA1c5.7 : glycosylated haemoglobin A1c, 5.7% threshold; HbA1c6.0 : glycosylated haemoglobin A1c, 6.0% threshold; IFG5.6 : impaired fasting glucose, 5.6 mmol/L threshold; IFG6.1 : impaired fasting glucose, 6.1 mmol/L threshold; IGT: impaired glucose tolerance; T2DM: type 2 diabetes mellitus. | ||||||||
| GRADE Working Group grades of evidence | ||||||||
| aWith phase 2 explanatory studies aiming to confirm independent associations between the prognostic factor and the outcome, GRADE starts with 'high quality' (Huguet 2013). We assumed the GRADE factor publication bias was inherent with this type of research (phase 2 design), so we did not use it as a potential downgrading factor | ||||||||
| Outcome: development of T2DM | ||||
| No of studies | No of participants with intermediate hyperglycaemia | Geographic region/special population | Estimated effect (95% CI) | Overall certainty of the evidence (GRADE)a |
| HR: 4 IRR: 6 OR: 10 | HR: 2385 IRR: 15,661 OR: 6359 | Asia/Middle East | HR: 5.07 (3.41–4.86) [1.07–24.02] IRR: 5.23 (3.77–7.25) [1.72–15.89] OR: 2.94 (1.77–4.86) [0.43–19.93] | ⊕⊕⊝⊝ |
| HR: 3 IRR: 3 OR: 9 | HR: 5685 IRR: 6322 OR: 1949 | Australia/Europe/North America | HR: 4.15 (1.24–13.9) [N/M] IRR: 4.96 (3.25–7.57) [0.32–77.24] OR: 6.47 (3.81–11.00) [0.99–42.32] | |
| HR: 0 IRR: 0 OR: 1 | HR: 0 IRR: 0 OR: 65 | Latin America | HR: NA IRR: NA OR: 4.28 (3.21–5.71) | |
| HR: 1 IRR: 1 OR: 1 | HR: 947 IRR: 2374 OR: 947 | American Indians/Islands | HR: 2.38 (1.85–3.06) IRR: 2.74 (1.88–3.99) OR: 3.12 (2.31–4.21) | |
| HR: 8 IRR: 10 OR: 21 | HR: 9017 IRR: 24,357 OR: 9320 | Overall | HR: 4.32 (2.61–7.12) [0.75–25.0] IRR: 4.81 (3.67–6.30) [1.95–11.83] OR: 4.15 (2.75–6.28) [0.53–32.4] | |
| CI: confidence interval; HR: hazard ratio;IFG5.6 : impaired fasting glucose 5.6 mmol/L threshold; IRR: incidence rate ratio; NA: not applicable; N/M: fewer than 3 studies or calculation of the 95% prediction interval did not provide a meaningful estimate; OR: odds ratio; T2DM: type 2 diabetes mellitus. | ||||
| GRADE Working Group grades of evidence | ||||
| aWith phase 2 explanatory studies aiming to confirm independent associations between the prognostic factor and the outcome, GRADE starts with 'high quality' (Huguet 2013). We assumed the GRADE factor publication bias was inherent with this type of research (phase 2 design), so we did not use it as a potential downgrading factor | ||||
| Outcome: development of T2DM | ||||
| No of studies | No of participants with intermediate hyperglycaemia | Geographic region/special population | Estimated effect (95% CI) | Overall certainty of |
| HR: 5 IRR: 2 OR: 7 | HR: 1054 IRR: 1677 OR: 3317 | Asia/Middle East | HR: 10.55 (3.61–30.81) [N/M] IRR: 3.62 (1.67–7.83) [N/M] OR: 5.18 (2.32–11.53) [0.29–91.37] | ⊕⊕⊝⊝ |
| HR: 4 IRR: 4 OR: 7 | HR: 1736 IRR: 3438 OR: 1240 | Australia/Europe/North America | HR: 3.30 (2.32–4.67) [0.84–12.99] IRR: 8.55 (6.37–11.48) [4.37–16.73] OR: 8.69 (4.95–15.24) [1.20–62.69] | |
| HR: 0 IRR: 0 OR: 1 | HR: 0 IRR: 0 OR: 17 | Latin America | HR: NA IRR: NA OR: 3.73 (2.18–6.38) | |
| HR: 0 IRR: 0 OR: 0 | HR: 0 IRR: 0 OR: 0 | American Indians/Islands | HR: NA IRR: NA OR: NA | |
| HR: 9 IRR: 6 OR: 15 | HR: 2818 IRR: 5115 OR: 4574 | Overall | HR: 5.47 (3.50–8.54) [1.09–27.56] IRR: 6.82 (4.53–10.25) [2.03–22.87] OR: 6.60 (4.18–10.43) [0.93–46.82] | |
| CI: confidence interval; HR: hazard ratio;IFG6.1 : impaired fasting glucose 6.1 mmol/L threshold; IRR: incidence rate ratio; NA: not applicable; N/M: fewer than 3 studies or calculation of the 95% prediction interval did not provide a meaningful estimate; OR: odds ratio; T2DM: type 2 diabetes mellitus. | ||||
| GRADE Working Group grades of evidence | ||||
| aWith phase 2 explanatory studies aiming to confirm independent associations between the prognostic factor and the outcome, GRADE starts with 'high quality' (Huguet 2013). We assumed the GRADE factor publication bias was inherent with this type of research (phase 2 design), so we did not use it as a potential downgrading factor | ||||
| Outcome: development of T2DM | ||||
| No of studies | No of participants with intermediate hyperglycaemia | Geographic region/special population | Estimated effect (95% CI) | Overall certainty of the evidence (GRADE)a |
| HR: 3 IRR: 5 OR: 6 | HR: 1780 IRR: 14,809 OR: 1226 | Asia/Middle East | HR: 4.48 (2.81–7.15) [N/M] IRR: 3.93 (3.03–5.10) [1.71–9.02] OR: 3.74 (2.83–4.94) [1.70–8.21] | ⊕⊕⊝⊝ |
| HR: 2 IRR: 5 OR: 11 | HR: 2230 IRR: 2572 OR: 1481 | Australia/Europe/North America | HR: 2.53 (1.52–4.19) [N/M] IRR: 5.93 (4.11–8.57) [2.38–14.81] OR: 5.20 (3.62–7.45) [1.50–18.09] | |
| HR: 0 IRR: 0 OR: 2 | HR: 0 IRR: 0 OR: 381 | Latin America | HR: NA IRR: NA OR: 4.94 (3.15–7.76) [N/M] | |
| IRR: 2 | IRR: 1087 | American Indians/Islands | IRR: 4.46 (3.12–6.38) [N/M] OR: 3.60 (1.40–9.26) HR: NA | |
| HR: 5 IRR: 12 OR: 20 | HR: 4010 IRR: 18,468 OR: 3139 | Overall | HR: 3.61 (2.31–5.64) [0.69–18.97] IRR: 4.48 (3.59–5.44) [2.60–7.70] OR: 4.61 (3.76–5.64) [2.10–10.13] | |
| CI: confidence interval; HR: hazard ratio;IGT: impaired glucose tolerance; IRR: incidence rate ratio; NA: not applicable; N/M: fewer than 3 studies or calculation of the 95% prediction interval did not provide a meaningful estimate; T2DM: type 2 diabetes mellitus. | ||||
| GRADE Working Group grades of evidence | ||||
| aWith phase 2 explanatory studies aiming to confirm independent associations between the prognostic factor and the outcome, GRADE starts with 'high quality' (Huguet 2013). We assumed the GRADE factor publication bias was inherent with this type of research (phase 2 design), so we did not use it as a potential downgrading factor | ||||
| Outcome: development of T2DM | ||||
| No of studies | No of participants with intermediate hyperglycaemia | Geographic region/special population | Estimated effect (95% CI) | Overall certainty of the evidence (GRADE)a |
| HR: 3 IRR: 4 OR: 3 | HR: 461 IRR: 3166 OR: 498 | Asia/Middle East | HR: 10.20 (5.45–19.09) [N/M] IRR: 11.20 (5.59–22.43) [N/M] OR: 6.99 (3.09–15.83) [N/M] | ⊕⊕⊝⊝ |
| HR: 1 IRR: 4 OR: 6 | HR: 221 IRR: 699 OR: 154 | Australia/Europe/North America | HR: 3.80 (2.30–6.28) [N/M] IRR: 13.92 (9.99–19.40) [6.71–28.85] OR: 20.95 (12.40–35.40) [4.93–89.05] | |
| HR: 0 IRR: 0 OR: 0 | HR: 0 IRR: 0 OR: 0 | Latin America | HR: NA IRR: NA OR: NA | |
| HR: 1 IRR: 1 | HR: 356 IRR: 605 | American Indians/Islands | HR: 4.06 (3.05–5.40) IRR: 5.18 (3.42–7.83) | |
| HR: 5 IRR: 9 OR: 9 | HR: 1038 IRR: 4470 OR: 652 | Overall | HR: 6.90 (4.15–11.45) [1.06–44.95] IRR: 10.94 (7.22–16.58) [2.58–46.46] OR: 13.14 (7.41–23.30) [1.84–93.66] | |
| CI: confidence interval; HR: hazard ratio;IFG: impaired fasting glucose; IGT: impaired glucose tolerance; IRR: incidence rate ratio; NA: not applicable; N/M: fewer than 3 studies or calculation of the 95% prediction interval did not provide a meaningful estimate; OR: odds ratio; T2DM: type 2 diabetes mellitus. | ||||
| GRADE Working Group grades of evidence | ||||
| aWith phase 2 explanatory studies aiming to confirm independent associations between the prognostic factor and the outcome, GRADE starts with 'high quality' (Huguet 2013). We assumed the GRADE factor publication bias was inherent with this type of research (phase 2 design), so we did not use it as a potential downgrading factor | ||||
| Outcome: development of T2DM | ||||
| No of studies | No of participants with intermediate hyperglycaemia | Geographic region/special population | Estimated effect (95% CI) | Overall certainty of the evidence (GRADE)a |
| HR: 3 IRR: 1 OR: 1 | HR: 3196 IRR: 1965 OR: 675 | Asia/Middle East | HR: 7.21 (5.14–10.11) [0.81–64.52] IRR: 6.62 (4.18–10.49) [N/M] OR: 4.54 (2.65–7.78) [N/M] | ⊕⊕⊝⊝ |
| HR: 1 IRR: 0 OR: 2 | HR: 2027 IRR: 0 OR: 231 | Australia/Europe/North America | HR: 2.71 (2.48–2.96) [N/M] IRR: NA OR: 4.38 (1.36–14.15) [N/M] | |
| HR: 0 IRR: 0 OR: 0 | HR: 0 IRR: 0 OR: 0 | Latin America | HR: NA IRR: NA OR: NA | |
| HR: 0 IRR: 0 OR: 0 | HR: 0 IRR: 0 OR: 0 | American Indians/Islands | HR: NA IRR: NA OR: NA | |
| HR: 4 IRR: 1 OR: 3 | HR: 5223 IRR: 1965 OR: 906 | Overall | HR: 5.55 (2.77–11.12) [0.23–141.18] IRR: 6.62 (4.18–10.49) [N/M] OR: 4.43 (2.20–8.88) [N/M] | |
| CI: confidence interval; HbA1c5.7 : glycosylated haemoglobin A1c 5.7% threshold; HR: hazard ratio;IRR: incidence rate ratio; NA: not applicable; N/M: fewer than 3 studies or calculation of the 95% prediction interval did not provide a meaningful estimate; OR: odds ratio; T2DM: type 2 diabetes mellitus. | ||||
| GRADE Working Group grades of evidence | ||||
| aWith phase 2 explanatory studies aiming to confirm independent associations between the prognostic factor and the outcome, GRADE starts with 'high quality' (Huguet 2013). We assumed the GRADE factor publication bias was inherent with this type of research (phase 2 design), so we did not use it as a potential downgrading factor | ||||
| Outcome: development of T2DM | ||||
| No of studies | No of participants with intermediate hyperglycaemia | Geographic region/special population | Estimated effect (95% CI) | Overall certainty of the evidence (GRADE)a |
| HR: 2 IRR: 0 OR: 1 | HR: 1040 IRR: 0 OR: 370 | Australia/Europe/North America | HR: 5.09 (1.69–15.37) [N/M] IRR: NA OR: 15.60 (6.90–35.27) [N/M] | ⊕⊕⊝⊝ |
| HR: 4 IRR: 0 OR: 1 | HR: 3492 IRR: 0 OR: 1103 | Asia/Middle East | HR: 13.12 (4.10–41.96) [N/M] IRR: NA OR: 23.20 (18.70–28.78) [N/M] | |
| HR: 0 IRR: 0 OR: 0 | HR: 0 IRR: 0 OR: 0 | Latin America | HR: NA IRR: NA OR: NA | |
| IRR: 0 | IRR: 0 HR: 0 | American Indians/Islands | IRR: NA OR: 5.89 (4.23–8.20) [N/M] HR: NA | |
| HR: 6 IRR: 0 OR: 3 | HR: 4532 IRR: 0 OR: 1594 | Overall | HR: 10.10 (3.59–28.43) [N/M] IRR: NA OR: 12.79 [4.56–35.85] [N/M] | |
| CI: confidence interval; HbA1c6.0 : glycosylated haemoglobin A1c 6.0% threshold; HR: hazard ratio;IRR: incidence rate ratio; NA: not applicable; N/M: fewer than 3 studies or calculation of the 95% prediction interval did not provide a meaningful estimate; OR: odds ratio; T2DM: type 2 diabetes mellitus. | ||||
| GRADE Working Group grades of evidence | ||||
| aWith phase 2 explanatory studies aiming to confirm independent associations between the prognostic factor and the outcome, GRADE starts with 'high quality' (Huguet 2013). We assumed the GRADE factor publication bias was inherent with this type of research (phase 2 design), so we did not use it as a potential downgrading factor | ||||
| Follow‐up time (years) | % (95% CI) cumulative T2DM incidence | % (95% CI) regression from IH to normoglycaemia | ||||||
| IFG5.6 | IFG6.1 | IGT | IFG + IGT | HbA1c5.7 | HbA1c6.0 | |||
| 1 | — | — | 13 (5–23) [3; 671] | 29 (23–36) [1; 207] | — | — | 59 (54–64) [2; 375] | |
| 2 | 2 (1–2) [1; 1335] | 11 (8–14) [2; 549] | 16 (9–26) [9; 1998] | — | — | — | 46 (36–55) [9; 2852] | |
| 3 | 17 (6–32) [3; 1091] | 9 (2–20) [3; 927] | 22 (18–27) [3; 417] | 34 (28–41) [1; 209] | — | 7 (5–10) [1; 370] | 41 (24–59) [7; 1356] | |
| 4 | 17 (13–22) [3; 800] | 30 (17–44) [2; 1567] | 22 (12–34) [5; 1042] | — | 14 (7–23) [3; 5352] | 44 (40–48) [2; 627] | 33 (26–40) [3; 807] | |
| 5 | 18 (10–27) [7; 3530] | 26 (19–33) [11; 3837] | 39 (25–53) [12; 3444] | 50 (37–63) [5; 478] | 25 (18–32) [4; 3524] | 38 (26–51) [3; 1462] | 34 (27–42) [9; 2603] | |
| 6 | 22 (15–31) [4; 738] | 37 (31–43) [5; 279] | 29 (25–34) [7; 775] | 58 (48–67) [4; 106] | 17 (14–20) [1; 675] | — | 23 (3–53) [5; 1328] | |
| 7 | 18 (8–30) [5; 980] | 15 (0–45) [4; 434] | 19 (13–26) [5; 835] | 32 (20–45) [4; 753] | 21 (16–27) [1; 207] | — | 41 (37–45) [4; 679] | |
| 8 | 34 (27–40) [2; 1887] | 48 (31–66) [1;29] | 43 (37–49) [4; 1021] | 52 (47–57) [1; 356] | — | — | 39 (33–44) [2; 328] | |
| 9 | 38 (10–70) [3; 1356] | — | 53 (45–60) [1; 163] | 84 (74–91) [1; 69] | — | — | 17 (14–22) [1; 299] | |
| 10 | 23 (14–33) [6; 1542] | 29 (17–43) [6; 537] | 26 (17–37) [6; 443] | 30 (17–44) [2; 49] | 31 (29–33) [2; 2854] | — | 42 (22–63) [7; 894] | |
| 11 | — | 38 (33–43) [1; 402] | 46 (43–49) [1; 1253] | — | — | — | 28 (17–39) [2; 736] | |
| 12 | 31 (19–34) [3; 433] | 31 (28–33) [1; 1382] | 41 (38–43) [2; 1552] | 70 (63–76) [2; 207] | — | — | — | |
| 15 | — | — | — | — | — | 29 (19–40) [1; 70] | — | |
| 20 | — | — | 60 (5–68) [1; 114] | — | — | — | — | |
| CI: confidence interval; HbA1c: glycosylated haemoglobin A1c; HbA1c5.7/6.0 (threshold 5.7% or 6.0%); IFG5.6/6.1 : impaired fasting glucose (threshold 5.6 mmol/L or 6.1 mmol/L); IGT: impaired glucose tolerance; IFG + IGT: both IFG and IGT; IH: intermediate hyperglycaemia; T2DM: type 2 diabetes mellitus | ||||||||
| Ratio (95% CI) [no of studies; no of participants with IH/no of participants with normoglycaemia] | |||||||
| Hazard ratio | |||||||
| Region | IFG5.6 cohort | IFG6.1 cohort | IGT cohort | IFG + IGT cohort | HbA1c5.7 cohort | HbA1c6.0 cohort | HbA1c5.7 + IFG5.6 cohort |
| Asia/Middle East | 5.07 (3.41‐7.53) 1.07–24.02 [4; 2385/12,837] | 10.55 (3.61–30.81) NAb [5; 1054/9756] | 4.48 (2.81–7.15) NAb [3; 1780/6695] | 10.20 (5.45–19.09) NAb [3; 461/6695] | 7.21 (5.14–10.11) 0.81–64.52 [3; 3196/13,609] | 13.12 (4.10–41.96) NAb [4; 3492/19,242] | 32.50 (23.00–45.92)c NAa [1; 410/4149] |
| Australia/Europe/North America | 4.15 (1.24–13.87) NAb [3; 5685/12,837] | 3.30 (2.32–4.67) 0.84–12.99 [4; 1736/8835] | 2.53 (1.52–4.19) NAa [2; 2230/5871] | 3.80 (2.30–6.28) NAa [1; 221/1429] | 2.71 (2.48–2.96) NAa [1: 2027/6215] | 5.09 (1.69–15.37) NAa [2; 1040/6925] | — |
| Latin America | — | 2.06 (1.76–2.41) NAb | — | — | — | — | — |
| American Indians/Islands | 2.38 (1.85–3.06) NAa [1; 947/595] | — | — | 4.06 (3.05–5.40) NAa [1; 356/595] | — | — | — |
| Overall | 4.32 (2.61–7.12) 0.75–25.01 [8; 9017/25,850] | 5.47 (3.50–8.54) 1.09–27.56 [9; 2818/18,591] | 3.61 (2.31–5.64) 0.69–18.97 [5; 4010/12,566] | 6.90 (4.15–11.45) 1.06–44.95 [5; 1038/8719] | 5.55 (2.77–11.12) 0.23–141.18 [4; 5223/19,824] | 10.10 (3.59–28.43) NAb [6; 4532/26,167] | 32.50 (23.00–45.92) NAa [1; 410/4149] |
| Incidence rate ratio | |||||||
| Region | IFG5.6 cohort | IFG6.1 cohort | IGT cohort | IFG + IGT cohort | HbA1c5.7 cohort | HbA1c6.0 cohort | HbA1c5.7 + IFG5.6 cohort |
| Asia/Middle East | 5.23 (3.77–7.25) 1.72–15.89 [6; 15,661/145,597] | 3.62 (1.67–7.83) NAa [2; 1677/36,334] | 3.93 (3.03–5.10) 1.71–9.02 [5; 14,809/73,128] | 11.20 (5.59–22.43) NAb [4; 3166/69,463] | 6.62 (4.18–10.49) NAa [1; 1965/19961] | — | 40.72 (29.30–56.61) NAa [1; 1641/19,961] |
| Australia/Europe/North America | 4.96 (3.25–7.57) 0.32–77.24 [3; 6322/8062] | 8.55 (6.37–11.48) 4.37–16.73 [4; 3438/20,246] | 5.93 (4.11–8.57) 2.38–14.81 [5; 2572/22,329] | 13.92 (9.99–19.40) 6.71–28.85 [4; 699/18,966] | — | — | — |
| Latin America | — | — | — | — | — | — | — |
| American Indians/Islands | 2.74 (1.88–3.99) NAa [1; 2374/1613] | — | 4.46 (3.12–6.38) NAa [2; 1087/2952] | 5.18 (3.42–7.83) NAa [1; 605/1613] | — | — | — |
| Overall | 4.81 (3.67–6.30) 1.95–11.83 [10; 24,357/155,272] | 6.82 (4.53–10.25) 2.03–22.87 [6; 5115/56,580] | 4.48 (3.69–5.44) 2.60–7.70 [12; 18,468/98,409] | 10.94 (7.22–16.58) 2.58–46.46 [9; 4470/90,072] | 6.62 (4.18–10.5) NAa [1; 1965/19961] | — | 40.72 (29.30–56.61) NAa [1; 1641/19,961] |
| Odds ratio | |||||||
| IFG5.6 cohort | IFG6.1 cohort | IGT cohort | IFG + IGT cohort | HbA1c5.7 cohort | HbA1c6.0 cohort | HbA1c5.7 + IFG5.6 cohort | |
| Asia/Middle East | 2.94 (1.77–4.86) 0.43–19.93 [10; 6359/28,218] | 5.18 (2.32–11.53) 0.29–91.37 [7; 3317/25,604] | 3.74 (2.83–4.94) 1.70–8.21 [6; 1226/7417] | 6.99 (3.09–15.83) NAb [3; 498/3704] | 4.54 (2.65–7.78) NAa [1; 675/462] | 23.20 (18.70–28.78) NAa [1; 1103/10,763] | 46.70 (33.60–64.91) NAa [1; 1951/10,761] |
| Australia/Europe/North America | 6.47 (3.81–11.00) 0.99–42.32 [9; 1949/7920] | 8.69 (4.95–15.24) 1.20–62.69 [7; 1240/5094] | 5.20 (3.62–7.45) 1.50–18.09 [11; 1481/7684] | 20.95 (12.40–35.40) 4.93–89.05 [6; 154/5300] | 4.38 (1.36–14.15) NAa [2; 231/2100] | 15.60 (6.90–35.27) NAa [1; 370/5365] | 26.20 (16.30–41.11) NAa [1; 169/1125] |
| Latin America | 4.28 (3.21–5.71) NAa [1; 65/1594] | 3.73 (2.18–6.38) NAa [1; 17/1594] | 4.94 (3.15–7.76) NAa [2; 381/3097] | — | — | — | — |
| American Indians/Islands | 3.12 (2.31–4.21) NAa [1; 947/595] | — | 3.60 (1.40–9.26) NAa [1; 51/215] | — | — | 5.89 (4.23–8.20) NAa [1; 121/595] | — |
| Overall | 4.15 (2.75–6.28) 0.54–32.00 [21; 9320/38,327] | 6.60 (4.18–10.43) 0.93–46.82 [15; 4574/32,292] | 4.61 (3.76–5.64) 2.10–10.13 [20; 3139/18,413] | 13.14 (7.41–23.30) 1.84–93.66 [9; 652/9004] | 4.43 (2.20–8.88) NAb [3; 906/2562] | 12.8 [4.56–35.9] NAb [3; 1594/16,723] | 35.91 (20.43–63.12) NAa [2; 2120/11,886] |
| CI: confidence interval; HbA1c: glycosylated haemoglobin A1c; HbA1c5.7/6.0 (threshold 5.7% or 6.0%); HbA1c5.7 + IFG5.6 : both HbA1c5.7 and IFG5.6; IFG5.6/6.1 : impaired fasting glucose (threshold 5.6 mmol/L or 6.1 mmol/L); IGT: impaired glucose tolerance; IFG + IGT: both IFG and IGT; IH: intermediate hyperglycaemia; NA: not applicable; T2DM: type 2 diabetes mellitus; NR: not reported | |||||||
| Outcome or subgroup title | No. of studies | No. of participants | Statistical method | Effect size |
| 1 T2DM incidence (IFG5.6) Show forest plot | 8 | 34867 | Hazard Ratio (Random, 95% CI) | 4.32 [2.61, 7.12] |
| 1.1 Asia/Middle East | 4 | 14803 | Hazard Ratio (Random, 95% CI) | 5.07 [3.41, 7.53] |
| 1.2 Australia/Europe/North America | 3 | 18522 | Hazard Ratio (Random, 95% CI) | 4.15 [1.24, 13.87] |
| 1.3 American Indians/Islands | 1 | 1542 | Hazard Ratio (Random, 95% CI) | 2.38 [1.85, 3.06] |
| 2 T2DM incidence (IFG6.1) Show forest plot | 10 | 21475 | Hazard Ratio (Random, 95% CI) | 5.47 [3.50, 8.54] |
| 2.1 Asia/Middle East | 5 | 10810 | Hazard Ratio (Random, 95% CI) | 10.55 [3.61, 30.81] |
| 2.2 Australia/Europe/North America | 4 | 10571 | Hazard Ratio (Random, 95% CI) | 3.30 [2.32, 4.67] |
| 2.3 Latin America | 1 | 94 | Hazard Ratio (Random, 95% CI) | 2.06 [1.76, 2.41] |
| 3 T2DM incidence (IGT) Show forest plot | 5 | 16576 | Hazard Ratio (Random, 95% CI) | 3.61 [2.31, 5.64] |
| 3.1 Asia/Middle East | 3 | 8475 | Hazard Ratio (Random, 95% CI) | 4.48 [2.81, 7.15] |
| 3.2 Australia/Europe/North America | 2 | 8101 | Hazard Ratio (Random, 95% CI) | 2.53 [1.52, 4.19] |
| 4 T2DM incidence (IFG + IGT) Show forest plot | 5 | 9757 | Hazard Ratio (Random, 95% CI) | 6.90 [4.15, 11.45] |
| 4.1 Asia/Middle East | 3 | 7156 | Hazard Ratio (Random, 95% CI) | 10.20 [5.45, 19.09] |
| 4.2 Australia/Europe/North America | 1 | 1650 | Hazard Ratio (Random, 95% CI) | 3.80 [2.30, 6.28] |
| 4.3 American Indians/Islands | 1 | 951 | Hazard Ratio (Random, 95% CI) | 4.06 [3.05, 5.40] |
| 5 T2DM incidence (HbA1c5.7) Show forest plot | 4 | 25047 | Hazard Ratio (Random, 95% CI) | 5.55 [2.77, 11.12] |
| 5.1 Asia | 3 | 16805 | Hazard Ratio (Random, 95% CI) | 7.21 [5.14, 10.11] |
| 5.2 Australia/Europe/North America | 1 | 8242 | Hazard Ratio (Random, 95% CI) | 2.71 [2.48, 2.96] |
| 6 T2DM incidence (HbA1c6.0) Show forest plot | 6 | 30699 | Hazard Ratio (Random, 95% CI) | 10.10 [3.59, 28.43] |
| 6.1 Asia/Middle East | 4 | 22734 | Hazard Ratio (Random, 95% CI) | 13.12 [4.10, 41.96] |
| 6.2 Australia/Europe/North America | 2 | 7965 | Hazard Ratio (Random, 95% CI) | 5.09 [1.69, 15.37] |
| 7 T2DM incidence (HbA1c + IFG) Show forest plot | 1 | Hazard Ratio (Fixed, 95% CI) | Subtotals only | |
| 7.1 HbA1c5.7 + IFG5.6 | 1 | 4559 | Hazard Ratio (Fixed, 95% CI) | 32.50 [23.00, 45.92] |
| 7.2 HbA1c5.7 + IFG6.1 | 1 | 5357 | Hazard Ratio (Fixed, 95% CI) | 37.90 [28.10, 51.12] |
| 7.3 HbA1c6.0 + IFG5.6 | 1 | 4628 | Hazard Ratio (Fixed, 95% CI) | 53.70 [38.40, 75.09] |
| 7.4 HbA1c6.0 + IFG6.1 | 1 | 5802 | Hazard Ratio (Fixed, 95% CI) | 52.30 [37.80, 72.37] |
| Outcome or subgroup title | No. of studies | No. of participants | Statistical method | Effect size |
| 1 T2DM incidence (IFG5.6) Show forest plot | 21 | 47647 | Odds Ratio (Random, 95% CI) | 4.15 [2.75, 6.28] |
| 1.1 Asia/Middle East | 10 | 34577 | Odds Ratio (Random, 95% CI) | 2.94 [1.77, 4.86] |
| 1.2 Australia/Europe/North America | 9 | 9869 | Odds Ratio (Random, 95% CI) | 6.47 [3.81, 11.00] |
| 1.3 Latin America | 1 | 1659 | Odds Ratio (Random, 95% CI) | 4.28 [3.21, 5.71] |
| 1.4 American Indians/Islands | 1 | 1542 | Odds Ratio (Random, 95% CI) | 3.12 [2.31, 4.21] |
| 2 T2DM incidence (IFG6.1) Show forest plot | 15 | 36866 | Odds Ratio (Random, 95% CI) | 6.60 [4.18, 10.43] |
| 2.1 Asia/Middle East | 7 | 28921 | Odds Ratio (Random, 95% CI) | 5.18 [2.32, 11.53] |
| 2.2 Australia/Europe/North America | 7 | 6334 | Odds Ratio (Random, 95% CI) | 8.69 [4.95, 15.24] |
| 2.3 Latin America | 1 | 1611 | Odds Ratio (Random, 95% CI) | 3.73 [2.18, 6.38] |
| 3 T2DM incidence (IGT) Show forest plot | 20 | 21552 | Odds Ratio (Random, 95% CI) | 4.61 [3.76, 5.64] |
| 3.1 Asia/Middle East | 6 | 8643 | Odds Ratio (Random, 95% CI) | 3.74 [2.83, 4.94] |
| 3.2 Australia/Europe/North America | 11 | 9165 | Odds Ratio (Random, 95% CI) | 5.20 [3.62, 7.45] |
| 3.3 Latin America | 2 | 3478 | Odds Ratio (Random, 95% CI) | 4.94 [3.15, 7.76] |
| 3.4 American Indians/Islands | 1 | 266 | Odds Ratio (Random, 95% CI) | 3.60 [1.40, 9.26] |
| 4 T2DM incidence (IFG + IGT) Show forest plot | 9 | 9656 | Odds Ratio (Random, 95% CI) | 13.14 [7.41, 23.30] |
| 4.1 Asia/Middle East | 3 | 4202 | Odds Ratio (Random, 95% CI) | 6.99 [3.09, 15.83] |
| 4.2 Australia/Europe/North America | 6 | 5454 | Odds Ratio (Random, 95% CI) | 20.95 [12.40, 35.40] |
| 5 T2DM incidence (HbA1c5.7) Show forest plot | 3 | 3468 | Odds Ratio (Random, 95% CI) | 4.43 [2.20, 8.88] |
| 5.1 Asia/Middle East | 1 | 1137 | Odds Ratio (Random, 95% CI) | 4.54 [2.65, 7.78] |
| 5.2 Europe/North America | 2 | 2331 | Odds Ratio (Random, 95% CI) | 4.38 [1.36, 14.15] |
| 6 T2DM incidence (HbA1c6.0) Show forest plot | 3 | 18317 | Odds Ratio (Random, 95% CI) | 12.79 [4.56, 35.85] |
| 6.1 Asia/Middle East | 1 | 11866 | Odds Ratio (Random, 95% CI) | 23.20 [18.70, 28.78] |
| 6.2 Australia/Europe/North America | 1 | 5735 | Odds Ratio (Random, 95% CI) | 15.60 [6.90, 35.27] |
| 6.3 American Indians/Islands | 1 | 716 | Odds Ratio (Random, 95% CI) | 5.89 [4.23, 8.20] |
| 7 T2DM incidence (HbA1c5.7 + IFG5.6) Show forest plot | 2 | 14006 | Odds Ratio (Random, 95% CI) | 35.91 [20.43, 63.12] |
| 7.1 Australia/Europe/North America | 1 | 1294 | Odds Ratio (Random, 95% CI) | 26.20 [16.30, 42.11] |
| 7.2 Asia/Middle East | 1 | 12712 | Odds Ratio (Random, 95% CI) | 46.70 [33.60, 64.91] |