Development of type 2 diabetes mellitus in people with intermediate hyperglycaemia
Appendices
Appendix 1. Glossary of terms
| Abbreviation | Explanation |
| ADA | American Diabetes Association |
| ALAT | Alanine aminotransferase |
| ASAT | Aspartate transaminase |
| BG | Blood glucose |
| BMI | Body mass index |
| BW | Body weight |
| CI | Confidence interval |
| FG | Fasting glucose |
| FBG | Fasting blood glucose |
| FINDRISC | Finnish Diabetes Risk Score |
| FPG | Fasting plasma glucose |
| G6PD | Glucose‐6‐P‐dehydrogenase test |
| HbA1c | Glycosylated haemoglobin A1c |
| HbA1c5.7 | Intermediate hyperglycaemia with HbA1c level 5.7%‐6.4% at baseline (HbA1c 5.7% threshold) |
| HbA1c6.0 | Intermediate hyperglycaemia with HbA1c level 6.0%‐6.4% at baseline (HbA1c 6.0% threshold) |
| h‐CRP | High‐sensitivity C‐reactive protein |
| HOMA‐B(eta) | Homeostatic model assessment beta‐cell function |
| HOMA‐IR | Homeostatic model assessment for insulin resistance |
| HR | Hazard ratio |
| ICTRP | International Clinical Trials Registry Platform |
| IEC | International Expert Committee |
| IFG | Impaired fasting glucose |
| IFG5.6 | Intermediate hyperglycaemia with impaired fasting plasma glucose level 5.6–6.9 mmol/L at baseline (IFG 5.6 mmol/L threshold) |
| IFG6.1 | Intermediate hyperglycaemia with impaired fasting plasma glucose level 6.1–6.9 mmol/L at baseline (IFG 6.1 mmol/L threshold) |
| IFG/IGT | Combination of both IFG and IGT |
| i‐IFG | Isolated IFG |
| IGT | Impaired glucose tolerance (intermediate hyperglycaemia defined by IGT: plasma glucose 7.8–11.1 mmol/L 2 hours after a 75 g OGTT at baseline) |
| i‐IGT | Isolated IGT |
| IQR | Interquartile range |
| IRR | Incidence rate ratio |
| JDS | Japanese Diabetes Society |
| M | Men |
| NCEP | National cholesterol education program |
| NDDG | National Diabetes Data Group |
| NGSP | National Glycohemoglobin Standardization Program |
| NGT | Normal glucose tolerance |
| OGTT | Oral glucose tolerance test |
| OR | Odds ratio |
| PG | Postload glucose |
| QUIPS | Quality In Prognosis Studies tool |
| ROC | Receiver operating characteristics |
| RR | Risk ratio, relative risk |
| SD | Standard deviation |
| SE | Standard error |
| T2DM | Type 2 diabetes mellitus |
| W | Women |
| WHO | World Health Organization |
| γ‐GT | Gamma‐glutamyl transferase/transpeptidase |
Appendix 2. Search strategies
| Search strategy overview |
| Tier 1: prediabetes as predictor for CVD, mortality, stroke, cancer, micro/macrovascular complications ( 1. Population block (prediabetes AND prognosis filter) OR 2. Prediabetes risk factors / diagnostic criteria block ((IFG, IGT, HbA1c) ADJ6 prognosis terms) ) AND 3. Outcomes block (diabetes complications, micro/macrovascular, mortality) Tier 2: prediabetes as predictor for diabetes incidence ( 1. Population block (prediabetes AND prognosis filter) OR 2. Prediabetes risk factors / diagnostic criteria block ((IFG, IGT, HbA1c) ADJ6 prognosis terms) ) AND 3. Outcomes block (diabetes incidence) |
| MEDLINE (Ovid SP) |
| Whole strategy (combining tier 1: 'prediabetes' as predictor for cardiovascular disease, mortality, stroke, cancer, micro/macrovascular complications and tier 2: 'prediabetes' as predictor for diabetes incidence) 1. Prediabetic state/ 2. (prediabet* or pre diabet*).tw. 3. intermediate hyperglyc?emi*.tw. 4. or/1‐3 5. incidence.sh. or exp mortality/ or follow‐up studies.sh. or prognos*.tw. or predict*.tw. or course*.tw. [Wilczynski 2004: MEDLINE prognosis filter sensitivity maximizing] 6. prognosis/ or diagnosed.tw. or cohort*.mp. or predictor*.tw. or death.tw. or exp models, statistical/ [Wilczynski 2004: MEDLINE prognosis filter best balance] 7. or/5‐6 8. 4 and 7 [population block (prediabetes + prognosis filter)] 9. ((impaired fasting adj2 glucose) or IFG or (impaired adj FPG)).tw. 10. (impaired glucose tolerance or IGT).tw. 11. ("HbA(1c)" or HbA1 or HbA1c or "HbA 1c" or ((glycosylated or glycated) adj h?emoglobin)).tw. 12. or/9‐11 13. (predict* or associa* or prognos*).tw. 14. ((prognostic or predict*) adj2 model?).tw. 15. predictive value?.tw. 16. (risk adj (predict* or factor? or score)).tw. 17. or/13‐16 18. (((impaired fasting adj2 glucose) or IFG or "impaired FPG" or impaired glucose tolerance or IGT or "HbA(1c)" or HbA1 or HbA1c or "HbA 1c" or ((glycosylated or glycated) adj h?emoglobin)) adj3 (predict* or associa* or prognos* or ((prognostic or predict*) adj2 model?) or predictive value? or (risk adj (predict* or factor? or score)))).tw. [12 adj3 17 // risk factor block] 19. 8 or 18 [block 1 or block 2] 20. complication?.tw. 21. mortality.tw. 22. (CHD or CVD).tw. 23. (coronary adj2 disease).tw. 24. (coronar* adj (event? or syndrome?)).tw. 25. (heart adj (failure or disease? or attack? or infarct*)).tw. 26. (myocardial adj (infarct* or isch?emi*)).tw. 27. cardiac failure.tw. 28. angina.tw. 29. revasculari*.tw. 30. (stroke or strokes).tw. 31. cerebrovascular.tw. 32. ((brain* or cerebr*) adj (infarct* or isch?emi*)).tw. 33. apoplexy.tw. 34. ((vascular or peripheral arter*) adj disease?).tw. 35. cardiovascular.tw. 36. (neuropath* or polyneuropath*).tw. 37. (retinopath* or maculopath*).tw. 38. (nephropath* or nephrotic or proteinuri* or albuminuri*).tw. 39. ((kidney or renal) adj (disease? or failure or transplant*)).tw. 40. ((chronic or endstage or end stage) adj (renal or kidney)).tw. 41. (CRD or CRF or CKF or CRF or CKD or ESKD or ESKF or ESRD or ESRF).tw. 42. (microvascular or macrovascular or ((micro or macro) adj vascular)).tw. 43. (cancer or carcino* or neoplas* or tumo?r?).tw. 44. (amputation? or ulcer* or foot or feet or wound*).tw. 45. or/20‐44 [tier 1 strategy outcomes block] 46. 19 and 45 47. ((diabet* or type 2 or type II or T2D*) adj4 (progress* or inciden* or conversion or develop* or future)).tw. [tier 2 strategy outcomes block] 48. 19 and 47 49. 46 or 48 50. exp animals/ not humans/ 51. 49 not 50 52. (gestational or PCOS).tw. 53. 51 not 52 54. (comment or letter or editorial).pt. 55. 53 not 54 56. remove duplicates from 55 |
| Embase (Ovid SP) |
| Whole strategy (combining tier 1: 'prediabetes' as predictor for cardiovascular disease, mortality, stroke, cancer, micro/macrovascular complications and tier 2: 'prediabetes' as predictor for diabetes incidence) 1. (prediabet* or pre diabet*).tw. 2. intermediate hyperglyc?emi*.tw. 3. or/1‐2 4. exp disease course or risk*.mp. or diagnos*.mp. or follow‐up.mp. or ep.fs. or outcome.tw. [Wilczynski 2005: Embase prognosis filter sensitivity maximizing] 5. follow‐up.mp. or prognos*.tw. or ep.fs. [Wilczynski 2005: Embase prognosis filter best balance] 6. or/4‐5 7. 3 and 6 [population block (prediabetes + prognosis filter)] 8. ((impaired fasting adj2 glucose) or IFG or (impaired adj FPG)).tw. 9. (impaired glucose tolerance or IGT).tw. 10. ("HbA(1c)" or HbA1 or HbA1c or "HbA 1c" or ((glycosylated or glycated) adj h?emoglobin)).tw. 11. or/8‐10 12. (predict* or associa* or prognos*).tw. 13. ((prognostic or predict*) adj2 model?).tw. 14. predictive value?.tw. 15. (risk adj (predict* or factor? or score)).tw. 16. or/12‐15 17. (((impaired fasting adj2 glucose) or IFG or "impaired FPG" or impaired glucose tolerance or IGT or "HbA(1c)" or HbA1 or HbA1c or "HbA 1c" or ((glycosylated or glycated) adj h?emoglobin)) adj3 (predict* or associa* or prognos* or ((prognostic or predict*) adj2 model?) or predictive value? or (risk adj (predict* or factor? or score)))).tw. [12 adj3 17 // risk factor block] 18. 7 or 17 [block 1 or block 2] 19. complication?.tw. 20. mortality.tw. 21. (CHD or CVD).tw. 22. (coronary adj2 disease).tw. 23. (coronar* adj (event? or syndrome?)).tw. 24. (heart adj (failure or disease? or attack? or infarct*)).tw. 25. (myocardial adj (infarct* or isch?emi*)).tw. 26. cardiac failure.tw. 27. angina.tw. 28. revasculari*.tw. 29. (stroke or strokes).tw. 30. cerebrovascular.tw. 31. ((brain* or cerebr*) adj (infarct* or isch?emi*)).tw. 32. apoplexy.tw. 33. ((vascular or peripheral arter*) adj disease?).tw. 34. cardiovascular.tw. 35. (neuropath* or polyneuropath*).tw. 36. (retinopath* or maculopath*).tw. 37. (nephropath* or nephrotic or proteinuri* or albuminuri*).tw. 38. ((kidney or renal) adj (disease? or failure or transplant*)).tw. 39. ((chronic or endstage or end stage) adj (renal or kidney)).tw. 40. (CRD or CRF or CKF or CRF or CKD or ESKD or ESKF or ESRD or ESRF).tw. 41. (microvascular or macrovascular or ((micro or macro) adj vascular)).tw. 42. (cancer or carcino* or neoplas* or tumo?r?).tw. 43. (amputation? or ulcer* or foot or feet or wound*).tw. 44. or/19‐43 [tier 1 strategy outcomes block] 45. 18 and 44 46. ((diabet* or type 2 or type II or T2D*) adj4 (progress* or inciden* or conversion or develop* or future)).tw. [tier 2 strategy outcomes block] 47. 18 and 46 48. 45 or 47 [49‐53: TSC Portal filter for exclusion of animal references] 49. exp animals/ or exp invertebrate/ or animal experiment/ or animal model/ or animal tissue/ or animal cell/ or nonhuman/ 50. human/ or normal human/ or human cell/ 51. 49 and 50 52. 49 not 51 53. 48 not 52 54. (gestational or PCOS).tw. 55. 53 not 54 56. (comment or letter or editorial or conference).pt. 57. 55 not 56 58. remove duplicates from 57 |
| ClinicalTrials.gov (Expert search) |
| ( prediabetes OR prediabetic OR "pre diabetes" OR "pre diabetic" OR "intermediate hyperglycemia" OR "intermediate hyperglycaemia" OR "intermediate hyperglycemic" OR "intermediate hyperglycaemic" OR "impaired glucose tolerance" OR "impaired fasting glucose" ) AND ( complication OR complications OR mortality OR CHD OR CVD OR coronary OR heart OR myocardial OR infarct OR infarction OR infarcts OR infarctions OR ischemia OR ischemic OR ischaemia OR ischaemic OR failure OR angina OR revascularization OR revascularisation OR revascularizations OR revascularisations OR stroke OR strokes OR cerebrovascular OR apoplexy OR vascular or peripheral OR cardiovascular OR neuropathy OR neuropathies OR polyneuropathy OR polyneuropathies OR retinopathy OR retinopathies OR maculopathy OR maculopathies OR nephropathy OR nephropathies OR nephrotic OR proteinuria OR proteinuric OR albuminuria OR kidney OR renal OR CRD OR CRF OR CKF OR CRF OR CKD OR ESKD OR ESKF OR ESRD OR ESRF OR microvascular OR macrovascular OR "micro vascular" OR "macro vascular" OR cancer OR carcinoma OR neoplasm OR neoplasms OR tumor OR tumors OR tumour OR tumours OR amputation OR amputations OR ulcer OR foot OR feet OR wounds OR ( diabetes OR diabetic OR "type 2" OR "type II" OR T2D OR T2DM ) AND ( progress OR progression OR progressed OR incident OR incidence OR conversion OR developed OR development OR future ) ) [OUTCOME] |
| ICTRP Search Portal (Standard search) |
| prediabet* AND prognos* OR prediabet* AND predict* OR prediabet* AND inciden* OR prediabet* AND mortality OR prediabet* AND prevent* OR prediabet* AND progress* OR prediabet* AND develop* OR pre diabet* AND prognos* OR pre diabet* AND predict* OR pre diabet* AND inciden* OR pre diabet* AND mortality OR pre diabet* AND prevent* OR pre diabet* AND progress* OR pre diabet* AND develop* OR impaired glucose tolerance AND prognos* OR impaired glucose tolerance AND predict* OR impaired glucose tolerance AND inciden* OR impaired glucose tolerance AND mortality OR impaired glucose tolerance AND prevent* OR impaired glucose tolerance AND progress* OR impaired glucose tolerance AND develop* OR impaired fasting glucose AND prognos* OR impaired fasting glucose AND predict* OR impaired fasting glucose AND inciden* OR impaired fasting glucose AND mortality OR impaired fasting glucose AND prevent* OR impaired fasting glucose AND progress* OR impaired fasting glucose AND develop* OR HbA* AND prognos* OR HbA* AND predict* OR HbA* AND inciden* OR HbA* AND mortality OR HbA* AND prevent* OR HbA* AND progress* OR HbA* AND develop* |
| Seed publications (for PubMed's 'similar articles'‐algorithm) |
| 24355200[PMID] OR 16873795[PMID] OR 9705020[PMID] OR 25906786[PMID] OR 9363520[PMID] OR 21278140[PMID] OR 21676480[PMID] OR 21300382[PMID] OR 10862313[PMID] OR 18689695[PMID] OR 27596059[PMID] OR 12397006[PMID] OR 18673544[PMID] OR 21307378[PMID] OR 15220202[PMID] OR 22647753[PMID] OR 28258520[PMID] OR 10663216[PMID] OR 20573752[PMID] OR 20622160[PMID] OR 9300248[PMID] OR 2060716[PMID] OR 27459384[PMID] OR 12757990[PMID] OR 10414941[PMID] OR 21335372[PMID] OR 9653617[PMID] OR 20073428[PMID] OR 17309402[PMID] OR 17315136[PMID] OR 14025561[PMID] OR 10466767[PMID] OR 26273669[PMID] OR 28698884[PMID] OR 11311100[PMID] OR 14710970[PMID] OR 27933333[PMID] OR 27543801[PMID] OR 2035513[PMID] OR 12062857[PMID] OR 11978676[PMID] OR 11679461[PMID] OR 19224196[PMID] OR 14693710[PMID] OR 28278309[PMID] OR 17257284[PMID] OR 7859632[PMID] OR 2689122[PMID] OR 10937506[PMID] OR 27515749[PMID] OR 20484131[PMID] OR 26675051[PMID] OR 8866565[PMID] OR 17032347[PMID] OR 11686540[PMID] OR 26606421[PMID] OR 18282630[PMID] OR 8635647[PMID] OR 9243105[PMID] OR 8886564[PMID] OR 7589843[PMID] OR 9028719[PMID] OR 2407581[PMID] OR 28751960[PMID] OR 2912042[PMID] OR 28043048[PMID] OR 11916954[PMID] OR 16344402[PMID] OR 19531260[PMID] OR 19414206[PMID] OR 1216390[PMID] OR 22456865[PMID] OR 22510023[PMID] OR 22955996[PMID] OR 21705064[PMID] OR 21212932[PMID] OR 28768835[PMID] OR 9162608[PMID] OR 17000944[PMID] OR 25814432[PMID] OR 9406673[PMID] OR 11110508[PMID] OR 27740930[PMID] OR 24843430[PMID] OR 16518992[PMID] OR 18486512[PMID] OR 29133894[PMID] OR 29380232[PMID] OR 8894485[PMID] OR 28951335[PMID] OR 5226858[PMID] OR 27368062[PMID] OR 16100444[PMID] OR 15223223[PMID] OR 18452257[PMID] OR 27085081[PMID] OR 25245975[PMID] OR 6706044[PMID] OR 20827664[PMID] OR 20536946[PMID] OR 11606173[PMID] OR 10587859[PMID] OR 14967156[PMID] OR 7782724[PMID] OR 9754834[PMID] OR 11079739[PMID] OR 28004008[PMID] OR 17320447[PMID] OR 11772900[PMID] OR 2260546[PMID] OR 26885316[PMID] OR 25215305[PMID] OR 29074816[PMID] OR 18206734[PMID] OR 12590020[PMID] OR 26575606[PMID] OR 22640983[PMID] OR 24135387[PMID] OR 26840038[PMID] OR 24992623[PMID] OR 18485514[PMID] OR 27749572[PMID] OR 14578254[PMID] OR 15616025[PMID] OR 7748921[PMID] OR 17989310[PMID] OR 28371687[PMID] OR 8112189[PMID] OR 12610034[PMID] OR 12765960[PMID] OR 11784224[PMID] OR 9829346[PMID] OR 6702817[PMID] OR 3516770[PMID] OR 18697630[PMID] OR 11437858[PMID] OR 8612442[PMID] OR 8070301[PMID] OR 8454106[PMID] OR 9203444[PMID] OR 12519316[PMID] OR 19414203[PMID] OR 8335178[PMID] OR 1892482[PMID] OR 2261821[PMID] OR 27515716[PMID] OR 15036828[PMID] OR 15983331[PMID] OR 8875091[PMID] OR 8720611[PMID] OR 3751746[PMID] OR 20508383[PMID] OR 17914548[PMID] OR 7497867[PMID] OR 16600415[PMID] OR 23283714[PMID] OR 21738002[PMID] OR 8922541[PMID] OR 25624343[PMID] OR 7481176[PMID] OR 12414877[PMID] OR 11106838[PMID] OR 3527626[PMID] OR 17143605[PMID] OR 18060659[PMID] OR 12627316[PMID] OR 20002472[PMID] OR 17259503[PMID] OR 11068083[PMID] OR 29018885[PMID] OR 3054559[PMID] OR 25350916[PMID] OR 21107436[PMID] OR 7075915[PMID] OR 19131461[PMID] OR 17536075[PMID] OR 18316395[PMID] OR 2752891[PMID] OR 20855549[PMID] OR 20200384[PMID] OR 23497506[PMID] OR 24083174[PMID] OR 10097917[PMID] OR 9405904[PMID] OR 3542644[PMID] OR 20978739[PMID] OR 15189364[PMID] OR 25962707[PMID] OR 27239315[PMID] OR 18226046[PMID] OR 12777437[PMID] OR 12582008[PMID] OR 8314414[PMID] OR 8482427[PMID] OR 6507426[PMID] OR 18535192[PMID] OR 10333940[PMID] OR 16990660[PMID] OR 19046200[PMID] OR 10812323[PMID] OR 10480514[PMID] OR 17536076[PMID] OR 18249214[PMID] OR 20934897[PMID] OR 28632742[PMID] OR 27810987[PMID] OR 18405128[PMID] OR 8680609[PMID] OR 20578203[PMID] OR 16720024[PMID] OR 15451912[PMID] OR 15533586[PMID] OR 21270194[PMID] OR 10333943[PMID] OR 27863979[PMID] OR 11781759[PMID] OR 15175438[PMID] OR 15793193[PMID] OR 11194248[PMID] OR 26913636[PMID] OR 7712700[PMID] OR 14578234[PMID] OR 21718910[PMID] OR 15161800[PMID] |
Appendix 3. QUIPS tool signalling questions
| Study ID | |
| Signalling question | Authors' judgement for 'yes' |
| Study participation: yes/noa/unclearb/NAc | |
| a. Adequate participation in the study by eligible people | NA: usually participants with information on glycaemic status and follow‐up data providing information on development of type 2 diabetes are selected from a greater study cohort (e.g. study evaluating several cardiovascular risk factors) |
| b. Description of the source population or population of interest | Source population for cohort with intermediate hyperglycaemia is clearly described |
| c. Description of the baseline study sample | Number of people with intermediate hyperglycaemia at baseline is clearly described |
| d. Adequate description of the sampling frame and recruitment | Way of establishing the source population, selection criteria and key characteristics of the source population clearly described |
| e. Adequate description of the period and place of recruitment | Time period and place of recruitment for both baseline and follow‐up examinations are clearly described |
| f. Adequate description of inclusion and exclusion criteria | Definiton of people with normoglycaemia, intermediate hyperglycaemia or diabetes mellitus and description of other inclusion and exclusion criteria |
| Study participation: risk of bias rating (high/low/unclear) | High: most items are answered with 'no'; Low: all items answered with 'yes'; Unclear: most items are answered with 'unclear' Note: potentially a single item may introduce a high risk of bias, depending on study specifics |
| Study attrition: yes/no/unclear/NA | |
| a. Adequate response rate for study participants | NA: usually participants with information on glycaemic status and follow‐up data providing information on development of type 2 diabetes are selected from a greater study cohort (e.g. study evaluating several cardiovascular risk factors) |
| b. Attempts to collect information on participants who dropped out described | Attempts to collect information on participants who dropped out are described (e.g. telephone contact, mail, registers) |
| c. Reasons for loss to follow‐up provided | Reasons on participants who dropped out are available (e.g. deceased participants between baseline and follow‐up, participants moving to another location) |
| d. Adequate description of participants lost to follow‐up | Key characteristics of participants lost to follow‐up are described (age, sex, glucose status at baseline, body mass index) |
| e. No important differences between participants who completed the study and those who did not | Study authors described differences between participants completing the study and those who did not as not important or information provided to judge the differences |
| Study attrition: risk of bias rating (high/low/unclear) | High: most items are answered with 'no'; Low: all items answered with 'yes'; Unclear: most items are answered with 'unclear' Note: potentially a single item may introduce a high risk of bias, depending on study specifics |
| Glycaemic status measurement: yes/no/unclear/NA | |
| a. Clear definition or description provided | Measurements for glycaemic status are provided (e.g. IFG, IGT, elevated HbA1c) |
| b. Adequately valid and reliable method of measurement | Ideally measurements for glycaemic status are repeated to ensure diagnosis, single measurements are accepted as well; technique for glucose measurement or HbA1c measurement described |
| c. Continuous variables reported or appropriate cut points used | Standard categories for intermediate hyperglycaemia (FPG 5.6–6.9 mmol/L (IFG5.6), FPG 6.1–6.9 mmol/L (IFG6.1), 2‐h PG 7.8 to < 11.0 mmol/L (IGT), HbA1c 6.0–6.4% (HbA1c6.0), HbA1c 5.7–6.4% (HbA1c5.7)) |
| d. Same method and setting of measurement used in all study participants | Measurements of glycaemic status are the same for all study participants |
| e. Adequate proportion of the study sample had complete data | NA: usually participants with information on glycaemic status and follow‐up data providing information on development of type 2 diabetes are selected from a greater study cohort (e.g. study evaluating several cardiovascular risk factors) |
| f. Appropriate methods of imputation were used for missing data | NA: missing laboratory measurements for glycaemic status cannot be reliably imputed |
| Glycaemic status measurement: risk of bias rating (high/low/unclear) | High: most items are answered with 'no'; Low: all items answered with 'yes'; Unclear: most items are answered with 'unclear' Note: potentially a single item may introduce a high risk of bias, depending on study specifics |
| Outcome measurement: yes/no/unclear | |
| a. Clear definition of the outcome provided | Measurement of type 2 diabetes mellitus has to be defined |
| b. Use of adequately valid and reliable method of outcome measurement | Measurement of type 2 diabetes mellitus: a glucose (FPG, PG) or HbA1c measurement has to be a part of the diagnosis (self‐reported diabetes alone will not be accepted) |
| c. Use of same method and setting of outcome measurement in all study participants | Measurements of type 2 diabetes mellitus are the same for all study participants |
| Outcome measurement: risk of bias rating (high/low/unclear) | High: most items are answered with 'no'; Low: all items answered with 'yes'; Unclear: most items are answered with 'unclear' Note: potentially a single item may introduce a high risk of bias, depending on study specifics |
| Study confounding: yes/no/unclear | |
| a. Measurement of all important confounders | Important confounders are: age, sex, family history of diabetes, 'ethnicity', body mass index, blood pressure and hypertension, smoking and drinking status, socioeconomic status, comedications and comorbidities, physical activity |
| b. Provision of clear definitions of the important confounders measured | Measurement of confounders has to be clearly described |
| c. Adequately valid and reliable measurement of all important confounders | Measurement of confounders is valid and reliable |
| d. Use of same method and setting of confounding measurement in all study participants | Measurements of confounders are the same for all study participants |
| e. Appropriate imputation methods used for missing confounders (if applicable) | Strategy to impute missing confounder data is described |
| f. Important potential confounders were accounted for in the study design | Methods section of the publication describes strategy to account for confounders |
| g. Important potential confounders were accounted for in the analysis | Important confounders are accounted for in multivariable logistic regression and Cox proportional hazards models |
| Study confounding measurement: risk of bias rating (high/low/unclear) | High: most items are answered with 'no'; Low: all items answered with 'yes'; Unclear: most items are answered with 'unclear' Note: potentially a single item may introduce a high risk of bias, depending on study specifics |
| Statistical analysis and reporting: yes/no/unclear/NA | |
| a. Sufficient presentation of data to assess the adequacy of the analytic strategy | Mean or median values, including confidence intervals or standard errors or standard deviations |
| b. Strategy for model building is appropriate and based on a conceptual framework or model | NA: we do not anticipate conceptual frameworks or explicit model building strategies for this type of research question (focusing on one prognostic factor only) |
| c. Statistical model is adequate for the study design | Mainly incidence rates, uni‐ and multivariate logistic regression, Cox proportional hazard model |
| d. No selective reporting of results | NA: development of type 2 diabetes mellitus and potentially regression to normoglycaemia from intermediate hyperglycaemia are the only outcomes; if missing the study will be excluded |
| Statistical analysis and reporting: risk of bias rating (high/low/unclear) | High: most items are answered with 'no'; Low: all items answered with 'yes'; Unclear: most items are answered with 'unclear' Note: potentially a single item may introduce a high risk of bias, depending on study specifics |
| aNo: no or no relevant information to answer the signalling question bUnclear: not enough information to answer signalling question with yes or no FPG: fasting plasma glucose; HbA1c: glycosylated haemoglobin A1c; IFG: impaired fasting glucose; IGT: impaired glucose tolerance; PG: postload glucose (after an oral glucose tolerance test) | |
Appendix 4. Major cohort studies
| Cohort study acronym | Full study name |
| ADDITION | Anglo‐Danish‐Dutch study of Intensive Treatment in People with Screen Detected Diabetes in Primary Care (Rasmussen 2008) |
| — | Ansung‐Ansan Cohort Study (part of the Korean Genome and Epidemiology Study (KoGES)) ‐ (Han 2017) |
| Asturias | Asturias Study (Valdes 2008) |
| ARIC | Atherosclerosis Risk in Communities study (Warren 2017) |
| ATTICA | Province of Attica, Greece Study (Filippatos 2016) |
| AusDiab | Australian Diabetes, Obesity and Lifestyle Study (Magliano 2008) |
| BLSA | Baltimore Longitudinal Study of Aging (Meigs 2003) |
| BLSA | Beijing Longitudinal Study on Aging (Liu 2016) |
| — | Beijing Project as part of the National Diabetes Survey (Wang 2007) |
| BMES | Blue Mountains Eye Study (Cugati 2007) |
| — | Botnia Study (Lyssenko 2005) |
| — | Bruneck Study (Bonora 2011) |
| CUPS‐19 | Chennai Urban Population Study‐19 (Mohan 2008) |
| CURES | Chennai Urban Rural Epidemiology Study (Anjana 2015) |
| ChinaMUCA | China Multicenter Collaborative Study of Cardiovascular Epidemiology (Liu 2017) |
| CODAM | Cohort on Diabetes and Atherosclerosis Maastricht (Den Biggelaar 2016) |
| DESIR | Data from an Epidemiological Study on the Insulin Resistance Syndrome (Gautier 2010) |
| — | Ely Study (Forouhi 2007) |
| EPIC‐Norfolk cohort | European Prospective Investigation of Cancer Norfolk cohort (Chamnan 2011) |
| — | Finnish Cohorts of the Seven Countries Study (Stengard 1992) |
| None | Framingham Heart Study (Levitzky 2008) |
| GOS | Geelong Osteoporosis Study (De Abreu 2015) |
| Health ABC | Health, Aging, and Body Composition Study (Lipska 2013) |
| — | Hoorn Study (Rijkelijkhuizen 2007) |
| None | Hong Kong Cardiovascular Risk Factor Prevalence Study (Wat 2001) |
| IRAS | Insulin Resistance Atherosclerosis Study (Hanley 2005) |
| ICS | Isfahan Cohort Study (baseline survey of the Isfahan Healthy Heart Program) (Sadeghi 2015) |
| IDPS | Isfahan Diabetes Prevention Study (Janghorbani 2015) |
| Israel GOH Study | Israel Study of Glucose Intolerance, Obesity and Hypertension (Bergman 2016) |
| ILSA | Italian Longitudinal Study on Aging (Motta 2010) |
| — | Japanese American Community Diabetes Study (McNeely 2003) |
| JPHC Study | Japanese Public‐Health Center‐based prospective (Diabetes) Study (Noda 2010) |
| — | Kansai Healthcare Study (Sato 2009) |
| — | Kinmen Study (Li 2003) |
| KORA S4/F4 | Kooperative Gesundheitsfroschung in der Region Augsburg (Rathmann 2009) |
| KoGES | Korean Genome Epidemiology Study‐Kangwha Study (Song 2015) |
| — | Kurihashi Lifestyle Cohort Study (Nakagami 2016) |
| — | Mexico City Diabetes Study (Ferrannini 2009) |
| MESA | Multi‐Ethnic Study of Atherosclerosis (Yeboah 2011) |
| — | Nauru Study (Dowse 1991) |
| — | Paris Prospective Study (Charles 1997) |
| — | Pima Indian Study (Gila River Indian Community) (Wheelock 2016) |
| — | Pizarra study (Soriguer 2008) |
| PIFRECV | Programa de Investigación de Factores de Riesgo de Enfermedad Cardiovascular (Leiva 2014) |
| — | Rotterdam study (Ligthart 2016) |
| SALSA | Sacramento Area Latino Study on Aging (Garcia 2016) |
| SAHS | San Antonio Heart Study (Lorenzo 2003) |
| — | San Luis Valley Diabetes Study (Marshall 1994) |
| — | Singapore Impaired Glucose Tolerance Follow‐up Study (Wong 2003) |
| SIMES | Singapore Malay Eye Study (Man 2017) |
| SDPP | Stockholm Diabetes Prevention Programme (Alvarsson 2009a) |
| SHS | Strong Heart Study (Wang 2011) |
| — | Study within the WHO‐assisted National Diabetes Programme (Schranz 1989) |
| SUNSET/HELIUS | Surinamese in the Netherlands: study on health and ethnicity/Healthy life in an urban setting (Admiraal 2014) |
| TLGS | Tehran Lipid and Glucose Study (Derakhshan 2016) |
| TOPICS | Toranomon Hospital Health Management Center Study (Heianza 2012) |
| — | Yonchon study (Shin 1997) |
| — | Zanjan Healthy Heart Study (Sharifi 2013) |
Appendix 5. Definition of normoglycaemia, intermediate hyperglycaemia and incident type 2 diabetes
| Study ID | Normoglycaemia (mmol/L or %) | Intermediate hyperglycaemia | Incident type 2 diabetes | OGTT measurement (glucose load) | OGTT at baseline | OGTT at follow‐up | Notes |
| — | IFG: FPG 5.7–6.9 | FPG ≥ 7.0; HbA1c ≥ 6.5; self‐reported diabetes | — | — | — | — | |
| — | IFG: FPG ≥ 5.6 to < 7.0; IGT: 2‐h PG ≥ 7.8 to < 11.1 | FPG ≥ 7.0; 2‐h PG ≥ 11; diagnosis and/or receipt of antihyperglycaemic medication | 75 g | Yes | No | — | |
| — | IGT: 2‐h PG 7.8 to < 11.1 (WHO 1985) | 2‐h PG ≥ 11.1 (WHO 1985) | 75 g | Yes | Yes | — | |
| FPG < 5.6 and 2‐h PG < 7.8 | i‐IGT: 2‐h PG 7.8–11.0 and FPG > 5.6; i‐IFG: FPG 5.6–6.9 and 2‐h PG < 7.8; prediabetes: FPG 5.6–6.9 or 2‐h PG 7.8–11.0 (i‐IGT or i‐IFG or IFG/IGT) | FPG ≥ 7.0; 2‐h PG ≥ 11.1; diagnosed; antihyperglycaemic medication | 75 g | Yes | Unclear | — | |
| — | HbA1c 5.7–6.4, HbA1c 6.0–6.4 | FPG ≥ 7.0; HbA1c ≥ 6.5; history of diabetes; antihyperglycaemic medication | None | None | None | — | |
| FPG < 6.1 | IFG: 6.1–6.9 | FPG ≥ 7.0 (measured twice) | — | — | — | — | |
| — | IGT: 7.8 to < 11.1 (WHO 1985) | 2‐h PG ≥ 11.1 (WHO 1985) | 75 g | Yes | Yes | — | |
| FPG < 5.6 + and no antihyperglycaemic medication and 2‐h BG < 7.8 (if available) | FPF 5.6–7.8 (7.7?); 2‐h BG 7.8–11.0 | FPG ≥ 7.8, 2‐h BG ≥ 11.1; self‐reported | 100 g | Yes | Unclear | — | |
| — | HbA1: 6.0–6.49; IFG: not defined, probably FPG 5.6–6.9 | FPG ≥ 7.0; HbA1c ≥ 6.5; diabetes treatment | 75 g | Yes | Unclear | — | |
| — | IFG: 6.1–6.9, 2‐h PG < 7.8; IGT: FPG > 7.0, 2‐h PG 7.8 to < 11.1 (WHO 2009); elevated HbA1c: 5.7–6.4 | 2‐h PG: ≥ 11.1, confirmed by 2 OGTTs | — | — | — | Diabetes incidence and IFG/IGT not exactly defined | |
| — | HbA1c 6.0–6.4 | HbA1c ≥ 6.5; reported physician‐diagnosed diabetes or diabetes medications; antihyperglycaemic medication; diagnosis through registers | — | — | — | — | |
| — | IGT: 2‐h PG ≥ 7.8 to < 11.1 (WHO 1985) | 2‐h PG ≥ 11.1 (WHO 1985); physician diagnosed diabetes | 75 g | Yes | Yes | 2nd and 4th examination | |
| FPG < 6.1 | IFG: FPG 6.1–7.0 | FPG ≥ 7.0 | — | — | — | — | |
| FPG < 5.6 and 2‐h PG < 7.8 | IFG: FPG 5.6–6.9 + 2‐h PG ≤ 7.8; IGT: FPG < 5.6 + 2‐h PG 7.8–11.0; IFG/IGT: FPG 5.6–6.9 + 2‐h PG 7.8–11.0 | FPG ≥ 7.0; 2‐h PG ≥ 11.1; previously diagnosed diabetes | 75 g | Yes | Unclear | — | |
| ADA 2007 | ADA 2007 (IFG/IGT: 5.6–6.9/7.8 to < 11.1) | ADA 2007 (≥ 7.0/≥ 11.1) | — | — | — | — | |
| — | IFG: FPG 5.6–6.9 (originally FPG ≥ 6.1 to < 7.0) | FPG ≥ 7.0; self‐reported diabetes history; antihyperglycaemic medication | — | — | — | — | |
| — | IFG: 5.5–6.9 | FPG ≥ 7.0; self‐reported; antihyperglycaemic medication | — | — | — | — | |
| FPG < 6.1 and 2‐h PG < 7.8 | FPG 6.1–6.9; 2‐h PG 7.8–11.1 | FPG ≥ 7.0; 2‐h PG ≥ 11.1 | 75 g | Yes | Unclear | — | |
| FPG ≤ 5.55 and 2‐h PG ≤ 7.77 | 5.55 ≤FPG < 7.0; 7.77 ≤ 2‐h PG ≤ 11.1; no antihyperglycaemic medication | FPG ≥ 7.0; 2‐h PG ≥ 11.1; antihyperglycaemic medication | 82.5 g | Yes | Unclear | Glucose monohydrate solution, equivalent to 75 g anhydrous glucose | |
| FPG and 2‐h PG < 7.8 | IGT: FPG < 7.8 and 2‐h PG ≥ 7.8 to < 11.1 | 2‐h PG ≥ 11.1 (WHO 1985); FPG ≥ 7.8 | 75 g | Yes | Yes | — | |
| — | IFG: FPG 6.1–6.9; IGT: FPG < 7.0 and 2‐h PG 7.8–11.1; i‐IFG6.1/i‐IFG5.6: 2‐h PG < 7.8 and FPG 6.1–6.9/5.6–6.1; i‐IGT/i‐IGT6.1/i‐IGT5.6 | FPG ≥ 7.0; 2‐h PG ≥ 11.1 | 75 g | Yes | Yes | — | |
| — | IFG5.6: FBG 5.6–6.9 | FBG > 6.9; antihyperglycaemic medication | None | None | None | — | |
| FPG < 5.6 | IFG6.1: FPG 6.1–6.9 (FPG < 7.0 and 2‐h PG < 11.1) (all) IFG5.6: FPG 5.6–6.9 | FPG ≥ 7.0; 2‐h PG ≥ 11.1; doctor diagnosis or treatment for diabetes | 75 g | Yes | Yes | — | |
| — | Prediabetes: FBG 5.6–6.9 | FPG ≥ 7.0; self‐reported; antihyperglycaemic medication; diabetes comedication of death | — | — | — | — | |
| — | IFG: FPG 5.6–6.9 | FPG ≥ 7.0; treatment for diabetes (at one of the 3‐yearly examinations) | — | — | — | — | |
| — | IFG: ≥ 5.6 to < 7.0; IGT: ≥ 7.8 to < 11.1; HbA1c ≥ 5.7 to ≤ 6.4 | FPG ≥ 7.0; OGTT ≥ 11.1; HbA1c ≥ 6.5 | OGTT | Yes | Yes | OGTTs from hospital's database | |
| FPG < 6.1 and 2‐h PG < 7.8 | IGT: 2‐h PG ≥ 7.8 to < 11.1 | 2‐h PG: ≥ 11.1 | OGTT | Yes | Yes | OGTT: as baseline and each year during the 5‐year follow‐up | |
| FPG < 5.6 and 2‐h PG < 7.8 | IFG: FPG 5.6–6.9 and no diagnosis of diabetes IGT: 2‐h PG 7.8 to < 11.1 i‐IFG5.6: IFG without IGT i‐IGT: IGT without IFG IGT, IGT: IFG + IGT 'Prediabetes': IFG or IGT | FPG ≥ 7.0; 2‐h PG ≥ 11.1; HbA1c ≥ 6.5; current antihyperglycaemic treatment | 75 g | Yes | Yes | OGTT was performed every 2 years | |
| — | IFG,IGT (WHO 1999) | Unclear | 75 g | Yes | No | — | |
| Absence of IFG or elevated HbA1c | IFG: FPG 5.6–6.9 or FPG 6.1–6.9; HbA1c 5.7–6.4 or 6.0–6.4; IFG/HbA1c = 'prediabetes' | FPG ≥ 7.0; HbA1c ≥ 6.5%; self‐reported clinician‐diagnosed diabetes | — | — | — | — | |
| — | IGT: ≥ 7.8 to < 11.1 (presumed WHO 1985) | IGT: ≥ 11.1(presumed WHO 1985) | 75 g | Yes | Yes | OGGT was performed every year | |
| FPG < 5.6 and 2‐h PG < 7.8 | i‐IGT: FPG < 5.6 and 2‐h PG 7.8–11.1; i‐IFG: 5.6–6.9 and 2‐h PG < 7.8; IFG/IGT: 5.6–6.9 and 2‐h PG 7.8–11.1 | FPG ≥ 11.1; antihyperglycaemic medication; 2nd FPG ≥ 7.0; 2‐h PG ≥ 11.1 | 75 g | Yes | Yes | — | |
| FPG < 5.6 | i‐IGT: FPG < 5.6 and 2‐h PG 7.8 to < 11.1 | FPG > 7.0; 2‐h PG ≥ 11.1 | 1.75 g/kg (maximum 75 g) glucose solution | Yes | No | — | |
| — | IFG: FPG ≥ 5.6 to < 7.0; IGT: 2‐h PG ≥ 7.8 to < 11.1: 'prediabetes': IFG or IGT | FPG ≥ 7.0; 2‐h PG ≥ 11.1 | 75 g | Yes | Yes | — | |
| — | IFG: FPG ≥ 5.6 to < 7.0 | FPG ≥ 7.0 | — | — | — | — | |
| FPG < 5.0 | IFG6.1: FPG 6.1 to < 7.0 (group 4, = 276) IFG5.6: FPG 5.6 to < 6.1 | FPG ≥ 7.0; antihyperglycaemic treatment | — | — | — | — | |
| — | IFG5.6: FPG 5.6–7.0; IFG6.1: FPG 6.1–7.0 | FPG ≥ 7.0 | — | — | — | — | |
| — | i‐IFG: FPG 5.6–6.9 and 2‐h PG < 7.8; i‐IGT: 2‐h PG 7.8–11.1 and FPG < 5.6; IFG/IGT: combined glucose intolerance; HbA1c: 5.7–6.4 | FPG ≥ 7.0; 2‐h PG ≥ 11.1; HbA1c ≥ 6.5 | 75 g | Yes | Unclear | — | |
| — | FPG 5.6–6.9; HbA1c 5.7–6.4 | FPG ≥ 7.0; HbA1c ≥ 6.5; antihyperglycaemic medications | — | — | — | — | |
| — | IGT: 2‐h PG > 7.7: IFG: FPG ≥ 5.5 (WHO definition) | ADA 2000 | 1.75 g/kg body weight (maximum 75 g) flavoured glucose | Yes | — | ||
| — | IGT: not reported (presumed 7.8–11.1) | "ADA" (2000 criteria, 2‐h PG ≥ 11.1) | 1.75 g/kg body weight (max. 75 g) | Yes | Yes | ||
| WHO/NDDG 1979 | WHO/NDDG 1979 | WHO/NDDG 1979 | — | Yes | Yes | — | |
| FPG < 6.1 | IFG: FPG 6.1–6.9 | FPG ≥ 7.0 | 75 g | Yes | Yes | Annual OGTTs | |
| FPG < 5.3 and 2‐h BG < 7.8 | i‐IFG: BG 5.3–5.9 and 2‐h BG < 7.8; i‐IGT: FPG < 5.3 and 2‐h BG 7.8–11.0; IFG/IGT: BG 5.3–5.9 and 2‐h BG 7.8–11.0 | FPG ≥ 7.0; 2‐h PG ≥ 11.1 | 75 g | Yes | Yes | NGT at baseline vs follow‐up: FPG < 5.3 vs < 6.1; FPG 5.3: 15% conversion factor as recommended by the WHO (blood glucose > plasma glucose) | |
| — | 5.6 ≤ FPG < 7.0 | FPG ≥ 7.0; antihyperglycaemic medication | — | — | — | — | |
| FPG < 6.1; no personal history of diabetes; no hypoglycaemic treatment | IFG6.1: FPG 6.1–6.9; no personal history of diabetes; no hypoglycaemic treatment | FPG ≥ 7.0; personal history of diabetes; hypoglycaemic treatment | — | — | — | — | |
| — | HbA1c 5.7–6.4 | HbA1c ≥ 6.5 | — | — | — | — | |
| — | IFG: 5.6–7.0 (low range: 5.6–6.1; high range: 6.1–6.9) | FPG ≥ 7.0 (2 cons. days), HbA1c ≥ 6.5 | — | — | — | — | |
| — | IFG5.6: FPG 5.6–6.9; IFG6.1: FPG 6.1–6.9 | FPG ≥ 7.0; antihyperglycaemic medication | — | — | — | — | |
| FPG < 6.1 and 2‐h PG < 7.8 | i‐iFG:FPG 6.1–7.0 and 2‐h PG < 7.8; i‐IGT: FPG < 6.1 and 2‐h PG 7.8–11.1; IFG/IGT: FPG 6.1–7.0 and 2‐h PG 7.8–11.1 | FPG ≥ 7.0; 2‐h PG ≥ 11.0; antihyperglycaemic medications | 75 g | Yes | Yes | — | |
| FBG ≤ 6.0 | FBG > 6.0 and < 7.0; non‐fasting BG > 7.7 and < 11.1 | FBG ≥ 7.0; non‐fasting BG ≥ 11.1; antihyperglycaemic medication | — | — | — | — | |
| FPG < 5.6 and HbA1c < 5.7 | i‐IFG: FPG 5.6–6.9 and HbA1c < 5.7; i‐HbA1c: 5.7–6.4 and FPG > 5.6; IFG and HbA1c: FPG 5.6–6.9 and HbA1c 5.7–6.4 | Single HbA1c ≥ 6.5 (years 2,6,7); self‐report of physician diagnosis (annually); antihyperglycaemic agent (years 1,2,4,6,7) | — | — | — | — | |
| — | IFG 5.6–6.9 | FPG ≥ 7.0; 2‐h PG ≥ 11.0; antihyperglycaemic medication | — | — | — | — | |
| WHO | IFG; IGT (WHO) | WHO | 75 g | Yes | Unclear | — | |
| — | FPG 6.1–6.9 | FPG ≥ 7.0; self‐reported; antihyperglycaemic medication | — | — | — | — | |
| FPG 3.9–5.5 | FG 5.6–6.9 | FG ≥ 7.0; using insulin/hypoglycaemic agents; self‐reported | — | — | — | — | |
| — | IFG: FPG 6.1–6.9; IGT: 2‐h PG 7.8 to < 11.1(WHO 1999) | FPG: ≥ 7.0; 2‐h PHG: ≥ 11.1 (WHO 1999/1985) | 75 g | Yes | Yes | — | |
| FPG < 6.1 | IFG: FPG ≥ 6.1; WHO 1999 criteria | WHO 1999 criteria | 75 g | Yes | Yes | — | |
| FPG < 6.1 and 2‐h PG < 7.8 | IFG: FPG 6.1–6.9 and 2‐h PG < 7.8; IGT: FPG < 7.0 and 2‐h PG ≤ 7.8 to < 11.1 | FPG ≥ 7.0; 2‐h PG ≥ 11.1; current antihyperglycaemic medication | 75 g | Yes | Yes | — | |
| Not 'prediabetes', not diabetes | HbA1c 5.7–6.4; no self‐reported diabetes or antihyperglycaemic medication | Random glucose ≥ 11.1 or HbA1c > 6.4; self‐reported history or antihyperglycaemic medication | — | — | — | — | |
| — | IGT: 2‐h PG ≥ 7.8 to < 11.1 (WHO 1985) | 2‐h PG ≥ 11.1 (WHO 1985) | 75 g | Yes | Yes | — | |
| — | IFG: FPG ≥ 6.1 to < 7.0; IGT: 2‐h PG ≥ 7.8 to < 11.1 | FPG ≥ 7.0; 2‐h PG ≥ 11.1; antihyperglycaemic medication prescribed by a physician | 75 g | Yes | Yes | — | |
| FPG < 6.1 and 2‐h PG ≤ 7.8 | IFG: FPG 6.1–6.9 and 2‐h PG ≤ 7.8; IGT: FPG < 6.1 and 2‐h PG 7.8–11.0; IFG/IGT | FPG ≥ 7.0; 2‐h PG ≥ 11.1 (IFG‐IGT person: diabetes defined by OGTT) | Before 07/1977: 1.75 g glucose/kg BW, average 143 g; from 07/1977: 40 g/kg body surface area, average 78 g (men) and 68 g (women) | Yes | Yes | Serial OGTTs over subsequent biennial examinations | |
| — | IFG: FPG ≥ 6.1 to < 7; IGT: 2‐h PG ≥ 7.8 to < 11.1 | FPG ≥ 7; 2‐h PG ≥ 11.1 | 75 g | Yes | Yes | — | |
| Both FPG and 2‐h PG < 7.8 (WHO 1985) | IGT: FPG < 7.8 and 2‐h PG 7.8 to < 11.1 (WHO 1985) | FPG ≥ 7.8; 2‐h PG ≥ 11.1 (WHO 1985) | 75 g glucose monohydrate dissolved in 250 mL of water (modified OGTT) | Yes | Yes | — | |
| FPG < 6.1 | IFG: 6.1 to < 7.0 | FPG ≥ 7.0 | — | Yes | — | ||
| FPG and 2‐h PG < 7.8 | IGT: FPG < 7.8 and 2‐h PG 7.8–11.1 (WHO 1985) | FPG ≥ 7.8; 2‐h PG ≥ 11.1 (WHO 1985) | 75 g | Yes | Yes | — | |
| — | HbA1c 5.7–6.4, FPG 5.5–6.9 | FPG ≥ 7.0, HbA1c ≥ 6.5; physician diagnosis of diabetes | — | — | — | — | |
| FPG < 6.1 | IFG: FPG 6.1–6.9 | FPG ≥ 7.0; antihyperglycaemic medication | — | — | — | — | |
| — | Taken from table 2: FPG levels: IFG 5.6 and 6.1 | FPG ≥ 7.0; HbA1c ≥ 6.1%; self‐reported | — | — | — | — | |
| — | IFG: FPG ≥ 5.6 | FPG ≥ 7.0 | — | — | — | — | |
| FPG < 6.1 and 2‐h PG < 7.8 | IGT: FPG < 7.0 and 2‐h PG ≥ 7.8 to < 11.1 | FPG ≥ 7.0; 2‐h PG ≥ 11.1 | — | Yes | Yes | 2 standardised OGTT at baseline with about 1 week's interval to verify glucose status | |
| FPG < 6.1 and 2‐h PG < 7.8 | i‐IFG: 6.1–6.9 and 2‐h PG < 7.8; i‐IGT: < 6.1 and 2‐h PG 7.8–11.0; IFG/IGT: 6.1–6.9 and 2‐h PG 7.8–11.0 | FPG ≥ 7.0; 2‐h PG ≥ 11.1 | 75 g | Yes | Unclear | — | |
| 2‐h PG < 7.8 | IGT: 2‐h PG 7.8 to < 11.1 | 2‐h PG ≥ 11.1; 2x FPG ≥ 6.7 | 75 g | Yes | Yes | New cases identified by OGTTs in 1994 and 1996–8 | |
| — | IGT: 7.8–11.0 (presumed NDDG 1979) | 2‐h PG > 11.0 (presumed NDDG 1979) | 75 g | Yes | Yes | — | |
| — | IFG (i‐IFG): FBG 5.6 to < 6.1 and 2‐h BG < 7.8; IGT (i‐IGT): FBG < 6.1 and 2‐h BG 7.8 to < 11.1; IFG/IGT | FBG ≥ 6.1 or 2‐h BG ≥ 11.1 | 75 g | Yes | Unclear | — | |
| WHO 1999 | IFG: FPG 6.1–6.9; IGT: 2‐h PG 7.8 to < 11.1; 'prediabetes': i‐IFG, i‐IGT and IFG/IGT | FPG ≥ 7.0; 2‐h PG ≥ 11.1; validated physician diagnosis | 75 g | Yes | Yes | — | |
| ADA 1997/2003 | IFG5.6: FPG 5.6–7.0; IFG6.1: FPG 6.1–7.0; IGT: 2‐h PG 7.8 to < 11.1 | FPG ≥ 7.0; 2‐h PG: ≥ 11.1 | 75 g | Yes | Yes | — | |
| — | IFG: FPG ≥ 5.5 and < 7.0; IGT: 2‐h OGTT ≥ 7.8 and < 11.1 | FPG > 7.0; 2‐h OGTT > 11.1; IFG/IGT; antihyperglycaemic medication | — | Yes | Yes | — | |
| FPG < 7.8 and 2‐h PG < 7.8 (WHO 1980) | IGT: FPG < 7.8 and 2‐h PG 7.8–11.1 (WHO 1980) | FPG ≥ 7.8 or 2‐h PG ≥ 11.1 (WHO 1980) | 50 g | Yes | Yes | — | |
| — | (Table 1): IFG: FPG group 6.1–6.9; HbA1c‐group: 6.0–6.4 | FPG ≥ 7.0; antihyperglycaemic medication | — | — | — | — | |
| — | IGT: 2‐h PG ≥ 7.8 to < 11.1 (WHO 1985) | 2‐h PG ≥ 11.1 (WHO 1985) | OGTT | Yes | Yes | — | |
| — | FPG 5.6–7.0 | FPG > 7.0 (2 measurements); diabetes diagnosis based on documents | OGTT | Yes (twice) | — | — | |
| — | Assumed WHO 1985 criteria | "WHO criteria"; antihyperglycaemic medication | 75 g | Yes | Yes | — | |
| — | IFG: FPG ≥ 6.1 to < 7.0 and 2‐h PG < 7.8; IGT: FPG < 7.0 and 2‐h PG ≥ 7.8 to < 11.1 | FPG ≥ 7.0; 2‐h PG ≥ 11.1 | 75 g | Yes | Yes | — | |
| — | IFG: FPG 5.6–6.9 | FPG ≥ 7.0; HbA1c ≥ 6.5; antihyperglycaemic medication | — | — | — | — | |
| — | IFG: FG 5.6–6.9; IGT: 2‐h G 7.8–11.0 | FG ≥ 7.0; 2‐h G ≥ 11.0; HbA1c ≥ 6.5; self‐reported | 75 g | Yes | Yes | 100 g steamed bread at follow‐up | |
| BG < 5.6 and 2‐h BG < 7.8 | IFG: BG 5.6–6.1 and 2‐h BG < 7.8; IGT: BG < 5.6 and 2‐h BG 7.8–11.1 | BG > 6.1 or 2‐h BG > 11.1 | 75 g | Yes | Yes | — | |
| — | IGT: 2‐h PG 7.8–11.1 | 2‐h PG ≥ 11.1 (WHO 1985); antihyperglycaemic medications | 75 g | Yes | Yes | — | |
| FPG < 6.1 and 2‐h PG < 7.8 | IFG: FPG 6.1–6.9 and 2‐h PG < 7.8; IGT: FPG < 7.0 and 2‐h PG 7.8–11.1 | FPG ≥ 7.0; 2‐h PG > 11.1; non‐fasting PG > 11.1 | 75 g | Yes | Yes | Annual OGTT during the observation period (3.2 years) | |
| FPG < 5.6; 2‐h PG < 6.7; 2‐h PG < 6.7 | IFG: FPG 5.6–6.0; IGT: 2‐h PG 6.7–9.9 | FPG> 6.1; antihyperglycaemic medications; 2‐h PG ≥ 10.0 | 75 g | Yes | No | Retrospective classification; note thresholds (whole blood) | |
| FPG < 5.6 | IFG5.6: 5.6–6.1; IFG6.1: 6.1–6.9 | FPG ≥ 7.0; 2‐h PG ≥ 11.1; clinical diabetes diagnosis; antihyperglycaemic medication, diet | 75 g | Yes | Yes | — | |
| — | FG 5.6–6.9; 2‐h PG 7.8–11.9; HbA1c 5.7–6.4 | FPG ≥ 7.0; 2‐h PG ≥ 11.1; previous clinical diagnosis | 75 g | Yes | Yes | HbA1c new method = −0.1916 + (0.9829 × HbA1c old method) | |
| FPG and 2‐h PG < 6.1 and < 7.8 | IGT: 2‐h PG 7.8 to < 11.1 | Not defined, presumably by OGTT | 75 g | Yes | Yes | All participants underwent a second OGTT to confirm the diagnosis in order to be included in the study; follow‐up: a reminder letter was sent every 6 months to participants to undergo an OGTT | |
| — | IFG: FPG 6.1–6.9; IGT: 2‐h PG 7.8–11.0 | FPG ≥ 7.0; 2‐h PG ≥ 11.1 | 75 g | Yes | Unclear | — | |
| FPG < 5.6; HbA1c < 6.0; no FPG/HbA1c | IFG: 5.6 to < 7.0; HbA1c 6.0 to < 6.5 | Diabetes status: FPG ≥ 7.0; antihyperglycaemic medication; HbA1c ≥ 6.5, antihyperglycaemic medication; FPG/HbA1c: ≥ 6.5 or FPG ≥ 7.0 or antihyperglycaemic medication | — | — | — | — | |
| — | FPG 5.6–6.9 (ADA); FG 6.1–6.9 (WHO); 2‐h 7.8–11.0 (ADA); HbA1c 5.7–6.4 (ADA); 6.0–6.4 (IEC) | Self‐report of physician diagnosis; antihyperglycaemic medication reported during a study visit or annual telephone call | 75 g | Yes (visit 4) | Unclear | — | |
| FPG and 2‐h PG < 7.8 | IGT: FPG < 7.8 and 2‐h PG 7.8 to < 11.1 | FPG ≥ 7.8; 2‐h PG ≥ 11.1 | 75 g | Yes | Yes | — | |
| FPG < 5.6 and 2‐h PG < 7.8 | IGT: FPG < 5.6 and 2‐h PG 7.8–11.1 | FPG ≥ 7.0; 2‐h PG > 11.1; presentation of hyperglycaemia (more than 2 random glucose measurements > 11.1), glucosuria, polydipsia, and polyuria | 1.75 g/kg body weight flavoured glucose orally (up to a maximum of 75 g) | Yes | Yes | OGTT was repeated every 18–24 months | |
| — | IGT: 2‐h PG ≥ 7.8 to < 11.1 | FPG ≥ 7.0; 2‐h PG ≥ 11.1; previous diagnosis | 75 g | Yes | Unclear | Modified OGTT | |
| — | IGT: 2‐h PG ≥ 7.8 to < 11.1 | FPG ≥ 7.0; 2‐h PG ≥ 11.1; physician diagnosed diabetes | 75 g | Yes | Yes | — | |
| FPG < 5.6 | IFG: FPG 5.6–6.9 | FPG > 6.9; antihyperglycaemic medication during examinations 2,3, 4 | — | — | — | — | |
| — | IGT: 2‐h PG 7.8 to < 11.1 | FPG ≥ 7.0; antihyperglycaemic medications | 75 g | Yes | No | — | |
| BG: blood glucose; BW: body weight; FPG: fasting plasma glucose; HbA1c: glycosylated haemoglobin A1c; i‐IFG: (isolated) impaired fasting glucose; i‐IGT: (isolated) impaired glucose tolerance; IFG/IGT: both impaired fasting glucose and impaired glucose tolerance; NDDG: National Diabetes Data Group; NGT: normal glucose tolerance; OGTT: oral glucose tolerance test; PG: postload glucose; WHO: World Health Organization | |||||||
Appendix 6. Number of participants with and without intermediate hyperglycaemia at baseline
| Study ID | N participants with/without IH | Definitions of IH at baseline | |||||
| 'Prediabetes'a | Elevated HbA1c | IFG | IGT | IFG/HbA1c | IFG/IGT | ||
| IFG5.6 total: 111/456 | — | — | IFG5.6: | — | — | — | |
| IFG5.6: 223/2667 | — | — | IFG5.6: 8.4 | — | — | — | |
| IGT: 68 | — | — | — | 100 | — | — | |
| 'Prediabetes' (i‐IFG, i‐IGT or both): 299/1376 | 21.7 | — | i‐IFG5.6: 4.9 | i‐IGT: 11.8 | — | 5.0 | |
| HbA1c5.7: 1791/9723; HbA1c6.0: 412/1791 | — | HbA1c5.7: 18.4 HbA1c6.0: 4.2 | — | — | — | — | |
| IFG6.1: 115 | — | — | IFG6.1: 100 | — | — | — | |
| IGT: 252/696 | — | — | — | 36.2 | — | — | |
| IGT: 68/853 | — | — | — | 8 | — | — | |
| HbA1c6.0: 70/842 | — | 8.3 | — | — | — | — | |
| IFG6.1: 40/553 | — | — | IFG6.1: 7.2 | 18.7 | — | 2.7 | |
| HbA1c6.0: 370/5735 | — | HbA1c6.0: 6.5 | — | — | — | — | |
| IGT: 418/4089; i‐IFG6.1: 476/5042 | — | — | i‐IFG6.1: 9.4 | 10.2 | — | — | |
| IFG6.1: 156/600 | — | — | IFG6.1: 26 | — | — | — | |
| i‐IFG5.6: 329/1347 | — | — | i‐IFG5.6: 24.4 | i‐IGT: 14.2 | 15.5 | — | |
| 'Prediabetes': 217/656 | 33.1 | — | — | — | — | — | |
| IFG5.6: 244/2123 | — | — | IFG5.6: 11.5 | — | — | — | |
| IFG5.6: 187/1167 | — | — | IFG5.6: 16 | — | — | — | |
| IFG6.1 and/or IGT: 122/476 | 25.6 | — | — | — | — | — | |
| IFG5.6 and/or IGT: 523/8231 | IFG5.6 and/or IGT: 6.4 | — | — | — | — | — | |
| IGT: 105/1201 | — | — | — | 8.7 | — | — | |
| i‐IFG5.6: 65/1941 | — | — | i‐IFG5.6: 3.3 | IGT: 9.2 | — | — | |
| IFG5.6: 279/1485 | — | — | IFG5.6: 18.8 | — | — | — | |
| IFG6.1: 257/1040 IFG5.6: 633/1040 | — | — | IFG5.6: 60.9 IFG6.1: 24.7 | — | — | — | |
| IFG5.6: 310/1777 | — | — | IFG5.5: 17.5 | — | — | — | |
| IFG5.6: 979 | — | — | IFG5.6: 100 | — | — | — | |
| 'Prediabetes': 186/772 | 24.1 | — | — | — | — | — | |
| IGT: 75/375 | — | — | — | 20 | — | — | |
| i‐IFG5.6: 199/7542 i‐IGT: 1512/7542 IFG/IGT: 198/7542 | — | — | i‐IFG5.6: 2.6 | i‐IGT: 20.0 | — | 2.6 | |
| IGT: 274/882 | — | — | — | 31.6 | — | — | |
| IFG5.6: 1680/6241 | — | HbA1c5.7: 13.2 | IFG5.6: 26.9 | — | 33.5 | — | |
| IGT: 37 | — | — | — | 100 | — | — | |
| i‐IFG5.6: 304/1530 | — | — | i‐IFG5.6: 19.9 | i‐IGT: 12.9 | — | 17.5 | |
| i‐IGT: 27/177 | — | — | — | i‐IGT: 15.3 | — | — | |
| IFG5.6: 16% | — | — | IFG5.6: 16 | 5.3 | — | — | |
| IFG5.6: 320/2370 | — | — | IFG5.6: 13.5 | — | — | — | |
| IFG6.1: 276/2964 | — | — | IFG6.1: 9.3 | — | — | — | |
| IFG total: 1829/7211 | — | — | IFG total: 25.4 | — | — | — | |
| i‐IFG5.6: 158/406 | — | i‐HbA1c5.7: 15.8 | i‐IFG5.6: 38.9 | i‐IGT: 16 | — | 29.3 | |
| IFG5.6: 3544/17971 | — | HbA1c5.7: 9.5 | IFG5.6: 19.7 | — | 10.9 | — | |
| IGT: 79 | — | — | — | 100 | — | — | |
| IGT: 119 | — | — | — | 100 | — | — | |
| IGT: 123 | — | — | — | 100 | — | — | |
| IFG6.1: 55/319 | — | — | IFG6.1: 17.2 | — | — | — | |
| i‐IFG6.1: 42/265 | — | — | i‐IFG6.1: 15.8 | i‐IGT: 24.9 | — | 11.3 | |
| IFG5.6: 124/593 | — | — | IFG5.6: 20.9 | — | — | — | |
| IFG6.1: 743 | — | — | IFG6.1: 100 | — | — | — | |
| HbA1c5.7: 3497 | — | HbA1c5.7: 100 | — | — | — | — | |
| IFG6.1: 28/94 | — | — | IFG6.1: 29.8 | — | — | — | |
| Not reported | — | — | — | — | — | — | |
| i‐IFG6.1: 42/644 | — | — | i‐IFG6.1: 6.5 | i‐IGT: 18.3 | — | 7.6 | |
| IFG6.1: 1382/10,050 | — | — | IFG6.1: 13.8 | — | — | — | |
| IFG5.6: 189/1690 | — | i‐HbA1c: 12.2 | IFG5.6: 11.2 | — | 10.0 | — | |
| IFG5.6: 169/1844 | — | — | IFG5.6: 9.2 | — | — | — | |
| 'Prediabetes' (IFG or IGT): 450/2271 | 19.8 | — | — | — | — | — | |
| IFG6.1: 222/1857 | — | — | IFG6.1: 12.0 | — | — | — | |
| IFG5.6: 3607/18610 | — | — | IFG5.6: 19.4 | — | — | — | |
| IFG6.1: 29/1734 | — | — | IFG6.1: 1.7 | 11.6 | — | — | |
| i‐IFG6.1: 263/2115 | — | — | i‐IFG6.1: 12.4 | i‐IGT: 11.8 | — | 8.2 | |
| Not reported | — | — | — | — | — | — | |
| HbA1c5.7: 675/1137 | — | HbA1c5.7: 59.4 | — | — | — | — | |
| IGT: 123 | — | — | — | 100 | — | — | |
| 5–6 years: | — | — | 5–6 years: | 5–6 years: | — | — | |
| i‐IFG5.6: 126/753 i‐IFG6.1: 20/753 | — | — | i‐IFG5.6: 16.7 | i‐IGT5.6: 15.3 i‐IGT6.1: 29 | — | IFG5.6/IGT: 13.7 | |
| IGT: 37/513 | — | — | — | 7.2 | — | — | |
| IGT: 35/563 | — | — | — | 6.2 | — | — | |
| IFG6.1: 295/2603 | — | — | IFG6.1: 11.3 | — | — | — | |
| IGT: 203/892 | — | — | — | 22.8 | — | — | |
| IFG5.6: 467/2267 IFG6.1: 134/2267 HbA1c6.0: 156/2267 | — | HbA1c5.7: 25.7 HbA1c6.0: 6.9 | IFG5.6: 20.6 IFG6.1: 5.9 | — | — | — | |
| IFG6.1: 246/5588 | — | — | IFG6.1: 4.4 | — | — | — | |
| IGF5.6: 558/2207 | — | — | IFG5.6: 25.3 | — | — | — | |
| IFG5.6: 321/5296 | — | — | IFG5.6: 6.1 | — | — | — | |
| IGT: 29/74 | — | — | — | 39.2 | — | — | |
| i‐IFG6.1: 46/1042 | — | — | i‐IFG6.1: 4.4 | i‐IGT:11.5 | — | 3.2 | |
| IGT: 100 | — | — | — | 100 | — | — | |
| IGT: 107 | — | — | — | 100 | — | — | |
| i‐IFG5.6: 607/1510 | — | — | i‐IFG5.6: 40.2 | i‐IGT: 59.8 | — | — | |
| i‐IFG6.1: 71/887 | — | — | i‐IFG6.1: 8 | i‐IGT: 13.5 | — | 5.3 | |
| IFG5.6: 488/1428 | — | — | IFG5.6: 34.2 | — | — | — | |
| 'Prediabetes' (IFG5.6 and/or IGT): 373/2980 | 12.5 | — | — | — | — | — | |
| IGT: 13/207 | — | — | — | 6.3 | — | — | |
| Unclear | — | — | — | — | — | — | |
| IGT: 75/2128 | — | — | — | 3.5 | — | — | |
| IFG5.6: 123 | — | — | IFG5.6: 100 | — | — | — | |
| IGT: 153/1193 | — | — | — | 12.8 | — | — | |
| i‐IFG6.1: | — | — | i‐IFG6.1: | 87–98: 18.9 87–92: 18.8 92–98: 19.3 | — | — | |
| IFG5.6: 321/2467 | — | — | IFG5.6: 13 | — | — | — | |
| 'Prediabetes': 344 | 100 | — | — | — | — | — | |
| IFG5.6: 56/714 | — | — | IFG5.5: 7.8 | 7.6 | — | 3.9 | |
| IGT: 234/637 | — | — | — | 36.7 | — | — | |
| IFG6.1: 14/128 | IFG and/or IGT: 89.1 | — | IFG6.1: 10.9 | — | — | — | |
| i‐IFG5.6: 36/1141 | — | — | i‐IFG5.6: 3.1 | i‐IGT: 7.5 | — | 1.0 | |
| IFG5.6: 114/630 IFG6.1: 52/630 | — | — | IFG5.6: 18.1 | 7.9 | — | — | |
| IFG5.6 adults: 423/2005 IFG5.6 children: 193/2095 HbA1c5.7 adults: 168/2005 IGT adults: 347/2005 IGT children: 170/2095 | — | HbA1c5.7 adults: 8.4 | IFG5.6 adults: 21.1 | Adults: 17.3 | — | IFG/IGT adults: 8.4 | |
| IGT: 619/1659 | — | — | — | 37.3 | — | — | |
| IGT: 141/541 | — | — | — | 26 | — | — | |
| i‐IGT total: 135/10 i‐IGT men: 29/447 | — | — | — | i‐IGT total: 12.5 i‐IGT men: 6.5 | — | — | |
| IFG5.6: 4112/10844 HbA1c6.0: 970/10844 | — | HbA1c5.7: 19 HbA1c6.0: 9 | IFG5.6: 38 | 28 | — | — | |
| IGT: 322 | — | — | — | 100 | — | — | |
| i‐IGT(IFG5.6): 33/117 | — | — | — | i‐IGT: 28.2 | — | — | |
| IGT: 169/5532 | — | — | — | 3.1 | — | — | |
| IGT: 291 | — | — | — | 100 | — | — | |
| IFG5.6: 940/6753 | — | — | IFG5.6: 13.9 | — | — | — | |
| IGT: 201/667 | — | — | — | 30.1 | — | — | |
| aTerm 'prediabetes' as used by study authors (usually defined by various combinations of glycaemic status measurements, e.g. IFG and/or IGT) FG: fasting glucose; FPG: fasting plasma glucose; HbA1c: glycosylated haemoglobin A1c; HbA1c5.7/6.0 : HbA1c threshold 5.7% or 6.0% (usually reflecting 5.7% to 6.4% and 6.0% to 6.4%, respectively); HbA1c/IFG: both HbA1c and IFG; i‐: isolated;IFG 5.6/6.1 : impaired fasting glucose (threshold 5.6 mmol/L or 6.1 mmol/L); IGT: impaired glucose tolerance; IFG/IGT: both IFG and IGT; PG: postload glucose;IH: intermediate hyperglycaemia; T2DM: type 2 diabetes mellitus | |||||||
Appendix 7. Follow‐up time and type of outcome measurement of the development of type 2 diabetes
| Study ID | Length of follow‐up | Time‐points of measurements | Outcome measurement of the development of T2DM | Notes |
| 10 years | Baseline, follow‐up | Incidence, odds ratio | Data for total population/South‐Asian Surinamese/African Surinamese/"Ethnic Dutch" | |
| 12 years | Baseline, follow‐up | Incidence, odds ratio | — | |
| 2 years | Baseline, follow‐up | Incidence | — | |
| Median 9.1 years (IQR 2.6) | Baseline, follow‐up | Incidence, incidence rate | — | |
| 4 years (mean 47.2 months) | Baseline, follow‐up (partially annually/biannually) | Incidence, incidence rate, hazard ratio | — | |
| 10 years | Baseline, follow‐up | Incidence | — | |
| 1 year | Baseline, follow‐up | Incidence | — | |
| 24 years | Baseline, follow‐up | Incidence, odds ratio | Also adjusted for fasting blood glucose; 100 g OGTT | |
| 15 years | Baseline, follow‐up (5, 10, 15 years) | Incidence, incidence rate, hazard ratio | HbA1c category used: 6.0% to 6.49% | |
| Mean 9.7 years (SD 0.7) | Baseline, follow‐up | Incidence, risk ratio | Total incident cases = mixture of isolated and combined intermediate glycaemic conditions | |
| Median 3 years | Baseline, follow‐up | Incidence, odds ratio | Data for HbA1c 6.0% to 6.4% group, focus on clinically and/or biochemically diagnosed diabetes | |
| 2 years | Baseline, follow‐up (5 annual clinical examinations) | Incidence | — | |
| 3 years | Baseline, follow‐up | Incidence, odds ratio | Also adjusted for apolipoprotein B | |
| 3 years | Baseline, follow‐up | Incidence | — | |
| 1 and 2 years | Baseline, follow‐up | Incidence, relative risk | Results are given for year 1/year 2 of follow‐up | |
| 10 years | Baseline, follow‐up (5 and 10 years) | Incidence, odds ratio | Odds‐ratio, age‐and sex‐adjusted | |
| 10 years | Baseline, follow‐up | Incidence, incidence rate, odds ratio | Age‐standardised incidence rate; additional covariates: metabolic syndrome, fasting glucose at baseline | |
| 7 years | Baseline, follow‐up | Incidence | — | |
| Median 11.7 years (IQR 8.4–13.2) | Baseline, follow‐up | Incidence rate, hazard ratio | — | |
| Approx. 5 years | Baseline, follow‐up | Incidence, incidence rate, odds ratio | Incidence rates for the periods 1975/76–1982 and 1982–1987 | |
| 7 years | Baseline, follow‐up | Incidence, relative risk | — | |
| 10 years | Baseline, follow‐up (intermediate 5 ‐year follow‐up) | Incidence, odds ratio | — | |
| 10 years | Baseline, follow‐up | Incidence, incidence rate, hazard ratio | Cumulative incidence increased across increasing age groups and was higher in men than in women | |
| Approx. 9 years | Baseline, follow‐up (every 12–15 months, max. 6 follow‐ups) | Incidence | — | |
| 9 years | Baseline, follow‐up (3‐yearly examinations) | Incidence | — | |
| Approx. 2 years | Baseline, follow‐up | Incidence, incidence rate | Rate was given in terms of per 100 person‐years (recalculated to 1000 person‐years) | |
| 5 years | Baseline, follow‐up | Incidence, incidence rate | — | |
| 12 years | Baseline, follow‐up (biannually) | Incidence, incidence rate, hazard ratio | — | |
| Average 5.2 years (range 4.5–6.6) | Baseline, follow‐up | Incidence, odds ratio | — | |
| Median 5 years | Baseline, follow‐up (annual follow‐ups) | Incidence, incidence rate, hazard ratio | Adjusted odds ratios: mean age and sex‐adjusted | |
| 2.5 years | Baseline, follow‐up | Incidence | — | |
| Mean 6.8 years (SD 1.7) | Baseline, follow‐up (OGTT at 3‐year intervals) | Incidence, incidence rate, hazard ratio | Date for cohort without hypertension | |
| 3–6 years | Baseline, follow‐up | Incidence | — | |
| 5 years | Baseline, follow‐up | Odds ratio | Also adjusted for ALAT, ASAT, γ‐GT, h‐CRP | |
| Mean 2.6 years (SD 0.97) | Baseline, follow‐up (annual follow‐ups, 1–4 years) | Incidence | — | |
| 5 years | Baseline, follow‐up | Incidence, hazard ratio | — | |
| 2 years | Baseline, follow‐up | Incidence | — | |
| Median 46 months | Baseline, follow‐up (every 3–6 months, up to 9 years) | Incidence | 81 participants were diagnosed with diabetes with a conversion rate of 20% (81/406); conversion rates are given within prediabetes groups (e.g. 24/158 i‐IFG converters = 15.2%) | |
| Mean 5.2 years (range 3.1–6.7) | Baseline, follow‐up | Incidence, odds ratio | — | |
| 1 year | Baseline, follow‐up | Incidence | — | |
| Mean 3.9 years (SD 0.6) | Baseline, follow‐up | Incidence | — | |
| Mean 1.4 years (range 0.9–7.6) | Baseline, follow‐up (annual OGTTs) | Incidence | — | |
| Median 1.7 years | Baseline, follow‐up (annual OGTTs) | Incidence | — | |
| Mean 10 years (SD 1 year 10 months) | Baseline, follow‐up | Incidence | — | |
| Median 5 years | Baseline, follow‐up | Incidence, incidence rate, odds ratio | — | |
| 5 years | Baseline, follow‐up | Incidence | — | |
| Mean 3.7 years (SD 2.3) | Baseline, follow‐up | Incidence | — | |
| 6 years | Baseline, follow‐up | Incidence, hazard ratio | — | |
| 4 years | Baseline, follow‐up (approx. 4‐year intervals) | Incidence, odds ratio | — | |
| 5 years | Baseline, follow‐up (examination every 2 years) | Incidence, incidence rate, hazard ratio | Incidence rates for 5‐year cumulative incidence; further adjustments for HOMA‐IR and HOMA beta‐cell | |
| 14.7 years | Baseline, follow‐up (blood glucose measures approx. every 4 years) | Incidence rate | — | |
| 7 years | Baseline (year 4), follow‐up (years 5,6,7) | Incidence, odds ratio | IFG6.1: sensitivity analysis, analysis for 'ethnicity', sex analysis | |
| 5 years | Baseline, follow‐up | Incidence, incidence rate, relative risk | — | |
| 3 years | Baseline, follow‐up | Incidence, incidence rate | No exact definition of 'prediabetes' and diabetes incidence | |
| Median 10.9 years (IQR 8.0–15.3) | Baseline, follow‐up | Hazard ratio | Subdistribution hazard ratios; also adjusted for self‐rated health | |
| 7.8 years | Baseline, follow‐up | Odds ratio | — | |
| 7–8 years | Baseline, follow‐up | Incidence, odds ratio | Also adjusted for NCEP metabolic syndrome definition, fasting insulin | |
| Median 6 years (range 2–12) | Baseline, follow‐up (every 2–3 years) | Incidence, hazard ratio | 1372 persons 1 visit, 392 persons 2 visits, 219 persons 3 visits, 132 persons 4 visits | |
| 5 years | Baseline, follow‐up | Incidence, incidence rate, odds ratio | 5‐year cumulative incidence rate was standardised to the 1998 Australian population (age and sex‐specific incidence rates) | |
| 6 years | Baseline, follow‐up | Incidence, incidence rate, risk ratio | Male: female, age standardised rate | |
| Mean 22.6 months (range 11–40) | Baseline, follow‐up | Incidence | — | |
| 10 years | Baseline, follow‐up (5–6 years and 10 years) | Incidence | — | |
| 5 years, 10 years | Baseline, follow‐up (3 to 10 biennial examinations) | Incidence, incidence rate | — | |
| Mean 8 years (SD 1.3) | Baseline, follow‐up | Incidence, incidence rate | — | |
| 10 years | Baseline, follow‐up | Incidence | — | |
| 3 years | Baseline, follow‐up | Incidence | — | |
| Mean 3.5 years (42 months (SD 4)) | Baseline, follow‐up | Incidence, odds ratio | — | |
| 5 years | Baseline, follow‐up | Incidence, hazard ratio | — | |
| 7 years | Baseline, follow‐up (annual health examinations) | Incidence, incidence rate, relative risk | Also adjusted for all other components of the metabolic syndrome at study entry | |
| 5 years | Baseline, follow‐up | Incidence | — | |
| Mean 4.1 years | Baseline, follow‐up (annual examinations) | Incidence, incidence rate | — | |
| 10 years | Baseline, follow‐up | Incidence | — | |
| 5 years | Baseline, follow‐up | Incidence | — | |
| 4.6 years (1.9–6.4) | Baseline, follow‐up (including a separate cohort) | Incidence, incidence rate | — | |
| Reverters: 3.3 years (SD 2) Converters: 5.1 years (SD 3.5) | Baseline, follow‐up ("periodically") | Incidence | All individuals were advised a calorie‐restricted high carbohydrate high‐fibre diet | |
| 3.5 years | Baseline, follow‐up | Incidence, incidence rate | — | |
| 7 years | Baseline, follow‐up | Incidence, incidence rate, odds ratio | — | |
| Mean 6.4 years | Baseline, follow‐up | Incidence, incidence rate | — | |
| 7 years | Baseline, follow‐up (biannual) | Incidence, incidence rate | — | |
| 7 years | Baseline, follow‐up | Incidence,odds ratio | — | |
| 4 years | Baseline, follow‐up | Odds ratio | — | |
| 6 years | Baseline, follow‐up | Incidence | — | |
| 7 years | Baseline, follow‐up | Incidence | — | |
| 2 years | Baseline, follow‐up | Incidence | — | |
| 11 years | Baseline, follow‐up | Incidence, incidence rate | Incidence rates are given for periods 1987–1992 and 1992–1998, stratified by men:women | |
| Median 3.97 years | Baseline, follow‐up | Incidence, relative risk | Also adjusted for glucose | |
| Mean 10.8 years (range 10.5–12) | Baseline, follow‐up (additional follow‐up 2014) | Incidence | — | |
| Mean 6 years | Baseline, follow‐up | Incidence, incidence rate, relative risk | — | |
| 5 years | Baseline, follow‐up | Incidence, odds ratio | — | |
| Mean 3.2 years (SD 0.1) | Baseline, follow‐up (annual OGTT) | Incidence | — | |
| 11.5 years | Baseline, follow‐up | Incidence, odds ratio | Odds ratios probably unadjusted | |
| Mean 6.3 years (5.9–6.8) | Baseline, follow‐up | Incidence, incidence rate, odds ratio | Also adjusted for 2‐h PG | |
| Adults median 4.6 years (IQR 2.8–7.9 ) | Baseline, follow‐up (examinations every 2 years) | Incidence, incidence rate | Data for adults/children; incidence rate taken from figure 2 (boys:men; girls:women) | |
| Median 5 years | Baseline, follow‐up (reminder to undergo an OGTT every 6 months) | Incidence, odds ratio | Also adjusted for FPG and 2‐h PG | |
| 5 years | Baseline, follow‐up | Incidence, risk ratio | — | |
| 4 years | Baseline, follow‐up | Odds ratio | Unclear which confounders were used in the multivariate model | |
| Cohort 1 (visit 2): 22 years Cohort 2 (visit 4): 16 years | Baseline, follow‐up (3 visits every 3 years, 5th visit 2011–13) | Hazard ratio | Data for IFG5.6, IFG6.1, HbA1c5.7, HbA1c6.0, IGT (cohort 2 only) | |
| 2 years | Baseline, follow‐up | Incidence | — | |
| Mean 20.4 months (SD 10.3) | Baseline, follow‐up (biannual) | Incidence | — | |
| Median 12.4 years (IQR 6.0–22.9) | Baseline, follow‐up (approx. annual intervals for repeated OGTTs) | Incidence | Non‐overweight participants with IGT cohort and overweight participants with IGT group | |
| 8 years | Baseline, follow‐up | Incidence | Odds ratios from Tai 2004 | |
| 7.5 years | Baseline, follow‐up (3 examinations) | Incidence, hazard ratio | — | |
| 7 years | Baseline, follow‐up | Odds ratio | Also adjusted for (split) proinsulin, intact insulin | |
| ALAT: alanine aminotransferase; ASAT: aspartate transaminase; FG: fasting glucose; FPG: fasting plasma glucose; h‐CRP: high‐sensitivity C‐reactive protein; HOMA‐beta: homeostatic model assessment of beta‐cell function; HOMA‐IR: homeostatic model assessment of insulin resistance; HbA1c: glycosylated haemoglobin A1c; HbA1c5.7/6.0 : HbA1c threshold 5.7% or 6.0% (usually reflecting 5.7% to 6.4% and 6.0% to 6.4%, respectively); HbA1c/IFG: both HbA1c and IFG; i‐: isolated; IFG5.6/6.1 : impaired fasting glucose (threshold 5.6 mmol/L or 6.1 mmol/L); IGT: impaired glucose tolerance; IFG/IGT: both IFG and IGT; IQR: interquartile range; NCEP: national cholesterol education program; OGTT: oral glucose tolerance test; PG: postload glucose; SD: standard deviation; T2DM: type 2 diabetes mellitus; γ‐GT: gamma‐glutamyl transferase/transpeptidase | ||||
Appendix 8. Baseline characteristics (I)
| Study ID | Setting | N participants in original cohort | N study sample | Notes |
| Amsterdam, The Netherlands | 2975 | 456 | Baseline data for total cohort included in the analyses (N = 456)/South‐Asian Surinamese (N = 90)/African Surinamese (N = 190)/"ethnic Dutch" (N = 176) | |
| Bangkok, Thailand | 3499/3245 | 2667 | Baseline data for cohort becoming diabetic (N = 361) | |
| Jordan | Unclear | 121/68–200/144 (controls) | Few baseline data reported for study population (N = 212) | |
| Chennai, India | 26,001 | 3589/2207 | Baseline data for cohort becoming diabetic at follow‐up (N = 176) | |
| South Korea | 10,959 | 9723 | Baseline data for the total cohort (N = 9723) | |
| Barcelona, Spain | 2248 | 168 | Baseline data for prediabetic cohort (N = 115) | |
| Chennai, India | 4885/1082 | 1082/696 | Baseline data for the IGT cohort (N = 252) | |
| Israel | 1970 | 1037 | Baseline data for IGT cohort (N = 24) | |
| Bruneck (South Tyrol), Italy | 1000 | 936 | No baseline data (except white participants aged > 40 years, N = 919) | |
| Finland | 593 | 553/499 | Baseline data for the cohort (total N = 553, men N = 223, women N = 330) | |
| Norfolk (East Anglia), UK | 77,630/25,639 | 6372/5735 | Baseline data for HbA1c6.0‐6.4 cohort (N = 370) | |
| Paris, France | Unclear | 7540 (2nd clinical examination)/4089 | Baseline data for individuals with IGT converting to T2DM (N = 32) | |
| Penghu, Taiwan | 1601 | 1306/600 | Baseline data for cohort converting to T2DM (N = 26) | |
| China | 8845 | 1374 | Baseline data for i‐IFG/i‐IGTand IFG/IGT across age groups < 40 years + > 60 years (data indicate range across groups) (i‐IFG < 40 years N = 51 and > 60 years N = 278; i‐IGT < 40 years N = 41 and > 60 years N = 151; IFG/IGT: < 40 years N = 34 and > 60 years N = 175) | |
| Mexico | 820 | 656 | Baseline characteristics for the prediabetic cohort (N = 217) | |
| Australia, Blue Mountains region | 4433/3654 | 2335 (5 years)/1952 (10 years)/2123 complete data (10 years) | Baseline data for people without diabetes (N = 3437) | |
| Australia | Unclear | 1167/395 (IFG5.6) | Baseline data for IFG cohort at baseline (N = 187) | |
| The Netherlands | 574/491 | 476 | Baseline data for prediabetic group (N = 122) | |
| Tehran, Iran | 12808 | 8231 | Baseline data for prediabetes group with normal blood pressure | |
| Nauru, Micronesia | 1497/1201 | 830 (1982/1987‐including 143 nondiabetic person from 1975/76) | No baseline data provided | |
| Mexico | 3505 | 2282/1963 | Baseline characteristics: range across different definitions of prediabetes | |
| Attica, Greece | 4056/3042/1875 | 1485 | Baseline data for IFG5.6 cohort (N = 343) | |
| Ely (Cambridgeshire), UK | 1571/1122 (phase 1)/912 (phase 2) | 683 (phase 3) | Baseline data for IFG6.1 cohort (N = 257) | |
| Sacramento (CA), USA | 1789 | 1777 | Baseline data for prediabetic cohort (N = 310) | |
| France | 3817 | 979 | No baseline data | |
| Columbia | 2012 | 772 | Baseline data for the total cohort (N = 772) | |
| Durango, Mexico | Unclear | 375 | Baseline data for IGT cohort at baseline progressing to T2DM (N = 20); all individuals were counselled on the importance of diet and physical exercise (standard care for the whole cohort) | |
| Ansung‐Ansan, South Korea | 10,030 | 7542 | Baseline data for i‐IFG, i‐IGT and IFG/IGT cohort | |
| USA | 1625 | 822 | Baseline data for diabetic cohort at follow‐up (N = 131); participants were recruited from 2 population‐based studies: the San Antonio Heart Study and the San Luis Valley diabetes study | |
| Japan | 32057 | 6636/6241 | Baseline data for total cohort (N = 6241) | |
| Gunma (Gyeonggi), Japan | Unclear | Unclear | Baseline data for the IGT cohort (N = 37) | |
| Isfahan, Iran | 3370 | 1489 | Baseline data for i‐IFG, i‐IGT and IFG/IGT cohort at baseline (N = 770); first‐degree relatives of people with T2DM | |
| Thailand | 181 | 177 (157) | Baseline data for IGT cohort (N = 27) | |
| Dalseong County, South Korea | 1806/1599 | 1474 | 1287 participants were re‐evaluated in 2008 and 187 new participants "added to the study"; baseline data for participants with incident diabetes (N = 135) | |
| Bangkok, Thailand | 3989 | 3243/2370 | Baseline data for total cohort becoming diabetic at follow‐up (N = 48) | |
| Seoul, South Korea | 20,203/15,936 | 2964 | Baseline data for FPG group 4 (6.1–7.0) with baseline and follow‐up (N = 276) | |
| Incheon, South Korea | 7510 | 7211 | Baseline data for IFG5.6/IFG6.1 cohort (N = 1335/494) | |
| Seoul, South Korea | 418 | 418 | Baseline data for i‐IFG (N = 158)/i‐IGT (N = 65)/IFG/IGT (N = 119)/i‐HbA1c (N = 64); total (N = 406) | |
| Seoul, South Korea | 19,356 | 17,971 | 2 baseline data cohorts: prediabetes by FPG only and HbA1c only (N = 3544 and N = 1713) | |
| Germany | 79 | 79 | Baseline data for IGT cohort (N = 79) | |
| Germany | 128 | 128 | Baseline data for IFG cohort (N = 128) | |
| Hong Kong | 123 | 123 | Baseline data for the IGT cohort (N = 123) | |
| Hong Kong | 657 | 319 | Baseline data for IFG cohort (N = 55) | |
| Sweden | 1843 | 265 | Baseline data for i‐IGT (N = 66)/i‐IFG (N = 42)/IFG/IGT (N = 30); 265 follow‐up participants were randomly sampled from each glucose tolerance group of the original cohort and invited for follow‐up | |
| Ahvaz (Khuzestan), Iran | 12,514/6640 | Unclear/593 | Baseline for prediabetic cohort becoming diabetic at follow‐up | |
| France | 56,650 | 4532 | Baseline data for IFG cohort attending both examinations (N = 743) | |
| South Korea | 6246 | 5528 | Baseline data for the total cohort (N = 3497) | |
| Chile | 1007 | 177 | Most baseline data for cohort becoming diabetic at follow‐up (N = 94 with IFG) | |
| Framingham (MA), USA | Unclear | 3634 | Baseline data for individuals on first exam, free of cardiovascular disease (N = 4058) | |
| Kinmen, Taiwan | Unclear | 644 | Baseline data for i‐IGT (N = 118)/i‐IFG (N = 42)/IFG/IGT (N = 49) | |
| Rotterdam, The Netherlands | 14,926/11,740 | 11,740/10,050 | Baseline data for prediabetic cohort (N = 1382) | |
| USA | 3075 | 1690 | Baseline data for i‐IFG (N = 189)/i‐HbA1c5.7 (N = 207)/IFG/HbA1c (N = 169) | |
| Jiang Su province, China | 6400/5888 | 1844 | Baseline data for non‐diabetic participants (N = 1844); M (N = 788)/W (N = 1056) | |
| Shanghai, China | 4556 | 3174 | Baseline data for the prediabetic cohort converting to T2DM (N = 78) | |
| Beijing, China | 2101 | 1857 | Baseline data for participants without diabetes at baseline (N = 1857) | |
| China | 27,020 | 23,626/18,610 | Baseline data for IFG cohort at baseline (N = 3607) | |
| San Antonio (TX), USA | 2941/2569 | 1734 | Baseline data for cohort converting to T2DM (N = 195) | |
| Finland | Unclear | 2115 | Baseline data for IFG‐IGT individuals who converted to T2DM (N = 86) | |
| Australia | 20,347/11,247 | 6537 | Baseline data for cohort becoming diabetic at follow‐up (N = 224) | |
| Singapore | 3280 | 1279/1137 | Baseline data for incident diabetes cohort (N = 127) | |
| Colorado, USA | 1321 | 173/134 | Baseline data for IGT cohort converting to T2DM (N = 20) | |
| Seattle (WA), USA | 518 | 465 (5 years)/412 (10 years) | Baseline data for cohort converting to T2DM at 5–6 years (N = 50) and 10 years (N = 74) | |
| Baltimore (MD) and Washington, D.C., USA | Unclear | 815/753 | Baseline data for the IFG‐IGT cohort (N = 265); follow‐up time: at least 6 years 77%, at least 10 years 44%, at least 16 years 16%, at least 20 years 4.5% | |
| Chennai, India | 1061 | 513 | Baseline data for cohort becoming diabetic at follow‐up (N = 64) | |
| Durban (KwaZulu‐Natal), South Africa | 2479 | 563 | Baseline data for responders (both baseline and follow‐up examination) (N = 563) | |
| Italy | 2603 | 2603 | No baseline data provided | |
| Kuopio (Northern Savonia), Finland | 1300 | 1054/892 | Baseline data for cohort developing T2DM (N = 69) | |
| Japan | 6012 | 2770/2267 | Baseline data for cohort converting to T2DM (N = 99) | |
| Japan | Unclear/6812 | 5746 | Baseline characteristics for IFG cohort (N = 246) | |
| Japan | 22387 | 2207 | Baseline characteristics for the total cohort (N = 2207) | |
| South Korea | 6305 | 5557 | Baseline data for incident diabetic participants with IFG at baseline (N = 40) | |
| Sweden | 119 | 87/74/29 | Baseline data for IGT cohort (N = 29) | |
| Shanghai, China | 1869 | 1042 | Baseline data for cohort progressing to T2DM (N = 377) | |
| Oulo (North Ostrobothnia), Finland | 1008/768 | 183 (1st)/193 (2nd, other group) | Few baseline data for IGT cohort (N = 171) | |
| Madras, India | Unclear | 107 | Baseline data for the diabetic cohort at follow‐up (N = 39) | |
| Denmark | 1821 | 1510/1002 | Baseline data for IFG (N = 607)/IGT cohort (N = 903) | |
| Augsburg (Bavaria), Germany | 2656 | 1202 | Baseline data for total cohort (follow‐up participants, age‐group 55–74 years, N = 887) | |
| The Netherlands | 2484/1513 | 1428 | Baseline data for IFG6.1 (N = 149)/IFG5.6 (N = 488) | |
| Isfahan, Iran | 6323 | 2980 | Baseline data for prediabetic cohort becoming diabetic at follow‐up (N = 131) | |
| Osaka, Japan | 507 | 207 | Baseline data for the IGT cohort (N = 13) | |
| Japan | 12,647 | 9116/6804 | Baseline data for cohort becoming diabetic at follow‐up (N = 659) | |
| Malta | 2128 | 1422 | Baseline data for diabetic cohort at follow‐up (N = 166) | |
| Zanjan, Iran | 2941 | 395 | Baseline data for active participants (N = 123) | |
| Yonchon County, South Korea | 2520/2293 | 2248/1193 | Baseline data for individuals converting to T2DM (N = 67) | |
| Mauritius | 5083/6616/6291 | Unclear | Baseline data for cohort 1987–1998 (N = 2631), 10 years follow‐up; 3 cohorts 1987–1992 (N = 3680), 1992–1998 (N = 4178), 1987–1998 (N = 2631) | |
| South Korea | 4899 | 2079 | Baseline data for prediabetic cohort (men N = 154; women N = 167; total N = 321) | |
| Shanghai, China | 2132 | 778/526 | Baseline data for prediabetic cohort (N = 334) | |
| Pizarra (Andalusia), Spain | 1051 | 824 | Baseline data for final sample of follow‐up (N = 714) | |
| Finland | 1711 | 716/637 | Baseline data for IGT cohort converting to T2DM (N = 17) | |
| Japan | 732 | 128 | Baseline data for cohort becoming diabetic at follow‐up (N = 36); participants with IFG and/or IGT were given advice about lifestyle modifications once or twice a year | |
| Naples, Italy | 1285/1245 | 1141/560 | Baseline data for total cohort (follow‐up examination N = 560) | |
| Spain | 1626/1034 | 943/630 | Baseline data for IFG5.6–6.1 (N = 114)/IFG6.1–6.9 (N = 52) | |
| Phoenix (AZ), USA | Unclear | 2095 (10–19 years)/2005 (20–39 years) | Baseline data for adults/children with HbA1c 5.7%‐6.4% (children N = 62, adults N = 168) | |
| India (probably Chennai) | 4084 | 1659 | Baseline data for IGT group (N = 619); participants were given advice on preventive measures such as dietary modifications and regular exercise | |
| Beijing, China | 20,682/1566 | 902 | Baseline data for cohort with incident diabetes and no coronary heart disease (N = 67) | |
| Arizona/North/South Dakota/Oklahoma, USA | Unclear | 2849/1670 (2nd exam) | No baseline data | |
| USA, 4 communities | 15,792 | Cohort 1, N = 10844: 1990–1992 (FG, HbA1c) as baseline Cohort 2, N = 7194: 1996–1998 (FG, 2‐h glucose) as baseline | 2 different baseline cohorts; 4 prediabetes definitions (visit 2: IFG5.6–6.9 N = 4112; HbA1c5.7‐6.4 N = 2027; visit 4: IFG5.6–6.9 N = 2142; IGT N = 2009) | |
| Hong Kong | 2900 | 434/322 | Baseline data for IGT cohort (N = 322) | |
| Conneticut, USA | 129 | 117 | Baseline data for IGT cohort (N = 33) | |
| Arizona, USA | Unclear | 5532 | Baseline data for the full cohort (N = 5532); prediabetic cohort = non‐overweight (N = 37) + IGT group and overweight + IGT group (N = 132); 5–11 years/12–19 years | |
| Singapore | 3568 | 469/291 | Baseline data for IGT group (N = 291) | |
| USA | 6814 | 6814/6753 | Baseline data for IFG cohort (N = 940) | |
| Uppsala, Sweden | 2322/1221/1010 | 840/667 | Baseline data for cohort converting to T2DM (N = 26) | |
| FG: fasting glucose; FPG: fasting plasma glucose; HbA1c: glycosylated haemoglobin A1c; HbA1c5.7/6.0 : HbA1c threshold 5.7% or 6.0% (usually reflecting 5.7% to 6.4% and 6.0% to 6.4%, respectively); HbA1c/IFG: both HbA1c and IFG; i‐: isolated; IFG5.6/6.1 : impaired fasting glucose (threshold 5.6 mmol/L or 6.1 mmol/L); IGT: impaired glucose tolerance; IFG/IGT: both IFG and IGT; PG: postload glucose; T2DM: type 2 diabetes mellitus | ||||
Appendix 9. Baseline characteristics (II)
| Study ID | Sex, % | Age (SD), | 'Ethnicity', % white | 'Ethnicity', | 'Ethnicity', | 'Ethnicity', | Family history of diabetes, | BMI (SD), | Notes |
| 59 | 45 | 39 | 20 | — | 42 | 55 | 26.4 | Total cohort | |
| 19 | 43.6 (5.0) | — | 100 | — | — | 53 | 24.8 (3.2) | — | |
| — | 63% > 40 | — | 100 | — | — | 99 | — | — | |
| 61 | 47 (13.1) | — | 100 | — | — | 47 | 25.8 (4.3) | — | |
| 25 | 44.7 (5.4) | — | 100 | — | — | — | 23.8 (2.8) | — | |
| 52 | 61.2 (11.8) | — | — | 100 | — | 26 | — | — | |
| 35 | Mainly 40–60+ | — | 100 | — | — | — | — | — | |
| 38 | 50.5 (8.3) | 42 | 29 | — | 47 | — | Men: 26.5 (3.8) | — | |
| — | — | 100 | — | — | — | — | — | — | |
| — | — | 100 | — | — | — | — | Men: 27.6 (3.5) | — | |
| 54 | 62.4 (8.2) | 100 | — | — | — | 14 | 26.6 (4.0) | — | |
| 0 | 48.8 (1.8) | 100 | — | — | — | — | 27 (4) | — | |
| 49 | 59.6 | — | 100 | — | — | 21 | 25.7 (3.1) | — | |
| 54–58 | 40–67 | — | 100 | — | — | 9–37 | 23.8–24.8 | — | |
| 10 | 47.9 (8.6) | — | — | 100 | — | — | 26.8 (3.0) | — | |
| 57 | 67.4 | 100 | — | — | — | 19 | 26 | — | |
| 100 | 53.8 (IQR 44.0–64.4) | Mostly white Australians | — | — | — | — | 27.7 (IQR 24.3–31.4) | — | |
| 39 | 60.8 (IQR 55.3–64.9) | 100 | — | — | — | — | 28.0 (IQR 26.5–31.2) | — | |
| 56 | 42.8 (11.7) | — | 100 | — | — | — | 26.9 (4.1) | — | |
| — | — | — | 100 | — | — | — | — | — | |
| 52–70 | 47–50 | — | — | 100 | — | 27–45 | 29.1–30.5 | — | |
| 35 | 46.4 (12.4) | 100 | — | — | — | 22 | 27.4 (4.7) | — | |
| 44 | 55.5 (7.9) | 100 | — | — | — | — | 27.8 (4.6) | — | |
| — | 69.8 (6.9) | — | — | 49 | — | — | 31.1 (5.6) | — | |
| 31 | 30–64 | 100 | — | — | — | — | — | — | |
| 70 | 58 (12) | — | — | 100 | — | — | 27.4 (4.6) | — | |
| — | 38 | — | — | 100 | — | — | 32.9 (5.6) | — | |
| 28 60 33 | 50.4 (8.3) 53.1 (8.9) 52.4 (8.7) | — | 100 100 100 | — | — | 15 12 15 | 25.5 (3.4) 24.9 (3.2) 25.4 (3.2) | i‐IFG5.6 i‐IGT IFG/IGT | |
| 60 | 56.2 (7.9) | 38 | — | 36 | 26 | — | — | — | |
| 25 | 49.9 (8.7) | — | 100 | — | — | — | 22.8 (2.8) | — | |
| — | — | — | 100 | — | — | — | 23.2 | — | |
| — | 44.4 44.1 | — | 100 | — | — | 100 | 29.2 | i‐IFG | |
| 37 | 12.4 (2.3) | — | 100 | — | — | — | 35.3 (5.8) | — | |
| — | 61 (9) | — | 100 | — | — | 7 | 24.6 (3.2) | — | |
| 67 | 49.5 (12) | — | 100 | — | — | 15 | 26.9 (0.6) | — | |
| 15 | 50.7 (7.2) | — | 100 | — | — | 9 | 24.6 (2.2) | — | |
| 7 | 41 | — | 100 | — | — | 9 | 24 | IFG5.6 | |
| 49 | 60.2 (11.3) 59.1 (10.1) 59.3 (10.1) | — | 100 | — | — | 29 | 24.7 (3.0) | i‐IFG | |
| 24 | 49.5 | — | 100 | — | — | 22 | 24.4 | IFG HbA1c | |
| 51 | 13.1 (2.1) | 100 | — | — | — | — | 31.8 (6.3) | — | |
| 53 | 13.5 (2.1) | 100 | — | — | — | — | 31.7 (6.1) | — | |
| 88 | 22–26 | — | 100 | — | — | — | — | — | |
| 84 | 37.4 (9.3) | — | 100 | — | — | 38 | 25.9 (4.0) | — | |
| 100 | 66 (2.3) | 100 | — | — | — | — | 24.6 | i‐IGT | |
| 38 | 46.6 (12.5) | — | 100 | — | — | 80 | — | — | |
| 0 | 44.5 (7.5) | 100 | — | — | — | 3 | 26.4 (3.6) | — | |
| 33 | 46.1 (8.5) | — | 100 | — | — | 24 | 24.8 (3.1) | — | |
| 57 | 25–80 | — | — | 100 | — | — | 33.1 (4.3) | — | |
| 53 | Women: 48 Men: 49 | Mainly white | — | — | — | — | Men: 27.3 (3.9) Women: 25.6 (5.4) | — | |
| 57 | 56.1 | — | 100 | — | — | — | 24.8 | i‐IGT | |
| 51 | 66.6 (9.4) | 92 | — | — | — | — | 27.9 (4.2) | — | |
| 33 | 76.6 | 82 | — | — | — | — | 27.9 | i‐IFG | |
| 57 | Men: 52 | — | 100 | — | — | Men: 6 | — | — | |
| 48 | 68.6 (6.7) | — | 100 | — | — | — | 23.5 (3.0) | — | |
| ‐ | Men: 70 | — | 100 | — | — | — | — | — | |
| 50 | 50.9 (9.7) | — | 100 | — | — | — | 24.2 (3.6) | — | |
| 61 | 47.7 (0.8) | 19 | — | 81 | — | 46 | 31.3 | — | |
| 50 | 52 (11) | 100 | — | — | — | 100 | — | — | |
| 49 | 55.8 (12.0) | 85 | — | — | — | 31 | Men: 29.3 (0.4) | — | |
| 57 | 54.4 (9.7) | — | 100 | — | — | 39 | 28.5 (5.3) | — | |
| 75 | 58.6 | 40 | — | 60 | — | 53 | 29.2 | — | |
| 52 41 | 58.9 57.5 | 100 | — | — | 60 62 | 24.9 25.1 | 5–6 years follow‐up | ||
| 28 | 61.8 (14) | 95 | — | — | — | 29 | ≥ 25: 60% | — | |
| — | 43 (14) | — | 100 | — | — | 28 | 24.4 (4.4) | — | |
| 60 | 36.4 (13.9) | — | 100 | — | — | 45 | 22.6 (6.0) | — | |
| — | 65–84 | 100 | — | — | — | — | — | — | |
| 57 | 68.6 | 100 | — | — | — | 29 | 29 | — | |
| 27 | 53 (7) | — | 100 | — | — | 19 | 24.6 (3.5) | — | |
| 0 | 49 (5.8) | — | 100 | — | — | 16 | 24.6 (3.0) | — | |
| 63 | Men: 62.4 Women: 61.5 | — | 100 | — | — | — | Men: 24.1 (3.0) Women: 24.2 (3.2) | — | |
| 0 | 36.4 (3.9) | — | 100 | — | — | — | 24.8 (3.0) | — | |
| 48 | 61.4 (0.8) | 100 | — | — | — | — | 26.9 (5.4) | — | |
| — | 60 (13) | — | 100 | — | — | — | 24.9 (3.7) | — | |
| 58 | — | 100 | — | — | — | — | — | — | |
| 31 | 48 | — | 100 | — | — | 49 | 25.2 | — | |
| 43 | 59.9 | 100 | — | — | — | — | 29.1 | IFG IGT | |
| 49 | 63.2 (5.4) | 100 | — | — | — | 23 | 28.1 (4.0) | — | |
| 46 | 62.5 | 100 | — | — | — | — | 27.6 | IFG6.1 | |
| 59 | 51.3 (9.8) | — | 100 | — | — | 20 | 29.4 (4.5) | — | |
| 54 | 57.4 | — | 100 | — | — | — | — | — | |
| 0 | 48.6 (4.2) | — | 100 | — | — | 20 | 24.7 (3.3) | — | |
| 56 | Women: 59.8 Men: 57.7 | 100 | — | — | — | — | — | — | |
| 63 | 40 (14) | — | 100 | — | — | — | 27.5 (4) | — | |
| 34 | 59.6 | — | 100 | — | — | 6 | 24.5 | — | |
| 56 | 41.2 | — | 70 | — | 30 | — | 23.9 | — | |
| 52 | 56–57 | — | 100 | — | — | Men: 10 Women: 22 | Men: 25.2 (2.7) Women: 25.8 (3.4) | — | |
| 63 | 57.2 (10.0) | — | 100 | — | — | — | — | — | |
| 65 | 45.0 (13.4) | 100 | — | — | — | 58 | 28.3 (5.2) | — | |
| 0 | 70.8 (4.8) | 100 | — | — | — | — | 26.1 (4.2) | — | |
| 0 | 50.5 (5.8) | — | 100 | — | — | — | 24.9 (3.3) | — | |
| 23 | 44.1 (4.0) | 100 | — | — | — | — | 26.9 (4.4) | — | |
| — | 54.8 | 100 | — | — | — | — | 28.2 | IFG5.6 | |
| 97 | 29.9 | — | 100 | — | — | — | 39.1 32.0 | Adults Children | |
| 39 | 42.4 (9.8) | — | 100 | — | — | — | — | — | |
| 46 | 47.9 (10.7) | — | 100 | — | — | — | 25.2 (3.5) | — | |
| — | — | — | 100 | — | — | — | — | — | |
| 48 | 57.6 (5.7) | — | — | — | 25 | 25 | 28.9 (5.2) | Data for cohort 1 (IFG5.6) | |
| 57 | 51 | 100 | — | — | — | 25.6 | — | ||
| 73 | 12.5 (2.7) | 45 | 39 | 12 | — | — | 36.6 (8.7) | — | |
| 53 | 11.4 (3.6) | 100 | 100 | — | — | — | Percentile: 87.6 | — | |
| 53 | 43.8 | — | 100 | — | — | 28 | 25.2 | — | |
| 44 | 64.2 (9.8) | 31 | 15 | 25 | 30 | — | 30.1 (5.7) | — | |
| 0 | 77 | 100 | — | — | — | — | 26.7 (3.2) | — | |
| BMI: body mass index; FG: fasting glucose; FPG: fasting plasma glucose; i‐HbA1c: (isolated) glycosylated haemoglobin A1c; HbA1c5.7/6.0 : HbA1c threshold 5.7% or 6.0% (usually reflecting 5.7% to 6.4% and 6.0% to 6.4%, respectively); HbA1c/IFG: both HbA1c and IFG; i‐: isolated; IFG5.6/6.1 : impaired fasting glucose (threshold 5.6 mmol/L or 6.1 mmol/L); IGT: impaired glucose tolerance; IFG/IGT: both IFG and IGT; IQR: interquartile range; SD: standard deviation; SDS: standard deviation score | |||||||||
Appendix 10. Baseline characteristics (III)
| Study ID | Mean (SD)/median (IQR)/range systolic BP, mmHg | Mean (SD)/median (IQR)/range diastolic BP (SD), mmHg | Smoking: current and/or past, % | Medications, % | Comorbidities, % | Mean (SD)/median (IQR)/range FPG, | Mean (SD)/median (IQR)/range 2‐h glucose, mmol/L | Mean (SD)/median (IQR)/range HbA1c, | Notes |
| — | — | 38 | — | Hypertension: 26 26 32 19 | 5.2 | — | — | Total cohort South‐Asian Surinamese African Surinamese | |
| — | — | 42 | — | Hypertension: 33 | — | — | — | — | |
| — | — | — | — | Hypertension: 47 | — | — | — | — | |
| 129 (21) | 78 (11) | 13 | — | — | 5.2 (0.6) | 8.7 (1.4) | 6.2 (0.7) | — | |
| 113 (14) | 76 (10) | — | — | — | 5.3 (0.5) | — | 5.4 (0.3) | — | |
| — | — | 33 | — | Hypercholesterolaemia: 38 Hypertriglyceridaemia: 15 | — | — | — | — | |
| — | — | — | — | — | — | — | — | — | |
| 128 (16) | 84 (10) | 38 | — | — | 5.2 (0.5) | 8.6 (1.0) | — | — | |
| — | — | — | — | — | — | — | — | — | |
| Men: 142 | Men: 80 | Men: 18 | — | — | Men: 5.0 | Men: 6.8 | — | — | |
| 139 (17) | 84 (11) | 15 | BP lowering: 21 | — | — | — | — | — | |
| — | — | — | — | — | 6.6 (0.8) | 9.3 (0.9) | — | — | |
| — | — | 38 | — | Hypertension: 46 | — | — | — | — | |
| — | — | 12–24 | — | Hypertension: 28–55 | 5.1–6.1 | 5.9–9.2 | — | Range for i‐IFG, i‐IGT and IFG/IGT cohorts separated by < 40 years and > 60 years | |
| — | — | — | — | — | 5.9 (0.3) | — | — | — | |
| 146 | 83 | — | — | — | 5 | — | — | — | |
| 128 (IQR 114–140) | 79 (IQR 72–86) | 13 | — | Hypertension: 43 | 5.3 (IQR 5.0–5.8) | — | — | — | |
| 141 (IQR 132–155) | 83 (IQR 78–92) | 18 | — | — | 6.0 (IQR 5.5–6.3) | 8.8 (IQR 7.8–9.9) | 5.8 (IQR 5.6–6.1) | — | |
| — | — | 26 | — | — | — | — | — | — | |
| — | — | — | — | — | — | — | — | — | |
| 118–128 | 71–78 | — | — | — | 4.9–6.4 | 6.7–9.5 | — | Range for i‐IFG5.6, i‐IFG6.1, i‐IGT, IGT5.6 and IGT6.1 cohorts | |
| 127 (17) | 82 (10) | 62 | — | Hypertension: 36 Hypercholesterolaemia: 54 | 5.9 (0.3) | — | — | — | |
| 136 (16) | 82 (10) | 52 | — | — | — | — | — | — | |
| — | — | 58 | — | — | — | — | — | — | |
| — | — | — | — | — | — | — | — | — | |
| — | — | — | — | — | 5.2 (0.7) | 6.0 (1.8) | 6.5 (1.3) | — | |
| — | — | — | — | Dyslipidaemia: 41 | 6.4 (0.6) | — | — | — | |
| 120 (17) 119 (18) 124 (18) | 78 (12) 76 (12) 80 (11) | 64 34 59 | — | Hypertension: 28 27 36 | 5.9 (0.3) 4.8 (0.4) 5.9 (0.3) | 6.1 (1.2) 8.9 (0.9) 9.3 (0.9) | 5.5 (0.4) 5.5 (0.4) 5.7 (0.4) | i‐IFG5.6 i‐IGT IFG/IGT | |
| 132 (20) | 79 (10) | — | BP lowering: 38 | — | 5.9 (0.7) | 8.5 (1.7) | — | — | |
| 125 (16) | 76 (11) | — | — | — | 5.3 (0.5) | 5.3 (0.3) | — | ||
| 142 (9) | 73 (7) | — | — | — | — | — | — | — | |
| 116–117 | 76–77 | — | — | Hypertension: 20–23 | 5.1–61 | 5.9–9.2 | 5.1–5.3 | Range for i‐IFG, i‐IGT and IFG/IGT cohorts | |
| 124 (15) | 77 (9) | — | — | — | — | — | — | — | |
| 139 (21) | 87 (12) | 43 | — | — | — | — | 5.7 (0.5) | — | |
| — | — | 4 | — | — | — | — | — | — | |
| — | — | — | — | — | 6.4 (0.2) | — | — | — | |
| 128/132 | 80/83 | — | — | — | 5.8/6.4 | — | — | — | |
| 127–129 | 78 | 20–31 | — | — | — | — | — | Range for i‐IFG, i‐IGT, IFG/IGT and i‐HbA1c cohorts | |
| 116–120 | 72–75 | 24–25 | — | — | 5.1–5.9 | — | 5.3–5.8 | Range for IFG and HbA1c cohorts | |
| 120 (16) | 73 (13) | — | — | — | 5.1 (1.1) | 8.5 | 5.6 (0.7) | — | |
| 120 (14) | 73 (12) | — | — | — | 4.8 (0.4) | 8.4 (0.6) | — | — | |
| — | — | — | — | — | — | — | — | — | |
| 125 (21) | 78 (10) | 2 | — | — | 6.5 (0.3) | 9.1 (2.1) | 6.2 (0.6) | — | |
| — | — | — | — | — | 4.7/5.5/5.5 | 8.6/6.8/8.7 | — | — | |
| — | — | — | — | Hypertension: 40 | — | — | — | — | |
| 135 (13) | 81 (10) | 23 | — | Hypertension: 48 | 6.4 (0.2) | — | — | — | |
| 125 (15) | 81 (11) | 20 | — | Hypertension: 22 | — | — | 5.9 (0.2) | — | |
| 134 (16) | 77 (10) | — | — | — | — | — | — | — | |
| Women: 122 | — | Women: 29 | Antihypertensives: Women: 14 | Hypertension: Women: 26 | — | — | — | — | |
| 136–138 | 85–87 | — | — | — | 5.4–6.4 | 6.8–9.1 | — | Range for i‐IFG, i‐IGT and IFG/IGT cohorts | |
| 145 (21) | 81 (12) | 50 | BP lowering: 33 | Stroke: 3 Hypertension: 64 | — | — | — | — | |
| 140–143 | — | 54–65 | — | — | 5.1–6.1 | — | 5.3–5.9 | Range for i‐IFG, i‐HbA1c and IFG/HbA1c cohorts | |
| Men: 126 | Men: 80 | — | — | — | Men: 5.3 | — | — | — | |
| 132 (16) | 82 (8) | — | — | — | 5.8 (0.8) | 9.2 (1.2) | — | — | |
| — | — | — | — | — | — | — | — | — | |
| 128 (21) | 81 (11) | 37 | — | — | 5.9 (0.4) | — | — | — | |
| 124 | 75 | — | — | — | 5.3 | 7.6 | — | — | |
| 140 | 85 (11) | — | — | — | 6.3 (IQR 5.8–6.6) | 8.3 (1.6) | 5.7 (0.4) | — | |
| — | — | 48 | — | — | 6 | 8 | 5.5 | — | |
| 145 (20) | 80 (12) | 13 | — | Hypertension: 74 | — | — | — | — | |
| — | — | — | — | — | 6.1 | 9.5 | — | — | |
| 139 | 80 | — | — | — | 5.5 | 9.0 | — | 5–6 years follow‐up 10 years follow‐up | |
| — | — | — | — | — | — | — | — | — | |
| 127 (19) | 81 (11) | — | — | — | 4.5 (0.6) | — | — | — | |
| 119 (19) | 78 (13) | — | — | — | 4.6 (1.8) | 6.2 (3.8) | — | — | |
| — | — | — | — | — | — | — | — | — | |
| 159 | 84 | 1 | Antihypertensives: 24 | Hypertension: 47 | 6.2 | 8.4 | — | — | |
| 134 (18) | 82 (12) | 35 | — | — | 6.0 (0.6) | — | 6.0 (0.3) | — | |
| 133 (16) | 81 (11) | 53 | — | Dyslipidaemia: 40 | 6.4 (0.2) | — | — | — | |
| — | — | — | — | — | Men: 5.4 | — | Men: 5.0 | — | |
| — | — | — | — | — | 6.0 (0.3) | — | — | — | |
| — | 75 (11) | — | — | — | — | — | 5.5 (0.4) | — | |
| 126 (21) | 81 (12) | — | — | — | 5.2 (0.7) | 6.1 (1.5) | — | — | |
| — | — | — | — | Hypertension: 49 | — | — | — | — | |
| — | — | — | — | — | — | — | — | — | |
| 140–142 | — | — | — | — | — | — | — | Range for IFG and IGT cohorts | |
| 133 (19) | 80 (10) | 49 | Lipid lowering: 11 | Hypertension: 49 | 5.5 (0.5) | 6.3 (1.7) | 5.6 (0.4) | — | |
| 139–145 | 84–85 | — | — | — | — | — | — | Range for IFG5.6 and IFG6.1 cohorts | |
| 127 (21) | 81 (11) | 14 | — | — | 5.7 (0.7) | 8.4 (1.5) | — | — | |
| — | — | — | — | — | 5.6 (0.9) | 9.0 (0.9) | — | — | |
| — | — | 91 | — | — | 6.0 (0.6) | — | 5.6 (0.6) | — | |
| — | — | — | — | — | Women: 7.2 | Women: 10.8 | — | — | |
| 130 (12) | 79 (8) | 5 | — | Hypertriglyceridaemia: 48 | — | — | — | — | |
| 130 | 84 | — | — | — | 6.1 | 6.7 | — | — | |
| 125 | 77 | 27 | — | — | 5.5 | 6.5 | — | — | |
| 123–127 | 76–80 | 2–27 | — | Dyslipidaemia: 64–66 | — | — | 5.7–5.8 | Ranges for male and female cohorts | |
| 134 (20) | 85 (12) | 23 | — | — | 6.0 (0.4) | 5.9 (1.6) | — | — | |
| — | — | — | — | — | — | — | — | — | |
| 156 | 88 | — | — | Hypertension: 53 | 5.4 (1.1) | 9.7 (0.8) | — | — | |
| 126 (12) | 81 (10) | 47 | — | — | 6.1 (0.6) | 8.8 (1.3) | — | — | |
| — | — | — | — | — | 4.2 (0.8) | 4.5 (1.7) | — | — | |
| 135–144 | 84–92 | — | — | — | 5.8–6.4 | 6.4–7.3 | 4.9–5.1 | Ranges for IFG5.6 and IFG6.1 cohorts | |
| — | — | — | — | — | A: 5.4/C: 5.2 | A: 6.7/C: 6.5 | A: 5.8/C: 5.7 | — | |
| — | — | — | — | — | 6.1 (0.7) | 8.9 (1.0) | — | — | |
| 124 (19) | 78 (11) | 28 | — | Hypertension: 36 | 5.8 (0.9) | 7.4 (1.7) | — | — | |
| — | — | — | — | — | — | — | — | — | |
| — | — | 22 | — | Hypertension: 38 | 6.0 (0.4) | — | 5.6 (0.4) | Data for cohort 1 (IFG5.6) | |
| 126 | 78 | — | — | — | 5.4 | 8.9 | — | — | |
| — | — | — | — | — | 5.2 | 8.9 | — | — | |
| — | — | — | — | — | — | 5.4 (1.2) | — | — | |
| 125 | 74 | 24 | — | — | 5.7 | 8.9 | — | — | |
| 132 (21) | 74 (11) | 50 | BP lowering: 56 | — | 6.0 (0.4) | — | — | — | |
| — | — | — | — | — | 5.7 (0.7) | 7.9 (1.9) | — | — | |
| 2‐h: 2‐h measurement after an OGTT; BP: blood pressure; CHD: coronary heart disease; FG: fasting glucose; FPG: fasting plasma glucose; HbA1c: glycosylated haemoglobin A1c; HbA1c5.7/6.0 : HbA1c threshold 5.7% or 6.0% (usually reflecting 5.7% to 6.4% and 6.0% to 6.4%, respectively); HbA1c/IFG: both HbA1c and IFG; i‐: isolated; IFG5.6/6.1 : impaired fasting glucose (threshold 5.6 mmol/L or 6.1 mmol/L);IGT: impaired glucose tolerance; IFG/IGT: both IFG and IGT; IQR: interquartile range; OGTT: oral glucose tolerance test; SD: standard deviation | |||||||||
Appendix 11. Cumulative incidence as the measurement for the development of T2DM
| Study ID | Diabetes cumulative incidence | ||||||||
| NGT cohort | IFG5.6 cohort | i‐IFG5.6 cohort | IFG6.1 cohort | i‐IFG6.1 cohort | IGT cohort | i‐IGT cohort | IFG/IGT cohort | HbA1c cohort | |
| Admiraal 2014 (10) | Unclear/354 | Total cohort: 51/111 (45.9%) | — | — | — | — | — | — | — |
| Aekplakorn 2006 (12) | Unclear/2444 | 65/223 (29.1%) | — | — | — | — | — | — | — |
| Ammari 1998 (2) | 10/144 (6.9%) | — | — | — | — | 10/68 (14.7%) | — | — | — |
| Anjana 2015 (9.1) | 209/1077 (19.4%) | — | 32/67 (47.8%) | — | — | — | 86/163 (52.8%) | 58/69 (84.1%) | — |
| Bae 2011 (4) | 228/7932 (2.9%) | — | — | — | — | — | — | — | HbA1c5.7: 373/1791 (20.8%) HbA1c6.0: 187/412 (45.4%) |
| Baena‐Diez 2011 (10) | 0 (IFG cohort) | — | — | 33/115 (28.7%) | — | — | — | — | — |
| Bai 1999 (1) | 1/444 (0.2%) | — | — | — | — | 14/252 (5.6%) | — | — | — |
| Bergman 2016 (20) | 202/739 (27.3%) | — | — | — | — | 68/114 (59.6%) | — | — | — |
| Bonora 2011 (15) | 29/710 (4.1%) | — | 10 years: | — | — | 10 years: | 10 years: | HbA1c6.0: 20/70 (28.6%) | |
| Cederberg 2010 (9.7) | 11/410 (2.7%) | — | — | 15/40 (37.8%) | 6.3% | 38/103 (37.1%) | 23.4% | — | HbA1c5.7: 9/24 (37.5%) |
| Chamnan 2011 (3) | 37/5365 (0.7%) | — | — | — | — | — | — | — | HbA1c6.0: 26/370 (7%) |
| Charles 1997 (2) | 27/3671 (0.7%) | — | — | — | 3 years: 15/476 (3.2%) | 2 years: 32/418 (7.7%) | — | — | — |
| Chen 2003 (3) | 11/444 (2.5%) | — | — | 15/156 (9.6%) | — | — | — | — | — |
| Chen 2017 (3) | 60/644 (9.3%) | — | 40/329 (12.2%) | — | — | — | 45/192 (23.4%) | 71/209 (34%) | — |
| Coronado‐Malagon 2009a (1, 2) | Year 1: 3/439 (0.7%) Year 2: 3/439 (0.6%) | — | — | — | — | — | — | — | — |
| Cugati 2007 (10) | 108/1512 (7.1%) | 69/229 (30%) | — | — | — | — | — | — | — |
| De Abreu 2015 (10) | 11/342 (3.2%) | 21/187 (11.2%) | — | — | — | — | — | — | — |
| Den Biggelaar 2016b (7) | 17/294 (5.8%) | — | — | — | — | — | — | — | — |
| Derakhshan 2016c (11.7) | 162/3611 (4.5%) | — | — | — | — | — | — | — | — |
| Dowse 1991 (6.2) | 14/215 (6.5%) | — | — | — | — | 13/51 (25.5%) | — | — | — |
| Ferrannini 2009 (7) | 89/1594 (5.6%) | — | 11/65 (16.9%) | — | 1/17 (5.9%) | — | 31/179 (17.3%) 3 years: 44/188 (23.4%) | — | — |
| Filippatos 2016 (10) | 120/1206 (10.0%) | 71/279 (25.4%) | — | — | — | — | — | — | — |
| Forouhi 2007 (10) | 8/407 (2%) | 53/633 (8.3%) | — | 34/257 (24.7%) | — | 4.4 years: 17/170 (10%) | — | — | — |
| Garcia 2016 (9) | 132/881 (15.0%) | 169/310 (54.5%) | — | — | — | — | — | — | — |
| Gautier 2010 (9) | 0 (IFG cohort) | 142/979 (14.5%) | — | — | — | — | — | — | — |
| Gomez‐Arbelaez 2015d (2) | Unclear/586 | — | — | — | — | — | — | — | — |
| 1/272 (0.4%) | — | — | — | — | 20/67 (29.9%) | — | — | — | |
| Han 2017 (12) | 657/5633 (11.7%) | — | 81/199 (40.7%) | — | — | — | 624/1512 (41.3%) | 138/198 (69.7%) | 10 years: HbA1c5.7: 881/2830 (31.1%) |
| Hanley 2005 (5.2) | 5 years: 47/603 (7.8%) | — | — | — | — | 88/274 (32.1%) 5 years: 101/303 (33.3%) | — | — | — |
| Heianza 2012 (5) | 4.7 years: 34/4149 (0.8%) | 262/1680 (15.6%) | — | 155/380 (40.8%) | — | — | — | — | HbA1c5.7: 184/822 (22.4%) HbA1c6.0: 100/203 (49.3%) HbA1c6.0 and IFG5.6: 271/1748 (15.5%) |
| Inoue 1996 (2.5) | 1/22 (4.5%) | — | — | — | — | 5/37 (13.5%) | — | — | — |
| Janghorbani 2015 (6.8) | 14/627 (2.2%) | — | 23/230 (10%) | — | — | — | 26/150 (17.3%) | 78/214 (36.4%) | — |
| Jaruratanasirikul 2016 (3–6) | 12/108 (11.1%) | — | — | — | — | — | 9/33 (27.3%) | — | — |
| Jeong 2010e (5) | 228/792 (28.8%) | — | — | — | — | — | — | — | — |
| Jiamjarasrangsi 2008a (2.6) | 15/2050 (0.7%) | 33/320 (10.3%) | — | — | — | — | — | — | — |
| Kim 2005 (5) | Unclear/2009 | — | — | 15/276 (5.5%) | — | — | — | — | — |
| Kim 2008 (2) | 21/5382 (0.4%) | 22/1335 (1.6%) | — | 48/494 (9.7%) | — | — | — | — | — |
| Kim 2014 (3.8) | 0 (cohort with intermediate hyperglycaemia) | — | 24/158(15.2%) | — | — | — | 12/65 (18.5%) | 38/119 (31.9%) | i‐HbA1c5.7: 7/64 (10.9%) |
| Kim 2016a (5.2) | 43/10,763 (0.4%) | — | — | 357/1433 (24.9%) | — | — | — | — | HbA1c6.0: 322/1103 (29.2%) |
| Kleber 2010 (1) | 0 (IGT cohort) | — | — | — | — | 1/79 (1.3%) | — | — | — |
| Kleber 2011 (3.9) | 0 (IGT cohort) | — | — | — | — | 3/119 (2.5%) | — | — | — |
| Ko 1999 (1.4) | 0 (IGT cohort) | — | — | — | — | 29/123 (23.6%) | — | — | — |
| Ko 2001 (1.7) | 13/264 (4.9%) | — | — | 14/55 (25.5%) | — | — | — | — | — |
| Larsson 2000 (10) | 5/127 (3.9%) | — | — | — | 5/42 (11.9%) | — | 8/66 (12.1%) | 6/30 (20.0%) | — |
| Latifi 2016 (5) | 25/394 (6.3%) | 21/124 (16.9%) | — | — | — | — | — | — | — |
| Lecomte 2007 (5) | 0 (IFG cohort) | — | — | 127/743 (17.1%) | — | — | — | — | — |
| Lee 2016 (3.7) | 0 (cohort with intermediate hyperglycaemia) | — | — | — | — | — | — | — | HbA1c5.7: 390/3497 (11.2%) |
| Leiva 2014 (6) | 0 (IFG cohort) | — | — | 11/28 (39.3%) | — | — | — | — | — |
| Levitzky 2008 (4) | 0 (IFG cohort) | — | — | Women: 87/313 (27.8%) Men: 92/460 (20.0%) | — | — | — | — | — |
| Li 2003 (5) | 38/435 (8.7%) | — | — | — | 16/42 (38.1%) | 2 years: 23/131 (17.6%) | 33/118 (28%) | 20/49 (40.8%) | — |
| Ligthart 2016 (14.7) | Unclear/7462 | — | — | 425/1382 (30.8%) | — | — | — | — | — |
| Lipska 2013 (7) | 38/1690 (2.2%) | 20/189 (10.6%) | — | 48/100 (48%) | — | — | — | — | i‐HbA1c5.7: 44/207 (21.3%) |
| Liu 2008 (5) | 9/470 (1.9%) | 18/169 (10.7%) | — | — | — | — | — | — | — |
| Liu 2014f (3) | 153/1821 (8.4%) | — | — | — | — | — | — | — | — |
| Liu 2016 (10.9) | Unclear/1635 | — | — | — | — | — | — | — | — |
| Liu 2017 (7.8) | Unclear/15003 | — | — | — | — | — | — | — | — |
| Lorenzo 2003 (7–8) | Unclear/1503 | — | — | 14/29 (48.3%) | — | 88/202 (43.6%) | — | — | — |
| Lyssenko 2005g (6) | 41/1429 (2.9%) | — | — | — | — | — | — | — | — |
| Magliano 2008 (5) | 58/4715 (1.2%) | — | — | 44/370 (11.9%) | — | 122/757 (16.1%) | — | — | — |
| Man 2017 (6) | 15/462 (3.2%) | — | — | — | — | — | — | — | HbA1c5.7: 112/675 (16.6%) |
| Marshall 1994 (1.9) | 0 (IGT cohort) | — | — | — | — | 20/123 (16.3%) | — | — | — |
| McNeely 2003 (10) | 5–6 years: 5/277 (1.8%) 10 years: 13/277 (4.5%) | 5–6 years: 27/125 (21.6%) 10 years: 39/103 (37.9%) | — | 5–6 years: 7/30 (23.3%) 10 years: 18/28 (64.3%) | — | 5–6 years: | — | — | — |
| Meigs 2003 (5, 10) | 6 (SD 5) years: 55/488 (11.3%) | — | — | — | 6 (SD 5) years: 6/20 (30.0%) | — | 6 (SD 5) years: 81/218 (37.1%) | 6 (SD 5) years: | — |
| Mohan 2008 (8) | 64/476 (13.4%) | — | — | — | — | 15/37 (40.5%) | — | — | — |
| Motala 2003 (10) | 36/482 (7.5%) | — | — | — | — | 13/35 (37.1%) 4 years: 16/72 (22.2%) | — | — | — |
| Motta 2010 (3) | 52/2018 (2.6%) | — | — | 50/295 (16.9%) | — | — | — | — | — |
| Mykkänen 1993 (3.5) | 21/689 (3.0%) | — | — | — | — | 48/203 (23.6%) | — | — | — |
| Nakagami 2016 (5) | 1528 | 77/467 (16.5%) | — | 50/134 (37.3) | — | — | — | — | HbA1c6.0: 58/156 (37.2%) HbA1c5.7: 87/583 (14.9%) |
| Nakanishi 2004 (7) | 51/5500 (0.9%) | — | — | 5/246 (2.0%) | — | — | — | — | — |
| Noda 2010 (5) | Total: 30/1649 (1.8%) Men: 13/540 (2.4%) Women: 17/1109 (6.4%) | Total: 37/405 (9.1%) | — | Total: 58/153 (37.9%) | — | — | — | — | — |
| Park 2006 (4.1) | 116/4975 (2.3%) | 40/321 (12.5%) | — | — | — | — | — | — | — |
| Peterson 2017 (10) | 2/39 (5.1%) | — | — | — | — | 6/29 (20.7%) | — | — | — |
| Qian 2012 (5) | 59/843 (7.0%) | — | — | — | 17/46 (37%) | — | 49/120 (41%) | 17/33 (51%) | — |
| Rajala 2000 (4.6) | 0 (IGT cohort) | — | — | — | — | 32/171 (18.7%) 2.1 years: 14/183 (7.7%) | — | — | — |
| Ramachandran 1986 (5.1) | 0 IGT cohort) | — | — | — | — | 39/107 (36.4%) | — | — | — |
| Rasmussen 2008 (3.5) (i‐IFG5.6 : 2.5, IGT: 2.1 ) | 0 (IFG, IGT cohort) | — | 141/442 (32%) | — | — | 181/442 (41%) | 1 year: | 1 year: | — |
| Rathmann 2009 (7) | 25/649 (3.9%) | — | — | 12/71 (16.9%) | — | — | 34/120 (28.3%) | 22/47 (46.8%) | — |
| Rijkelijkhuizen 2007 (6.4) | 51/1125 (4.5%) | 101/488 (20.7%) | — | 62/149 (41.6%) | 35/106 (33%) | 36/111 (32.4%) 2 years: 45/158 (28.5%) | 27/80 (33.8%) | 20/31 (64.5%) | — |
| Sadeghi 2015 (7) | 141/2607 (5.4%) | — | 134/373 (35.9%) | — | — | — | 49/373 (13.1%) | 65/373 (17.4%) | — |
| Sasaki 1982 (7) | 7/161/4.3%) | — | — | — | — | 5/13 (38.5%) | — | — | — |
| Sato 2009 (4) | 118/4147 (2.9%) | — | — | 334/794 (42.1%) | — | — | — | — | HbA1c6.0: 90/215 (41.9%) |
| Schranz 1989 (6) | 54/1251 (4.3%) | — | — | — | — | 23/75 (30.7%) | — | — | — |
| Sharifi 2013 (7) | 0 (IFG cohort) | 24/123(19.5%) | — | — | — | — | — | — | — |
| Shin 1997 (2) | 47/1040 (4.5%) | — | — | — | — | 20/153 (13.1%) | — | — | — |
| Söderberg 2004 (11) | Unclear/2522 | — | — | 5 years: 32/148 (21.6%) | 153/402 (38%) | 575/1253 (45.9%) | 5 years: 103/489 (21.1%) | 5 years: 45/118 (38.1%) | — |
| Song 2015 (4) | 74/1758 (4.2%) | — | 68/321 (21.2%) | — | — | — | — | — | — |
| Song 2016a (10.8) | 0 (cohort with intermediate hyperglycaemia) | — | — | — | — | — | — | — | — |
| Soriguer 2008 (6) | 13/1806 (0.7%) | — | 23/56 (41.1%) | — | — | 14/54 (25.9%) | — | 14/28 (50%) | — |
| Stengard 1992 (5) | 6/216 (2.8%) | — | — | — | — | 17/234 (7.3%) | — | — | |
| Toshihiro 2008 (3.2)h | 0 (cohort with IFG and/or IGT) | — | — | — | — | — | — | — | — |
| Vaccaro 1999 (11.5) | 36/500 (7.2%) | — | 1/11 (9.1%) | — | — | — | 13/40 (32.5%) | 4/9 (44.4%) | — |
| Valdes 2008 (6.3) | 16/510 (3.1%) | 14/114 (12.3%) | 7/32 (21.9%) | 19/52 (36.5%) | — | 21/88 (23.9%) | 9/68 (13.2%) | 12/20 (60%) | — |
| Vijayakumar 2017 (adults: 4.6,children: 5.2) | Adults: 58/1466 (3.9) Children: 26/1795 (1.4%) [estimated from figure 2] | Adults: 222/424 (52.4%) | — | — | — | Adults: 196/347 (56.5%) | — | IFG5.6/IGT: Adults: 116/169 (68.7%) | HbA1c5.7: adults: 75/168 (44.6%) |
| Viswanathan 2007 (5) | Total: 154/465 33.1%) M: 99/265 (37.4%) W: 55/200 (27.5%) | — | — | — | — | Total: 416/619 (67.2%) M: 251/391 (64.2%) W: 165/228 (72.4%) | — | — | — |
| Wang 2007 (5) | 51/358 (14.2%) | — | 53/261 (20%) | 28/112 (25%) | — | 126/141 (89.4%) | 31/95 (32.6%) | IFG5.6/IGT: 54/109 (49.5%) IFG6.1/IGT: 36/52 (69.2%) | — |
| Wang 2011 (7.8) | 84/595 (14.1%) | Total: Men: 137/418 (32.8%) Women: 208/529 (39.3%) | — | — | — | Total: 233/491 (47.5%) Men: 75/154 (48.7%): Women: 158/337 (46.9%) 4 years: Total 198/532 (37.2%) | — | Total: 185/356 (52%%) Men: 66/125 (52.8%) Women: 119/231 (51.5%) | HbA1c6.0: 19/121 (15.7%) |
| Warren 2017 (cohort 1: 22, cohort 2: 16) | 22 years: 8322 16 years: 4772 | — | — | — | — | — | — | — | — |
| Wat 2001 (2) | 4/333 (0.1%) | — | — | — | — | 31/322 (9.6%) | — | — | — |
| Weiss 2005 (1.7) | 8/84 (9.5%) | — | — | — | — | — | 8/33 (24.2%) | — | — |
| Wheelock 2016 (4.3) | Unclear/5363 | — | — | 5 years: | — | Non‐overweight: | — | 5 years: | — |
| Wong 2003 (8) | 12/278 (4.3%) | — | — | — | — | 102/291 (35.1%) | — | — | — |
| Yeboah 2011 (7.5) | Unclear/4973 | 273/940 (29.0%) | — | — | — | — | — | — | — |
| Zethelius 2004 (7) | Unclear/466 | — | — | — | — | Not reported/201 | — | — | — |
| aDevelopment of T2DM from 'prediabetes' (not defined) at year 1: 11/217 (5.1%), at year 2: 16/217 (7.6%). bDevelopment of T2DM from 'prediabetes' (IFG6.1 and/or IGT): 46/122 (37.7%). eDevelopment of T2DM from IFG or IGT: not reported. fDevelopment of T2DM from IFG or IGT: 78/450 (17.3%). gDevelopment of T2DM from IFG or IGT:86/686 (12.5%). hDevelopment of T2DM from IFG and/or IGT: 36/128 (28.1%). FPG: fasting plasma glucose; HbA1c: glycosylated haemoglobin A1c; HbA1c5.7/6.0 : HbA1c threshold 5.7% or 6.0% (usually reflecting 5.7% to 6.4% and 6.0% to 6.4%, respectively); HbA1c/IFG: both HbA1c and IFG; i‐: isolated; IFG5.6/6.1 : impaired fasting glucose (threshold 5.6 mmol/L or 6.1 mmol/L); IGT: impaired glucose tolerance; IFG/IGT: both IFG and IGT; NGT: normal glucose tolerance; PG: postload glucose; SD: standard deviation; T2DM: type 2 diabetes mellitus | |||||||||
Appendix 12. Diabetes incidence (cases per 1000 person‐years)
| Study ID | Rate (diabetes cases/1000 person‐years (95% CI)) | ||||||||
| Follow‐up (years) | NGT cohort | 'Prediabetes' cohort | IFG6.1 cohort | IFG5.6 cohort | IGT cohort | IFG/IGT cohort | Elevated HbA1c cohort | Elevated HbA1c/IFG cohort | |
| 9.1 | 22.2 (19.4–25.4) | 78.9 (68.0–90.9) | — | 61.0 (42.1–85.0) | 67.8 (54.6–83.0) | 133.6 (103.1– 169.3) | — | — | |
| 4 | — | — | — | — | — | — | Per 100 person‐years: HbA1c5.7: 5.6 HbA1c6.0: 14.0 | — | |
| 15 | 10 years: 4.3 (2.7–5.9) | — | 10 years: 37.0 (20.2–53.8) | — | 10 years: 17.0 (5.3–28.7) | 10 years: 49.2 (17.9–80.5) | HbA1c6.0: 25.8 | — | |
| 10 | — | — | — | 18.1 (10.7–28.2) | — | — | — | — | |
| 11.7 | — | 30.3 | 6.5 years: | 6.5 years: | 6.5 years: | — | — | — | |
| 6.2 | 10.5 | — | — | — | 40.4 | — | — | — | |
| 10 | 2.4 (1.2–4.8) 4 years: 2.64 (1.23–4.05) | — | 17.5 (12.5–24.5) | 10.6 (8.1–13.9) (IFG5.6: FPG 5.6–6.9) | 4 years: 22.5 (20.4–24.6) | — | — | — | |
| 12 | 12.3 | IFG or IGT: 58.0 | — | i‐IFG5.6: 51.3 | i‐IGT: 53.1 | 114.4 | 10 years: HbA1c5.7: 43.2 | — | |
| 5 | 2.3 | — | 104 | 34.6 | — | — | HbA1c5.7: 51.0 HbA1c6.0: 129.2 | HbA1c5.7 and IFG5.6: 30.6 HbA1c6.0 and IFG5.6: 34.4 | |
| 6.8 | 3.1 (1.5–4.7) | — | — | 16.3 (10.3–24.4) | 25.9 (17.0–37.7) 2.3 years: i‐IGT: 99.7 (77.1–126.0) | 57.9 (46.1–71.7) | — | — | |
| 2.6 | — | — | — | 31.5 (11.4–86.8) | — | — | — | — | |
| 5 | 21.9 | — | — | 34.5 | — | — | — | — | |
| 5 | 18.8 | — | 93.7 | — | 60.7 | 117 | — | — | |
| 14.7 | — | — | 43.0 (39.2–47.2) | — | — | — | — | — | |
| 5 | 9 | — | — | 22.5 | — | — | — | — | |
| 5 | 0.2 (0.2–0.3) | — | i‐IFG6.1: 2.6 (1.8–3.4) (incidence percent per years) | — | i‐IGT: 3.5 (2.9–4.2) (incidence percent per years) | — | — | — | |
| 5, 10 | Per 100 person‐years (annualised rate): FPG ≥ 7.0: 2.77 (2.01–3.71) | — | — | — | — | Per 100 person‐years (annualised rate): IFG or IGT FPG ≥ 7.0: 4.61 (3.77–5.56) | — | — | |
| 8 | 17.5 | — | — | — | 64.8 | — | — | — | |
| 5 | — | — | 1 | — | — | — | — | — | |
| 7 | 1.5 | — | 3.3 | — | — | — | — | — | |
| 4.1 | 5.7 | — | — | 31.3 | — | — | — | — | |
| 4.6 | — | — | — | — | 41 (28–57) | — | — | — | |
| 3.5 | — | — | — | i‐IFG5.6: | 17.0 (14.9–19.1) (i‐IGT: 11.8 (9.7–13.9) | 27 (22.5–31.7) | — | — | |
| 7 | — | — | i‐IFG6.1: | — | i‐IGT: | 77.9 (48.8–117.9) | — | — | |
| 6.4 | 7 | — | 66.5 (49.9–83.0) | 32.7 (26.3–39.1) | i‐IGT: 57.9 | 112.2 | — | — | |
| 7 | Total: 14.1 (12.5–15.9) Men: 12.8 (10.7–15.3) | — | — | Total: 48.4 (35.0–66.7) | Total: 40.3 (30.2–53.8) | Total: 137.6 (103.7–182.5) | — | — | |
| 11 | — | — | 87–92: 92–98: | — | 87–92: 92–98: | — | — | — | |
| 6 | 7.2 (4.2–12.4) | — | — | 38.1 (25.3–57.3) | 31.1 (18.4–52.5) | 66.0 (39.1–111.5) | — | — | |
| 6.3 | 3.8 (2.1–6.8) for i‐IGT and IFG/IGT: 5.0 (2.8–8) | — | 58.0 (37–90.9) | 19.5 (11.5–32.9) | 37.9 (24.7–58.1) i‐IGT: 21 (10.9–40.4) | 95.2 (54.1–167.7) | — | — | |
| Adults: 4.6 | — | — | — | Boys: 22 | Boys: 38 | — | Boys: 52 | — | |
| 7.8 | 21.1 | — | — | Total: 66.2 Men: 57.7 Women: 73.4 | Total: 95.8 Men: 98.1 Women: 94.8 | Total: 109 Men: 109 Women: 109 | — | — | |
| CI: confidence interval; FPG: fasting plasma glucose; HbA1c: glycosylated haemoglobin A1c; HbA1c5.7/6.0 : HbA1c threshold 5.7% or 6.0% (usually reflecting 5.7% to 6.4% and 6.0% to 6.4%, respectively); HbA1c/IFG: both HbA1c and IFG; i‐: isolated; IFG5.6/6.1 : impaired fasting glucose (threshold 5.6 mmol/L or 6.1 mmol/L); IGT: impaired glucose tolerance; IFG/IGT: both IFG and IGT;NGT: normal glucose tolerance; T2DM: type 2 diabetes mellitus | |||||||||
Appendix 13. T2DM cases and person‐time (for calculation incidence rate ratios)
| Study ID | Persons (cases) with diabetes with/without IH at baseline | ||||
| Follow‐up (years) | Cases in IH group | Person‐years for IH group | Cases in normoglycaemic group | Person‐years for normoglycaemic group | |
| 9.1 | i‐IFG5.6: 32 | i‐IFG5.6: 525 | 209 | 9398 | |
| 10 | IFG5.6: 21 | IFG5.6: 1768 | 11 | — | |
| 4 | HbA1c5.7: 373 HbA1c6.0: 187 | HbA1c5.7: 6594 HbA1c6.0: 1338 | — | — | |
| 10 | IFG6.1: 18 IGT: 8 IFG/IGT: 9 | IFG6.1: 486 IGT: 471 IFG/IGT: 183 | 29 | 6704 | |
| 11.7 | IFG5.6: 150 | IFG5.6: 4950 | 162 | 39,901 | |
| 6.2 | IGT: 13 | IGT: 322 | 14 | 1339 | |
| 10 | IFG6.1: 34 4.44 years: IGT: 17 | IFG6.1: 1943 4.44 years: IGT: 756 | 8 4.44 years: 9 | 3333 4.44 years: 3409 | |
| 5 | IGT: 20 | IGT: 343 | 1 | 1388 | |
| 12 | i‐IFG5.6: 81 i‐IGT: 624 IFG/IGT: 138 | i‐IFG5.6: 1579 i‐IGT: 11,744 IFG/IGT: 1206 | 657 | 53,461 | |
| 5 | IFG5.6: 108 | IFG5.6: 5920 | 46 | 19,961 | |
| 6.8 | i‐IFG5.6: 23 | i‐IFG5.6: 1409 | 14 | 4578 | |
| 5 | i‐IFG6.1: 16 | i‐IFG6.1: 171 | 38 | 2026 | |
| 14.7 | IFG6.1: 425 | iFG6.1: 9884 | — | — | |
| 5, 10 | IFG or IGT T2DM measured by: FPG ≥ 7.0: 26 | IFG or IGT T2DM measured by: FPG ≥ 7.0: 2647 | 28 | 1539 | |
| 8 | IGT: 15 | IGT: 247 | 64 | 3665 | |
| 7 | IFG6.1: 5 | IFG6.1: 1506 | 51 | 34,308 | |
| 4.1 | IFG5.6: 40 | IFG5.6: 1278 | 116 | 20,298 | |
| 6.4 | i‐IFG6.1: 35 i‐IGT: 27 IFG/IGT: 20 | i‐IFG6.1: 681 i‐IGT: 466 IFG/IGT: 178 | 51 | 7286 | |
| 6 | IFG5.6: 23 | IFG5.6: 604 | 13 | 1806 | |
| 6.3 | IFG5.6: 14 i‐IGT: 9 IFG/IGT: 12 | IFG5.6: 718 i‐IGT: 429 IFG/IGT: 126 | 11 (16 for i‐IGT and IFG/IGT) | 2923 (3200 for i‐IGT and IFG/IGT) | |
| 7.8 | IFG5.6: 137 IGT: 75 IFG/IGT: 66 | IFG5.6: 2374 IGT: 765 IFG/IGT: 605 | 34 | 1613 | |
| FPG: fasting plasma glucose; HbA1c: glycosylated haemoglobin A1c; HbA1c5.7/6.0 : HbA1c threshold 5.7% or 6.0% (usually reflecting 5.7% to 6.4% and 6.0% to 6.4%, respectively); HbA1c/IFG: both HbA1c and IFG; i‐: isolated; IFG5.6/6.1 : impaired fasting glucose (threshold 5.6 mmol/L or 6.1 mmol/L); IGT: impaired glucose tolerance; IFG/IGT: both IFG and IGT; IH: intermediate hyperglycaemia;T2DM: type 2 diabetes mellitus | |||||
Appendix 14. Odds ratios and hazard ratios as the effect measures for the development of T2DM
| Study ID | Adjusted [unadjusted] ratios (95% CI) for the development of diabetes comparing IH with normoglycaemia at baseline | ||||||||
| Follow‐up (years) | IFG6.1 | IFG5.6 | IGT | 'Prediabetes' | IFG/IGT | HbA1c | HbA1c/IFG | Ratio | |
| 10 | — | Total cohort: South‐Asian Surinamese: | — | — | — | — | — | Odds ratio | |
| 12 | — | [2.41 (1.78–3.28)] | [4.36 (3.41–5.57)] | — | — | — | — | Odds ratio | |
| 4 | — | — | — | — | — | HbA1c5.7: 6.5 (3.7–10.2) HbA1c6.0:41.3 (24.7–69.2) [compared with HbA1c < 5.0] | — | Hazard ratio | |
| 24 | 20 years: i‐IFG6.1: 3.43 (1.88–6.28) | 20 years: i‐IFG5.6: 1.11 (0.76–1.61) | 5.64 (2.74–12.33) | — | IFG5.6 + IGT: 2.79 (1.56–5.00) IFG6.1 + IGT: 3.85 (1.73–8.54) | — | — | Odds ratio | |
| 15 | 5.83 (3.23–10.54) 10 years: 5.7 (2.8–11.4) | 10 years: [3.9 (1.6–9.3)] | — | 10 years: [20.5 (7.6–55.3)] | HbA1c6.0: 9.74 (4.21–22.56) | — | Hazard ratio, odds ratio (10 years) | ||
| 9.7 | 2.37 (1.49–3.78) | — | 2.90 (1.90–4.43) | — | — | HbA1c5.7: 2.42 (1.50–3.91) | — | Risk ratio | |
| 3 | — | — | — | — | — | HbA1c6.0: 15.6 (6.9–35.7) | — | Odds ratio | |
| 3 | 4.4 (1.9–10.6) | — | — | — | — | — | — | Odds ratio | |
| 1, 2 | — | — | — | [At 1 year: | — | — | — | Relative risk | |
| 10 | [19.13 (11.59–31.66)] | — | — | — | — | — | — | Odds ratio | |
| 10 | 5.75 (1.86–17.78) | — | — | — | — | — | — | Odds ratio | |
| 11.7 | 6.5 years: | 6.5 years: | — | IFG5.6 and/or IGT: | — | — | — | Hazard ratio, relative risk (6.5 years) | |
| 6.2 | — | — | [3.6 (1.4–9.1)] | — | — | — | — | Odds ratio | |
| 7 | [3.73 (2.18–6.39)] | [4.28 (3.21–5.71)] | [4.01 (3.12–5.14)] | — | — | — | — | Relative risk | |
| 10 | — | 3.43 (2.17–5.44) | — | — | — | — | — | Odds ratio | |
| 10 | 4.4 (1.9–10.0) | 2.9 (1.3–6.3) | — | — | — | — | — | Hazard ratio | |
| 12 | — | i‐IFG5.6: 3.61 (2.85–4.57) | i‐IGT: 4.06 (3.62–4.55) | — | 8.21 (6.79–9.94) | 6 years: HbA1c6.0: Men: 4.28 (2.41–7.58) Women: 4.05 (1.36–12.07) | — | Hazard ratio | |
| 5.2 | — | — | 5.42 (3.60–8.17) | — | — | — | — | Odds ratio | |
| 5 | 11.4 (8.09–16.1) | 6.18 (4.34–8.80) | — | — | — | HbA1c5.7: | HbA1c5.7 + IFG5.6: 32.5 (23.0–45.8) HbA1c5.7 + IFG6.1: 37.9 (28.1–51.1) HbA1c6.0 + IFG5.6: 53.7 (38.4–75.1) HbA1c6.0 + IFG6.1: 52.3 (37.8–72.3) | Hazard ratio | |
| 6.8 | — | 7.4 (3.7–14.8) | 9.4 (4.8–18.6) | — | 22.5 (12.4–41.0) | — | — | Hazard ratio | |
| 5 | — | 5.66 (3.44–9.31) | 6.01 (3.23–11.2) | — | — | — | — | Odds ratio | |
| 5 | Total: 34.57 (12.18–98.10) | Total: 4.77 (1.60–14.15) Men: 9.5 (1.25–72.24) Women: 1.91 (0.45–8.21) | — | — | — | — | — | Hazard ratio | |
| 5.2 | 21.1 (16.8–26.3) | — | — | — | — | HbA1c6.0: 23.2 (18.7–28.7) | HbA1c5.7 + IFG5.6: 46.7 (33.5–64.9) | Odds ratio | |
| 5 | — | 1.04 (1.00–1.07) | — | — | — | — | — | Odds ratio | |
| 6 | 2.06 (1.76‐5.14) | ‐ | ‐ | ‐ | ‐ | ‐ | ‐ | Odds ratio | |
| 4 | Women: 26.3 (17.4–39.8) | Women: 22.3 (13.0–38.1) | — | — | — | — | — | Odds ratio | |
| 5 | 5.78 (3.20–10.43) | — | i‐IGT: 2.94 (1.81–4.76) | — | 6.17 (3.41–11.15) | — | — | Hazard ratio | |
| 7 | 11.4 (7.1–18.4) | IFG5.6: Men: 8.6 (3.4–21.9) White: | — | — | — | i‐HbA1c5.7: Men: 24.2 (9.5–61.8) White: Black: 5.8 (2.9–11.7) | HbA1c5.7 + IFG5.6: Total: 26.2 (16.3–42.1) Men: 51.1 (21.2–123.2) Women: 20.4 (10.9–38.0) White: 34.9 (19.1–63.8) Black: 14.9 (6.8–32.6) | Odds ratio | |
| 5 | — | 4.5 (2.0–10.1) | — | — | — | — | — | Risk ratio | |
| 10.9 | 1.99 (1.37–2.90) | — | — | — | — | — | — | Hazard ratio | |
| 7.8 | — | 3.67 (3.20–4.21) [4.36 (3.83–4.97)] | — | — | — | — | — | Odds ratio | |
| 7–8 | — | — | 6.37 (4.37–9.28) | — | — | — | — | Odds ratio | |
| 6 | [i‐IFG6.1: | — | [i‐IGT: 3.5 (2.1–5.8)] | — | [3.8 (2.3–6.2)] | — | — | Hazard ratio | |
| 6 | — | — | — | — | 4.54 (2.65–7.78) | — | — | Risk ratio | |
| 3.5 | — | — | [9.85 (6.14–15.8)] | — | — | — | — | Odds ratio | |
| 5 | 34.89 (19.65–61.95) | — | — | — | — | HbA1c6.0: [63.16 (33.94–117.52)] HbA1c5.7: 8.77(4.47–17.21) [9.72(4.96–19.05)] | — | Hazard ratio | |
| 7 | 1.31 (0.51–3.34) | — | — | — | — | — | — | Risk ratio | |
| 7 | [4.7 (2.2–10.0)] | — | [8.8 (5.0–15.6)] | — | [21.2 (10.4–43.3)] | — | — | Odds ratio | |
| 6.4 | i‐IFG6.1: 10.0 (6.1–16.5) | — | i‐IGT: 10.9 (6.0–19.9) | — | 39.5 (17.0–92.1) | — | — | Odds ratio | |
| 7 | — | i‐IFG5.6: 3.30 (2.16–5.06) | i‐IGT: 2.52 (1.73–3.69) | — | 12.6 (7.39–21.4) | — | — | Odds ratio | |
| 4 | 22.52 (17.73–28.60) | — | — | — | — | — | Odds ratio | ||
| 4 | — | Men: 7.50 (2.76–20.33) | — | — | — | — | — | Relative risk | |
| 6 | — | [5.3 (2.7–10.4)] | 4.3 (2.0–9.2) | — | 9.2 (4.3–19.5) | — | — | Relative risk | |
| 5 | — | — | 3.1 (1.2–8.2) | — | — | — | — | Odds ratio | |
| 11.5 | [i‐IFG6.1: 1.2 (0.3–10.2)] | [i‐IGT: 6.2 (2.7–13.8)] | — | [10.3 (2.2–46.8)] | — | — | Odds ratio | ||
| 6.3 | 12.1 (4.6–31.7) [11.5 (5.6–23.6] | 3.9 (1.6–9.8) | [6.7 (3.4–13.3)] [i‐IGT: 4.7 (1.9–11.7)] | — | [45.6 (15.8–131.4)] | — | — | Odds ratio | |
| 5 | — | — | 1.57 | — | — | — | — | Odds ratio | |
| 5 | 2.71 (1.43–5.16) Men: 2.29 (0.95–5.49) Women: 1.95 (0.83–4.61) | 1.80 (0.96–3.40) Men: 1.79 (0.70–4.57) Women: 2.08 (0.93–4.67) | 3.15 (1.60–6.19) i‐IGT(IFG6.1): Women: 1.65 (0.76–3.60) i‐IGT(IFG5.): Women: 2.21 (0.77–6.36) | — | IGT/IFG6.1: Men: 10.23 (3.84–27.30) Women: 7.11 (2.56–19.72) IGT/IFG5.6: Men: 9.81 (3.5–27.21) Women: 4.67 (1.87–11.62) | — | — | Risk ratio, odds ratio | |
| 7, 8 | — | Total: 2.38 (1.85–3.05) [2.68 (2.25–3.63] Men: 2.10 (1.40–3.15) [2.78 (1.91–4.04)] Women: 2.46 (1.78–3.39) [ 2.92 (2.15–3.98] 4 years: [3.12 (2.31–4.22)] | Total: 3.47 (2.64–4.55) [4.11 (3.20–5.27)] Men: 3.82 (2.41–6.04) [4.72 (3.15–7.09)] Women: 3.16 (2.26–4.43) [3.74 (2.72–5.14)] | — | Total: 4.06 (3.05–5.40) [4.68 (3.62–6.07) ] Men: 4.44 (2.75–7.15) [5.28 (3.49–7.99)] Women: 3.80 (2.66–5.42) [4.30 (3.09–5.99)] | 4 years: HbA1c6.0: 5.89 (4.23–8.19) | — | Hazard ratio, odds ratio (4 years) | |
| Cohort 1: 22 Cohort 2: 16 | Cohort 1: Black: 2.66 (2.26–3.13) Cohort 2: Black: 3.16 (2.47–4.06) | Cohort 1: Cohort 2: Black: 2.65 (2.11–3.32) | Cohort 2: Black: 2.55 (2.01–3.22) | — | — | Cohort 1: Black: 2.24 (1.92–2.61) HbA1c6.0: Black: 2.60 (2.21–3.05) 6 years: | — | Hazard ratio | |
| 7.5 | — | 10.5 (8.4–13.1) | — | — | — | — | — | Hazard ratio | |
| 7 | — | — | [2.18 (1.43–3.34)] | — | — | — | — | Odds ratio | |
| aUnreliable adjusted HbA1c6.0 interval in publication: 105.47 (29.30–101.86) CI: confidence interval; FPG: fasting plasma glucose; HbA1c: glycosylated haemoglobin A1c; HbA1c5.7/6.0 : HbA1c threshold 5.7% or 6.0% (usually reflecting 5.7% to 6.4% and 6.0% to 6.4%, respectively); HbA1c/IFG: both HbA1c and IFG; i‐: isolated; IFG5.6/6.1 : impaired fasting glucose (threshold 5.6 mmol/L or 6.1 mmol/L); IGT: impaired glucose tolerance; IFG/IGT: both IFG and IGT; IH: intermediate hyperglycaemia; T2DM: type 2 diabetes mellitus | |||||||||
Appendix 15. Regression from intermediate hyperglycaemia to normoglycaemia
| Study ID | Follow‐up (years) | Regression to normoglycaemia from IH at baseline |
| 2 | IGT: 27/68 (39.7%) | |
| 9.1 | i‐IFG5.6 or i‐IGT: 52/299 (17.4%) | |
| 10 | IFG6.1: 57/115 (49.6%) | |
| 1 | IGT: 162/252 (64.3%) | |
| 2 | IGT: 273/418 (65.3%) | |
| 3 | IFG6.1: 129/156 (82.6%) | |
| 1, 2 | 'Prediabetes': 76/217 (35%) | |
| 10 | IFG5.6: 5 years: 94/229 (27.9%); 10 years: 15/229 (6.6%) IFG6.1: 5 years: 34/50 (68%); 10 years: 2/50 (4%) | |
| 10 | IFG5.6: 104/187 (55.6%) | |
| 6.2 | IGT: 20/51 (39%) | |
| 7 | IGT: 73/170 (42.9%) | |
| 10 | IFG6.1: 143/257 (55.6%) | |
| 5 | IGT: 3/75 (4%) | |
| 5 | IFG5.6: 383/1680 (22.8%) | |
| 2.5 | IGT: 11/37 (29.7%) | |
| 2.6 | IFG5.6: 197/320 (61.6%) | |
| 2 | IFG total: 908/1829 (49.6%) | |
| 1 | IGT: 52/79 (65.8%) | |
| 3.9 | IGT: 96/119 (80.1%) | |
| 1.4 | IGT: 60/123 (48.8%) | |
| 1.7 | IFG6.1: 17/55 (30.9%) | |
| 10 | i‐IFG6.1: 27/42 (64.3%) | |
| 5 | IFG5.6: 62/124 (50%) | |
| 5 | IFG6.1: 297/743 (44%) | |
| 6 | IFG6.1: 0/28 (0%) | |
| 2 | IGT: 22/131 (16.8%) | |
| 3 | IFG or IGT: 130/450 (28.9%) | |
| 6 | IFG or IGT: 379/686 (55.2%) | |
| 1.9 | IGT: 60/123 (48.8%) | |
| 8 | IGT: 6/37 (16.2%) | |
| 10 | IGT: 16/35 (45.7%) 4 years: IGT: 28/72 (38.9%) | |
| 3.5 | IGT: 72/203 (35.5%) | |
| 10 | IGT: 8/29 (27.6%) | |
| 5 | i‐IFG6.1: 14/46 (30.4%) | |
| 4.6 | IGT: 96/171 (56.1%) (2.1 years) IGT: 115/183 (62.8%) | |
| 3.3 | IGT: 34/107 (31.8%) | |
| 6.4 | IFG6.1: 28/149 (18.8%) (3 years) IGT: 35/158 (22.2%) | |
| 7 | IFG5.6and/or IGT: 148/373 (39.7%) | |
| 7 | IGT: 5/13 (38.5%) | |
| 6 | IGT: 25/75 (33.3%) | |
| 7 | IFG5.6: 53/123 (43.1%) | |
| 11 | i‐IFG6.1: 153/402 (38%) | |
| 10.8 | Total: 75/334 (22.5%) | |
| 5 | IGT: 79/234 (33.8%) | |
| 3.2 | IFG and/or IGT: 39/128 (30.5%) | |
| 4 | IGT: 147/532 (27.6%) | |
| 2 | IGT: 174/322 (54%) | |
| 1.7 | i‐IGT: 15/33 (45.5%) | |
| 8 | IGT: 122/291 (41.9%) | |
| HbA1c: glycosylated haemoglobin A1c; HbA1c5.7/6.0 : HbA1c threshold 5.7% or 6.0% (usually reflecting 5.7% to 6.4% and 6.0% to 6.4%, respectively); HbA1c/IFG: both HbA1c and IFG;i‐: isolated; IFG5.6/6.1 : impaired fasting glucose (threshold 5.6 mmol/L or 6.1 mmol/L); IGT: impaired glucose tolerance; IFG/IGT: both IFG and IGT; IH: intermediate hyperglycaemia; IQR: interquartile range; SD: standard deviation | ||
Appendix 16. Confounder adjustment (I)
| Study ID | Age | Sex | Body mass index, waist circumference, | 'Ethnicity' | Site | Smoking status | Drinking status | Physical activity | Medications |
| Yes | Yes | Yes | No | No | No | No | No | No | |
| No | No | No | No | No | No | No | No | No | |
| Yes | Yes | No | No | No | No | No | No | No | |
| Yes | Yes | Yes | No | No | Yes | No | No | No | |
| Yes | Yes | Yes | No | No | Yes | Yes | Yes | No | |
| No | Yes | Yes | No | No | Yes | Yes | Yes | No | |
| Yes | Yes | Yes | No | No | Yes | No | No | Yes | |
| Yes | Yes | Yes | No | No | No | No | No | No | |
| No | No | No | No | No | No | No | No | No | |
| Yes | Yes | No | No | No | No | No | No | No | |
| Yes | No | Yes | No | No | Yes | Yes | Yes | No | |
| Yes | Yes | Yes | No | No | Yes | No | Yes | No | |
| No | No | No | No | No | No | No | No | No | |
| No | No | No | No | No | No | No | No | No | |
| Yes | Yes | No | No | No | Yes | No | Yes | No | |
| Yes | Yes | Yes | No | No | Yes | No | Yes | No | |
| Yes | Yes | Yes | No | Yes | Yes | Yes | Yes | No | |
| Yes | Yes | No | Yes | Yes | No | No | No | No | |
| Yes | Yes | Yes | No | No | Yes | No | No | No | |
| Yes | Yes | Yes | No | No | No | No | No | No | |
| No | No | Yes | No | No | No | No | No | No | |
| Yes | Yes | Yes | No | No | No | No | No | No | |
| Yes | Yes | Yes | No | No | Yes | Yes | Yes | No | |
| Yes | No | Yes | Yes | No | No | No | No | No | |
| No | No | No | No | No | Yes | No | No | Yes | |
| Yes | No | Yes | No | No | Yes | No | No | No | |
| Yes | Yes | Yes | No | No | No | No | No | No | |
| Yes | Yes | No | Yes | Yes | Yes | No | Yes | No | |
| Yes | Yes | No | No | No | Yes | Yes | No | No | |
| Yes | No | Yes | No | No | No | No | Yes | No | |
| Yes | No | No | No | No | Yes | Yes | Yes | No | |
| Yes | Yes | No | No | No | No | No | No | No | |
| No | No | Yes | No | No | No | No | No | No | |
| Yes | Yes | Yes | No | No | Yes | No | No | No | |
| No | No | No | No | No | No | No | No | No | |
| Yes | No | Yes | No | No | Yes | Yes | No | No | |
| Yes | No | No | No | No | Yes | Yes | No | No | |
| Yes | Yes | No | No | Yes | No | No | No | No | |
| Yes | Yes | No | No | No | No | No | No | No | |
| Yes | Yes | Yes | No | No | No | No | No | No | |
| Yes | NA | Yes | No | No | Yes | Yes | Yes | No | |
| Yes | No | Yes | No | No | Yes | Yes | Yes | No | |
| Yes | Yes | Yes | No | No | No | No | No | No | |
| Yes | No | Yes | No | No | No | No | No | No | |
| No | No | No | No | No | No | No | No | No | |
| Yes | Yes | Yes | No | No | No | No | No | No | |
| Yes | No | Yes | No | No | No | No | No | No | |
| Yes | Yes | No | No | No | Yes | No | No | No | |
| Yes | Yes | Yes | No | No | Yes | No | No | No | |
| Yes | Yes | Yes | Yes | No | Yes | Yes | No | Yes | |
| Yes | Yes | Yes | Yes | No | No | No | Yes | No | |
| Yes | No | Yes | No | No | No | No | No | No | |
| 'No' denotes possible confounder but statistical analysis did not adjust for this covariate 'Yes' indicates that statistical analysis adjusted for this confounder NA: not applicable | |||||||||
Appendix 17. Confounder adjustment (II)
| Study ID | Cardiovascular | Glomerular filtration | Blood pressure, | Family history | Socioeconomic | Region | Depression | Triglycerides | Cholesterol |
| No | No | No | No | No | No | No | No | No | |
| No | No | No | No | No | No | No | No | No | |
| No | No | No | No | No | No | No | No | No | |
| Yes | No | Yes | No | No | No | No | Yes | Yes | |
| No | No | Yes | Yes | Yes | No | No | Yes | Yes | |
| No | No | No | No | No | No | No | No | No | |
| No | No | Yes | Yes | Yes | No | No | Yes | Yes | |
| No | No | No | Yes | No | No | No | Yes | No | |
| No | No | No | No | No | No | No | No | No | |
| No | No | No | No | No | No | No | No | No | |
| No | No | Yes | No | No | No | No | Yes | Yes | |
| No | No | No | Yes | Yes | No | No | Yes | Yes | |
| No | No | No | No | No | No | No | No | No | |
| No | No | No | No | No | No | No | No | No | |
| No | No | Yes | No | No | No | No | Yes | Yes | |
| No | No | No | Yes | No | No | No | No | No | |
| No | No | Yes | Yes | No | Yes | No | Yes | Yes | |
| No | No | No | No | No | No | No | No | No | |
| No | No | Yes | Yes | No | No | No | Yes | Yes | |
| No | No | No | No | No | No | No | Yes | Yes | |
| No | No | Yes | No | No | No | No | Yes | Yes | |
| No | No | Yes | Yes | No | No | No | Yes | Yes | |
| No | No | Yes | Yes | No | No | No | Yes | Yes | |
| No | No | Yes | Yes | No | No | No | No | No | |
| No | No | No | Yes | No | No | No | No | No | |
| No | No | No | No | No | No | No | No | No | |
| No | No | No | No | No | No | No | No | No | |
| No | No | Yes | No | No | No | No | No | No | |
| No | No | No | Yes | No | No | No | No | No | |
| No | No | No | No | No | No | No | No | No | |
| No | No | No | No | Yes | Yes | No | No | No | |
| No | No | No | Yes | No | No | No | No | No | |
| No | No | No | No | No | No | No | No | No | |
| No | No | Yes | Yes | Yes | No | No | No | Yes | |
| No | No | No | No | No | No | No | No | No | |
| No | No | Yes | Yes | No | No | No | No | Yes | |
| No | No | No | Yes | No | No | No | No | No | |
| No | No | Yes | No | No | No | No | No | No | |
| No | No | No | No | No | No | No | No | No | |
| No | No | No | Yes | No | No | No | No | No | |
| No | No | No | Yes | No | No | No | No | No | |
| No | No | Yes | Yes | No | No | No | Yes | No | |
| No | No | Yes | Yes | No | No | No | Yes | No | |
| No | No | No | No | No | No | No | No | No | |
| No | No | No | No | No | No | No | No | No | |
| No | No | No | No | No | No | No | Yes | No | |
| No | No | No | Yes | No | No | No | No | No | |
| No | No | No | Yes | Yes | No | No | No | Yes | |
| No | No | Yes | Yes | No | No | No | Yes | Yes | |
| No | Yes | Yes | Yes | Yes | No | No | Yes | Yes | |
| No | No | No | No | Yes | No | No | No | No | |
| No | No | No | No | No | No | No | No | No | |
| 'No' denotes possible confounder but statistical analysis did not adjust for this covariate 'Yes' indicates that statistical analysis adjusted for this confounder | |||||||||
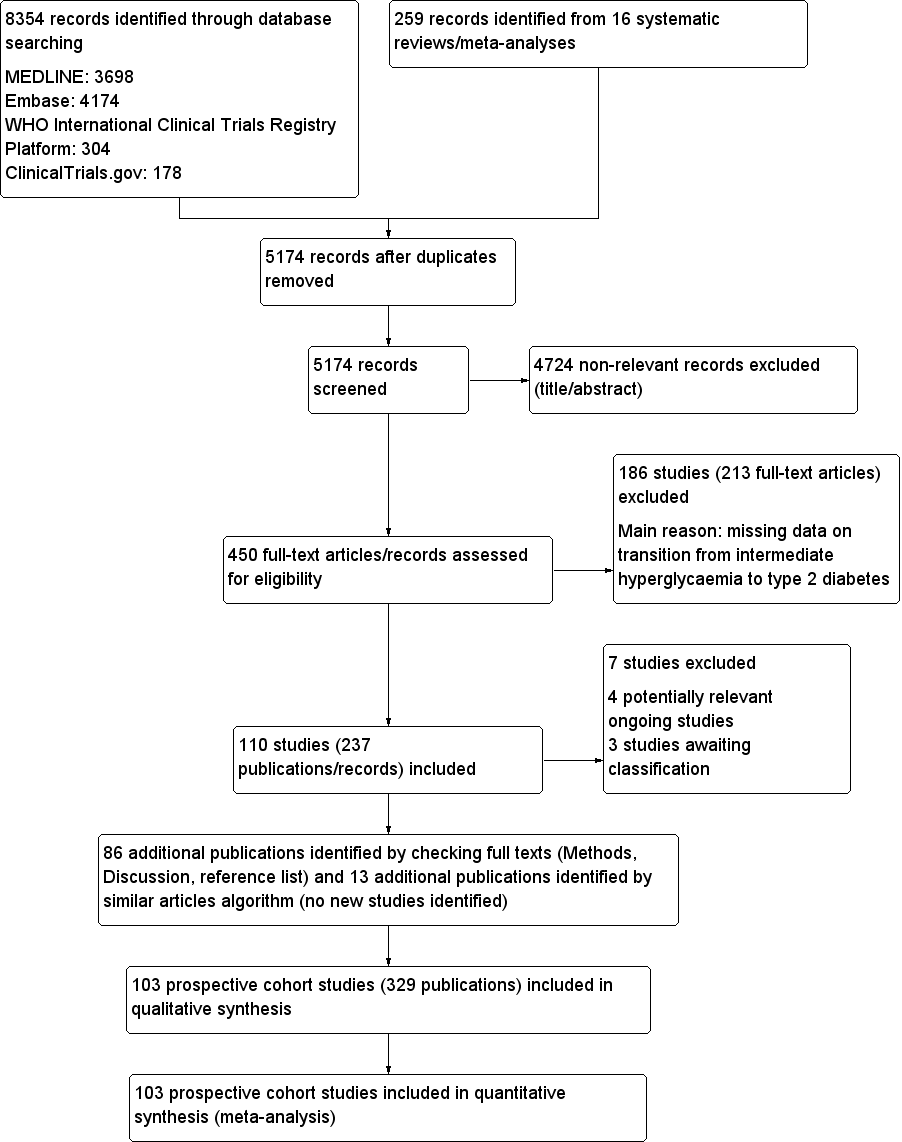
Study flow diagram

Risk of bias graph for studies of overall prognosis of people with intermediate hyperglycaemia for developing type 2 diabetes: review authors' judgements about each risk of bias item presented as percentages across all included studies
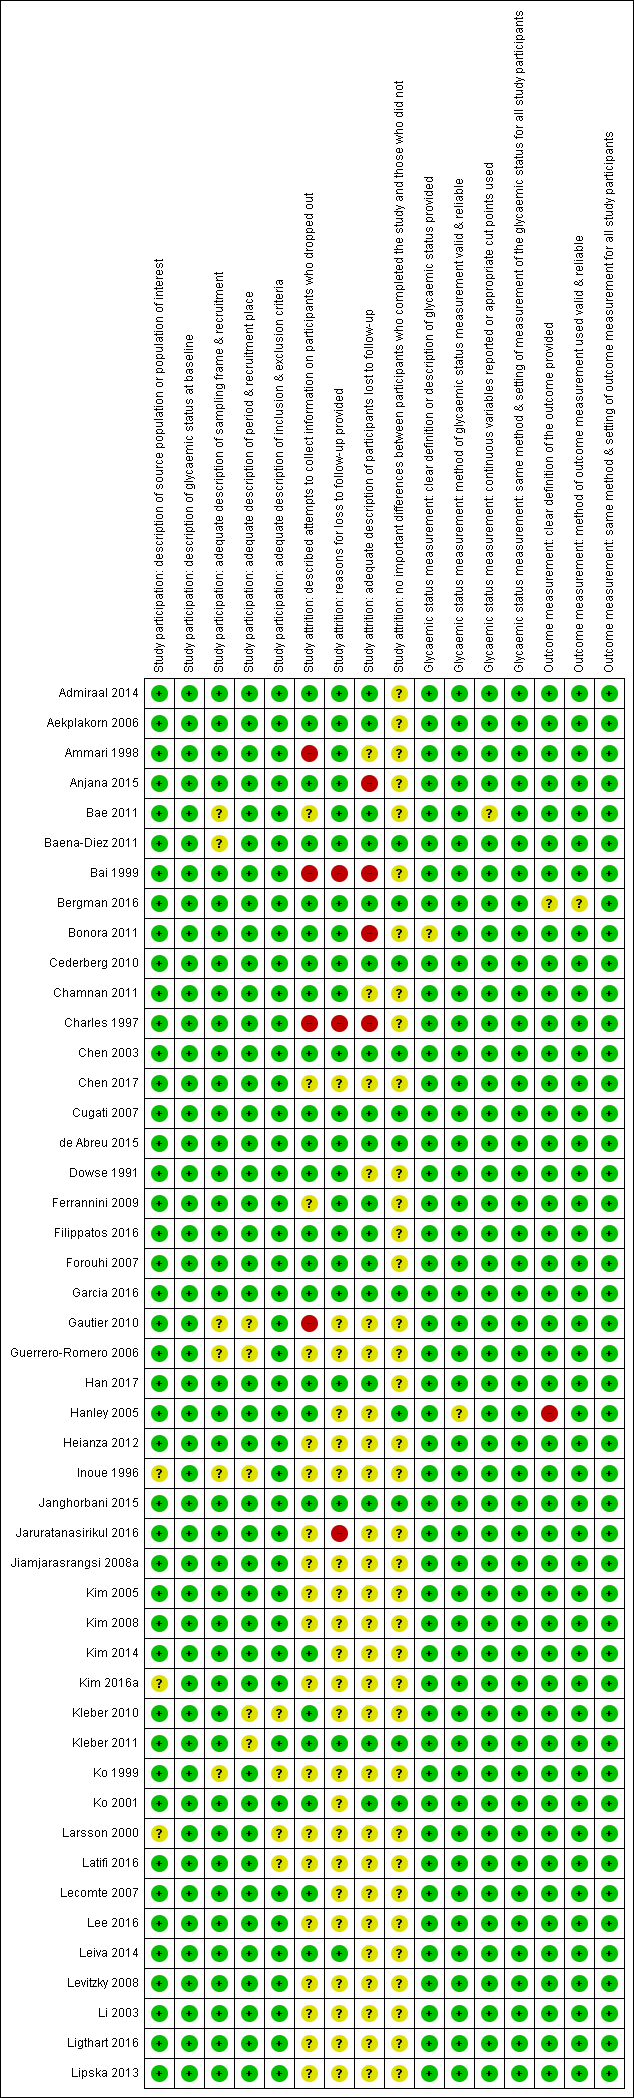
'Risk of bias' summary for studies of overall prognosis in people with intermediate hyperglycaemia for developing type 2 diabetes: review authors' judgements about each risk of bias item for each included study (part 1). The summary was split into part 1 (Figure 3) and part 2 (Figure 4) for better legibility

Risk of bias summary for studies of overall prognosis of people with intermediate hyperglycaemia for developing type 2 diabetes: review authors' judgements about each risk of bias item for each included study (part 2)
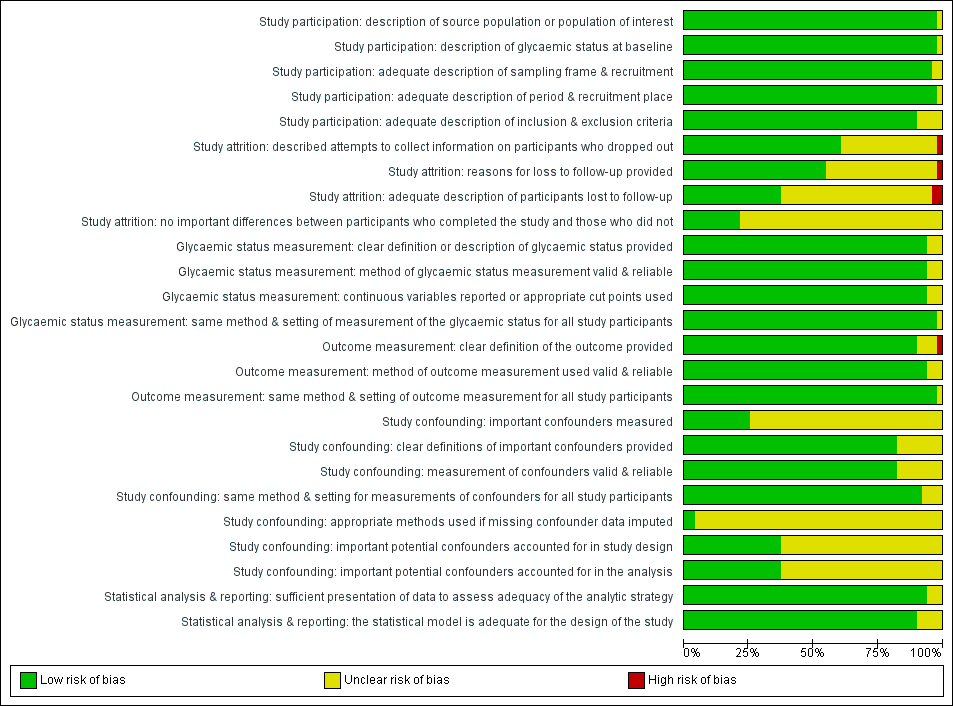
Risk of bias graph for studies of intermediate hyperglycaemia versus normoglycaemia as a prognostic factor for developing type 2 diabetes: review authors' judgements about each risk of bias item presented as percentages across all included studies

Risk of bias summary for studies of intermediate hyperglycaemia versus normoglycaemia as a prognostic factor for developing type 2 diabetes: review authors' judgements about each risk of bias item for each included study

Impaired fasting glucose 5.6 mmol/L (IFG5.6) threshold: association with cumulative type 2 diabetes mellitus (T2DM) incidence over 2–5 years
*Isolated IFG5.6
CI: confidence interval; M: men; n/N: events/number of participants; W: women
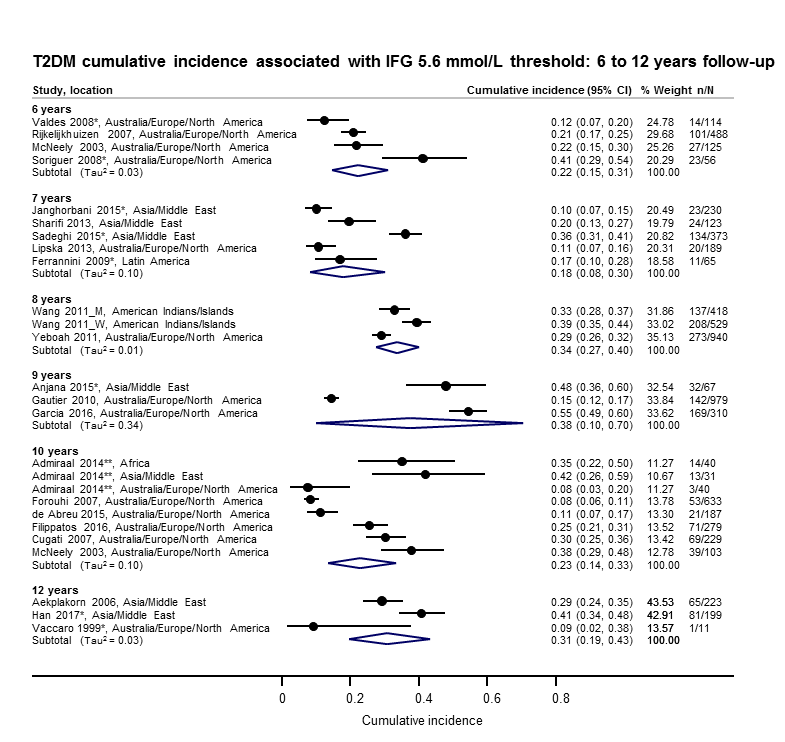
Impaired fasting glucose 5.6 mmol/L (IFG5.6) threshold: association with cumulative type 2 diabetes mellitus (T2DM) incidence over 6–12 years
*Isolated IFG5.6
**'Africa': African Surinamese cohort, 'Asia': Asian Surinamese cohort, 'Australia/Europe/North America': 'ethnic Dutch' cohort.
CI: confidence interval; M: men; n/N: events/number of participants; W: women
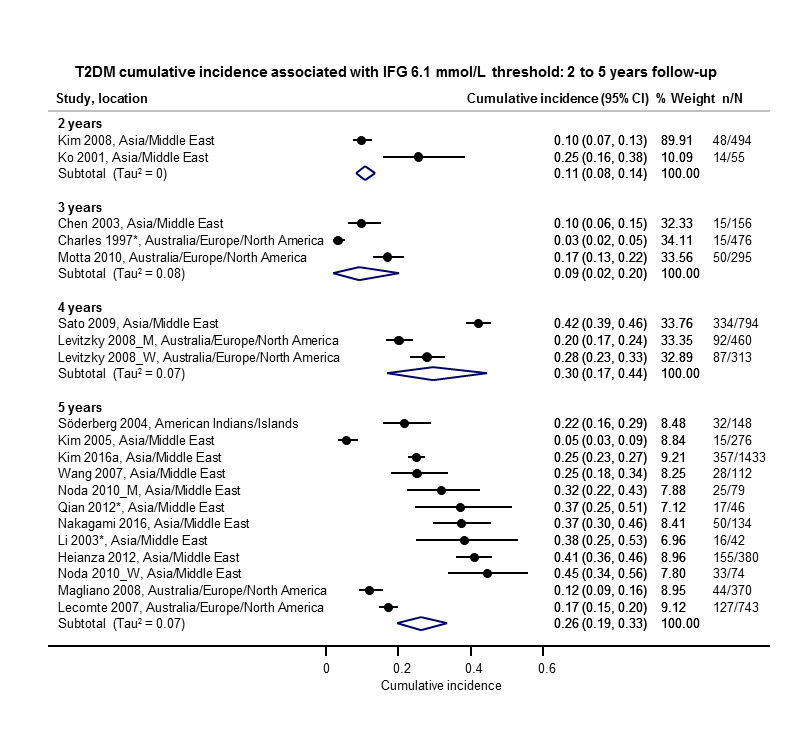
Impaired fasting glucose 6.1 mmol/L (IFG6.1) threshold: association with cumulative type 2 diabetes mellitus (T2DM) incidence over 2–5 years
*Isolated IFG6.1
CI: confidence interval; M: men; n/N: events/number of participants; W: women
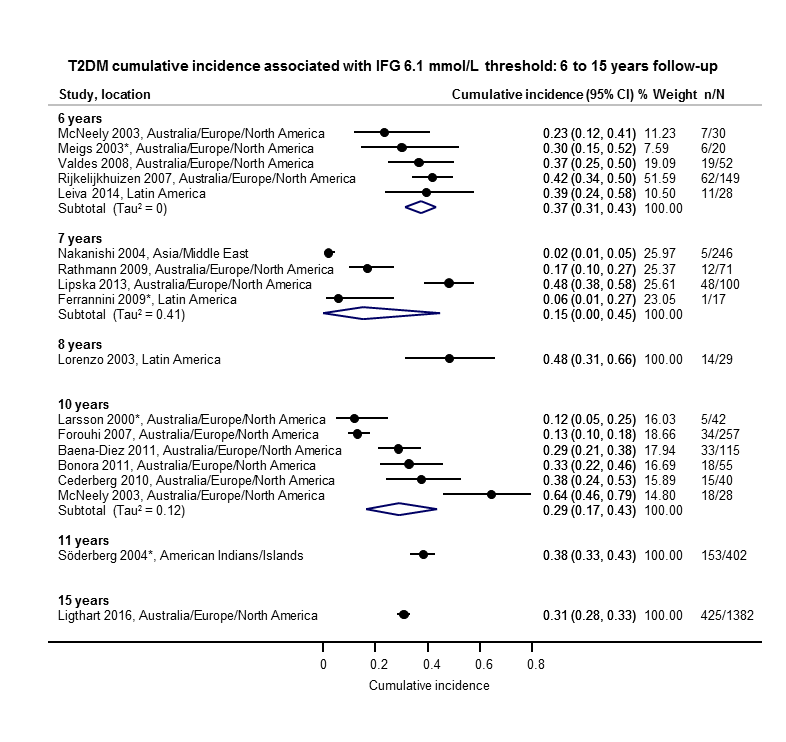
Impaired fasting glucose 6.1 mmol/L (IFG6.1) threshold: association with cumulative type 2 diabetes mellitus (T2DM) incidence over 6–15 years
*Isolated IFG6.1
CI: confidence interval; n/N: events/number of participants

Impaired glucose tolerance (IGT): association with cumulative type 2 diabetes mellitus (T2DM) incidence over 1–5 years
*Isolated IGT
CI: confidence interval; n/N: events/number of participants
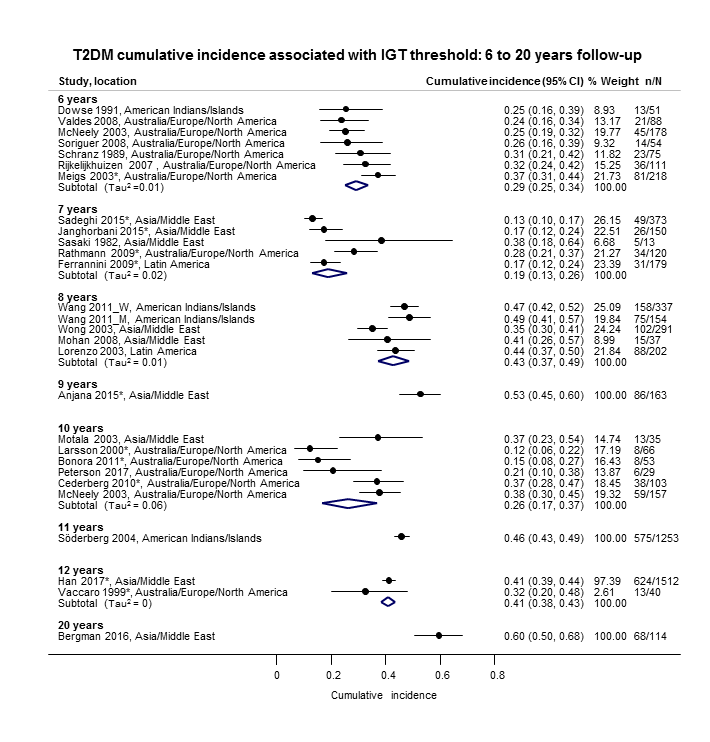
Impaired glucose tolerance (IGT): association with cumulative type 2 diabetes mellitus (T2DM) incidence over 6–20 years
*Isolated IGT
CI: confidence interval; M: men; n/N: events/number of participants; W: women

Combined impaired glucose tolerance (IGT) and impaired fasting glucose (IFG): association with cumulative type 2 diabetes mellitus (T2DM) incidence over 1–12 years
CI: confidence interval; M: men; n/N: events/number of participants; W: women
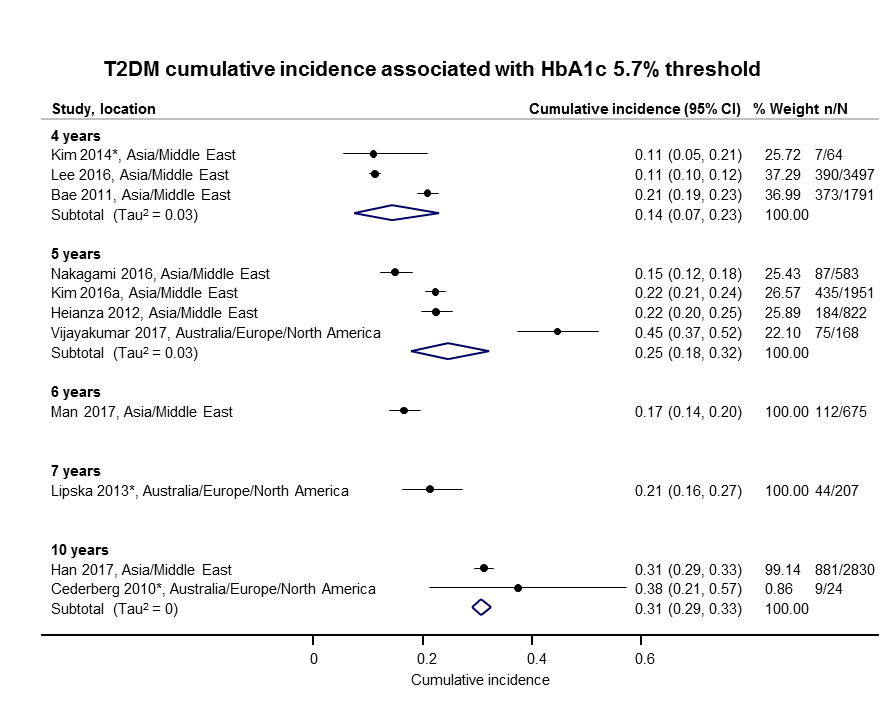
Elevated glycosylated haemoglobin A1c (HbA1c) 5.7% threshold: association with cumulative type 2 diabetes mellitus (T2DM) incidence over 4–10 years
CI: confidence interval; n/N: events/number of participants

Elevated glycosylated haemoglobin A1c (HbA1c) 6.0% threshold: association with cumulative type 2 diabetes mellitus (T2DM) incidence over 3–15 years
CI: confidence interval; n/N: events/number of participants

Cumulative type 2 diabetes mellitus (T2DM) incidence in children/adolescents over 1–10 years
CI: confidence interval; HbA1c 5.7: glycosylated haemoglobin A1c 5.7% threshold; (i‐)IGT: (isolated) impaired glucose tolerance; n/N: events/number of participants; NO: non‐overweight; OV: overweight

Regression from intermediate hyperglycaemia to normoglycaemia in adults over 1–5 years
CI: confidence interval; HbA1c5.7 : glycosylated haemoglobin A1c 5.7%; i‐IFG5.6/6.1 : (isolated) impaired fasting glucose 5.6/6.1 mmol/L threshold;IGT: impaired glucose tolerance; n/N: events/number of participants

Regression from intermediate hyperglycaemia to normoglycaemia in adults over 6–11 years
CI: confidence interval; i‐IFG5.6/6.1 : (isolated) impaired fasting glucose 5.6/6.1 mmol/L threshold; i‐IGT: (isolated) impaired glucose tolerance; n/N: events/number of participants
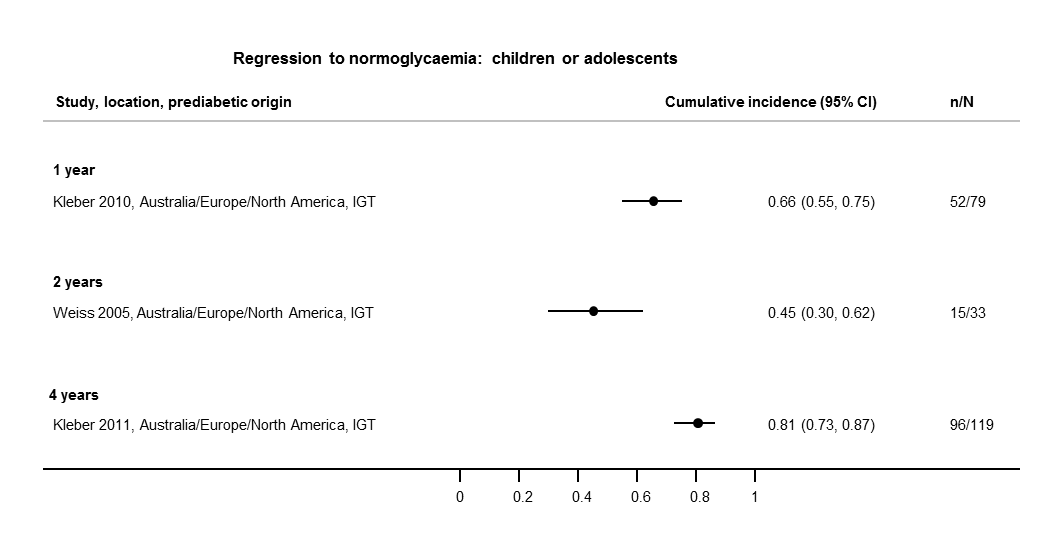
Regression from intermediate hyperglycaemia to normoglycaemia in children/adolescents over 1–4 years
CI: confidence interval; IGT: impaired glucose tolerance; n/N: events/number of participants
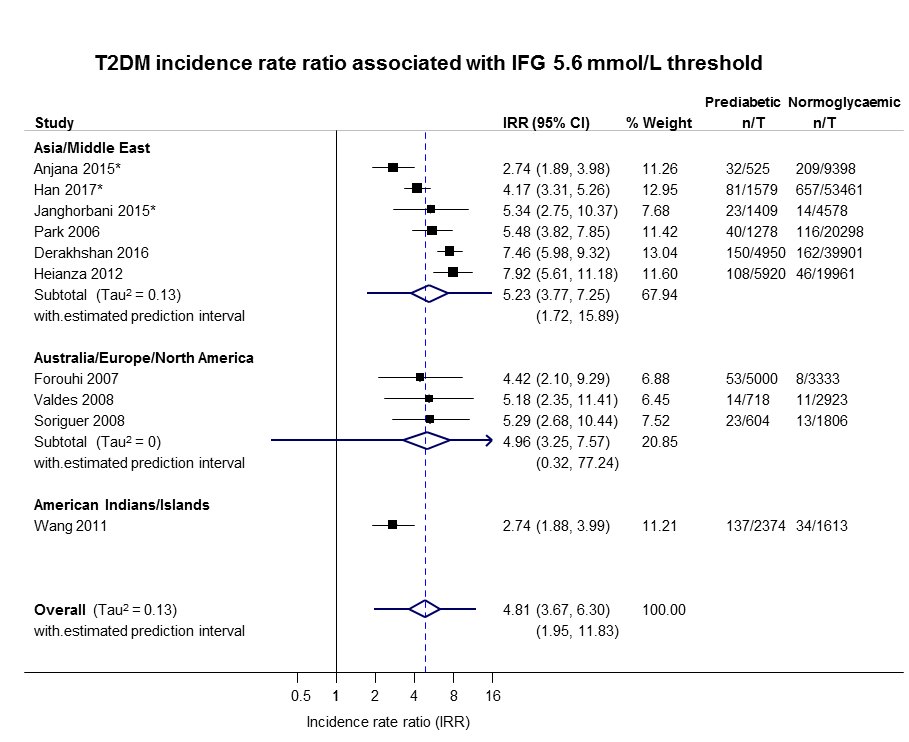
IFG: impaired fasting glucose; IRR: incidence rate ratio; n: number of cases; T: person‐time in years

IFG: impaired fasting glucose; IRR: incidence rate ratio; n: number of cases; T: person‐time in years

IGT: impaired glucose tolerance; IRR: incidence rate ratio; n: number of cases; T: person‐time in years

IFG: impaired fasting glucose; IGT: impaired glucose tolerance; IRR: incidence rate ratio; n: number of cases; T: person‐time in years
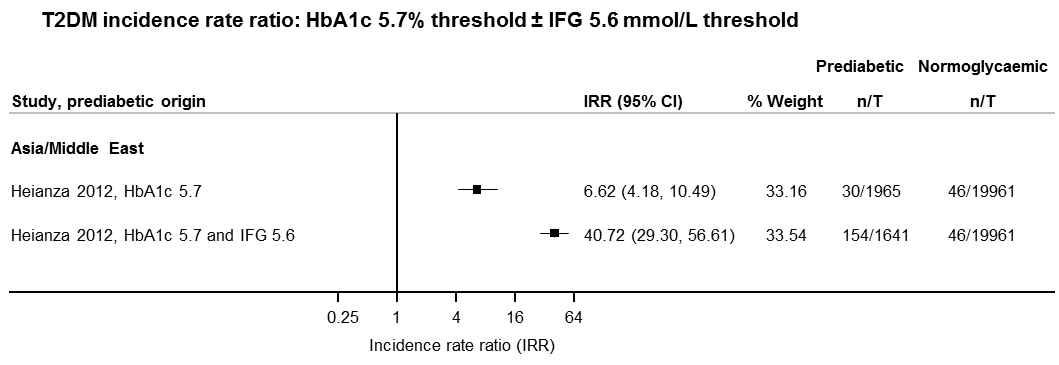
IFG: impaired fasting glucose; HbA1c: glycosylated haemoglobin A1c; IRR: incidence rate ratio; n: number of cases; T: person‐time in years
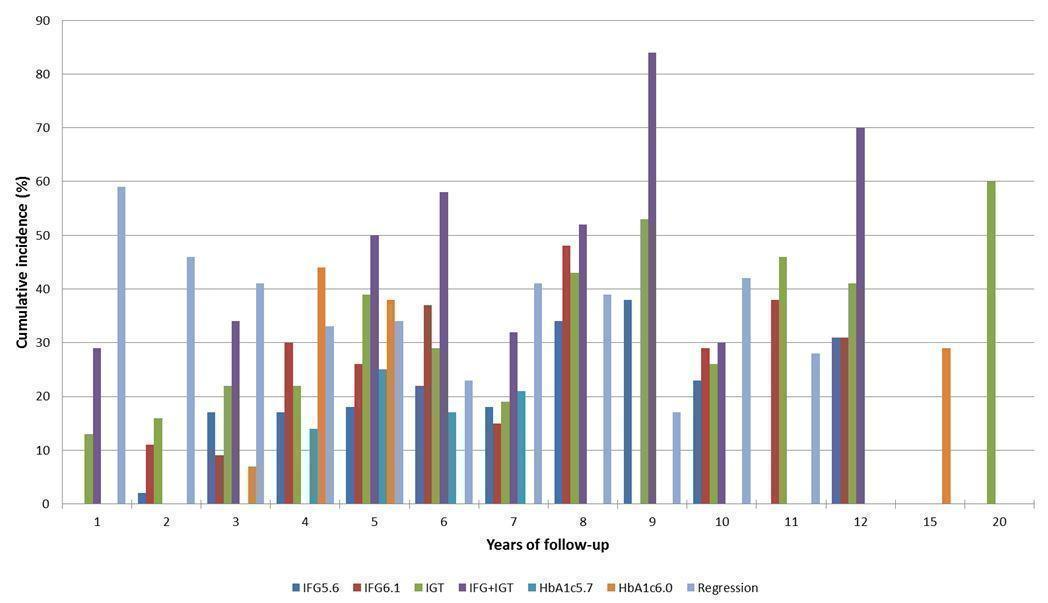
Overall prognosis of people with intermediate hyperglycaemia (cumulative type 2 diabetes incidence and regression to normoglycaemia) associated with measures of intermediate hyperglycaemia
HbA1c5.7/HbA1c6.0: glycosylated haemoglobin A1c 5.7%/6.0% threshold; IFG5.6/6.1: impaired fasting glucose 5.6/6.1 mmol/L threshold; IGT: impaired glucose tolerance

Intermediate hyperglycaemia versus normoglycaemia as a prognostic factor for developing type 2 diabetes (associated with different measures and relative risks of intermediate hyperglycaemia)
HbA1c5.7/HbA1c6.0: glycosylated haemoglobin A1c 5.7%/6.0% threshold; IFG5.6/6.1: impaired fasting glucose 5.6/6.1 mmol/L threshold; IGT: impaired glucose tolerance; IRR: incidence rate ratio; OR: odds ratio; HR: hazard ratio
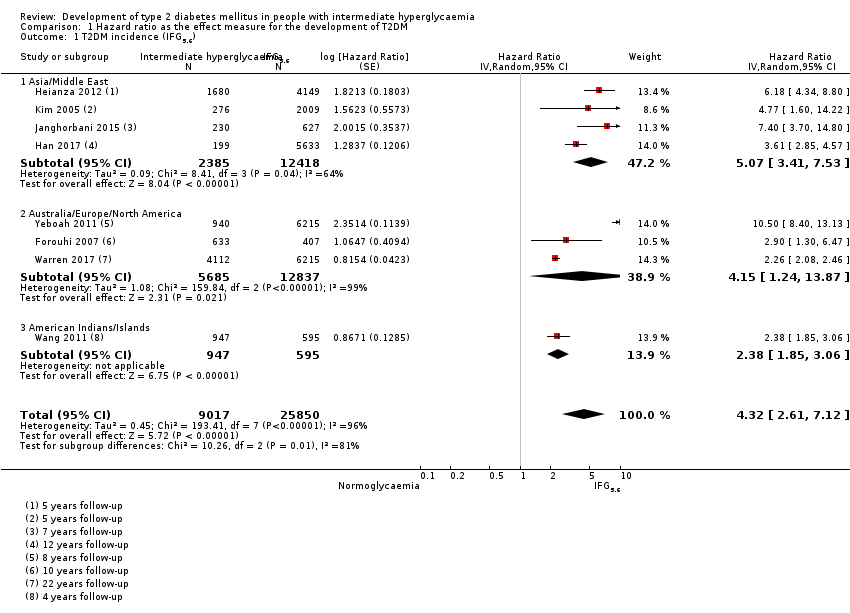
Comparison 1 Hazard ratio as the effect measure for the development of T2DM, Outcome 1 T2DM incidence (IFG5.6).

Comparison 1 Hazard ratio as the effect measure for the development of T2DM, Outcome 2 T2DM incidence (IFG6.1).

Comparison 1 Hazard ratio as the effect measure for the development of T2DM, Outcome 3 T2DM incidence (IGT).

Comparison 1 Hazard ratio as the effect measure for the development of T2DM, Outcome 4 T2DM incidence (IFG + IGT).

Comparison 1 Hazard ratio as the effect measure for the development of T2DM, Outcome 5 T2DM incidence (HbA1c5.7).
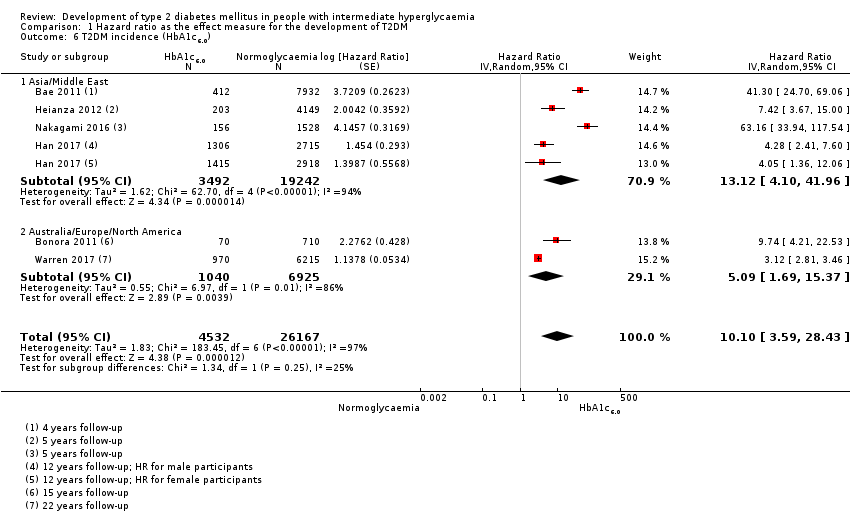
Comparison 1 Hazard ratio as the effect measure for the development of T2DM, Outcome 6 T2DM incidence (HbA1c6.0).
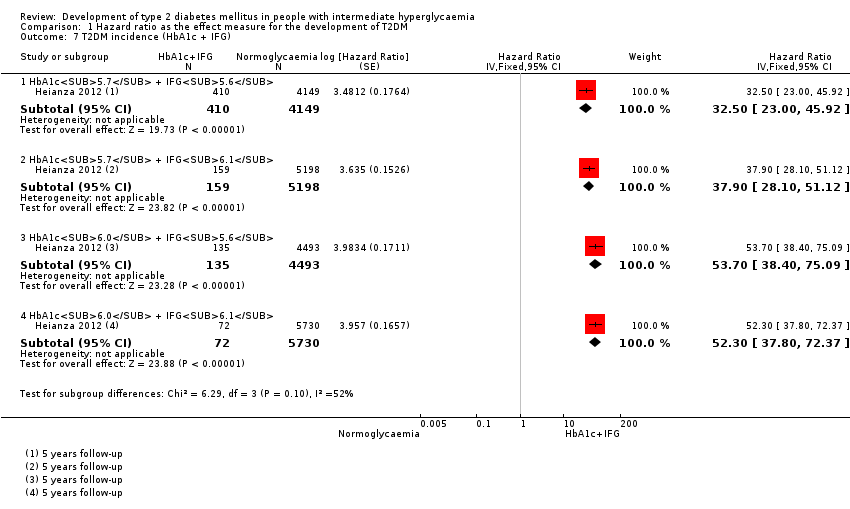
Comparison 1 Hazard ratio as the effect measure for the development of T2DM, Outcome 7 T2DM incidence (HbA1c + IFG).

Comparison 2 Odds ratio as the effect measure for the development of T2DM, Outcome 1 T2DM incidence (IFG5.6).

Comparison 2 Odds ratio as the effect measure for the development of T2DM, Outcome 2 T2DM incidence (IFG6.1).

Comparison 2 Odds ratio as the effect measure for the development of T2DM, Outcome 3 T2DM incidence (IGT).

Comparison 2 Odds ratio as the effect measure for the development of T2DM, Outcome 4 T2DM incidence (IFG + IGT).
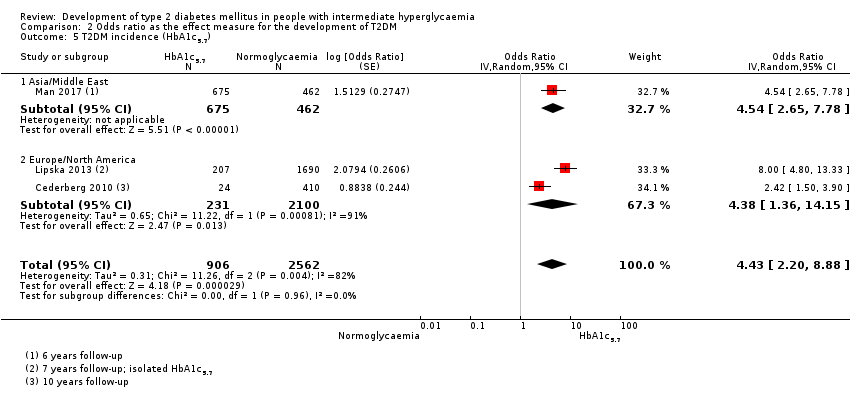
Comparison 2 Odds ratio as the effect measure for the development of T2DM, Outcome 5 T2DM incidence (HbA1c5.7).
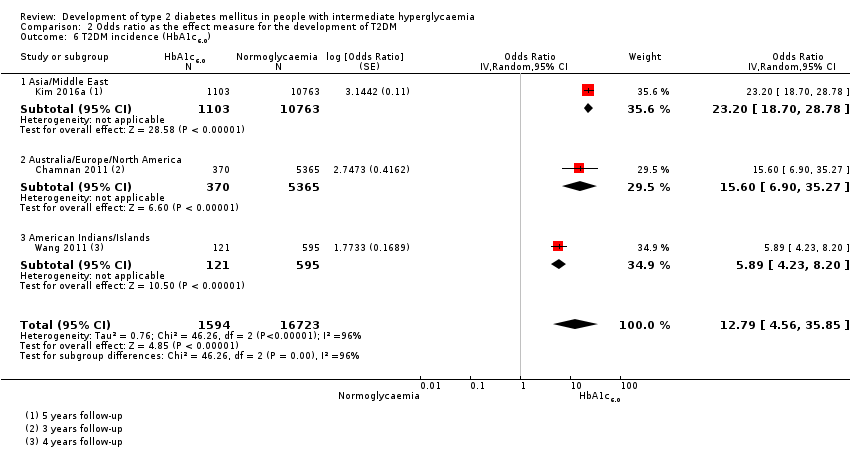
Comparison 2 Odds ratio as the effect measure for the development of T2DM, Outcome 6 T2DM incidence (HbA1c6.0).
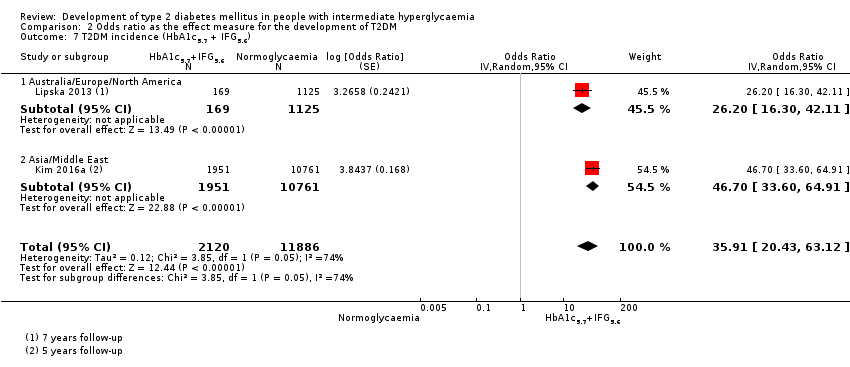
Comparison 2 Odds ratio as the effect measure for the development of T2DM, Outcome 7 T2DM incidence (HbA1c5.7 + IFG5.6).
| Outcome: development of T2DM | ||||||||
| Follow‐up | Cumulative T2DM incidence % (95% CI) | Regression from intermediate hyperglycaemia to normoglycaemia % (95% CI) | Overall certainty of the evidence (GRADE)a | |||||
| IFG5.6 | IFG6.1 | IGT | IFG + IGT | HbA1c5.7 | HbA1c6.0 | |||
| 1 | — | — | 13 (5–23) [3; 671] | 29 (23–36) [1; 207] | — | — | 59 (54–64) [2; 375] | ⊕⊕⊕⊝ |
| 2 | 2 (1–2) [1; 1335] | 11 (8–14) [2; 549] | 16 (9–26) [9; 1998] | — | — | — | 46 (36–55) [9; 2852] | |
| 3 | 17 (6–32) [3; 1091] | 9 (2–20) [3; 927] | 22 (18–27) [3; 417] | 34 (28–41) [1; 209]— | — | 7 (5–10) [1; 370] | 41 (24–69) [7; 1356] | |
| 4 | 17 (13–22) [3; 800] | 30 (17–44) [2; 1567] | 22 (12–34) [5; 1042] | — | 14 (7–23) [3; 5352] | 44 (40–48) [2; 627] | 33 (26–40) [3; 807] | |
| 5 | 18 (10–27) [7; 3530] | 26 (19–33) [11; 3837] | 39 (25–53) [12; 3444] | 50 (37–63) [5; 478] | 25 (18–32) [4; 3524] | 38 (26–51) [3; 1462] | 34 (27–42) [9; 2603] | |
| 6 | 22 (15–31) [4; 738] | 37 (31–43) [5; 279] | 29 (25–34) [7; 775] | 58 (48–67) [4; 106] | 17 (14–20) [1; 675] | — | 23 (3–53) [5; 1328] | |
| 7 | 18 (8–30) [5; 980] | 15 (0–45) [4; 434] | 19 (13–26) [5; 835] | 32 (20–45) [4; 753] | 21 (16–27) [1; 207] | — | 41 (37–45) [4; 679] | |
| 8 | 34 (27–40) [2; 1887] | 48 (31–66) [1;29] | 43 (37–49) [4; 1021] | 52 (47–57) [1; 356] | — | — | 39 (33–44) [2; 328] | |
| 9 | 38 (10–70) [3; 1356] | — | 53 (45–60) [1; 163] | 84 (74–91) [1; 69] | — | — | 17 (14–22) [1; 299] | |
| 10 | 23 (14–33) [6; 1542] | 29 (17–43) [6; 537] | 26 (17–37) [6; 443] | 30 (17–44) [2; 49] | 31 (29–33) [2; 2854] | — | 42 (22–63) [7; 894] | |
| 11 | — | 38 (33–43) [1; 402] | 46 (43–49) [1; 1253] | — | — | — | 28 (17–39) [2; 736] | |
| 12 | 31 (19–34) [3; 433] | 31 (28–33) [1; 1382] | 41 (38–43) [2; 1552] | 70 (63–76) [2; 207] | — | — | — | |
| 15 | — | — | — | — | — | 29 (19–40) [1; 70] | — | |
| 20 | — | — | 60 (5–68) [1; 114] | — | — | — | — | |
| CI: confidence interval; HbA1c5.7 : glycosylated haemoglobin A1c, 5.7% threshold; HbA1c6.0 : glycosylated haemoglobin A1c, 6.0% threshold; IFG5.6 : impaired fasting glucose, 5.6 mmol/L threshold; IFG6.1 : impaired fasting glucose, 6.1 mmol/L threshold; IGT: impaired glucose tolerance; T2DM: type 2 diabetes mellitus. | ||||||||
| GRADE Working Group grades of evidence | ||||||||
| aWith phase 2 explanatory studies aiming to confirm independent associations between the prognostic factor and the outcome, GRADE starts with 'high quality' (Huguet 2013). We assumed the GRADE factor publication bias was inherent with this type of research (phase 2 design), so we did not use it as a potential downgrading factor | ||||||||
| Outcome: development of T2DM | ||||
| No of studies | No of participants with intermediate hyperglycaemia | Geographic region/special population | Estimated effect (95% CI) | Overall certainty of the evidence (GRADE)a |
| HR: 4 IRR: 6 OR: 10 | HR: 2385 IRR: 15,661 OR: 6359 | Asia/Middle East | HR: 5.07 (3.41–4.86) [1.07–24.02] IRR: 5.23 (3.77–7.25) [1.72–15.89] OR: 2.94 (1.77–4.86) [0.43–19.93] | ⊕⊕⊝⊝ |
| HR: 3 IRR: 3 OR: 9 | HR: 5685 IRR: 6322 OR: 1949 | Australia/Europe/North America | HR: 4.15 (1.24–13.9) [N/M] IRR: 4.96 (3.25–7.57) [0.32–77.24] OR: 6.47 (3.81–11.00) [0.99–42.32] | |
| HR: 0 IRR: 0 OR: 1 | HR: 0 IRR: 0 OR: 65 | Latin America | HR: NA IRR: NA OR: 4.28 (3.21–5.71) | |
| HR: 1 IRR: 1 OR: 1 | HR: 947 IRR: 2374 OR: 947 | American Indians/Islands | HR: 2.38 (1.85–3.06) IRR: 2.74 (1.88–3.99) OR: 3.12 (2.31–4.21) | |
| HR: 8 IRR: 10 OR: 21 | HR: 9017 IRR: 24,357 OR: 9320 | Overall | HR: 4.32 (2.61–7.12) [0.75–25.0] IRR: 4.81 (3.67–6.30) [1.95–11.83] OR: 4.15 (2.75–6.28) [0.53–32.4] | |
| CI: confidence interval; HR: hazard ratio;IFG5.6 : impaired fasting glucose 5.6 mmol/L threshold; IRR: incidence rate ratio; NA: not applicable; N/M: fewer than 3 studies or calculation of the 95% prediction interval did not provide a meaningful estimate; OR: odds ratio; T2DM: type 2 diabetes mellitus. | ||||
| GRADE Working Group grades of evidence | ||||
| aWith phase 2 explanatory studies aiming to confirm independent associations between the prognostic factor and the outcome, GRADE starts with 'high quality' (Huguet 2013). We assumed the GRADE factor publication bias was inherent with this type of research (phase 2 design), so we did not use it as a potential downgrading factor | ||||
| Outcome: development of T2DM | ||||
| No of studies | No of participants with intermediate hyperglycaemia | Geographic region/special population | Estimated effect (95% CI) | Overall certainty of |
| HR: 5 IRR: 2 OR: 7 | HR: 1054 IRR: 1677 OR: 3317 | Asia/Middle East | HR: 10.55 (3.61–30.81) [N/M] IRR: 3.62 (1.67–7.83) [N/M] OR: 5.18 (2.32–11.53) [0.29–91.37] | ⊕⊕⊝⊝ |
| HR: 4 IRR: 4 OR: 7 | HR: 1736 IRR: 3438 OR: 1240 | Australia/Europe/North America | HR: 3.30 (2.32–4.67) [0.84–12.99] IRR: 8.55 (6.37–11.48) [4.37–16.73] OR: 8.69 (4.95–15.24) [1.20–62.69] | |
| HR: 0 IRR: 0 OR: 1 | HR: 0 IRR: 0 OR: 17 | Latin America | HR: NA IRR: NA OR: 3.73 (2.18–6.38) | |
| HR: 0 IRR: 0 OR: 0 | HR: 0 IRR: 0 OR: 0 | American Indians/Islands | HR: NA IRR: NA OR: NA | |
| HR: 9 IRR: 6 OR: 15 | HR: 2818 IRR: 5115 OR: 4574 | Overall | HR: 5.47 (3.50–8.54) [1.09–27.56] IRR: 6.82 (4.53–10.25) [2.03–22.87] OR: 6.60 (4.18–10.43) [0.93–46.82] | |
| CI: confidence interval; HR: hazard ratio;IFG6.1 : impaired fasting glucose 6.1 mmol/L threshold; IRR: incidence rate ratio; NA: not applicable; N/M: fewer than 3 studies or calculation of the 95% prediction interval did not provide a meaningful estimate; OR: odds ratio; T2DM: type 2 diabetes mellitus. | ||||
| GRADE Working Group grades of evidence | ||||
| aWith phase 2 explanatory studies aiming to confirm independent associations between the prognostic factor and the outcome, GRADE starts with 'high quality' (Huguet 2013). We assumed the GRADE factor publication bias was inherent with this type of research (phase 2 design), so we did not use it as a potential downgrading factor | ||||
| Outcome: development of T2DM | ||||
| No of studies | No of participants with intermediate hyperglycaemia | Geographic region/special population | Estimated effect (95% CI) | Overall certainty of the evidence (GRADE)a |
| HR: 3 IRR: 5 OR: 6 | HR: 1780 IRR: 14,809 OR: 1226 | Asia/Middle East | HR: 4.48 (2.81–7.15) [N/M] IRR: 3.93 (3.03–5.10) [1.71–9.02] OR: 3.74 (2.83–4.94) [1.70–8.21] | ⊕⊕⊝⊝ |
| HR: 2 IRR: 5 OR: 11 | HR: 2230 IRR: 2572 OR: 1481 | Australia/Europe/North America | HR: 2.53 (1.52–4.19) [N/M] IRR: 5.93 (4.11–8.57) [2.38–14.81] OR: 5.20 (3.62–7.45) [1.50–18.09] | |
| HR: 0 IRR: 0 OR: 2 | HR: 0 IRR: 0 OR: 381 | Latin America | HR: NA IRR: NA OR: 4.94 (3.15–7.76) [N/M] | |
| IRR: 2 | IRR: 1087 | American Indians/Islands | IRR: 4.46 (3.12–6.38) [N/M] OR: 3.60 (1.40–9.26) HR: NA | |
| HR: 5 IRR: 12 OR: 20 | HR: 4010 IRR: 18,468 OR: 3139 | Overall | HR: 3.61 (2.31–5.64) [0.69–18.97] IRR: 4.48 (3.59–5.44) [2.60–7.70] OR: 4.61 (3.76–5.64) [2.10–10.13] | |
| CI: confidence interval; HR: hazard ratio;IGT: impaired glucose tolerance; IRR: incidence rate ratio; NA: not applicable; N/M: fewer than 3 studies or calculation of the 95% prediction interval did not provide a meaningful estimate; T2DM: type 2 diabetes mellitus. | ||||
| GRADE Working Group grades of evidence | ||||
| aWith phase 2 explanatory studies aiming to confirm independent associations between the prognostic factor and the outcome, GRADE starts with 'high quality' (Huguet 2013). We assumed the GRADE factor publication bias was inherent with this type of research (phase 2 design), so we did not use it as a potential downgrading factor | ||||
| Outcome: development of T2DM | ||||
| No of studies | No of participants with intermediate hyperglycaemia | Geographic region/special population | Estimated effect (95% CI) | Overall certainty of the evidence (GRADE)a |
| HR: 3 IRR: 4 OR: 3 | HR: 461 IRR: 3166 OR: 498 | Asia/Middle East | HR: 10.20 (5.45–19.09) [N/M] IRR: 11.20 (5.59–22.43) [N/M] OR: 6.99 (3.09–15.83) [N/M] | ⊕⊕⊝⊝ |
| HR: 1 IRR: 4 OR: 6 | HR: 221 IRR: 699 OR: 154 | Australia/Europe/North America | HR: 3.80 (2.30–6.28) [N/M] IRR: 13.92 (9.99–19.40) [6.71–28.85] OR: 20.95 (12.40–35.40) [4.93–89.05] | |
| HR: 0 IRR: 0 OR: 0 | HR: 0 IRR: 0 OR: 0 | Latin America | HR: NA IRR: NA OR: NA | |
| HR: 1 IRR: 1 | HR: 356 IRR: 605 | American Indians/Islands | HR: 4.06 (3.05–5.40) IRR: 5.18 (3.42–7.83) | |
| HR: 5 IRR: 9 OR: 9 | HR: 1038 IRR: 4470 OR: 652 | Overall | HR: 6.90 (4.15–11.45) [1.06–44.95] IRR: 10.94 (7.22–16.58) [2.58–46.46] OR: 13.14 (7.41–23.30) [1.84–93.66] | |
| CI: confidence interval; HR: hazard ratio;IFG: impaired fasting glucose; IGT: impaired glucose tolerance; IRR: incidence rate ratio; NA: not applicable; N/M: fewer than 3 studies or calculation of the 95% prediction interval did not provide a meaningful estimate; OR: odds ratio; T2DM: type 2 diabetes mellitus. | ||||
| GRADE Working Group grades of evidence | ||||
| aWith phase 2 explanatory studies aiming to confirm independent associations between the prognostic factor and the outcome, GRADE starts with 'high quality' (Huguet 2013). We assumed the GRADE factor publication bias was inherent with this type of research (phase 2 design), so we did not use it as a potential downgrading factor | ||||
| Outcome: development of T2DM | ||||
| No of studies | No of participants with intermediate hyperglycaemia | Geographic region/special population | Estimated effect (95% CI) | Overall certainty of the evidence (GRADE)a |
| HR: 3 IRR: 1 OR: 1 | HR: 3196 IRR: 1965 OR: 675 | Asia/Middle East | HR: 7.21 (5.14–10.11) [0.81–64.52] IRR: 6.62 (4.18–10.49) [N/M] OR: 4.54 (2.65–7.78) [N/M] | ⊕⊕⊝⊝ |
| HR: 1 IRR: 0 OR: 2 | HR: 2027 IRR: 0 OR: 231 | Australia/Europe/North America | HR: 2.71 (2.48–2.96) [N/M] IRR: NA OR: 4.38 (1.36–14.15) [N/M] | |
| HR: 0 IRR: 0 OR: 0 | HR: 0 IRR: 0 OR: 0 | Latin America | HR: NA IRR: NA OR: NA | |
| HR: 0 IRR: 0 OR: 0 | HR: 0 IRR: 0 OR: 0 | American Indians/Islands | HR: NA IRR: NA OR: NA | |
| HR: 4 IRR: 1 OR: 3 | HR: 5223 IRR: 1965 OR: 906 | Overall | HR: 5.55 (2.77–11.12) [0.23–141.18] IRR: 6.62 (4.18–10.49) [N/M] OR: 4.43 (2.20–8.88) [N/M] | |
| CI: confidence interval; HbA1c5.7 : glycosylated haemoglobin A1c 5.7% threshold; HR: hazard ratio;IRR: incidence rate ratio; NA: not applicable; N/M: fewer than 3 studies or calculation of the 95% prediction interval did not provide a meaningful estimate; OR: odds ratio; T2DM: type 2 diabetes mellitus. | ||||
| GRADE Working Group grades of evidence | ||||
| aWith phase 2 explanatory studies aiming to confirm independent associations between the prognostic factor and the outcome, GRADE starts with 'high quality' (Huguet 2013). We assumed the GRADE factor publication bias was inherent with this type of research (phase 2 design), so we did not use it as a potential downgrading factor | ||||
| Outcome: development of T2DM | ||||
| No of studies | No of participants with intermediate hyperglycaemia | Geographic region/special population | Estimated effect (95% CI) | Overall certainty of the evidence (GRADE)a |
| HR: 2 IRR: 0 OR: 1 | HR: 1040 IRR: 0 OR: 370 | Australia/Europe/North America | HR: 5.09 (1.69–15.37) [N/M] IRR: NA OR: 15.60 (6.90–35.27) [N/M] | ⊕⊕⊝⊝ |
| HR: 4 IRR: 0 OR: 1 | HR: 3492 IRR: 0 OR: 1103 | Asia/Middle East | HR: 13.12 (4.10–41.96) [N/M] IRR: NA OR: 23.20 (18.70–28.78) [N/M] | |
| HR: 0 IRR: 0 OR: 0 | HR: 0 IRR: 0 OR: 0 | Latin America | HR: NA IRR: NA OR: NA | |
| IRR: 0 | IRR: 0 HR: 0 | American Indians/Islands | IRR: NA OR: 5.89 (4.23–8.20) [N/M] HR: NA | |
| HR: 6 IRR: 0 OR: 3 | HR: 4532 IRR: 0 OR: 1594 | Overall | HR: 10.10 (3.59–28.43) [N/M] IRR: NA OR: 12.79 [4.56–35.85] [N/M] | |
| CI: confidence interval; HbA1c6.0 : glycosylated haemoglobin A1c 6.0% threshold; HR: hazard ratio;IRR: incidence rate ratio; NA: not applicable; N/M: fewer than 3 studies or calculation of the 95% prediction interval did not provide a meaningful estimate; OR: odds ratio; T2DM: type 2 diabetes mellitus. | ||||
| GRADE Working Group grades of evidence | ||||
| aWith phase 2 explanatory studies aiming to confirm independent associations between the prognostic factor and the outcome, GRADE starts with 'high quality' (Huguet 2013). We assumed the GRADE factor publication bias was inherent with this type of research (phase 2 design), so we did not use it as a potential downgrading factor | ||||
| Follow‐up time (years) | % (95% CI) cumulative T2DM incidence | % (95% CI) regression from IH to normoglycaemia | ||||||
| IFG5.6 | IFG6.1 | IGT | IFG + IGT | HbA1c5.7 | HbA1c6.0 | |||
| 1 | — | — | 13 (5–23) [3; 671] | 29 (23–36) [1; 207] | — | — | 59 (54–64) [2; 375] | |
| 2 | 2 (1–2) [1; 1335] | 11 (8–14) [2; 549] | 16 (9–26) [9; 1998] | — | — | — | 46 (36–55) [9; 2852] | |
| 3 | 17 (6–32) [3; 1091] | 9 (2–20) [3; 927] | 22 (18–27) [3; 417] | 34 (28–41) [1; 209] | — | 7 (5–10) [1; 370] | 41 (24–59) [7; 1356] | |
| 4 | 17 (13–22) [3; 800] | 30 (17–44) [2; 1567] | 22 (12–34) [5; 1042] | — | 14 (7–23) [3; 5352] | 44 (40–48) [2; 627] | 33 (26–40) [3; 807] | |
| 5 | 18 (10–27) [7; 3530] | 26 (19–33) [11; 3837] | 39 (25–53) [12; 3444] | 50 (37–63) [5; 478] | 25 (18–32) [4; 3524] | 38 (26–51) [3; 1462] | 34 (27–42) [9; 2603] | |
| 6 | 22 (15–31) [4; 738] | 37 (31–43) [5; 279] | 29 (25–34) [7; 775] | 58 (48–67) [4; 106] | 17 (14–20) [1; 675] | — | 23 (3–53) [5; 1328] | |
| 7 | 18 (8–30) [5; 980] | 15 (0–45) [4; 434] | 19 (13–26) [5; 835] | 32 (20–45) [4; 753] | 21 (16–27) [1; 207] | — | 41 (37–45) [4; 679] | |
| 8 | 34 (27–40) [2; 1887] | 48 (31–66) [1;29] | 43 (37–49) [4; 1021] | 52 (47–57) [1; 356] | — | — | 39 (33–44) [2; 328] | |
| 9 | 38 (10–70) [3; 1356] | — | 53 (45–60) [1; 163] | 84 (74–91) [1; 69] | — | — | 17 (14–22) [1; 299] | |
| 10 | 23 (14–33) [6; 1542] | 29 (17–43) [6; 537] | 26 (17–37) [6; 443] | 30 (17–44) [2; 49] | 31 (29–33) [2; 2854] | — | 42 (22–63) [7; 894] | |
| 11 | — | 38 (33–43) [1; 402] | 46 (43–49) [1; 1253] | — | — | — | 28 (17–39) [2; 736] | |
| 12 | 31 (19–34) [3; 433] | 31 (28–33) [1; 1382] | 41 (38–43) [2; 1552] | 70 (63–76) [2; 207] | — | — | — | |
| 15 | — | — | — | — | — | 29 (19–40) [1; 70] | — | |
| 20 | — | — | 60 (5–68) [1; 114] | — | — | — | — | |
| CI: confidence interval; HbA1c: glycosylated haemoglobin A1c; HbA1c5.7/6.0 (threshold 5.7% or 6.0%); IFG5.6/6.1 : impaired fasting glucose (threshold 5.6 mmol/L or 6.1 mmol/L); IGT: impaired glucose tolerance; IFG + IGT: both IFG and IGT; IH: intermediate hyperglycaemia; T2DM: type 2 diabetes mellitus | ||||||||
| Ratio (95% CI) [no of studies; no of participants with IH/no of participants with normoglycaemia] | |||||||
| Hazard ratio | |||||||
| Region | IFG5.6 cohort | IFG6.1 cohort | IGT cohort | IFG + IGT cohort | HbA1c5.7 cohort | HbA1c6.0 cohort | HbA1c5.7 + IFG5.6 cohort |
| Asia/Middle East | 5.07 (3.41‐7.53) 1.07–24.02 [4; 2385/12,837] | 10.55 (3.61–30.81) NAb [5; 1054/9756] | 4.48 (2.81–7.15) NAb [3; 1780/6695] | 10.20 (5.45–19.09) NAb [3; 461/6695] | 7.21 (5.14–10.11) 0.81–64.52 [3; 3196/13,609] | 13.12 (4.10–41.96) NAb [4; 3492/19,242] | 32.50 (23.00–45.92)c NAa [1; 410/4149] |
| Australia/Europe/North America | 4.15 (1.24–13.87) NAb [3; 5685/12,837] | 3.30 (2.32–4.67) 0.84–12.99 [4; 1736/8835] | 2.53 (1.52–4.19) NAa [2; 2230/5871] | 3.80 (2.30–6.28) NAa [1; 221/1429] | 2.71 (2.48–2.96) NAa [1: 2027/6215] | 5.09 (1.69–15.37) NAa [2; 1040/6925] | — |
| Latin America | — | 2.06 (1.76–2.41) NAb | — | — | — | — | — |
| American Indians/Islands | 2.38 (1.85–3.06) NAa [1; 947/595] | — | — | 4.06 (3.05–5.40) NAa [1; 356/595] | — | — | — |
| Overall | 4.32 (2.61–7.12) 0.75–25.01 [8; 9017/25,850] | 5.47 (3.50–8.54) 1.09–27.56 [9; 2818/18,591] | 3.61 (2.31–5.64) 0.69–18.97 [5; 4010/12,566] | 6.90 (4.15–11.45) 1.06–44.95 [5; 1038/8719] | 5.55 (2.77–11.12) 0.23–141.18 [4; 5223/19,824] | 10.10 (3.59–28.43) NAb [6; 4532/26,167] | 32.50 (23.00–45.92) NAa [1; 410/4149] |
| Incidence rate ratio | |||||||
| Region | IFG5.6 cohort | IFG6.1 cohort | IGT cohort | IFG + IGT cohort | HbA1c5.7 cohort | HbA1c6.0 cohort | HbA1c5.7 + IFG5.6 cohort |
| Asia/Middle East | 5.23 (3.77–7.25) 1.72–15.89 [6; 15,661/145,597] | 3.62 (1.67–7.83) NAa [2; 1677/36,334] | 3.93 (3.03–5.10) 1.71–9.02 [5; 14,809/73,128] | 11.20 (5.59–22.43) NAb [4; 3166/69,463] | 6.62 (4.18–10.49) NAa [1; 1965/19961] | — | 40.72 (29.30–56.61) NAa [1; 1641/19,961] |
| Australia/Europe/North America | 4.96 (3.25–7.57) 0.32–77.24 [3; 6322/8062] | 8.55 (6.37–11.48) 4.37–16.73 [4; 3438/20,246] | 5.93 (4.11–8.57) 2.38–14.81 [5; 2572/22,329] | 13.92 (9.99–19.40) 6.71–28.85 [4; 699/18,966] | — | — | — |
| Latin America | — | — | — | — | — | — | — |
| American Indians/Islands | 2.74 (1.88–3.99) NAa [1; 2374/1613] | — | 4.46 (3.12–6.38) NAa [2; 1087/2952] | 5.18 (3.42–7.83) NAa [1; 605/1613] | — | — | — |
| Overall | 4.81 (3.67–6.30) 1.95–11.83 [10; 24,357/155,272] | 6.82 (4.53–10.25) 2.03–22.87 [6; 5115/56,580] | 4.48 (3.69–5.44) 2.60–7.70 [12; 18,468/98,409] | 10.94 (7.22–16.58) 2.58–46.46 [9; 4470/90,072] | 6.62 (4.18–10.5) NAa [1; 1965/19961] | — | 40.72 (29.30–56.61) NAa [1; 1641/19,961] |
| Odds ratio | |||||||
| IFG5.6 cohort | IFG6.1 cohort | IGT cohort | IFG + IGT cohort | HbA1c5.7 cohort | HbA1c6.0 cohort | HbA1c5.7 + IFG5.6 cohort | |
| Asia/Middle East | 2.94 (1.77–4.86) 0.43–19.93 [10; 6359/28,218] | 5.18 (2.32–11.53) 0.29–91.37 [7; 3317/25,604] | 3.74 (2.83–4.94) 1.70–8.21 [6; 1226/7417] | 6.99 (3.09–15.83) NAb [3; 498/3704] | 4.54 (2.65–7.78) NAa [1; 675/462] | 23.20 (18.70–28.78) NAa [1; 1103/10,763] | 46.70 (33.60–64.91) NAa [1; 1951/10,761] |
| Australia/Europe/North America | 6.47 (3.81–11.00) 0.99–42.32 [9; 1949/7920] | 8.69 (4.95–15.24) 1.20–62.69 [7; 1240/5094] | 5.20 (3.62–7.45) 1.50–18.09 [11; 1481/7684] | 20.95 (12.40–35.40) 4.93–89.05 [6; 154/5300] | 4.38 (1.36–14.15) NAa [2; 231/2100] | 15.60 (6.90–35.27) NAa [1; 370/5365] | 26.20 (16.30–41.11) NAa [1; 169/1125] |
| Latin America | 4.28 (3.21–5.71) NAa [1; 65/1594] | 3.73 (2.18–6.38) NAa [1; 17/1594] | 4.94 (3.15–7.76) NAa [2; 381/3097] | — | — | — | — |
| American Indians/Islands | 3.12 (2.31–4.21) NAa [1; 947/595] | — | 3.60 (1.40–9.26) NAa [1; 51/215] | — | — | 5.89 (4.23–8.20) NAa [1; 121/595] | — |
| Overall | 4.15 (2.75–6.28) 0.54–32.00 [21; 9320/38,327] | 6.60 (4.18–10.43) 0.93–46.82 [15; 4574/32,292] | 4.61 (3.76–5.64) 2.10–10.13 [20; 3139/18,413] | 13.14 (7.41–23.30) 1.84–93.66 [9; 652/9004] | 4.43 (2.20–8.88) NAb [3; 906/2562] | 12.8 [4.56–35.9] NAb [3; 1594/16,723] | 35.91 (20.43–63.12) NAa [2; 2120/11,886] |
| CI: confidence interval; HbA1c: glycosylated haemoglobin A1c; HbA1c5.7/6.0 (threshold 5.7% or 6.0%); HbA1c5.7 + IFG5.6 : both HbA1c5.7 and IFG5.6; IFG5.6/6.1 : impaired fasting glucose (threshold 5.6 mmol/L or 6.1 mmol/L); IGT: impaired glucose tolerance; IFG + IGT: both IFG and IGT; IH: intermediate hyperglycaemia; NA: not applicable; T2DM: type 2 diabetes mellitus; NR: not reported | |||||||
| Outcome or subgroup title | No. of studies | No. of participants | Statistical method | Effect size |
| 1 T2DM incidence (IFG5.6) Show forest plot | 8 | 34867 | Hazard Ratio (Random, 95% CI) | 4.32 [2.61, 7.12] |
| 1.1 Asia/Middle East | 4 | 14803 | Hazard Ratio (Random, 95% CI) | 5.07 [3.41, 7.53] |
| 1.2 Australia/Europe/North America | 3 | 18522 | Hazard Ratio (Random, 95% CI) | 4.15 [1.24, 13.87] |
| 1.3 American Indians/Islands | 1 | 1542 | Hazard Ratio (Random, 95% CI) | 2.38 [1.85, 3.06] |
| 2 T2DM incidence (IFG6.1) Show forest plot | 10 | 21475 | Hazard Ratio (Random, 95% CI) | 5.47 [3.50, 8.54] |
| 2.1 Asia/Middle East | 5 | 10810 | Hazard Ratio (Random, 95% CI) | 10.55 [3.61, 30.81] |
| 2.2 Australia/Europe/North America | 4 | 10571 | Hazard Ratio (Random, 95% CI) | 3.30 [2.32, 4.67] |
| 2.3 Latin America | 1 | 94 | Hazard Ratio (Random, 95% CI) | 2.06 [1.76, 2.41] |
| 3 T2DM incidence (IGT) Show forest plot | 5 | 16576 | Hazard Ratio (Random, 95% CI) | 3.61 [2.31, 5.64] |
| 3.1 Asia/Middle East | 3 | 8475 | Hazard Ratio (Random, 95% CI) | 4.48 [2.81, 7.15] |
| 3.2 Australia/Europe/North America | 2 | 8101 | Hazard Ratio (Random, 95% CI) | 2.53 [1.52, 4.19] |
| 4 T2DM incidence (IFG + IGT) Show forest plot | 5 | 9757 | Hazard Ratio (Random, 95% CI) | 6.90 [4.15, 11.45] |
| 4.1 Asia/Middle East | 3 | 7156 | Hazard Ratio (Random, 95% CI) | 10.20 [5.45, 19.09] |
| 4.2 Australia/Europe/North America | 1 | 1650 | Hazard Ratio (Random, 95% CI) | 3.80 [2.30, 6.28] |
| 4.3 American Indians/Islands | 1 | 951 | Hazard Ratio (Random, 95% CI) | 4.06 [3.05, 5.40] |
| 5 T2DM incidence (HbA1c5.7) Show forest plot | 4 | 25047 | Hazard Ratio (Random, 95% CI) | 5.55 [2.77, 11.12] |
| 5.1 Asia | 3 | 16805 | Hazard Ratio (Random, 95% CI) | 7.21 [5.14, 10.11] |
| 5.2 Australia/Europe/North America | 1 | 8242 | Hazard Ratio (Random, 95% CI) | 2.71 [2.48, 2.96] |
| 6 T2DM incidence (HbA1c6.0) Show forest plot | 6 | 30699 | Hazard Ratio (Random, 95% CI) | 10.10 [3.59, 28.43] |
| 6.1 Asia/Middle East | 4 | 22734 | Hazard Ratio (Random, 95% CI) | 13.12 [4.10, 41.96] |
| 6.2 Australia/Europe/North America | 2 | 7965 | Hazard Ratio (Random, 95% CI) | 5.09 [1.69, 15.37] |
| 7 T2DM incidence (HbA1c + IFG) Show forest plot | 1 | Hazard Ratio (Fixed, 95% CI) | Subtotals only | |
| 7.1 HbA1c5.7 + IFG5.6 | 1 | 4559 | Hazard Ratio (Fixed, 95% CI) | 32.50 [23.00, 45.92] |
| 7.2 HbA1c5.7 + IFG6.1 | 1 | 5357 | Hazard Ratio (Fixed, 95% CI) | 37.90 [28.10, 51.12] |
| 7.3 HbA1c6.0 + IFG5.6 | 1 | 4628 | Hazard Ratio (Fixed, 95% CI) | 53.70 [38.40, 75.09] |
| 7.4 HbA1c6.0 + IFG6.1 | 1 | 5802 | Hazard Ratio (Fixed, 95% CI) | 52.30 [37.80, 72.37] |
| Outcome or subgroup title | No. of studies | No. of participants | Statistical method | Effect size |
| 1 T2DM incidence (IFG5.6) Show forest plot | 21 | 47647 | Odds Ratio (Random, 95% CI) | 4.15 [2.75, 6.28] |
| 1.1 Asia/Middle East | 10 | 34577 | Odds Ratio (Random, 95% CI) | 2.94 [1.77, 4.86] |
| 1.2 Australia/Europe/North America | 9 | 9869 | Odds Ratio (Random, 95% CI) | 6.47 [3.81, 11.00] |
| 1.3 Latin America | 1 | 1659 | Odds Ratio (Random, 95% CI) | 4.28 [3.21, 5.71] |
| 1.4 American Indians/Islands | 1 | 1542 | Odds Ratio (Random, 95% CI) | 3.12 [2.31, 4.21] |
| 2 T2DM incidence (IFG6.1) Show forest plot | 15 | 36866 | Odds Ratio (Random, 95% CI) | 6.60 [4.18, 10.43] |
| 2.1 Asia/Middle East | 7 | 28921 | Odds Ratio (Random, 95% CI) | 5.18 [2.32, 11.53] |
| 2.2 Australia/Europe/North America | 7 | 6334 | Odds Ratio (Random, 95% CI) | 8.69 [4.95, 15.24] |
| 2.3 Latin America | 1 | 1611 | Odds Ratio (Random, 95% CI) | 3.73 [2.18, 6.38] |
| 3 T2DM incidence (IGT) Show forest plot | 20 | 21552 | Odds Ratio (Random, 95% CI) | 4.61 [3.76, 5.64] |
| 3.1 Asia/Middle East | 6 | 8643 | Odds Ratio (Random, 95% CI) | 3.74 [2.83, 4.94] |
| 3.2 Australia/Europe/North America | 11 | 9165 | Odds Ratio (Random, 95% CI) | 5.20 [3.62, 7.45] |
| 3.3 Latin America | 2 | 3478 | Odds Ratio (Random, 95% CI) | 4.94 [3.15, 7.76] |
| 3.4 American Indians/Islands | 1 | 266 | Odds Ratio (Random, 95% CI) | 3.60 [1.40, 9.26] |
| 4 T2DM incidence (IFG + IGT) Show forest plot | 9 | 9656 | Odds Ratio (Random, 95% CI) | 13.14 [7.41, 23.30] |
| 4.1 Asia/Middle East | 3 | 4202 | Odds Ratio (Random, 95% CI) | 6.99 [3.09, 15.83] |
| 4.2 Australia/Europe/North America | 6 | 5454 | Odds Ratio (Random, 95% CI) | 20.95 [12.40, 35.40] |
| 5 T2DM incidence (HbA1c5.7) Show forest plot | 3 | 3468 | Odds Ratio (Random, 95% CI) | 4.43 [2.20, 8.88] |
| 5.1 Asia/Middle East | 1 | 1137 | Odds Ratio (Random, 95% CI) | 4.54 [2.65, 7.78] |
| 5.2 Europe/North America | 2 | 2331 | Odds Ratio (Random, 95% CI) | 4.38 [1.36, 14.15] |
| 6 T2DM incidence (HbA1c6.0) Show forest plot | 3 | 18317 | Odds Ratio (Random, 95% CI) | 12.79 [4.56, 35.85] |
| 6.1 Asia/Middle East | 1 | 11866 | Odds Ratio (Random, 95% CI) | 23.20 [18.70, 28.78] |
| 6.2 Australia/Europe/North America | 1 | 5735 | Odds Ratio (Random, 95% CI) | 15.60 [6.90, 35.27] |
| 6.3 American Indians/Islands | 1 | 716 | Odds Ratio (Random, 95% CI) | 5.89 [4.23, 8.20] |
| 7 T2DM incidence (HbA1c5.7 + IFG5.6) Show forest plot | 2 | 14006 | Odds Ratio (Random, 95% CI) | 35.91 [20.43, 63.12] |
| 7.1 Australia/Europe/North America | 1 | 1294 | Odds Ratio (Random, 95% CI) | 26.20 [16.30, 42.11] |
| 7.2 Asia/Middle East | 1 | 12712 | Odds Ratio (Random, 95% CI) | 46.70 [33.60, 64.91] |