Development of type 2 diabetes mellitus in people with intermediate hyperglycaemia
Información
- DOI:
- https://doi.org/10.1002/14651858.CD012661.pub2Copiar DOI

- Base de datos:
-
- Cochrane Database of Systematic Reviews
- Versión publicada:
-
- 29 octubre 2018see what's new
- Tipo:
-
- Prognosis
- Etapa:
-
- Review
- Grupo Editorial Cochrane:
-
Grupo Cochrane de Trastornos metabólicos y endocrinos
- Copyright:
-
- Copyright © 2018 The Cochrane Collaboration. Published by John Wiley & Sons, Ltd.
Cifras del artículo
Altmetric:
Citado por:
Autores
Contributions of authors
All review authors read and approved the final review draft.
Bernd Richter (BR): protocol and review draft, search strategy development, acquisition of trial reports, trial selection, data extraction of all trials, data analysis, data interpretation and writing of drafts.
Maria‐Inti Metzendorf (MIM): search strategy development, trial selection, check of data extraction, review of drafts.
Bianca Hemmingsen (BH): protocol and review draft, trial selection, data interpretation and review of drafts.
Yemisi Takwoingi (YT): protocol and review draft, data analysis, data interpretation and review of drafts
Sources of support
Internal sources
-
No sources of support supplied
External sources
-
World Health Organization, Other.
This review is part of a series of reviews on predictors for the development of type 2 diabetes mellitus in people with intermediate hyperglycaemia and interventions for the prevention or delay of type 2 diabetes mellitus and its associated complications in persons at increased risk for the development of type 2 diabetes mellitus which is funded by the WHO
(Hemmingsen 2016a; Hemmingsen 2016b; Hemmingsen 2016c)
Declarations of interest
BR: the World Health Organization (WHO) funded this review.
MIM: none known.
BH: none known.
YT: none known.
Acknowledgements
The World Health Organization (WHO) funded this review.
We thank Megan Harris for the excellent copy‐editing of our review. We thank Nuala Livingstone, Kerry Dwan, Toby Lasserson, Alex Sutton and especially Carl Moons for their distinguished peer‐reviewing which definitely raised the quality of our review.
Version history
| Published | Title | Stage | Authors | Version |
| 2018 Oct 29 | Development of type 2 diabetes mellitus in people with intermediate hyperglycaemia | Review | Bernd Richter, Bianca Hemmingsen, Maria‐Inti Metzendorf, Yemisi Takwoingi | |
| 2017 May 12 | Intermediate hyperglycaemia as a predictor for the development of type 2 diabetes: prognostic factor exemplar review | Protocol | Bernd Richter, Bianca Hemmingsen, Maria‐Inti Metzendorf, Yemisi Takwoingi | |
Differences between protocol and review
We changed the title of the protocol from 'Intermediate hyperglycaemia as a predictor for the development of type 2 diabetes: prognostic factor exemplar review' to 'Development of type 2 diabetes mellitus in people with intermediate hyperglycaemia' to fit the objectives of the review. We also modified the objectives from "to assess whether intermediate hyperglycaemia is a predictor for the development of type 2 diabetes mellitus (T2DM)" to objective 1 "to assess the overall prognosis of people with IH for the development of T2DM and to assess how many people with IH revert back to normoglycaemia (regression), and objective 2 "to assess the difference in T2DM incidence in people with IH versus people with normoglycaemia". Both changes reflect the fact that our review addresses two prognostic questions at the same time. First, if people have intermediate hyperglycaemia at baseline, how many individuals develop type 2 diabetes in the future? This research question investigates the cumulative incidence of type 2 diabetes over time and does not depend on a comparison with a group with normoglycaemia at baseline; it is also important to note how many people change back from intermediate hyperglycaemia to normoglycaemia. The second prognostic question is, how does glycaemic status (intermediate hyperglycaemia compared with normoglycaemia) at baseline affect the development of type 2 diabetes? In particular, we were interested in intermediate hyperglycaemia, defined using impaired fasting glucose, impaired glucose tolerance and elevated glycosylated haemoglobin A1c and combinations thereof.
We specified inclusion criteria in more detail to explain the difference between studies evaluating the overall prognosis of people with intermediate hyperglycaemia and studies evaluating intermediate hyperglycaemia versus normoglycaemia as a prognostic factor developing type 2 diabetes mellitus.
Regarding methods, we explained our exclusion criteria in more detail and deleted 'conference abstract' as an exclusion criterion (we moved one formerly excluded study, Misnikova 2011, to 'Studies awaiting classification').
Keywords
MeSH
Medical Subject Headings (MeSH) Keywords
Medical Subject Headings Check Words
Humans;
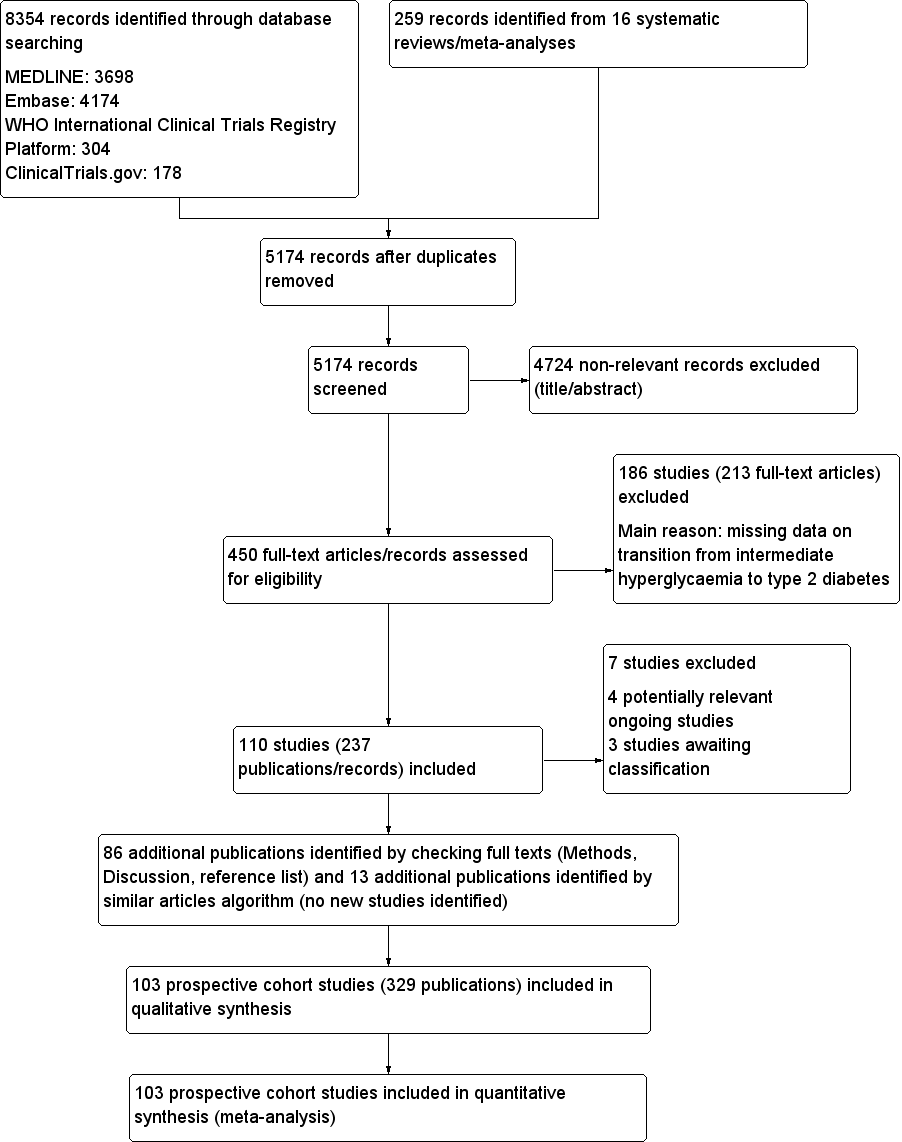
Study flow diagram

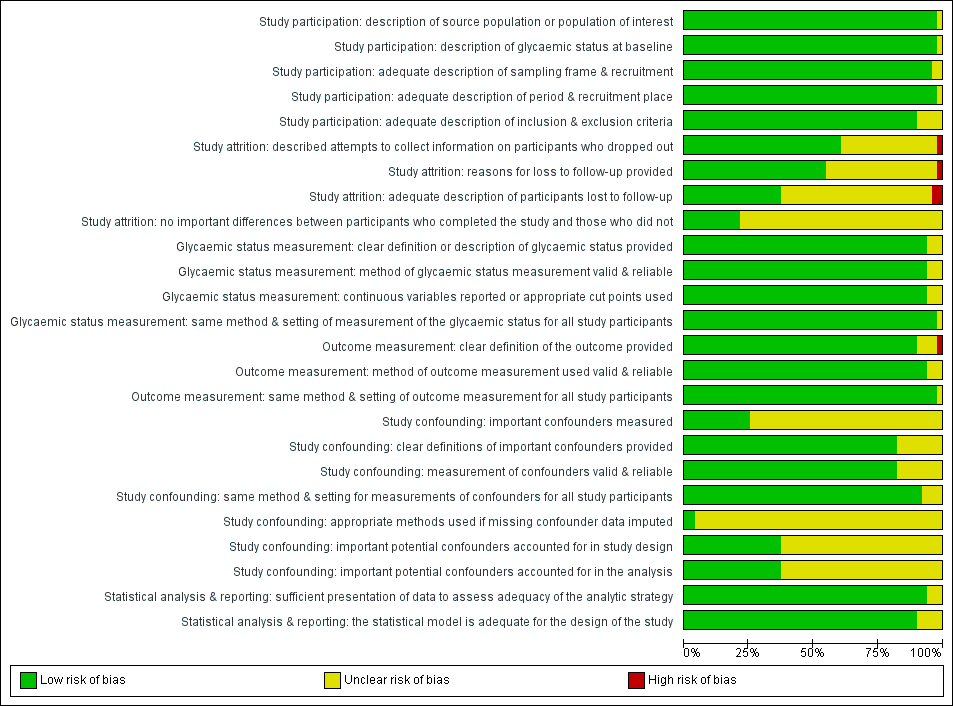
Risk of bias graph for studies of overall prognosis of people with intermediate hyperglycaemia for developing type 2 diabetes: review authors' judgements about each risk of bias item presented as percentages across all included studies
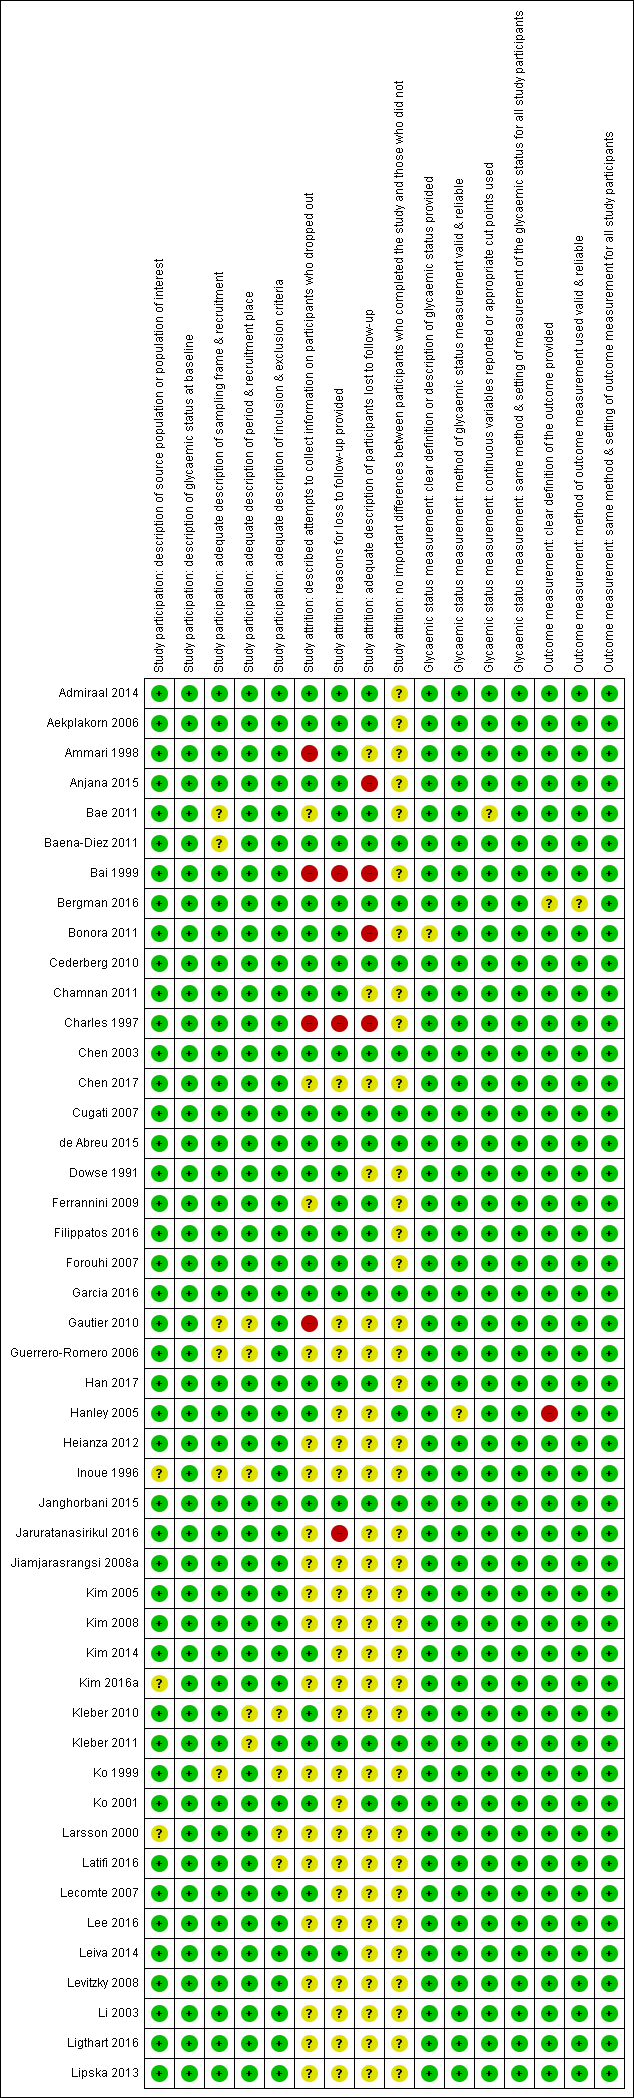
'Risk of bias' summary for studies of overall prognosis in people with intermediate hyperglycaemia for developing type 2 diabetes: review authors' judgements about each risk of bias item for each included study (part 1). The summary was split into part 1 (Figure 3) and part 2 (Figure 4) for better legibility

Risk of bias summary for studies of overall prognosis of people with intermediate hyperglycaemia for developing type 2 diabetes: review authors' judgements about each risk of bias item for each included study (part 2)
Risk of bias graph for studies of intermediate hyperglycaemia versus normoglycaemia as a prognostic factor for developing type 2 diabetes: review authors' judgements about each risk of bias item presented as percentages across all included studies

Risk of bias summary for studies of intermediate hyperglycaemia versus normoglycaemia as a prognostic factor for developing type 2 diabetes: review authors' judgements about each risk of bias item for each included study

Impaired fasting glucose 5.6 mmol/L (IFG5.6) threshold: association with cumulative type 2 diabetes mellitus (T2DM) incidence over 2–5 years
*Isolated IFG5.6
CI: confidence interval; M: men; n/N: events/number of participants; W: women
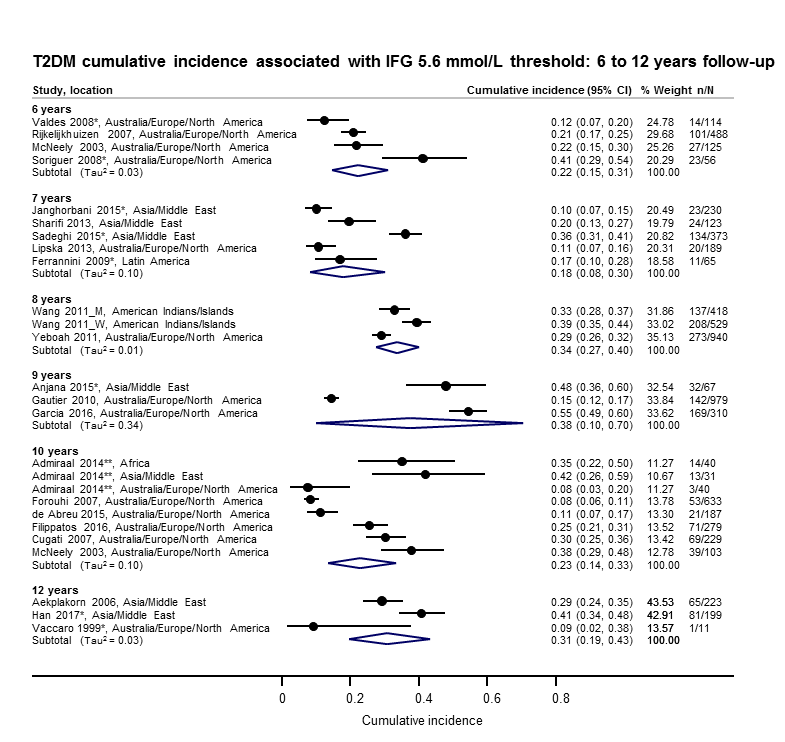
Impaired fasting glucose 5.6 mmol/L (IFG5.6) threshold: association with cumulative type 2 diabetes mellitus (T2DM) incidence over 6–12 years
*Isolated IFG5.6
**'Africa': African Surinamese cohort, 'Asia': Asian Surinamese cohort, 'Australia/Europe/North America': 'ethnic Dutch' cohort.
CI: confidence interval; M: men; n/N: events/number of participants; W: women
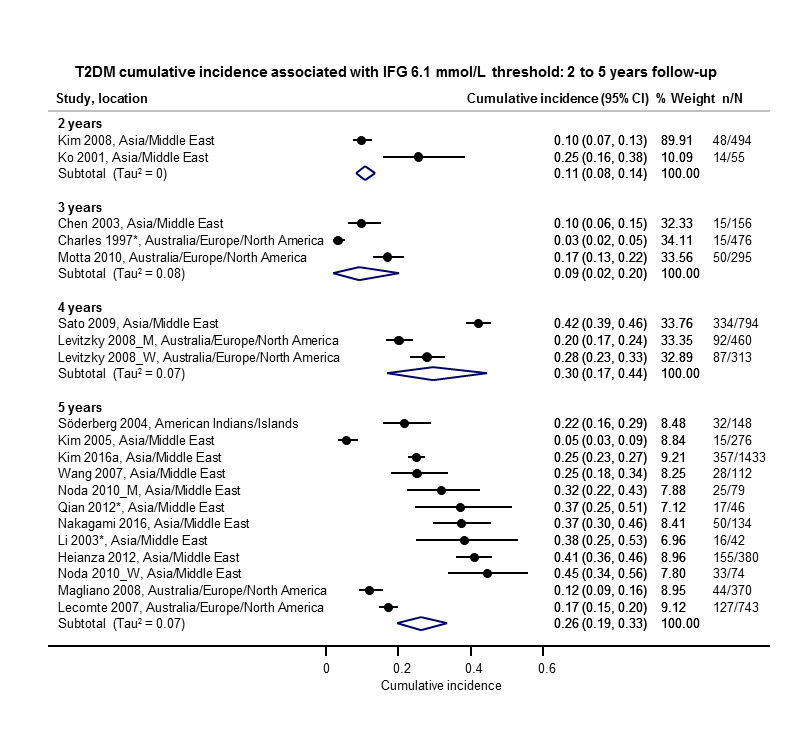
Impaired fasting glucose 6.1 mmol/L (IFG6.1) threshold: association with cumulative type 2 diabetes mellitus (T2DM) incidence over 2–5 years
*Isolated IFG6.1
CI: confidence interval; M: men; n/N: events/number of participants; W: women
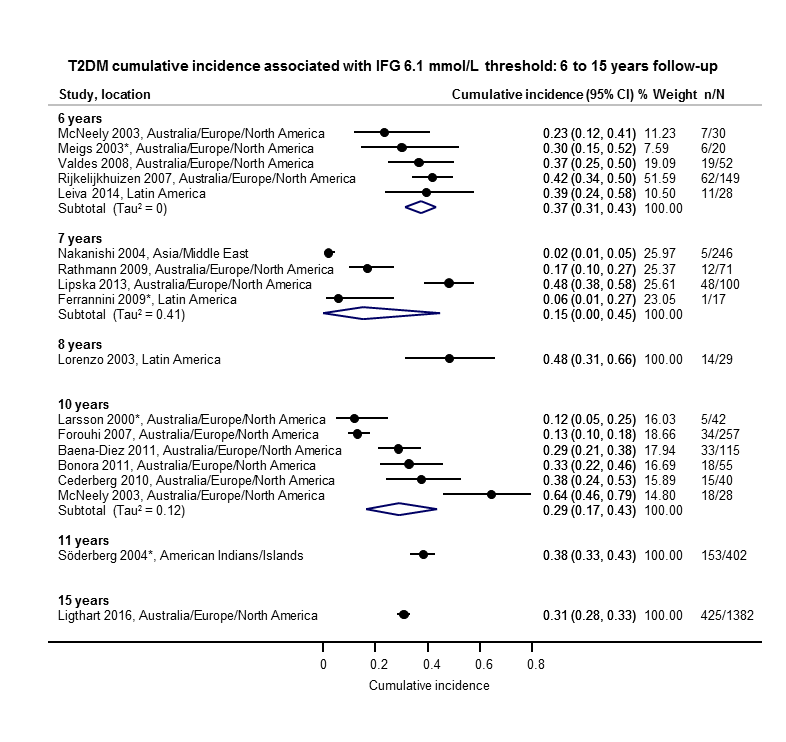
Impaired fasting glucose 6.1 mmol/L (IFG6.1) threshold: association with cumulative type 2 diabetes mellitus (T2DM) incidence over 6–15 years
*Isolated IFG6.1
CI: confidence interval; n/N: events/number of participants

Impaired glucose tolerance (IGT): association with cumulative type 2 diabetes mellitus (T2DM) incidence over 1–5 years
*Isolated IGT
CI: confidence interval; n/N: events/number of participants
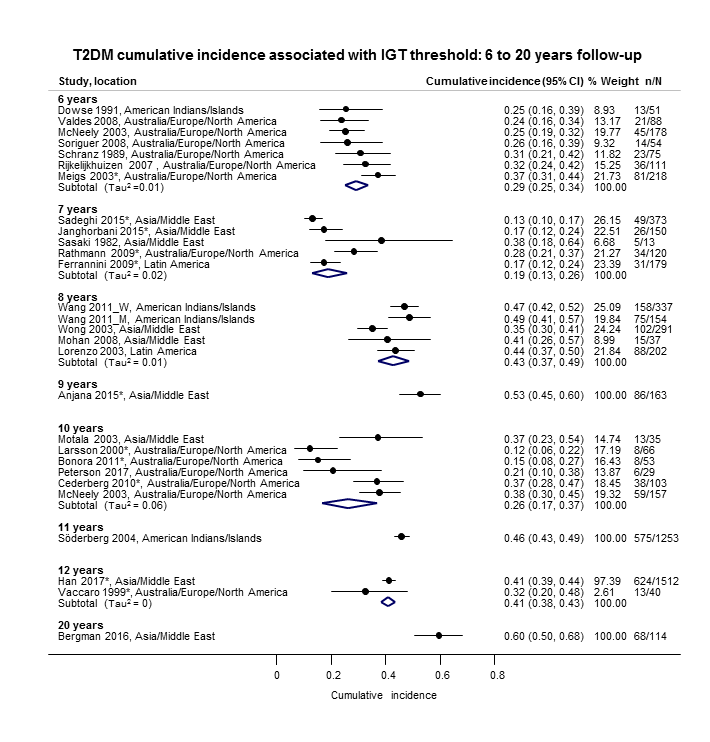
Impaired glucose tolerance (IGT): association with cumulative type 2 diabetes mellitus (T2DM) incidence over 6–20 years
*Isolated IGT
CI: confidence interval; M: men; n/N: events/number of participants; W: women

Combined impaired glucose tolerance (IGT) and impaired fasting glucose (IFG): association with cumulative type 2 diabetes mellitus (T2DM) incidence over 1–12 years
CI: confidence interval; M: men; n/N: events/number of participants; W: women
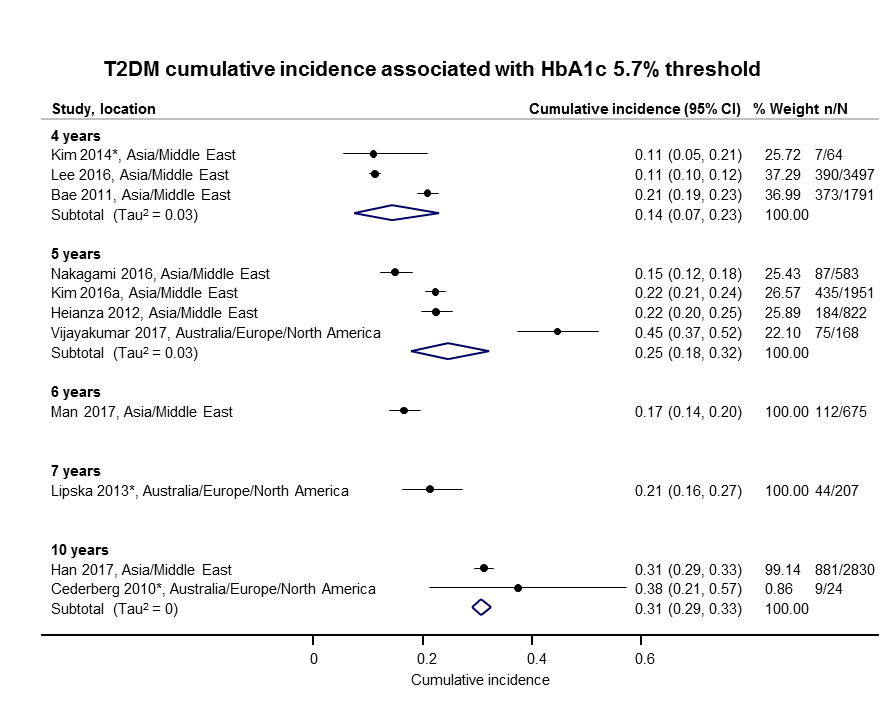
Elevated glycosylated haemoglobin A1c (HbA1c) 5.7% threshold: association with cumulative type 2 diabetes mellitus (T2DM) incidence over 4–10 years
CI: confidence interval; n/N: events/number of participants

Elevated glycosylated haemoglobin A1c (HbA1c) 6.0% threshold: association with cumulative type 2 diabetes mellitus (T2DM) incidence over 3–15 years
CI: confidence interval; n/N: events/number of participants

Cumulative type 2 diabetes mellitus (T2DM) incidence in children/adolescents over 1–10 years
CI: confidence interval; HbA1c 5.7: glycosylated haemoglobin A1c 5.7% threshold; (i‐)IGT: (isolated) impaired glucose tolerance; n/N: events/number of participants; NO: non‐overweight; OV: overweight

Regression from intermediate hyperglycaemia to normoglycaemia in adults over 1–5 years
CI: confidence interval; HbA1c5.7 : glycosylated haemoglobin A1c 5.7%; i‐IFG5.6/6.1 : (isolated) impaired fasting glucose 5.6/6.1 mmol/L threshold;IGT: impaired glucose tolerance; n/N: events/number of participants

Regression from intermediate hyperglycaemia to normoglycaemia in adults over 6–11 years
CI: confidence interval; i‐IFG5.6/6.1 : (isolated) impaired fasting glucose 5.6/6.1 mmol/L threshold; i‐IGT: (isolated) impaired glucose tolerance; n/N: events/number of participants
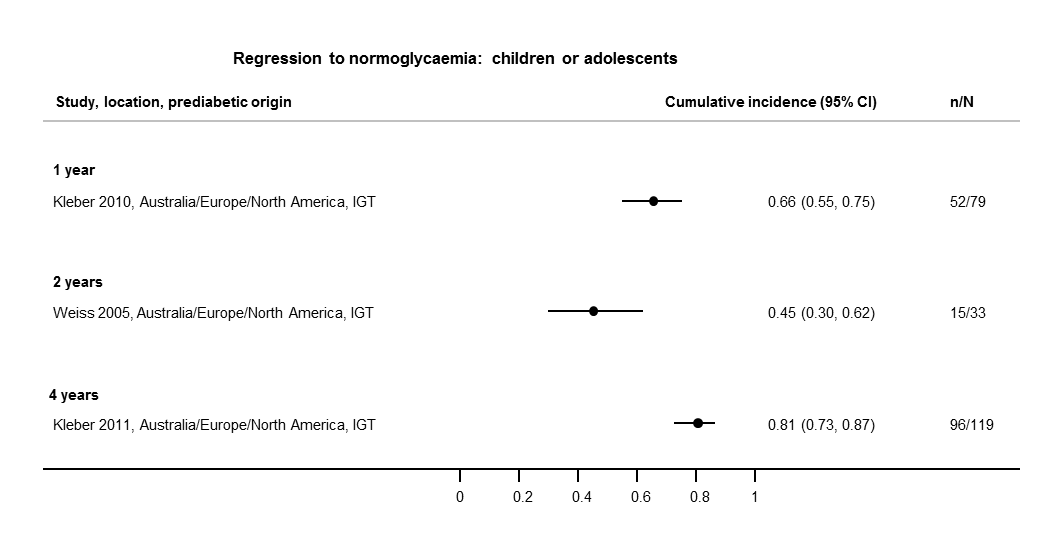
Regression from intermediate hyperglycaemia to normoglycaemia in children/adolescents over 1–4 years
CI: confidence interval; IGT: impaired glucose tolerance; n/N: events/number of participants
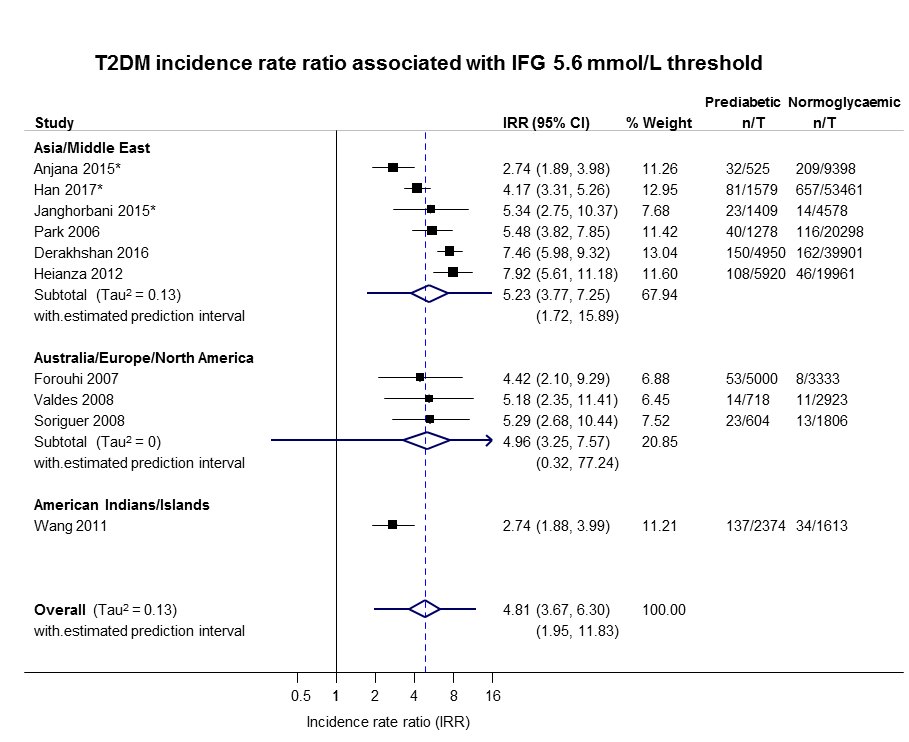
IFG: impaired fasting glucose; IRR: incidence rate ratio; n: number of cases; T: person‐time in years

IFG: impaired fasting glucose; IRR: incidence rate ratio; n: number of cases; T: person‐time in years

IGT: impaired glucose tolerance; IRR: incidence rate ratio; n: number of cases; T: person‐time in years

IFG: impaired fasting glucose; IGT: impaired glucose tolerance; IRR: incidence rate ratio; n: number of cases; T: person‐time in years
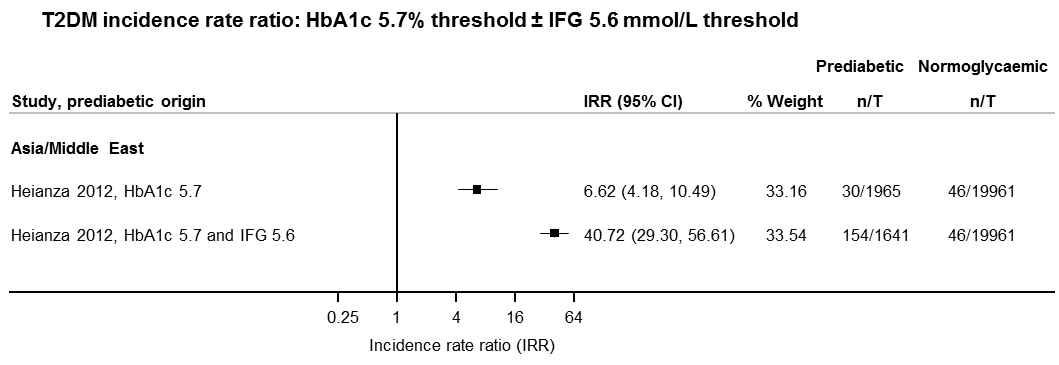
IFG: impaired fasting glucose; HbA1c: glycosylated haemoglobin A1c; IRR: incidence rate ratio; n: number of cases; T: person‐time in years
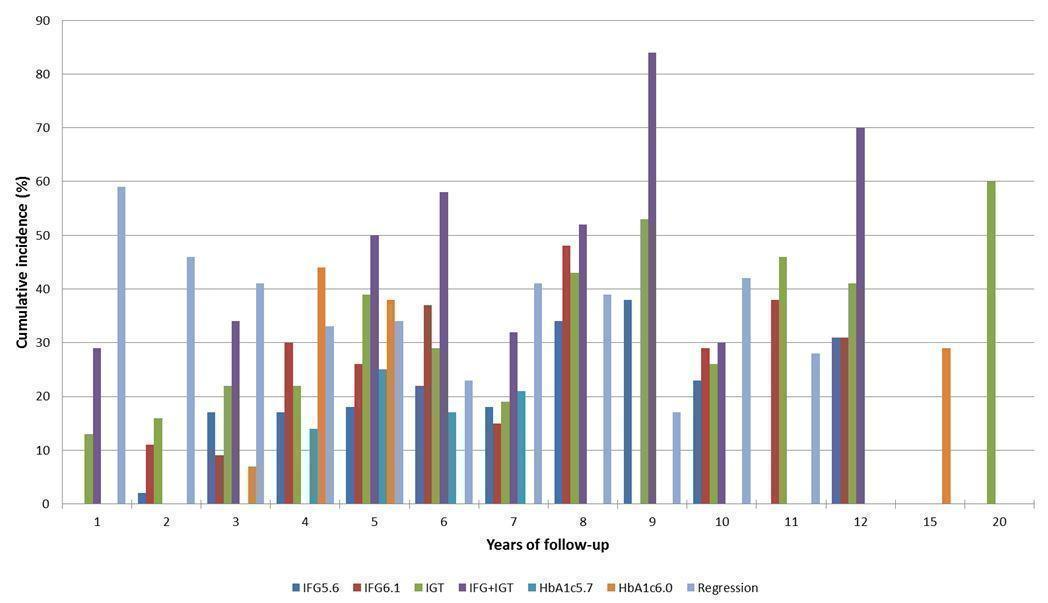
Overall prognosis of people with intermediate hyperglycaemia (cumulative type 2 diabetes incidence and regression to normoglycaemia) associated with measures of intermediate hyperglycaemia
HbA1c5.7/HbA1c6.0: glycosylated haemoglobin A1c 5.7%/6.0% threshold; IFG5.6/6.1: impaired fasting glucose 5.6/6.1 mmol/L threshold; IGT: impaired glucose tolerance

Intermediate hyperglycaemia versus normoglycaemia as a prognostic factor for developing type 2 diabetes (associated with different measures and relative risks of intermediate hyperglycaemia)
HbA1c5.7/HbA1c6.0: glycosylated haemoglobin A1c 5.7%/6.0% threshold; IFG5.6/6.1: impaired fasting glucose 5.6/6.1 mmol/L threshold; IGT: impaired glucose tolerance; IRR: incidence rate ratio; OR: odds ratio; HR: hazard ratio
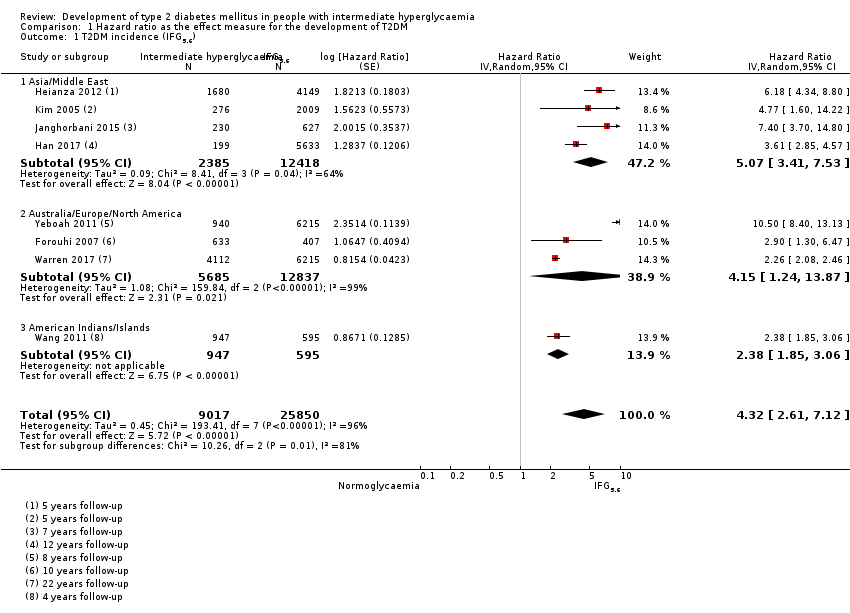
Comparison 1 Hazard ratio as the effect measure for the development of T2DM, Outcome 1 T2DM incidence (IFG5.6).

Comparison 1 Hazard ratio as the effect measure for the development of T2DM, Outcome 2 T2DM incidence (IFG6.1).

Comparison 1 Hazard ratio as the effect measure for the development of T2DM, Outcome 3 T2DM incidence (IGT).

Comparison 1 Hazard ratio as the effect measure for the development of T2DM, Outcome 4 T2DM incidence (IFG + IGT).

Comparison 1 Hazard ratio as the effect measure for the development of T2DM, Outcome 5 T2DM incidence (HbA1c5.7).
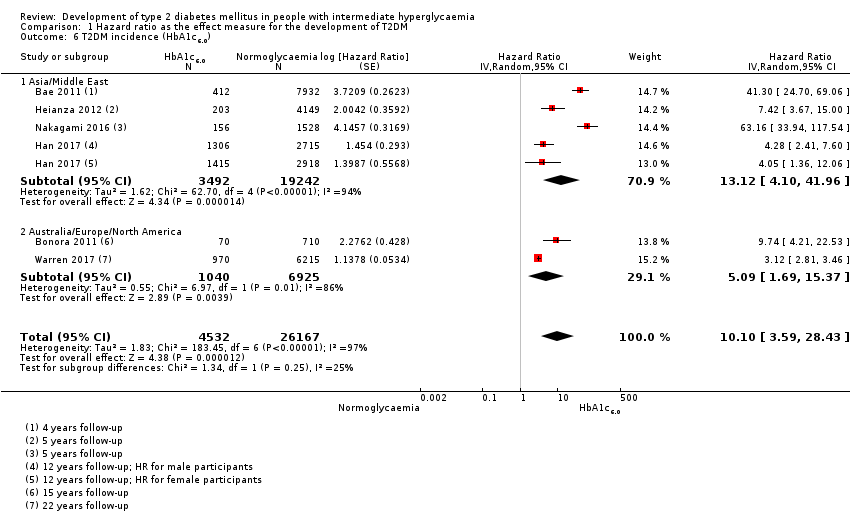
Comparison 1 Hazard ratio as the effect measure for the development of T2DM, Outcome 6 T2DM incidence (HbA1c6.0).
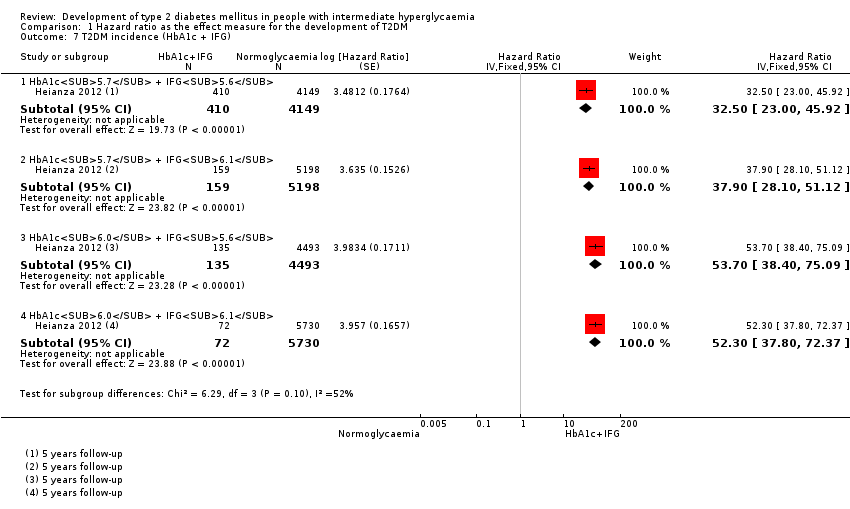
Comparison 1 Hazard ratio as the effect measure for the development of T2DM, Outcome 7 T2DM incidence (HbA1c + IFG).

Comparison 2 Odds ratio as the effect measure for the development of T2DM, Outcome 1 T2DM incidence (IFG5.6).

Comparison 2 Odds ratio as the effect measure for the development of T2DM, Outcome 2 T2DM incidence (IFG6.1).

Comparison 2 Odds ratio as the effect measure for the development of T2DM, Outcome 3 T2DM incidence (IGT).

Comparison 2 Odds ratio as the effect measure for the development of T2DM, Outcome 4 T2DM incidence (IFG + IGT).
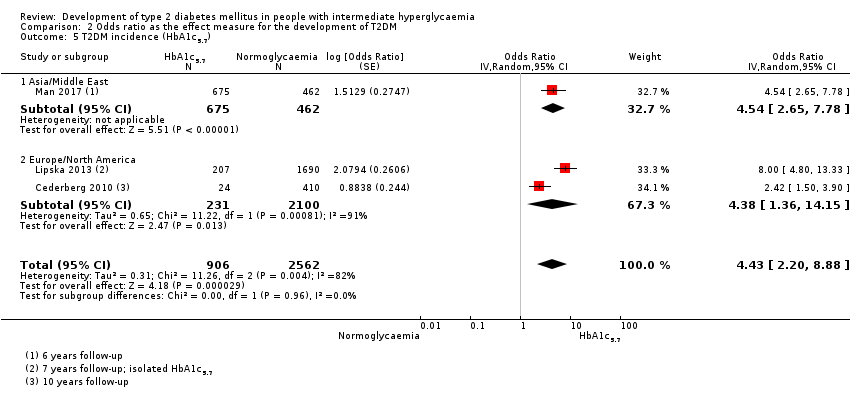
Comparison 2 Odds ratio as the effect measure for the development of T2DM, Outcome 5 T2DM incidence (HbA1c5.7).
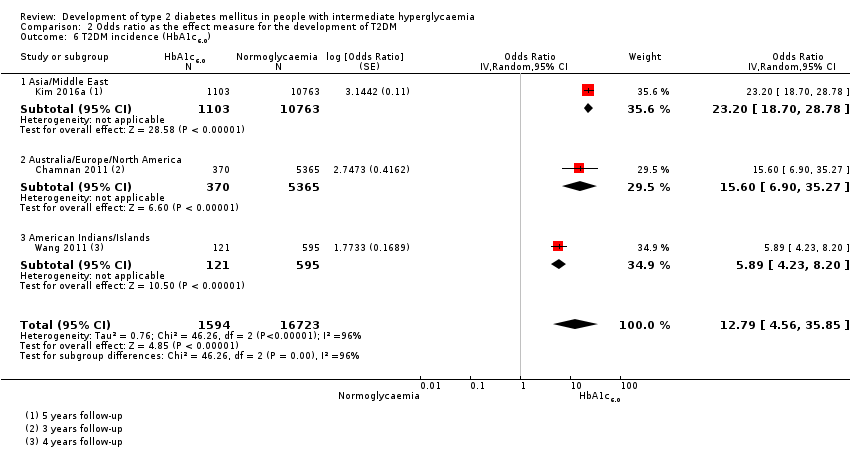
Comparison 2 Odds ratio as the effect measure for the development of T2DM, Outcome 6 T2DM incidence (HbA1c6.0).
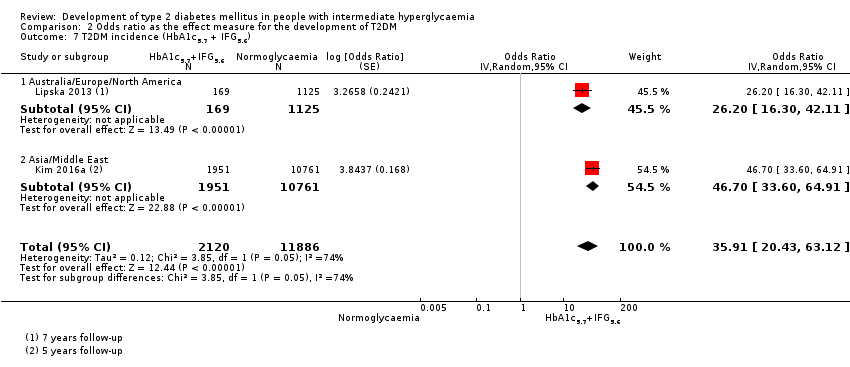
Comparison 2 Odds ratio as the effect measure for the development of T2DM, Outcome 7 T2DM incidence (HbA1c5.7 + IFG5.6).
| Outcome: development of T2DM | ||||||||
| Follow‐up | Cumulative T2DM incidence % (95% CI) | Regression from intermediate hyperglycaemia to normoglycaemia % (95% CI) | Overall certainty of the evidence (GRADE)a | |||||
| IFG5.6 | IFG6.1 | IGT | IFG + IGT | HbA1c5.7 | HbA1c6.0 | |||
| 1 | — | — | 13 (5–23) [3; 671] | 29 (23–36) [1; 207] | — | — | 59 (54–64) [2; 375] | ⊕⊕⊕⊝ |
| 2 | 2 (1–2) [1; 1335] | 11 (8–14) [2; 549] | 16 (9–26) [9; 1998] | — | — | — | 46 (36–55) [9; 2852] | |
| 3 | 17 (6–32) [3; 1091] | 9 (2–20) [3; 927] | 22 (18–27) [3; 417] | 34 (28–41) [1; 209]— | — | 7 (5–10) [1; 370] | 41 (24–69) [7; 1356] | |
| 4 | 17 (13–22) [3; 800] | 30 (17–44) [2; 1567] | 22 (12–34) [5; 1042] | — | 14 (7–23) [3; 5352] | 44 (40–48) [2; 627] | 33 (26–40) [3; 807] | |
| 5 | 18 (10–27) [7; 3530] | 26 (19–33) [11; 3837] | 39 (25–53) [12; 3444] | 50 (37–63) [5; 478] | 25 (18–32) [4; 3524] | 38 (26–51) [3; 1462] | 34 (27–42) [9; 2603] | |
| 6 | 22 (15–31) [4; 738] | 37 (31–43) [5; 279] | 29 (25–34) [7; 775] | 58 (48–67) [4; 106] | 17 (14–20) [1; 675] | — | 23 (3–53) [5; 1328] | |
| 7 | 18 (8–30) [5; 980] | 15 (0–45) [4; 434] | 19 (13–26) [5; 835] | 32 (20–45) [4; 753] | 21 (16–27) [1; 207] | — | 41 (37–45) [4; 679] | |
| 8 | 34 (27–40) [2; 1887] | 48 (31–66) [1;29] | 43 (37–49) [4; 1021] | 52 (47–57) [1; 356] | — | — | 39 (33–44) [2; 328] | |
| 9 | 38 (10–70) [3; 1356] | — | 53 (45–60) [1; 163] | 84 (74–91) [1; 69] | — | — | 17 (14–22) [1; 299] | |
| 10 | 23 (14–33) [6; 1542] | 29 (17–43) [6; 537] | 26 (17–37) [6; 443] | 30 (17–44) [2; 49] | 31 (29–33) [2; 2854] | — | 42 (22–63) [7; 894] | |
| 11 | — | 38 (33–43) [1; 402] | 46 (43–49) [1; 1253] | — | — | — | 28 (17–39) [2; 736] | |
| 12 | 31 (19–34) [3; 433] | 31 (28–33) [1; 1382] | 41 (38–43) [2; 1552] | 70 (63–76) [2; 207] | — | — | — | |
| 15 | — | — | — | — | — | 29 (19–40) [1; 70] | — | |
| 20 | — | — | 60 (5–68) [1; 114] | — | — | — | — | |
| CI: confidence interval; HbA1c5.7 : glycosylated haemoglobin A1c, 5.7% threshold; HbA1c6.0 : glycosylated haemoglobin A1c, 6.0% threshold; IFG5.6 : impaired fasting glucose, 5.6 mmol/L threshold; IFG6.1 : impaired fasting glucose, 6.1 mmol/L threshold; IGT: impaired glucose tolerance; T2DM: type 2 diabetes mellitus. | ||||||||
| GRADE Working Group grades of evidence | ||||||||
| aWith phase 2 explanatory studies aiming to confirm independent associations between the prognostic factor and the outcome, GRADE starts with 'high quality' (Huguet 2013). We assumed the GRADE factor publication bias was inherent with this type of research (phase 2 design), so we did not use it as a potential downgrading factor | ||||||||
| Outcome: development of T2DM | ||||
| No of studies | No of participants with intermediate hyperglycaemia | Geographic region/special population | Estimated effect (95% CI) | Overall certainty of the evidence (GRADE)a |
| HR: 4 IRR: 6 OR: 10 | HR: 2385 IRR: 15,661 OR: 6359 | Asia/Middle East | HR: 5.07 (3.41–4.86) [1.07–24.02] IRR: 5.23 (3.77–7.25) [1.72–15.89] OR: 2.94 (1.77–4.86) [0.43–19.93] | ⊕⊕⊝⊝ |
| HR: 3 IRR: 3 OR: 9 | HR: 5685 IRR: 6322 OR: 1949 | Australia/Europe/North America | HR: 4.15 (1.24–13.9) [N/M] IRR: 4.96 (3.25–7.57) [0.32–77.24] OR: 6.47 (3.81–11.00) [0.99–42.32] | |
| HR: 0 IRR: 0 OR: 1 | HR: 0 IRR: 0 OR: 65 | Latin America | HR: NA IRR: NA OR: 4.28 (3.21–5.71) | |
| HR: 1 IRR: 1 OR: 1 | HR: 947 IRR: 2374 OR: 947 | American Indians/Islands | HR: 2.38 (1.85–3.06) IRR: 2.74 (1.88–3.99) OR: 3.12 (2.31–4.21) | |
| HR: 8 IRR: 10 OR: 21 | HR: 9017 IRR: 24,357 OR: 9320 | Overall | HR: 4.32 (2.61–7.12) [0.75–25.0] IRR: 4.81 (3.67–6.30) [1.95–11.83] OR: 4.15 (2.75–6.28) [0.53–32.4] | |
| CI: confidence interval; HR: hazard ratio;IFG5.6 : impaired fasting glucose 5.6 mmol/L threshold; IRR: incidence rate ratio; NA: not applicable; N/M: fewer than 3 studies or calculation of the 95% prediction interval did not provide a meaningful estimate; OR: odds ratio; T2DM: type 2 diabetes mellitus. | ||||
| GRADE Working Group grades of evidence | ||||
| aWith phase 2 explanatory studies aiming to confirm independent associations between the prognostic factor and the outcome, GRADE starts with 'high quality' (Huguet 2013). We assumed the GRADE factor publication bias was inherent with this type of research (phase 2 design), so we did not use it as a potential downgrading factor | ||||
| Outcome: development of T2DM | ||||
| No of studies | No of participants with intermediate hyperglycaemia | Geographic region/special population | Estimated effect (95% CI) | Overall certainty of |
| HR: 5 IRR: 2 OR: 7 | HR: 1054 IRR: 1677 OR: 3317 | Asia/Middle East | HR: 10.55 (3.61–30.81) [N/M] IRR: 3.62 (1.67–7.83) [N/M] OR: 5.18 (2.32–11.53) [0.29–91.37] | ⊕⊕⊝⊝ |
| HR: 4 IRR: 4 OR: 7 | HR: 1736 IRR: 3438 OR: 1240 | Australia/Europe/North America | HR: 3.30 (2.32–4.67) [0.84–12.99] IRR: 8.55 (6.37–11.48) [4.37–16.73] OR: 8.69 (4.95–15.24) [1.20–62.69] | |
| HR: 0 IRR: 0 OR: 1 | HR: 0 IRR: 0 OR: 17 | Latin America | HR: NA IRR: NA OR: 3.73 (2.18–6.38) | |
| HR: 0 IRR: 0 OR: 0 | HR: 0 IRR: 0 OR: 0 | American Indians/Islands | HR: NA IRR: NA OR: NA | |
| HR: 9 IRR: 6 OR: 15 | HR: 2818 IRR: 5115 OR: 4574 | Overall | HR: 5.47 (3.50–8.54) [1.09–27.56] IRR: 6.82 (4.53–10.25) [2.03–22.87] OR: 6.60 (4.18–10.43) [0.93–46.82] | |
| CI: confidence interval; HR: hazard ratio;IFG6.1 : impaired fasting glucose 6.1 mmol/L threshold; IRR: incidence rate ratio; NA: not applicable; N/M: fewer than 3 studies or calculation of the 95% prediction interval did not provide a meaningful estimate; OR: odds ratio; T2DM: type 2 diabetes mellitus. | ||||
| GRADE Working Group grades of evidence | ||||
| aWith phase 2 explanatory studies aiming to confirm independent associations between the prognostic factor and the outcome, GRADE starts with 'high quality' (Huguet 2013). We assumed the GRADE factor publication bias was inherent with this type of research (phase 2 design), so we did not use it as a potential downgrading factor | ||||
| Outcome: development of T2DM | ||||
| No of studies | No of participants with intermediate hyperglycaemia | Geographic region/special population | Estimated effect (95% CI) | Overall certainty of the evidence (GRADE)a |
| HR: 3 IRR: 5 OR: 6 | HR: 1780 IRR: 14,809 OR: 1226 | Asia/Middle East | HR: 4.48 (2.81–7.15) [N/M] IRR: 3.93 (3.03–5.10) [1.71–9.02] OR: 3.74 (2.83–4.94) [1.70–8.21] | ⊕⊕⊝⊝ |
| HR: 2 IRR: 5 OR: 11 | HR: 2230 IRR: 2572 OR: 1481 | Australia/Europe/North America | HR: 2.53 (1.52–4.19) [N/M] IRR: 5.93 (4.11–8.57) [2.38–14.81] OR: 5.20 (3.62–7.45) [1.50–18.09] | |
| HR: 0 IRR: 0 OR: 2 | HR: 0 IRR: 0 OR: 381 | Latin America | HR: NA IRR: NA OR: 4.94 (3.15–7.76) [N/M] | |
| IRR: 2 | IRR: 1087 | American Indians/Islands | IRR: 4.46 (3.12–6.38) [N/M] OR: 3.60 (1.40–9.26) HR: NA | |
| HR: 5 IRR: 12 OR: 20 | HR: 4010 IRR: 18,468 OR: 3139 | Overall | HR: 3.61 (2.31–5.64) [0.69–18.97] IRR: 4.48 (3.59–5.44) [2.60–7.70] OR: 4.61 (3.76–5.64) [2.10–10.13] | |
| CI: confidence interval; HR: hazard ratio;IGT: impaired glucose tolerance; IRR: incidence rate ratio; NA: not applicable; N/M: fewer than 3 studies or calculation of the 95% prediction interval did not provide a meaningful estimate; T2DM: type 2 diabetes mellitus. | ||||
| GRADE Working Group grades of evidence | ||||
| aWith phase 2 explanatory studies aiming to confirm independent associations between the prognostic factor and the outcome, GRADE starts with 'high quality' (Huguet 2013). We assumed the GRADE factor publication bias was inherent with this type of research (phase 2 design), so we did not use it as a potential downgrading factor | ||||
| Outcome: development of T2DM | ||||
| No of studies | No of participants with intermediate hyperglycaemia | Geographic region/special population | Estimated effect (95% CI) | Overall certainty of the evidence (GRADE)a |
| HR: 3 IRR: 4 OR: 3 | HR: 461 IRR: 3166 OR: 498 | Asia/Middle East | HR: 10.20 (5.45–19.09) [N/M] IRR: 11.20 (5.59–22.43) [N/M] OR: 6.99 (3.09–15.83) [N/M] | ⊕⊕⊝⊝ |
| HR: 1 IRR: 4 OR: 6 | HR: 221 IRR: 699 OR: 154 | Australia/Europe/North America | HR: 3.80 (2.30–6.28) [N/M] IRR: 13.92 (9.99–19.40) [6.71–28.85] OR: 20.95 (12.40–35.40) [4.93–89.05] | |
| HR: 0 IRR: 0 OR: 0 | HR: 0 IRR: 0 OR: 0 | Latin America | HR: NA IRR: NA OR: NA | |
| HR: 1 IRR: 1 | HR: 356 IRR: 605 | American Indians/Islands | HR: 4.06 (3.05–5.40) IRR: 5.18 (3.42–7.83) | |
| HR: 5 IRR: 9 OR: 9 | HR: 1038 IRR: 4470 OR: 652 | Overall | HR: 6.90 (4.15–11.45) [1.06–44.95] IRR: 10.94 (7.22–16.58) [2.58–46.46] OR: 13.14 (7.41–23.30) [1.84–93.66] | |
| CI: confidence interval; HR: hazard ratio;IFG: impaired fasting glucose; IGT: impaired glucose tolerance; IRR: incidence rate ratio; NA: not applicable; N/M: fewer than 3 studies or calculation of the 95% prediction interval did not provide a meaningful estimate; OR: odds ratio; T2DM: type 2 diabetes mellitus. | ||||
| GRADE Working Group grades of evidence | ||||
| aWith phase 2 explanatory studies aiming to confirm independent associations between the prognostic factor and the outcome, GRADE starts with 'high quality' (Huguet 2013). We assumed the GRADE factor publication bias was inherent with this type of research (phase 2 design), so we did not use it as a potential downgrading factor | ||||
| Outcome: development of T2DM | ||||
| No of studies | No of participants with intermediate hyperglycaemia | Geographic region/special population | Estimated effect (95% CI) | Overall certainty of the evidence (GRADE)a |
| HR: 3 IRR: 1 OR: 1 | HR: 3196 IRR: 1965 OR: 675 | Asia/Middle East | HR: 7.21 (5.14–10.11) [0.81–64.52] IRR: 6.62 (4.18–10.49) [N/M] OR: 4.54 (2.65–7.78) [N/M] | ⊕⊕⊝⊝ |
| HR: 1 IRR: 0 OR: 2 | HR: 2027 IRR: 0 OR: 231 | Australia/Europe/North America | HR: 2.71 (2.48–2.96) [N/M] IRR: NA OR: 4.38 (1.36–14.15) [N/M] | |
| HR: 0 IRR: 0 OR: 0 | HR: 0 IRR: 0 OR: 0 | Latin America | HR: NA IRR: NA OR: NA | |
| HR: 0 IRR: 0 OR: 0 | HR: 0 IRR: 0 OR: 0 | American Indians/Islands | HR: NA IRR: NA OR: NA | |
| HR: 4 IRR: 1 OR: 3 | HR: 5223 IRR: 1965 OR: 906 | Overall | HR: 5.55 (2.77–11.12) [0.23–141.18] IRR: 6.62 (4.18–10.49) [N/M] OR: 4.43 (2.20–8.88) [N/M] | |
| CI: confidence interval; HbA1c5.7 : glycosylated haemoglobin A1c 5.7% threshold; HR: hazard ratio;IRR: incidence rate ratio; NA: not applicable; N/M: fewer than 3 studies or calculation of the 95% prediction interval did not provide a meaningful estimate; OR: odds ratio; T2DM: type 2 diabetes mellitus. | ||||
| GRADE Working Group grades of evidence | ||||
| aWith phase 2 explanatory studies aiming to confirm independent associations between the prognostic factor and the outcome, GRADE starts with 'high quality' (Huguet 2013). We assumed the GRADE factor publication bias was inherent with this type of research (phase 2 design), so we did not use it as a potential downgrading factor | ||||
| Outcome: development of T2DM | ||||
| No of studies | No of participants with intermediate hyperglycaemia | Geographic region/special population | Estimated effect (95% CI) | Overall certainty of the evidence (GRADE)a |
| HR: 2 IRR: 0 OR: 1 | HR: 1040 IRR: 0 OR: 370 | Australia/Europe/North America | HR: 5.09 (1.69–15.37) [N/M] IRR: NA OR: 15.60 (6.90–35.27) [N/M] | ⊕⊕⊝⊝ |
| HR: 4 IRR: 0 OR: 1 | HR: 3492 IRR: 0 OR: 1103 | Asia/Middle East | HR: 13.12 (4.10–41.96) [N/M] IRR: NA OR: 23.20 (18.70–28.78) [N/M] | |
| HR: 0 IRR: 0 OR: 0 | HR: 0 IRR: 0 OR: 0 | Latin America | HR: NA IRR: NA OR: NA | |
| IRR: 0 | IRR: 0 HR: 0 | American Indians/Islands | IRR: NA OR: 5.89 (4.23–8.20) [N/M] HR: NA | |
| HR: 6 IRR: 0 OR: 3 | HR: 4532 IRR: 0 OR: 1594 | Overall | HR: 10.10 (3.59–28.43) [N/M] IRR: NA OR: 12.79 [4.56–35.85] [N/M] | |
| CI: confidence interval; HbA1c6.0 : glycosylated haemoglobin A1c 6.0% threshold; HR: hazard ratio;IRR: incidence rate ratio; NA: not applicable; N/M: fewer than 3 studies or calculation of the 95% prediction interval did not provide a meaningful estimate; OR: odds ratio; T2DM: type 2 diabetes mellitus. | ||||
| GRADE Working Group grades of evidence | ||||
| aWith phase 2 explanatory studies aiming to confirm independent associations between the prognostic factor and the outcome, GRADE starts with 'high quality' (Huguet 2013). We assumed the GRADE factor publication bias was inherent with this type of research (phase 2 design), so we did not use it as a potential downgrading factor | ||||
| Follow‐up time (years) | % (95% CI) cumulative T2DM incidence | % (95% CI) regression from IH to normoglycaemia | ||||||
| IFG5.6 | IFG6.1 | IGT | IFG + IGT | HbA1c5.7 | HbA1c6.0 | |||
| 1 | — | — | 13 (5–23) [3; 671] | 29 (23–36) [1; 207] | — | — | 59 (54–64) [2; 375] | |
| 2 | 2 (1–2) [1; 1335] | 11 (8–14) [2; 549] | 16 (9–26) [9; 1998] | — | — | — | 46 (36–55) [9; 2852] | |
| 3 | 17 (6–32) [3; 1091] | 9 (2–20) [3; 927] | 22 (18–27) [3; 417] | 34 (28–41) [1; 209] | — | 7 (5–10) [1; 370] | 41 (24–59) [7; 1356] | |
| 4 | 17 (13–22) [3; 800] | 30 (17–44) [2; 1567] | 22 (12–34) [5; 1042] | — | 14 (7–23) [3; 5352] | 44 (40–48) [2; 627] | 33 (26–40) [3; 807] | |
| 5 | 18 (10–27) [7; 3530] | 26 (19–33) [11; 3837] | 39 (25–53) [12; 3444] | 50 (37–63) [5; 478] | 25 (18–32) [4; 3524] | 38 (26–51) [3; 1462] | 34 (27–42) [9; 2603] | |
| 6 | 22 (15–31) [4; 738] | 37 (31–43) [5; 279] | 29 (25–34) [7; 775] | 58 (48–67) [4; 106] | 17 (14–20) [1; 675] | — | 23 (3–53) [5; 1328] | |
| 7 | 18 (8–30) [5; 980] | 15 (0–45) [4; 434] | 19 (13–26) [5; 835] | 32 (20–45) [4; 753] | 21 (16–27) [1; 207] | — | 41 (37–45) [4; 679] | |
| 8 | 34 (27–40) [2; 1887] | 48 (31–66) [1;29] | 43 (37–49) [4; 1021] | 52 (47–57) [1; 356] | — | — | 39 (33–44) [2; 328] | |
| 9 | 38 (10–70) [3; 1356] | — | 53 (45–60) [1; 163] | 84 (74–91) [1; 69] | — | — | 17 (14–22) [1; 299] | |
| 10 | 23 (14–33) [6; 1542] | 29 (17–43) [6; 537] | 26 (17–37) [6; 443] | 30 (17–44) [2; 49] | 31 (29–33) [2; 2854] | — | 42 (22–63) [7; 894] | |
| 11 | — | 38 (33–43) [1; 402] | 46 (43–49) [1; 1253] | — | — | — | 28 (17–39) [2; 736] | |
| 12 | 31 (19–34) [3; 433] | 31 (28–33) [1; 1382] | 41 (38–43) [2; 1552] | 70 (63–76) [2; 207] | — | — | — | |
| 15 | — | — | — | — | — | 29 (19–40) [1; 70] | — | |
| 20 | — | — | 60 (5–68) [1; 114] | — | — | — | — | |
| CI: confidence interval; HbA1c: glycosylated haemoglobin A1c; HbA1c5.7/6.0 (threshold 5.7% or 6.0%); IFG5.6/6.1 : impaired fasting glucose (threshold 5.6 mmol/L or 6.1 mmol/L); IGT: impaired glucose tolerance; IFG + IGT: both IFG and IGT; IH: intermediate hyperglycaemia; T2DM: type 2 diabetes mellitus | ||||||||
| Ratio (95% CI) [no of studies; no of participants with IH/no of participants with normoglycaemia] | |||||||
| Hazard ratio | |||||||
| Region | IFG5.6 cohort | IFG6.1 cohort | IGT cohort | IFG + IGT cohort | HbA1c5.7 cohort | HbA1c6.0 cohort | HbA1c5.7 + IFG5.6 cohort |
| Asia/Middle East | 5.07 (3.41‐7.53) 1.07–24.02 [4; 2385/12,837] | 10.55 (3.61–30.81) NAb [5; 1054/9756] | 4.48 (2.81–7.15) NAb [3; 1780/6695] | 10.20 (5.45–19.09) NAb [3; 461/6695] | 7.21 (5.14–10.11) 0.81–64.52 [3; 3196/13,609] | 13.12 (4.10–41.96) NAb [4; 3492/19,242] | 32.50 (23.00–45.92)c NAa [1; 410/4149] |
| Australia/Europe/North America | 4.15 (1.24–13.87) NAb [3; 5685/12,837] | 3.30 (2.32–4.67) 0.84–12.99 [4; 1736/8835] | 2.53 (1.52–4.19) NAa [2; 2230/5871] | 3.80 (2.30–6.28) NAa [1; 221/1429] | 2.71 (2.48–2.96) NAa [1: 2027/6215] | 5.09 (1.69–15.37) NAa [2; 1040/6925] | — |
| Latin America | — | 2.06 (1.76–2.41) NAb | — | — | — | — | — |
| American Indians/Islands | 2.38 (1.85–3.06) NAa [1; 947/595] | — | — | 4.06 (3.05–5.40) NAa [1; 356/595] | — | — | — |
| Overall | 4.32 (2.61–7.12) 0.75–25.01 [8; 9017/25,850] | 5.47 (3.50–8.54) 1.09–27.56 [9; 2818/18,591] | 3.61 (2.31–5.64) 0.69–18.97 [5; 4010/12,566] | 6.90 (4.15–11.45) 1.06–44.95 [5; 1038/8719] | 5.55 (2.77–11.12) 0.23–141.18 [4; 5223/19,824] | 10.10 (3.59–28.43) NAb [6; 4532/26,167] | 32.50 (23.00–45.92) NAa [1; 410/4149] |
| Incidence rate ratio | |||||||
| Region | IFG5.6 cohort | IFG6.1 cohort | IGT cohort | IFG + IGT cohort | HbA1c5.7 cohort | HbA1c6.0 cohort | HbA1c5.7 + IFG5.6 cohort |
| Asia/Middle East | 5.23 (3.77–7.25) 1.72–15.89 [6; 15,661/145,597] | 3.62 (1.67–7.83) NAa [2; 1677/36,334] | 3.93 (3.03–5.10) 1.71–9.02 [5; 14,809/73,128] | 11.20 (5.59–22.43) NAb [4; 3166/69,463] | 6.62 (4.18–10.49) NAa [1; 1965/19961] | — | 40.72 (29.30–56.61) NAa [1; 1641/19,961] |
| Australia/Europe/North America | 4.96 (3.25–7.57) 0.32–77.24 [3; 6322/8062] | 8.55 (6.37–11.48) 4.37–16.73 [4; 3438/20,246] | 5.93 (4.11–8.57) 2.38–14.81 [5; 2572/22,329] | 13.92 (9.99–19.40) 6.71–28.85 [4; 699/18,966] | — | — | — |
| Latin America | — | — | — | — | — | — | — |
| American Indians/Islands | 2.74 (1.88–3.99) NAa [1; 2374/1613] | — | 4.46 (3.12–6.38) NAa [2; 1087/2952] | 5.18 (3.42–7.83) NAa [1; 605/1613] | — | — | — |
| Overall | 4.81 (3.67–6.30) 1.95–11.83 [10; 24,357/155,272] | 6.82 (4.53–10.25) 2.03–22.87 [6; 5115/56,580] | 4.48 (3.69–5.44) 2.60–7.70 [12; 18,468/98,409] | 10.94 (7.22–16.58) 2.58–46.46 [9; 4470/90,072] | 6.62 (4.18–10.5) NAa [1; 1965/19961] | — | 40.72 (29.30–56.61) NAa [1; 1641/19,961] |
| Odds ratio | |||||||
| IFG5.6 cohort | IFG6.1 cohort | IGT cohort | IFG + IGT cohort | HbA1c5.7 cohort | HbA1c6.0 cohort | HbA1c5.7 + IFG5.6 cohort | |
| Asia/Middle East | 2.94 (1.77–4.86) 0.43–19.93 [10; 6359/28,218] | 5.18 (2.32–11.53) 0.29–91.37 [7; 3317/25,604] | 3.74 (2.83–4.94) 1.70–8.21 [6; 1226/7417] | 6.99 (3.09–15.83) NAb [3; 498/3704] | 4.54 (2.65–7.78) NAa [1; 675/462] | 23.20 (18.70–28.78) NAa [1; 1103/10,763] | 46.70 (33.60–64.91) NAa [1; 1951/10,761] |
| Australia/Europe/North America | 6.47 (3.81–11.00) 0.99–42.32 [9; 1949/7920] | 8.69 (4.95–15.24) 1.20–62.69 [7; 1240/5094] | 5.20 (3.62–7.45) 1.50–18.09 [11; 1481/7684] | 20.95 (12.40–35.40) 4.93–89.05 [6; 154/5300] | 4.38 (1.36–14.15) NAa [2; 231/2100] | 15.60 (6.90–35.27) NAa [1; 370/5365] | 26.20 (16.30–41.11) NAa [1; 169/1125] |
| Latin America | 4.28 (3.21–5.71) NAa [1; 65/1594] | 3.73 (2.18–6.38) NAa [1; 17/1594] | 4.94 (3.15–7.76) NAa [2; 381/3097] | — | — | — | — |
| American Indians/Islands | 3.12 (2.31–4.21) NAa [1; 947/595] | — | 3.60 (1.40–9.26) NAa [1; 51/215] | — | — | 5.89 (4.23–8.20) NAa [1; 121/595] | — |
| Overall | 4.15 (2.75–6.28) 0.54–32.00 [21; 9320/38,327] | 6.60 (4.18–10.43) 0.93–46.82 [15; 4574/32,292] | 4.61 (3.76–5.64) 2.10–10.13 [20; 3139/18,413] | 13.14 (7.41–23.30) 1.84–93.66 [9; 652/9004] | 4.43 (2.20–8.88) NAb [3; 906/2562] | 12.8 [4.56–35.9] NAb [3; 1594/16,723] | 35.91 (20.43–63.12) NAa [2; 2120/11,886] |
| CI: confidence interval; HbA1c: glycosylated haemoglobin A1c; HbA1c5.7/6.0 (threshold 5.7% or 6.0%); HbA1c5.7 + IFG5.6 : both HbA1c5.7 and IFG5.6; IFG5.6/6.1 : impaired fasting glucose (threshold 5.6 mmol/L or 6.1 mmol/L); IGT: impaired glucose tolerance; IFG + IGT: both IFG and IGT; IH: intermediate hyperglycaemia; NA: not applicable; T2DM: type 2 diabetes mellitus; NR: not reported | |||||||
| Outcome or subgroup title | No. of studies | No. of participants | Statistical method | Effect size |
| 1 T2DM incidence (IFG5.6) Show forest plot | 8 | 34867 | Hazard Ratio (Random, 95% CI) | 4.32 [2.61, 7.12] |
| 1.1 Asia/Middle East | 4 | 14803 | Hazard Ratio (Random, 95% CI) | 5.07 [3.41, 7.53] |
| 1.2 Australia/Europe/North America | 3 | 18522 | Hazard Ratio (Random, 95% CI) | 4.15 [1.24, 13.87] |
| 1.3 American Indians/Islands | 1 | 1542 | Hazard Ratio (Random, 95% CI) | 2.38 [1.85, 3.06] |
| 2 T2DM incidence (IFG6.1) Show forest plot | 10 | 21475 | Hazard Ratio (Random, 95% CI) | 5.47 [3.50, 8.54] |
| 2.1 Asia/Middle East | 5 | 10810 | Hazard Ratio (Random, 95% CI) | 10.55 [3.61, 30.81] |
| 2.2 Australia/Europe/North America | 4 | 10571 | Hazard Ratio (Random, 95% CI) | 3.30 [2.32, 4.67] |
| 2.3 Latin America | 1 | 94 | Hazard Ratio (Random, 95% CI) | 2.06 [1.76, 2.41] |
| 3 T2DM incidence (IGT) Show forest plot | 5 | 16576 | Hazard Ratio (Random, 95% CI) | 3.61 [2.31, 5.64] |
| 3.1 Asia/Middle East | 3 | 8475 | Hazard Ratio (Random, 95% CI) | 4.48 [2.81, 7.15] |
| 3.2 Australia/Europe/North America | 2 | 8101 | Hazard Ratio (Random, 95% CI) | 2.53 [1.52, 4.19] |
| 4 T2DM incidence (IFG + IGT) Show forest plot | 5 | 9757 | Hazard Ratio (Random, 95% CI) | 6.90 [4.15, 11.45] |
| 4.1 Asia/Middle East | 3 | 7156 | Hazard Ratio (Random, 95% CI) | 10.20 [5.45, 19.09] |
| 4.2 Australia/Europe/North America | 1 | 1650 | Hazard Ratio (Random, 95% CI) | 3.80 [2.30, 6.28] |
| 4.3 American Indians/Islands | 1 | 951 | Hazard Ratio (Random, 95% CI) | 4.06 [3.05, 5.40] |
| 5 T2DM incidence (HbA1c5.7) Show forest plot | 4 | 25047 | Hazard Ratio (Random, 95% CI) | 5.55 [2.77, 11.12] |
| 5.1 Asia | 3 | 16805 | Hazard Ratio (Random, 95% CI) | 7.21 [5.14, 10.11] |
| 5.2 Australia/Europe/North America | 1 | 8242 | Hazard Ratio (Random, 95% CI) | 2.71 [2.48, 2.96] |
| 6 T2DM incidence (HbA1c6.0) Show forest plot | 6 | 30699 | Hazard Ratio (Random, 95% CI) | 10.10 [3.59, 28.43] |
| 6.1 Asia/Middle East | 4 | 22734 | Hazard Ratio (Random, 95% CI) | 13.12 [4.10, 41.96] |
| 6.2 Australia/Europe/North America | 2 | 7965 | Hazard Ratio (Random, 95% CI) | 5.09 [1.69, 15.37] |
| 7 T2DM incidence (HbA1c + IFG) Show forest plot | 1 | Hazard Ratio (Fixed, 95% CI) | Subtotals only | |
| 7.1 HbA1c5.7 + IFG5.6 | 1 | 4559 | Hazard Ratio (Fixed, 95% CI) | 32.50 [23.00, 45.92] |
| 7.2 HbA1c5.7 + IFG6.1 | 1 | 5357 | Hazard Ratio (Fixed, 95% CI) | 37.90 [28.10, 51.12] |
| 7.3 HbA1c6.0 + IFG5.6 | 1 | 4628 | Hazard Ratio (Fixed, 95% CI) | 53.70 [38.40, 75.09] |
| 7.4 HbA1c6.0 + IFG6.1 | 1 | 5802 | Hazard Ratio (Fixed, 95% CI) | 52.30 [37.80, 72.37] |
| Outcome or subgroup title | No. of studies | No. of participants | Statistical method | Effect size |
| 1 T2DM incidence (IFG5.6) Show forest plot | 21 | 47647 | Odds Ratio (Random, 95% CI) | 4.15 [2.75, 6.28] |
| 1.1 Asia/Middle East | 10 | 34577 | Odds Ratio (Random, 95% CI) | 2.94 [1.77, 4.86] |
| 1.2 Australia/Europe/North America | 9 | 9869 | Odds Ratio (Random, 95% CI) | 6.47 [3.81, 11.00] |
| 1.3 Latin America | 1 | 1659 | Odds Ratio (Random, 95% CI) | 4.28 [3.21, 5.71] |
| 1.4 American Indians/Islands | 1 | 1542 | Odds Ratio (Random, 95% CI) | 3.12 [2.31, 4.21] |
| 2 T2DM incidence (IFG6.1) Show forest plot | 15 | 36866 | Odds Ratio (Random, 95% CI) | 6.60 [4.18, 10.43] |
| 2.1 Asia/Middle East | 7 | 28921 | Odds Ratio (Random, 95% CI) | 5.18 [2.32, 11.53] |
| 2.2 Australia/Europe/North America | 7 | 6334 | Odds Ratio (Random, 95% CI) | 8.69 [4.95, 15.24] |
| 2.3 Latin America | 1 | 1611 | Odds Ratio (Random, 95% CI) | 3.73 [2.18, 6.38] |
| 3 T2DM incidence (IGT) Show forest plot | 20 | 21552 | Odds Ratio (Random, 95% CI) | 4.61 [3.76, 5.64] |
| 3.1 Asia/Middle East | 6 | 8643 | Odds Ratio (Random, 95% CI) | 3.74 [2.83, 4.94] |
| 3.2 Australia/Europe/North America | 11 | 9165 | Odds Ratio (Random, 95% CI) | 5.20 [3.62, 7.45] |
| 3.3 Latin America | 2 | 3478 | Odds Ratio (Random, 95% CI) | 4.94 [3.15, 7.76] |
| 3.4 American Indians/Islands | 1 | 266 | Odds Ratio (Random, 95% CI) | 3.60 [1.40, 9.26] |
| 4 T2DM incidence (IFG + IGT) Show forest plot | 9 | 9656 | Odds Ratio (Random, 95% CI) | 13.14 [7.41, 23.30] |
| 4.1 Asia/Middle East | 3 | 4202 | Odds Ratio (Random, 95% CI) | 6.99 [3.09, 15.83] |
| 4.2 Australia/Europe/North America | 6 | 5454 | Odds Ratio (Random, 95% CI) | 20.95 [12.40, 35.40] |
| 5 T2DM incidence (HbA1c5.7) Show forest plot | 3 | 3468 | Odds Ratio (Random, 95% CI) | 4.43 [2.20, 8.88] |
| 5.1 Asia/Middle East | 1 | 1137 | Odds Ratio (Random, 95% CI) | 4.54 [2.65, 7.78] |
| 5.2 Europe/North America | 2 | 2331 | Odds Ratio (Random, 95% CI) | 4.38 [1.36, 14.15] |
| 6 T2DM incidence (HbA1c6.0) Show forest plot | 3 | 18317 | Odds Ratio (Random, 95% CI) | 12.79 [4.56, 35.85] |
| 6.1 Asia/Middle East | 1 | 11866 | Odds Ratio (Random, 95% CI) | 23.20 [18.70, 28.78] |
| 6.2 Australia/Europe/North America | 1 | 5735 | Odds Ratio (Random, 95% CI) | 15.60 [6.90, 35.27] |
| 6.3 American Indians/Islands | 1 | 716 | Odds Ratio (Random, 95% CI) | 5.89 [4.23, 8.20] |
| 7 T2DM incidence (HbA1c5.7 + IFG5.6) Show forest plot | 2 | 14006 | Odds Ratio (Random, 95% CI) | 35.91 [20.43, 63.12] |
| 7.1 Australia/Europe/North America | 1 | 1294 | Odds Ratio (Random, 95% CI) | 26.20 [16.30, 42.11] |
| 7.2 Asia/Middle East | 1 | 12712 | Odds Ratio (Random, 95% CI) | 46.70 [33.60, 64.91] |