Intravenous iron versus oral iron versus no iron with or without erythropoiesis‐ stimulating agents (ESA) for cancer patients with anaemia: A systematic review and network meta‐analysis
Abstract
This is a protocol for a Cochrane Review (Intervention). The objectives are as follows:
The objectives are to systematically review the effect of intravenous iron or no iron in combination with erythropoiesis‐stimulating agents (ESAs) on the prevention or alleviation of anaemic cancer patients and to generate a clinically meaningful treatment ranking according to their safety and efficacy.
Background
Description of the condition
A widely prevalent complication in patients suffering from cancer is the deficiency of haemoglobin‐containing red blood cells (RBCs), referred to as anaemia (Knight 2004). The prevalence and incidence of anaemia in cancer patients is high and it is an important contributor to morbidity and poor performance status (Ludwig 2004). The reported age‐adjusted incidence rate of cancer in the USA in 2010 was 457.5 per 100,000 persons, with the age‐adjusted death rate of 171.8 per 100,000 persons per year (Howlader 2014). The European prospective survey found a prevalence of anaemia in cancer patients of 39.3% at enrolment, increasing to 67% during the six months observation period (Ludwig 2004). Patients suffering from haematological malignancies frequently experience anaemia. This frequency ranges from 30% to 40% in patients diagnosed with Non‐Hodgkin's Lymphomas (NHL) or Hodgkin's lymphoma (HL), up to 70% of patients with multiple myeloma, and higher in patients with myelodysplastic syndrome (Garton 1995; Tonia 2012). The intensity of anaemia has been classified, by the National Cancer Institute (NCI), based on the following haemoglobin (Hb) values (Groopman 1999):
-
grade 0, within normal limits, Hb values are 12.0 g/dL to 16.0 g/dL for women and 14.0 g/dL to 18.0 g/dL for men;
-
grade 1, mild (Hb 10 g/dL to normal limits);
-
grade 2, moderate (Hb 8.0 g/dL to 10.0 g/dL);
-
grade 3, serious/severe (Hb 6.5 g/dL to 8.0 g/dL); and
-
grade 4, life‐threatening (Hb less than 6.5 g/dL).
Anaemia of chronic disorders (ACD)
Due to an involvement of malignant bone marrow cells, the incidence rate of patients with symptomatic anaemia at the stage solid tumour diagnosis, prior to treatment, ranges from 31% to 50%. Furthermore, patients in advanced stages of haematological malignancies experience progressive anaemia with an incidence proportion of higher than 50% (Knight 2004; Ludwig 2004; Link 2013). With the exclusion of causes, such as iron or vitamin deficiencies, occult bleeding or pure RBC anaemia, progressive anaemia can be categorised as "anaemia of chronic disorders" (ACD). ACD is characterised by a close interaction of malignant cells and the patient's immune system. The severity of symptoms of anaemia varies among patients according to the progression of said disorder, including headaches, tachycardia, shortness of breath and palpitation. Chronic anaemia on the other hand may result in severe organ damage within the cardiovascular system, immune system and central nervous system (Nissenson 1992; Ludwig 2001).
Chemotherapy‐induced anaemia (CIA)
The percentage of cancer patients, developing anaemia as a result of chemotherapy is estimated to be approximately 83% (Barrett‐Lee 2006). CIA is most commonly reported in patients with gynaecological tumours, with a frequency of 81% to 88%, as well as patients with lung carcinoma (77% to 83%) (Ludwig 2004). CIA may manifest comparable to mild‐to‐moderate anaemia, with symptoms including dyspnoea, fatigue and weakness. These restrictive symptoms may lead to a decrease in quality of life and performance status of the patients (Littlewood 2001; Stasi 2003; Mancuso 2006).
Radiotherapy‐induced anaemia (RIA)
RIA is reported in 38% of all treated patients, with a repeating pattern of patients with gynaecological tumours and lung carcinoma showing the highest incidence proportion, with 54% and 51%, respectively. Moreover, the rate at which patients develop anaemia due to a combination of radio‐ and chemotherapy is approximately 62% (Ludwig 2004).
Description of the intervention
Therapeutic alternatives are either treating the underlying cause or providing supportive care through RBC transfusions, recombinant human erythropoiesis‐stimulating agents (ESAs) or iron (Rodgers 2012). Studies have shown a correlation of serious thromboembolic events and increased mortality of patients undergoing RBC transfusions (Bohlius 2006; Khorana 2008; Mercadante 2009).
Erythropoiesis‐stimulating agents (ESAs)
ESAs contain proteins, which in response to a hypoxic environment stimulate the production of RBCs within the bone marrow. In the Cochrane review evaluating ESAs versus no ESAs in cancer patients, Tonia and colleagues found that this interaction leads to a significant reduction of RBC transfusions (risk ratio (RR) 0.65 (95% confidence interval (CI) 0.62 to 0.68)) needed for the treatment of anaemic cancer patients and hence the potential to an increase in quality of life (QoL) (Tonia 2012). Event though, thought to be an effective treatment in cancer patients suffering from chronic anaemia, ESAs have been shown to increase the risk of venous thromboembolisms by up to 57% (Bennett 2008).The risk ratio for thromboembolic complications was increased in patients receiving ESAs compared to controls (RR 1.52, 95% CI 1.34 to 1.74) (Tonia 2012). In addition, there is strong evidence for increased mortality during active study period for patients receiving ESA (hazard ratio (HR) 1.17; 95% CI 1.06 to 1.29), and some evidence that ESAs decrease overall survival (HR 1.05; 95% CI 1.00 to 1.11) (Tonia 2012). Due to these findings, the National Comprehensive Cancer Network (NCCN) discourage the use of ESAs, as a stand‐alone treatment for anaemia in cancer patients (NCCN 2016).
Iron supplements
Iron supplements have been proposed as an adjunct to ESAs for the treatment of anaemic, as well as CIA/RIA patients. This is due to the fact that patients treated with ESAs alone have shown to produce iron‐poor erythrocytes in the bone marrow, leading to a functional iron deficiency (FID) (Eschbach 2005). Mhaskar and colleagues show iron supplementation to have a positive effect on the reduction in the risk for RBC transfusions (RR 0.74 (95% CI 0.60 to 0.92)) and increased Hb levels (mean difference (MD) 0.48 (95% CI 0.10 to 0.86)) when administered with ESAs (Mhaskar 2016). However, none of the eight included randomised controlled (RCTs) trials reported overall survival (Mhaskar 2016).
Both oral and intravenous (IV) iron therapy, including low‐molecular weight iron dextran, iron sucrose and ferric gluconate, have shown adverse effects, such as constipation, nausea, emesis and diarrhoea (Fletes 2001; Mamula 2002; Chertow 2004; Chertow 2006). Intravenous iron might also lead to allergic reactions and pseudoanaphylaxis (anaphylactoid reactions), causing an anaphylaxis, in approximately 68 per 10,000 patients (Wang 2015).
ESAs plus iron supplements
Despite the research to determine the efficacy of iron supplement adjunct to ESAs for the treatment of cancer patients with anaemia and CIAs, the results are conflicting. Althought evidence has been published, showing an increased response of ESAs, increased Hb levels, greater haematopoietic response and improved health‐related quality of life in patients being treated with ESAs and IV iron (Bellet 2007; Hedenus 2007; Bastit 2008; Pedrazzoli 2008), others have shown IV iron to have no essential impact on the before‐mentioned aspects in comparison to oral iron or placebo (Steensma 2011). On the contrary, Tonia and colleagues pointed out that only the subgroup of patients not receiving iron additionally to ESAs had a statistically significant overall survival advantage compared to those patients not receiving ESAs (Tonia 2012). However, due to methodological constraints of meta‐analyses of RCTs, all the trials handling iron differently in the ESA‐arm and the no ESA‐arm could not be analysed adequately.
How the intervention might work
ESAs contain an acidic glycoprotein‐hormone, which facilitates the production of erythrocytes in the bone marrow. While the desired effect of an increase of Hb levels is achieved with the use of ESAs, the treatment without iron supplements often results in patients developing FID. FID is a result of ESAs reducing the amount of circulating iron molecules, hence yielding iron‐poor erythrocytes in the bone marrow. Therefore adjuvant iron is used to prevent the development of FID (Mhaskar 2016). Furthermore, iron supplements may reduce the required ESA dose to obtain desired Hb levels (Auerbach 2008).
Why it is important to do this review
Recommendations in current guidelines are inconsistent regarding the usage of ESAs and iron, especially regarding IV iron. The guidelines by the American Society of Hematology (ASH) and the American Society of Clinical Oncology (ASCO) do not consider the usage of IV iron as standard of care (Rizzo 2010). The European Organisation for Research and Treatment of Cancer (EORTC) (Bokemeyer 2007) guidelines found evidence for an improved response to ESA with IV iron, but point out that the doses and schedules for IV iron supplementation are not yet well defined (Bokemeyer 2007). The guidelines by the European Society of Medical Oncology (ESMO) suggest additional iron to ESAs for iron‐deficient patients (Schrijvers 2010), and the National Comprehensive Cancer Network (NCCN) guidelines consider IV iron supplementation for absolute or functional iron deficiency (Rodgers 2012).
In the Cochrane review evaluating ESAs versus no ESAs in cancer patients, Tonia and colleagues found strong evidence for increased mortality for patients receiving ESAs. However, in the subgroup analysis evaluating iron supplementation, they reported a statistically significant survival advantage in the subgroup with no explicit statement on iron supplementation or no iron given for patients receiving ESA (Tonia 2012). As they evaluated only pair‐wise comparisons, the treatment arms of studies handling iron differently in both study arms could not sufficiently be considered in the subgroup analyses. Network meta‐analyses can overcome this disadvantage of pair‐wise comparisons.
In order to provide the highest level of evidence for treatment decisions in cancer patients, we will conduct a network meta‐analysis that summarises the direct and indirect evidence for different preventive and therapeutic strategies for CIA in cancer patients.
Objectives
The objectives are to systematically review the effect of intravenous iron or no iron in combination with erythropoiesis‐stimulating agents (ESAs) on the prevention or alleviation of anaemic cancer patients and to generate a clinically meaningful treatment ranking according to their safety and efficacy.
Methods
Criteria for considering studies for this review
Types of studies
We will consider only randomised controlled trials (RCTs), in which randomisation was conducted according to ESA and/or iron status. We will include both full‐text and abstract publications if sufficient information is available on study design, characteristics of participants and interventions provided.
Types of participants
We will include trials on patients of any age with solid cancer and/or haematological malignancy undergoing chemotherapy, radiotherapy or no anti‐cancer therapy. We will apply no gender or ethnicity restrictions. We will only include studies in which participants are anaemic or at risk for anaemia from chemotherapy, radiotherapy or combination therapy, or the underlying malignant disease.
Studies including patients suffering from anaemia as a result of surgery will be excluded, as well as patients suffering from anaemia due to haemolysis.
Types of interventions
Included trials will address one or multiple of the following interventions:
-
ESA + IV iron;
-
ESA + oral iron;
-
ESA + no iron;
-
ESA + iron unclear;
-
ESA + iron, unclear application;
-
no ESA + IV iron;
-
no ESA + oral iron;
-
no ESA + iron unclear;
-
no ESA + iron, application unclear;
-
no treatment ‐ defined as baseline therapy excluding the addition of ESAs, or iron supplementation; and
-
placebo.
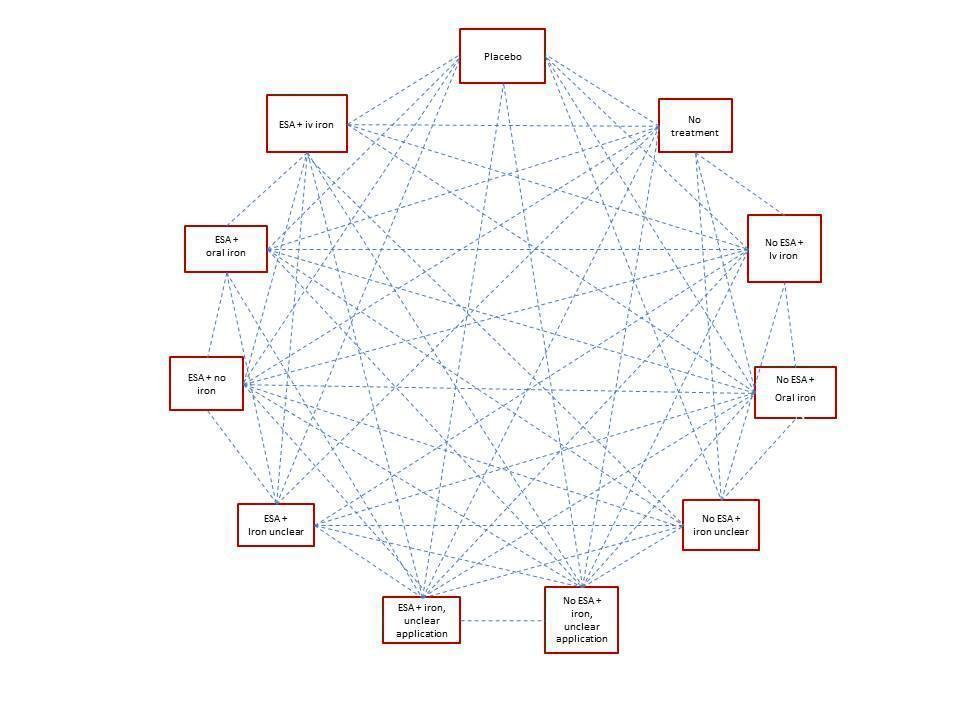
All interventions will be compared to each other using a network meta‐analysis (Figure 1). We assume that any patient that meets the inclusion criteria is, in principle, equally likely to be randomised to any of the eligible interventions. We plan to group interventions by merging doses according to the product characteristics.

Types of outcome measures
We will estimate the relative ranking of the competing interventions according to the following outcomes:
-
on‐study mortality (deaths occurring up to 30 days after the active study period);
-
number of red blood cell (RBC) transfusions;
-
haematological response (proportion of participants with an increase in haemoglobin (Hb) level of 2 g/dL or more, or increase in haematocrit of six percentage points or more, unrelated to transfusion);
-
overall survival (longest follow‐up available); and
-
adverse events (AEs).
Primary outcomes
As the primary outcome we will evaluate on‐study mortality. This is due to the quantitatively low number of studies reporting long follow‐up time periods. Long‐term follow‐up is prone to be less precise when it comes to recording the number of deaths, hence on‐study mortality is more appropriate as a primary outcome measure.
Secondary outcomes
We will analyse the following outcomes as secondary outcomes:
-
number of red blood cell (RBC) transfusions;
-
haematological (Hb) response;
-
overall survival; and
-
AEs.
Search methods for identification of studies
We will adapt search strategies as suggested in Chapter Six of the Cochrane Handbook for Systematic Reviews of Interventions (Lefebvre 2011). We will apply no language restrictions to reduce language bias. Only trials that compare at least two of the interventions are eligible. We will search for all possible comparisons formed by the interventions of interest.
Electronic searches
We will search the following databases and sources:
-
databases of medical literature:
-
MEDLINE (Ovid) (1950 to present) (Appendix 1);
-
the Cochrane Central Register of Controlled Trials (CENTRAL) (the Cochrane Library, latest issue) (Appendix 2);
-
-
conference proceedings of annual meetings of the following societies for abstracts, if not included in CENTRAL (2010 to present):
-
American Society of Hematology;
-
American Society of Clinical Oncology;
-
European Hematology Association;
-
-
databases of ongoing trials:
-
register of controlled trials: www.controlled‐trials.com;
-
EU clinical trials register: www.clinicaltrialsregister.eu/ctr‐search/search;
-
clinicaltrials.gov: www.clinicaltrials.gov; and
-
-
databases and websites of relevant institutions, and organisations (e.g. pharmaceutical industries).
Searching other resources
-
Handsearching of references:
-
references of all identified trials and relevant review articles; current treatment guidelines as further literature.
-
We will use the following sources to identify the studies for this network meta‐analysis:
-
previous Cochrane reviews on the effect of ESAs on cancer patients with anaemia, as well as patients with CIA (Tonia 2012; Mhaskar 2016); and
-
reference lists of other systematic reviews and meta‐analyses.
Data collection and analysis
Selection of studies
Two review authors will independently screen results of search strategies for eligibility for this review by reading all abstracts. In cases of disagreement, we will obtain the full‐text publication. If no consensus can be reached, we will ask a third review author (Higgins 2011a).
We will document the process of study selection in a flow chart, as recommended by the Preferred Reporting Items for Systematic Reviews and Meta‐Analyses (PRISMA) statement (Moher 2009), showing total numbers of retrieved references and numbers of included and excluded studies.
Data extraction and management
Two review authors will independently extract data according to Chapter Seven of the Cochrane Handbook for Systematic Reviews of Interventions (Higgins 2011a). We will contact authors of individual studies to ask for additional information, if required. We will use a standardised data extraction form containing the following items:
-
general information:
-
author, title, source, publication date, country, language, duplicate publications;
-
-
quality assessment:
-
allocation concealment, blinding (participants, personnel, outcome assessors), incomplete outcome data, selective outcome reporting, other sources of bias;
-
-
study characteristics:
-
trial design, aims, setting and dates, source of participants, inclusion/exclusion criteria, subgroup analysis, treatment cross‐overs, compliance with assigned treatment, length of follow‐up;
-
-
participant characteristics:
-
patient's age, gender, number of participants recruited/allocated/evaluated, participants lost to follow‐up, type of treatment, underlying disease, newly diagnosed or relapsed;
-
-
interventions:
-
placebo use, ESA‐dose, iron‐dose, dosing regimen, duration, route of administration, RBC transfusion trigger, co‐medications with dose, co‐treatment, route and timing; and
-
-
outcomes:
-
on‐study mortality, haematological response, overall survival, AEs, number of RBC transfusions.
-
Assessment of risk of bias in included studies
Two review authors will independently assess risk of bias for each study using the following criteria, as outlined in Chapter Eight of the Cochrane Handbook for Systematic Reviews of Interventions (Higgins 2011b):
-
sequence generation;
-
allocation concealment;
-
blinding (participants, personnel, outcome assessors);
-
incomplete outcome data;
-
selective outcome reporting; and
-
other sources of bias.
We will make a judgement for each criterion, using one of the following categories:
-
'Low risk': if the criterion is adequately fulfilled in the study (i.e. the study is at low risk of bias for the given criterion);
-
'High risk': if the criterion is not fulfilled in the study (i.e. the study is at high risk of bias for the given criterion); and
-
'Unclear': if the study report does not provide sufficient information to allow a clear judgement, or if risk of bias is unknown for one of the criteria listed above.
Measures of treatment effect
We will use intention‐to‐treat data. For binary outcomes, we will use risk ratios (RRs) with 95% confidence intervals (CIs) as the measure of treatment effect. For time‐to‐event outcomes, we will use hazard ratios (HRs) and their 95% CIs. Data will be extracted from publications according to Parmar 1998 and Tierney 2007. We will calculate continuous outcomes as mean differences (MDs) with 95% CIs. We do not expect continuous outcomes assessed with different instruments, so standardised MD is not required.
Relative treatment ranking
We will obtain a treatment hierarchy using P‐scores (Rücker 2015). P‐scores allow ranking treatments on a continuous 0 to 1 scale in a frequentist network meta‐analysis.
Unit of analysis issues
Studies with multiple treatment groups
As recommended in Chapter 16.5.4 of the Cochrane Handbook for Systematic Reviews of Interventions (Higgins 2011), for studies with multiple treatment groups, we will combine arms as long as they can be regarded as subtypes of the same intervention.
When arms can not be pooled this way, we will compare each arm with the common comparator separately. For pair‐wise meta‐analysis, we will split the ‘shared’ group into two or more groups with smaller sample size, and include two or more (reasonably independent) comparisons. For this purpose, for dichotomous outcomes, both the number of events and the total number of patients will be divided up, and for continuous outcomes, the total number of participants will be divided up with unchanged means and standard deviations. For network meta‐analysis, instead of subdividing the common comparator, we will use an approach that accounts for the within‐study correlation between the effect sizes by re‐weighting all comparisons of each multi‐arm study (Rücker 2012, Rücker 2014).
Dealing with missing data
As suggested in Chapter 16 of the Cochrane Handbook for Systematic Reviews of Interventions (Higgins 2011), we will take the following steps to deal with missing data.
Whenever possible, we will contact the original investigators to request relevant missing data. If the number of patients evaluated for a given outcome is not reported, we will use the number of patients randomised per treatment arm as denominator. If only percentages but no absolute number of events are reported for binary outcomes, we will calculate numerators using percentages. If estimates for mean and standard deviations are missing, we will calculate these statistics from reported data whenever possible, using approaches described in Chapter 7.7 of the Cochrane Handbook for Systematic Reviews of Interventions (Higgins 2011a). If standard deviations are missing and we are not able to calculate them from reported data, we will calculate values according to a validated imputation method (Furukwa 2006). If data are not reported in a numerical but graphical format, we will estimate missing data from figures. We will perform sensitivity analyses to assess how sensitive results are to imputing data in some way. We will address in the Discussion section the potential impact of missing data on findings of the review.
Assessment of heterogeneity
Pair‐wise meta‐analyses
For each direct comparison, we will visually inspect the forest plots as well as Cochran’s Q based on a Chi2 statistic and the I2 statistic in order to detect the presence of heterogeneity. We will interpret I2 values according to Chapter 9.5.2 of the Cochrane Handbook for Systematic Reviews of Interventions (Deeks 2011). We will use the P value of the Chi2 test only for describing the extent of heterogeneity and not for determining statistical significance. In addition, we will report Ʈ2, the between‐study variance in random‐effects meta‐analysis.
Network meta‐analysis
A very important pre‐supposition for using network meta‐analysis is to make sure that the network is consistent, meaning that direct and indirect evidence on the same comparisons agree. Inconsistency can be caused by incomparable inclusion and exclusion criteria of the trials in the network.
We will evaluate the assumption of transitivity epidemiologically by comparing the distribution of the potential effect modifiers across the different pair‐wise comparisons. For each set of studies, grouped by treatment comparison, we will create a table of important clinical and methodological characteristics. We will visually inspect the similarity of these factors, including the inclusion and exclusion criteria of every trial in the network.
To evaluate the presence of inconsistency locally, we will use the Bucher method for single loops of evidence (Bucher 1997), as described for example in Dias 2013. For each closed loop, we will calculate the difference between direct and indirect evidence together with its 95% confidence interval. We will use loop‐specific z‐tests to infer about the presence of inconsistency in each loop. We will use graphical representation of estimates of inconsistency together with 95% confidence intervals and will report the percentage of inconsistent loops in the network. It should be noted that in a network of evidence there may be many loops and with multiple testing there is an increased likelihood that we might find an inconsistent loop by chance. Therefore, we will be cautious deriving conclusions from this approach.
To evaluate the presence of inconsistency in the entire network, we will give the generalised heterogeneity statistic Qtotal and the generalised I2 statistic, as described in Schwarzer 2015. We will use the decomp.design command in the R package netmeta (R 2014, netmeta 2016) for decomposition of the heterogeneity statistic into a Q statistic for assessing the heterogeneity between studies with the same design and a Q statistic for assessing the design's inconsistency to identify the amount of heterogeneity/inconsistency within as well as between designs. Furthermore, we will create a net heat plot (Krahn 2013), a graphical tool for locating inconsistency in network meta‐analysis, using the command netheat in the R package netmeta. We will give Qtotal and its components as well as net heat plots based on fixed‐effect and random‐effects models to identify differences between these approaches. For random‐effects models, we will report Ʈ2.
If we find substantive heterogeneity and/or inconsistency, we will explore possible sources by performing pre‐specified sensitivity and subgroup analyses (see below). In addition, we will review the evidence base, reconsider inclusion criteria as well as discuss the potential role of unmeasured effect modifiers to identify further sources.
Assessment of reporting biases
In pair‐wise comparisons with at least 10 trials, we will examine the presence of small‐study effects graphically by generating funnel plots. We will use linear regression tests (Egger 1997) to test for funnel plot asymmetry. A P value less than 0.1 will be considered significant for this test (Sterne 2011). We will examine the presence of small‐study effects for the primary outcome only.
Data synthesis
Methods for direct treatment comparisons
We will perform analyses according to recommendations provided in Chapter 9 of the Cochrane Handbook for Systematic Reviews of Interventions (Deeks 2011), and we will use the statistical software of Cochrane ‐ Review Manager (RevMan) 2014 ‐ for analysis. If applicable, we will use R (R 2014) for additional analyses that can not be done with RevMan.
If adequate, we will perform standard pair‐wise meta‐analyses using a random‐effects model for every treatment comparison with at least two studies. We will calculate corresponding 95% confidence intervals for all analyses, and will present the results graphically using forest plots. When trials are clinically too heterogenous to be combined (e.g. various types of diseases), we will perform only subgroup analyses without calculating an overall estimate. We will create a 'Summary of findings' table on absolute risks in each group according to the Grades of Recommendation, Assessment, Development and Evaluation (GRADE) system (GRADEpro; Schuenemann 2011; Puhan 2014), and in this table, we will summarise the evidence on on‐study mortality, number of RBC transfusions, haematological response, overall survival and AEs.
Methods for indirect and mixed comparisons
Should the data be considered sufficiently similar to be combined, we will perform a network meta‐analysis using the frequentist weighted least squared approach described by Rücker 2012. We will use a random‐effects model, taking into account the correlated treatment effects in multi‐arm studies. We will assume a common estimate for the heterogeneity variance across the different comparisons. To evaluate the extent to which treatments are connected, we will give a network plot for our primary and secondary outcomes. For each comparison, we will give the estimated treatment effect along with its 95% confidence interval. We will graphically present the results using forest plots, with placebo as reference. We will use the R package netmeta (R 2014, netmeta 2016) for statistical analyses.
Subgroup analysis and investigation of heterogeneity
The following subgroup analysis will be conducted, if appropriate:
-
type of iron (iron dextran, ferrous gluconate, ferrous sulphate, etc.);
-
route of iron administration (IV versus oral);
-
type of ESA (epoetin versus darbepoetin);
-
type of anti‐cancer therapy (chemotherapy, radiotherapy, no treatment);
-
cancer type; and
-
duration of follow‐up.
Sensitivity analysis
To test the robustness of the results, we will conduct fixed‐effect pair‐wise and network meta‐analyses. We will report the estimates of the fixed‐effect only if they show a difference to the random‐effects model. We will explore the influence of quality components with regard to low and high risk of bias.