Intravenous iron versus oral iron versus no iron with or without erythropoiesis‐ stimulating agents (ESA) for cancer patients with anaemia: a systematic review and network meta‐analysis
Abstract
Background
Anaemia is common among cancer patients and they may require red blood cell transfusions. Erythropoiesis‐stimulating agents (ESAs) and iron might help in reducing the need for red blood cell transfusions. However, it remains unclear whether the combination of both drugs is preferable compared to using one drug.
Objectives
To systematically review the effect of intravenous iron, oral iron or no iron in combination with or without ESAs to prevent or alleviate anaemia in cancer patients and to generate treatment rankings using network meta‐analyses (NMAs).
Search methods
We identified studies by searching bibliographic databases (CENTRAL, MEDLINE, Embase; until June 2021). We also searched various registries, conference proceedings and reference lists of identified trials.
Selection criteria
We included randomised controlled trials comparing intravenous, oral or no iron, with or without ESAs for the prevention or alleviation of anaemia resulting from chemotherapy, radiotherapy, combination therapy or the underlying malignancy in cancer patients.
Data collection and analysis
Two review authors independently extracted data and assessed risk of bias. Outcomes were on‐study mortality, number of patients receiving red blood cell transfusions, number of red blood cell units, haematological response, overall mortality and adverse events. We conducted NMAs and generated treatment rankings. We assessed the certainty of the evidence using GRADE.
Main results
Ninety‐six trials (25,157 participants) fulfilled our inclusion criteria; 62 trials (24,603 participants) could be considered in the NMA (12 different treatment options). Here we present the comparisons of ESA with or without iron and iron alone versus no treatment. Further results and subgroup analyses are described in the full text.
On‐study mortality
We estimated that 92 of 1000 participants without treatment for anaemia died up to 30 days after the active study period. Evidence from NMA (55 trials; 15,074 participants) suggests that treatment with ESA and intravenous iron (12 of 1000; risk ratio (RR) 0.13, 95% confidence interval (CI) 0.01 to 2.29; low certainty) or oral iron (34 of 1000; RR 0.37, 95% CI 0.01 to 27.38; low certainty) may decrease or increase and ESA alone (103 of 1000; RR 1.12, 95% CI 0.92 to 1.35; moderate certainty) probably slightly increases on‐study mortality. Additionally, treatment with intravenous iron alone (271 of 1000; RR 2.95, 95% CI 0.71 to 12.34; low certainty) may increase and oral iron alone (24 of 1000; RR 0.26, 95% CI 0.00 to 19.73; low certainty) may increase or decrease on‐study mortality.
Haematological response
We estimated that 90 of 1000 participants without treatment for anaemia had a haematological response. Evidence from NMA (31 trials; 6985 participants) suggests that treatment with ESA and intravenous iron (604 of 1000; RR 6.71, 95% CI 4.93 to 9.14; moderate certainty), ESA and oral iron (527 of 1000; RR 5.85, 95% CI 4.06 to 8.42; moderate certainty), and ESA alone (467 of 1000; RR 5.19, 95% CI 4.02 to 6.71; moderate certainty) probably increases haematological response. Additionally, treatment with oral iron alone may increase haematological response (153 of 1000; RR 1.70, 95% CI 0.69 to 4.20; low certainty).
Red blood cell transfusions
We estimated that 360 of 1000 participants without treatment for anaemia needed at least one transfusion. Evidence from NMA (69 trials; 18,684 participants) suggests that treatment with ESA and intravenous iron (158 of 1000; RR 0.44, 95% CI 0.31 to 0.63; moderate certainty), ESA and oral iron (144 of 1000; RR 0.40, 95% CI 0.24 to 0.66; moderate certainty) and ESA alone (212 of 1000; RR 0.59, 95% CI 0.51 to 0.69; moderate certainty) probably decreases the need for transfusions. Additionally, treatment with intravenous iron alone (268 of 1000; RR 0.74, 95% CI 0.43 to 1.28; low certainty) and with oral iron alone (333 of 1000; RR 0.92, 95% CI 0.54 to 1.57; low certainty) may decrease or increase the need for transfusions.
Overall mortality
We estimated that 347 of 1000 participants without treatment for anaemia died overall. Low‐certainty evidence from NMA (71 trials; 21,576 participants) suggests that treatment with ESA and intravenous iron (507 of 1000; RR 1.46, 95% CI 0.87 to 2.43) or oral iron (482 of 1000; RR 1.39, 95% CI 0.60 to 3.22) and intravenous iron alone (521 of 1000; RR 1.50, 95% CI 0.63 to 3.56) or oral iron alone (534 of 1000; RR 1.54, 95% CI 0.66 to 3.56) may decrease or increase overall mortality. Treatment with ESA alone may lead to little or no difference in overall mortality (357 of 1000; RR 1.03, 95% CI 0.97 to 1.10; low certainty).
Thromboembolic events
We estimated that 36 of 1000 participants without treatment for anaemia developed thromboembolic events. Evidence from NMA (50 trials; 15,408 participants) suggests that treatment with ESA and intravenous iron (66 of 1000; RR 1.82, 95% CI 0.98 to 3.41; moderate certainty) probably slightly increases and with ESA alone (66 of 1000; RR 1.82, 95% CI 1.34 to 2.47; high certainty) slightly increases the number of thromboembolic events. None of the trials reported results on the other comparisons.
Thrombocytopenia or haemorrhage
We estimated that 76 of 1000 participants without treatment for anaemia developed thrombocytopenia/haemorrhage. Evidence from NMA (13 trials, 2744 participants) suggests that treatment with ESA alone probably leads to little or no difference in thrombocytopenia/haemorrhage (76 of 1000; RR 1.00, 95% CI 0.67 to 1.48; moderate certainty). None of the trials reported results on other comparisons.
Hypertension
We estimated that 10 of 1000 participants without treatment for anaemia developed hypertension. Evidence from NMA (24 trials; 8383 participants) suggests that treatment with ESA alone probably increases the number of hypertensions (29 of 1000; RR 2.93, 95% CI 1.19 to 7.25; moderate certainty). None of the trials reported results on the other comparisons.
Authors' conclusions
When considering ESAs with iron as prevention for anaemia, one has to balance between efficacy and safety. Results suggest that treatment with ESA and iron probably decreases number of blood transfusions, but may increase mortality and the number of thromboembolic events. For most outcomes the different comparisons within the network were not fully connected, so ranking of all treatments together was not possible. More head‐to‐head comparisons including all evaluated treatment combinations are needed to fill the gaps and prove results of this review.
PICO
Plain language summary
Which combinations of medicines are best for the prevention and treatment of anaemia in people with cancer?
Key messages
• Giving medicines that stimulate the bone marrow to produce red blood cells (ESAs) with iron supplements probably decreases the number of blood transfusions, but may also cause more deaths and increase the number of unwanted effects, such as blood clots.
• Because of missing data from the studies we could not compare the different treatment options to each other and rank them.
• We need more studies that compare these medicines directly against each other.
What is anaemia and why do people with cancer develop it?
Anaemia develops when levels of red blood cells are too low. Red blood cells contain a protein called haemoglobin. Iron molecules in the haemoglobin bind to oxygen and carry it around the body. A lack of oxygen to the organs and tissues in the body makes people feel tired and lack energy, and they may be at greater risk of infections. People with cancer are particularly likely to suffer from anaemia. This might be because the cancers cause inflammation and prevent red blood cell production. Or it might be because treatments like chemotherapy slow down production of red blood cells in bone marrow.
People suffering from anaemia may need blood transfusions. However, treatment with medicines that stimulate the production of red blood cells in bone marrow (called erythropoiesis‐stimulating agents or ESAs) and iron supplements may reduce the need for transfusions.
What did we want to find out?
We wanted to identify the most effective treatments for anaemia in people with cancer and whether they cause any unwanted effects. We were interested in whether iron supplements or ESAs given alone or together affect:
• deaths;
• haemoglobin levels;
• blood transfusions; and
• unwanted effects.
We also wanted to know the best way to give the medicines: by injection (intravenous), or swallowed (oral).
What did we do?
We searched for studies that compared intravenous, oral or no iron with or without ESAs for the prevention or treatment of anaemia resulting from chemotherapy, radiotherapy, combination therapy or the underlying malignancy in people with cancer. We compared and summarised their results, and rated our confidence in the evidence, based on factors such as study methods and numbers of participants. We used statistical methods to compare multiple treatments against each other and rank them in order of effectiveness and unwanted effects.
What did we find?
We found 96 relevant studies with 25,157 people. People in the studies were different ages and were receiving a mix of anti‐cancer treatments or no treatment. They had different types of cancer.
Ninety‐two studies reported data for our review. They included 24,603 people and compared 12 different treatment options for anaemia. The treatments included combinations of ESAs with intravenous or oral iron and placebo (something that looks, tastes and smells the same as the iron supplement or ESA but with no active ingredient).
Not every study reported everything we were interested in, so we did not have enough information to compare each treatment with each of the other treatments.
Treatment with ESAs when used on their own or with iron probably increases levels of red blood cells and reduces the need for red blood cell transfusions when compared with no treatment. We cannot rule out an increase in the risk of mortality with ESA in combination with iron, which also appeared to cause more deaths and lead to increased risk of harm caused by the formation of clots in the blood vessels.
Our confidence in the findings
Overall, we are moderately confident in the evidence that one treatment is better or worse than another. Our confidence is limited because we sometimes found very different results for the same treatments, meaning they could have been both good and bad for patients ‐ we did not have enough evidence to reach firm conclusions. Also, due to a lack of evidence we could not rank the treatments.
How up to date is the evidence?
The evidence is up‐to‐date to June 2021.
Authors' conclusions
Summary of findings
| ESA with or without iron for cancer patients with anaemia | |||||
| Patient or population: patients at any age with solid cancer or haematological malignancy Settings: inpatient and outpatient care Intervention: ESA + IV iron, ESA + oral iron, ESA without iron Comparison: No treatment | |||||
| Outcomes | Anticipated absolute effects (95% CI)1 | Relative effects (95% CI)2 | Certainty of the evidence (GRADE) | Interpretation of findings | |
|---|---|---|---|---|---|
| Comparator | Intervention | ||||
| On‐study mortality3 (Subnet based on 55 studies including 15,074 participants) | No treatment 92 per 1000 | ESA plus IV iron 12 per 1000 (1 to 211) | RR 0.13 (0.01 to 2.29) | ⊕⊕⊝⊝ | Treatment with ESA and IV iron may decrease or increase on‐study mortality compared to no treatment. |
| ESA plus oral iron 34 per 1000 (1 to 1000 ) | RR 0.37 (0.01 to 27.38) | ⊕⊕⊝⊝ | Treatment with ESA and oral iron may decrease or increase on‐study mortality compared to no treatment. | ||
| ESA without iron 103 per 1000 (85 to 124) | RR 1.12 (0.92 to 1.35) | ⊕⊕⊕⊝ | Treatment with ESA probably slightly increases on‐study mortality compared to no treatment. | ||
| Haemoglobin response (Subnet based on 31 studies including 6985 participants) | No treatment 90 per 1000 | ESA plus IV iron 604 per 1000 (444 to 823) | RR 6.71 (4.93 to 9.14) | ⊕⊕⊕⊝ moderateb | Treatment with ESA and IV iron probably increases haemoglobin response compared to no treatment. |
| ESA plus oral iron 527 per 1000 (365 to 758) | RR 5.85 (4.06 to 8.42) | ⊕⊕⊕⊝ moderateb | Treatment with ESA and oral iron probably increases haemoglobin response compared to no treatment. | ||
| ESA without iron 467 per 1000 (362 to 604) | RR 5.19 (4.02 to 6.71) | ⊕⊕⊕⊝ moderateb | Treatment with ESA probably increases haemoglobin response compared to no treatment. | ||
| Red blood cell transfusions (Subnet based on 69 studies including 18,684 participants) | No treatment 360 per 1000 | ESA plus IV iron 158 per 1000 (112 to 227) | RR 0.44 (0.31 to 0.63) | ⊕⊕⊕⊝ moderateb | Treatment with ESA and IV iron probably decreases the need for red blood cell transfusions compared to no treatment. |
| ESA plus oral iron 144 per 1000 (86 to 238) | RR 0.40 (0.24 to 0.66) | ⊕⊕⊕⊝ moderateb | Treatment with ESA and oral iron probably decreases the need for red blood cell transfusions compared to no treatment. | ||
| ESA without iron 212 per 1000 (184 to 248) | RR 0.59 (0.51 to 0.69) | ⊕⊕⊕⊝ moderateb | Treatment with ESA probably decreases the need for red blood cell transfusions compared to no treatment. | ||
| Overall mortality4 (Subnet based on 71 studies including 21,576 participants) | No treatment 347 per 1000 | ESA plus IV iron 507 per 1000 (302 to 843) | RR 1.46 (0.87 to 2.43) | ⊕⊕⊝⊝ lowa,c | Treatment with ESA and IV iron may decrease or increase overall mortality compared to no treatment. |
| ESA plus oral iron 482 per 1000 (208 to 1000 ) | RR 1.39 (0.60 to 3.22) | ⊕⊕⊝⊝ lowa,c | Treatment with ESA and oral iron may decrease or increase overall mortality compared to no treatment. | ||
| ESA without iron 357 per 1000 (337 to 382) | RR 1.03 (0.97 to 1.10) | ⊕⊕⊝⊝ lowa,c | Treatment with ESA may lead to no or little difference in overall mortality compared to no treatment. | ||
| Thromboembolic events5 (Subnet based on 50 studies including 15,408 participants) | No treatment 36 per 1000 | ESA plus IV iron 66 per 1000 (35 to 123) | RR 1.82 (0.98 to 3.41) | ⊕⊕⊕⊝ | Treatment with ESA and IV iron probably increases the number of thromboembolic events slightly compared to no treatment. |
| ESA plus oral iron n.r. | ‐ | ‐ | ‐ | ||
| ESA without iron 66 per 1000 (48 to 89) | RR 1.82 (1.34 to 2.47) | ⊕⊕⊕⊕ high | Treatment with ESA slightly increases the number of thromboembolic events compared to no treatment. | ||
| Thrombocytopenia or haemorrhage5 (Subnet based on 13 studies including 2744 participants) | No treatment 76 per 1000 | ESA plus IV iron n.r. | ‐ | ‐ | ‐ |
| ESA plus oral iron n.r. | ‐ | ‐ | ‐ | ||
| ESA without iron 76 per 1000 (51 to 112) | RR 1.00 (0.67 to 1.48) | ⊕⊕⊕⊝ moderatea | Treatment with ESA probably leads to little or no difference in thrombocytopenia or haemorrhage compared to no treatment. | ||
| Hypertension5 (Subnet based on 24 studies including 8383 participants) | No treatment 10 per 1000 | ESA plus IV iron n.r. | ‐ | ‐ | ‐ |
| ESA plus oral iron n.r. | ‐ | ‐ | ‐ | ||
| ESA without iron 29 per 1000 (12 to 73) | RR 2.93 (1.19 to 7.25) | ⊕⊕⊕⊝ moderatea | Treatment with ESA probably increases the number of hypertensions compared to no treatment. | ||
| 1 Baseline risks obtained from the respective study population. Absolute risks in the intervention group result from product of control risk and risk ratio 2 Results from network meta‐analysis (random effects model). Network estimates are reported as risk ratios or mean difference with corresponding 95% confidence intervals. 3On‐study mortality is defined as deaths occurring up to 30 days after the active study period. 4Overall mortality is defined as deaths occurring up to the longest follow‐up available (median follow‐up: 12 weeks). 5Events occurring during the whole study period. aDowngraded one level for imprecision since 95% CI is wide and/or crosses unity bDowngraded one level for inconsistency (heterogeneity) cDowngraded one level for high risk of bias since exclusion of studies with overall high risk of bias changed results dDowngraded two levels for imprecision since 95% CI is very wide and crosses unity CI: confidence interval ;ESA: erythropoiesis‐stimulating agent; IV: intravenous; n.r.: not reported RR: risk ratio | |||||
| GRADE Working Group grades of evidence (or certainty in the evidence) High certainty: we are very confident that the true effect lies close to that of the estimate of the effect. | |||||
| IV or oral iron for cancer patients with anaemia | |||||
| Patient or population: patients at any age with solid cancer or haematological malignancy Settings: inpatient and outpatient care Intervention: No ESA + IV iron, No ESA + oral iron Comparison: No treatment | |||||
| Outcomes | Anticipated absolute effects (95% CI)1 | Relative effects (95% CI)2 | Certainty of the evidence (GRADE) | Interpretation of findings | |
|---|---|---|---|---|---|
| Comparator | Intervention | ||||
| On‐study mortality3 (Subnet based on 55 studies including 15,074 participants) | No treatment 92 per 1000 | No ESA plus IV iron 271 per 1000 (65 to 1000 ) | RR 2.95 (0.71 to 12.34) | ⊕⊕⊝⊝ | Treatment with IV iron alone may increase on‐study mortality compared to no treatment. |
| No ESA plus oral iron 24 per 1000 (0 to 1000 ) | RR 0.26 (0.00 to 19.73) | ⊕⊕⊝⊝ | Treatment with oral iron alone may decrease or increase on‐study mortality compared to no treatment. | ||
| Haemoglobin response (Subnet based on 31 studies including 6985 participants) | No treatment 90 per 1000 | No ESA plus IV iron n.r. | ‐ | ‐ | ‐ |
| No ESA plus oral iron 153 per 1000 (62 to 378) | RR 1.70 (0.69 to 4.20) | ⊕⊕⊝⊝ | Treatment with oral iron alone may increase haemoglobin response compared to no treatment. | ||
| Red blood cell transfusions (Subnet based on 69 studies including 18,684 participants) | No treatment 362 per 1000 | No ESA plus IV iron 268 per 1000 (156 to 463) | RR 0.74 (0.43 to 1.28) | ⊕⊕⊝⊝ | Treatment with IV iron alone may decrease or increase the need for red blood cell transfusions compared to no treatment. |
| No ESA plus oral iron 333 per 1000 (195 to 568) | RR 0.92 (0.54 to 1.57) | ⊕⊕⊝⊝ | Treatment with oral iron alone may decrease or increase the need for red blood cell transfusions compared to no treatment. | ||
| Overall mortality4 (Subnet based on 71 studies including 21,576 participants) | No treatment 347 per 1000 | No ESA plus IV iron 521 per 1000 (219 to 1000 ) | RR 1.50 (0.63 to 3.56) | ⊕⊕⊝⊝ | Treatment with IV iron alone may decrease or increase overall mortality compared to no treatment. |
| No ESA plus oral iron 534 per 1000 (229 to 1000 ) | RR 1.54 (0.66 to 3.56) | ⊕⊕⊝⊝ | Treatment with oral iron alone may decrease or increase overall mortality compared to no treatment. | ||
| Thromboembolic events5 (Subnet based on 50 studies including 15,408 participants) | No treatment n.r. | No ESA plus IV iron n.r. | ‐ | ‐ | ‐ |
| No ESA plus oral iron n.r. | ‐ | ‐ | ‐ | ||
| Thrombocytopenia or haemorrhage5 (Subnet based on 13 studies including 2744 participants) | No treatment n.r. | No ESA plus IV iron n.r. | ‐ | ‐ | ‐ |
| No ESA plus oral iron n.r. | ‐ | ‐ | ‐ | ||
| Hypertension5 (Subnet based on 24 studies including 8383 participants) | No treatment n.r. | No ESA plus IV iron n.r. | ‐ | ‐ | ‐ |
| No ESA plus oral iron n.r. | ‐ | ‐ | ‐ | ||
| 1 Baseline risks obtained from the respective study population. Absolute risks in the intervention group result from product of control risk and risk ratio 2 Results from network meta‐analysis (random effects model). Network estimates are reported as risk ratios or mean difference with corresponding 95% confidence intervals. 3On‐study mortality is defined as deaths occurring up to 30 days after the active study period. 4Overall mortality is defined as deaths occurring up to the longest follow‐up available (median follow‐up: 12 weeks). 5Events occurring during the whole study period. a Downgraded one level for imprecision since 95% CI is wide and/or crosses unity b Downgraded one level for inconsistency (heterogeneity) c Downgraded one level for high risk of bias since exclusion of studies with overall high risk of bias changed results dDowngraded two levels for imprecision since 95% CI is very wide and crosses unity ESA: erythropoiesis‐stimulating agent; IV: intravenous; RR: risk ratio; CI: confidence interval; n.r.: not reported | |||||
| GRADE Working Group grades of evidence (or certainty in the evidence) High certainty: we are very confident that the true effect lies close to that of the estimate of the effect. CI: confidence interval ;ESA: erythropoiesis‐stimulating agent; IV: intravenous; n.r.: not reported RR: risk ratio | |||||
Background
Description of the condition
A widely prevalent complication in patients suffering from cancer is the deficiency of haemoglobin‐containing red blood cells (RBCs), referred to as anaemia (Knight 2004). The prevalence and incidence of anaemia in cancer patients is high, and it is an important contributor to morbidity and poor performance status (Ludwig 2004). The reported age‐adjusted incidence rate of cancer in the USA in 2010 was 457.5 per 100,000 persons, with the age‐adjusted death rate of 171.8 per 100,000 persons per year (Howlader 2014). The European prospective survey found a prevalence of anaemia in cancer patients of 39.3% at enrolment, increasing to 67% during the six months observation period (Ludwig 2004). Patients suffering from haematological malignancies frequently experience anaemia. This frequency ranges from 30% to 40% in patients diagnosed with Non‐Hodgkin's Lymphomas (NHL) or Hodgkin's lymphoma (HL), up to 70% of patients with multiple myeloma, and higher in patients with myelodysplastic syndrome (Garton 1995; Tonia 2012). The intensity of anaemia has been classified, by the National Cancer Institute (NCI), based on the following haemoglobin (Hb) values (Groopman 1999):
-
grade 0, within normal limits, Hb values are 12.0 g/dL to 16.0 g/dL for women and 14.0 g/dL to 18.0 g/dL for men;
-
grade 1, mild (Hb 10 g/dL to normal limits);
-
grade 2, moderate (Hb 8.0 g/dL to 10.0 g/dL);
-
grade 3, serious/severe (Hb 6.5 g/dL to 8.0 g/dL); and
-
grade 4, life‐threatening (Hb less than 6.5 g/dL).
Anaemia of chronic disorders (ACD)
Due to an involvement of malignant bone marrow cells, the incidence rate of patients with symptomatic anaemia at the stage solid tumour diagnosis, prior to treatment, ranges from 31% to 50%. Furthermore, patients in advanced stages of haematological malignancies experience progressive anaemia with an incidence proportion of higher than 50% (Knight 2004; Ludwig 2004; Link 2013). With the exclusion of causes, such as iron or vitamin deficiencies, occult bleeding or pure RBC anaemia, progressive anaemia can be categorised as "anaemia of chronic disorders" (ACD). ACD is characterised by a close interaction of malignant cells and the patient's immune system, leading to inflammation. The severity of symptoms of anaemia varies among patients according to the progression of said disorder, including headaches, tachycardia, shortness of breath and palpitation. Chronic anaemia on the other hand may result in severe organ damage within the cardiovascular system, immune system and central nervous system (Nissenson 1992; Ludwig 2001).
Chemotherapy‐induced anaemia (CIA)
The percentage of cancer patients, developing anaemia as a result of chemotherapy is estimated to be approximately 83% (Barrett‐Lee 2006). CIA is most commonly reported in patients with gynaecological tumours, with a frequency of 81% to 88%, as well as patients with lung carcinoma (77% to 83%) (Ludwig 2004). CIA may manifest comparable to mild‐to‐moderate anaemia, with symptoms including dyspnoea, fatigue and weakness. These restrictive symptoms may lead to a decrease in quality of life and performance status of the patients (Littlewood 2001b; Stasi 2003; Mancuso 2006).
Radiotherapy‐induced anaemia (RIA)
RIA is reported in 38% of all treated patients, with a repeating pattern of patients with gynaecological tumours and lung carcinoma showing the highest incidence proportion, with 54% and 51%, respectively. Moreover, the rate at which patients develop anaemia due to a combination of radiotherapy and chemotherapy is approximately 62% (Ludwig 2004).
Description of the intervention
Therapeutic alternatives are either treating the underlying cause or providing supportive care through RBC transfusions, recombinant human erythropoiesis‐stimulating agents (ESAs), or iron (Rodgers 2012). Studies have shown a correlation of serious thromboembolic events and increased mortality of patients undergoing RBC transfusions (Bohlius 2006; Khorana 2008; Mercadante 2009).
Erythropoiesis‐stimulating agents (ESAs)
ESAs contain proteins, which in response to a hypoxic environment stimulate the production of RBCs within the bone marrow. In the Cochrane Review evaluating ESAs versus no ESAs in cancer patients, Tonia and colleagues found that this interaction leads to a significant reduction of RBC transfusions (risk ratio (RR) 0.65 (95% confidence interval (CI) 0.62 to 0.68)) needed for the treatment of anaemic cancer patients and hence the potential to an increase in quality of life (QoL) (Tonia 2012). Even though, ESAs are thought to be an effective treatment in cancer patients suffering from chronic anaemia, ESAs have been shown to increase the risk of venous thromboembolisms by up to 57% (Bennett 2008). The risk ratio for thromboembolic complications was increased in patients receiving ESAs compared to controls (RR 1.52, 95% CI 1.33 to 1.73) (Tonia 2012). In addition, there is strong evidence for increased on‐study mortality for patients receiving ESA (hazard ratio (HR) 1.17; 95% CI 1.06 to 1.29)(Tonia 2012).
Iron supplements
Iron supplements have been proposed as an adjunct to ESAs for the treatment of anaemic, as well as CIA/RIA patients. This is due to the fact that patients treated with ESAs alone have shown to produce iron‐poor erythrocytes in the bone marrow, leading to a functional iron deficiency (FID) (Eschbach 2005). Mhaskar and colleagues reported iron supplementation to have a positive effect on the reduction in the risk for RBC transfusions (RR 0.74 (95% CI 0.60 to 0.92)) and increased Hb levels (mean difference (MD) 0.48 (95% CI 0.10 to 0.86)) when administered with ESAs (Mhaskar 2016). However, none of the eight included randomised controlled trials (RCTs) reported overall survival (Mhaskar 2016).
Both oral and intravenous (IV) iron therapy, including low‐molecular weight iron dextran, iron sucrose and ferric gluconate, have shown adverse effects, such as constipation, nausea, emesis and diarrhoea (Fletes 2001; Mamula 2002; Chertow 2004; Chertow 2006). Intravenous iron might also lead to allergic reactions and pseudoanaphylaxis (anaphylactoid reactions), causing an anaphylaxis, in approximately 68 per 10,000 patients (Wang 2015).
ESAs plus iron supplements
Some evidence has been published, showing an increased response of ESAs, increased Hb levels, greater haematopoietic response and improved health‐related quality of life in patients being treated with both ESAs and IV iron Bastit 2008; Bellet 2007; Hedenus 2007; Pedrazzoli 2008).
How the intervention might work
ESAs contain an acidic glycoprotein‐hormone, which facilitates the production of erythrocytes in the bone marrow. While the desired effect of an increase of Hb levels is achieved with the use of ESAs, the treatment without iron supplements often results in patients developing FID. FID is a result of ESAs reducing the amount of circulating iron molecules, hence yielding iron‐poor erythrocytes in the bone marrow. Therefore, adjuvant iron is used to prevent the development of FID (Mhaskar 2016). Furthermore, iron supplements may reduce the required ESA dose to obtain desired Hb levels (Auerbach 2008).
Why it is important to do this review
Recommendations in guidelines are inconsistent regarding the usage of ESAs and iron, especially regarding IV iron. The guidelines by the American Society of Hematology (ASH) and the American Society of Clinical Oncology (ASCO) do not consider the usage of IV iron as standard of care (Rizzo 2010). The European Organisation for Research and Treatment of Cancer (EORTC) (Bokemeyer 2007) guidelines found evidence for an improved response to ESA with IV iron, but point out that the doses and schedules for IV iron supplementation are not yet well‐defined (Bokemeyer 2007). The guidelines by the European Society of Medical Oncology (ESMO) suggest additional iron to ESAs for iron‐deficient patients (Schrijvers 2010), and the National Comprehensive Cancer Network (NCCN) guidelines consider IV iron supplementation for absolute or functional iron deficiency (Rodgers 2012).
In order to provide the highest level of evidence for treatment decisions in cancer patients, we conducted a network meta‐analysis that summarises the direct and indirect evidence for different preventive and therapeutic strategies for anaemia due to chemotherapy, radiotherapy or chronic disorders in cancer patients.
Objectives
The objectives were to systematically review the effect of intravenous (IV) iron, oral iron or no iron in combination with or without erythropoiesis‐stimulating agents (ESAs) on the prevention or alleviation of anaemia in cancer patients and to generate treatment rankings using network meta‐analyses.
Methods
Criteria for considering studies for this review
Types of studies
The protocol for this review was published as a Cochrane protocol and registered with PROSPERO (Weigl 2017). We considered only randomised controlled trials (RCTs). We included both full‐text and abstract publications if sufficient information is available on study design, characteristics of participants and interventions provided.
Types of participants
We included trials on patients of any age with solid cancer and/or haematological malignancy undergoing chemotherapy, radiotherapy or no anti‐cancer therapy. We applied no gender or ethnicity restrictions. We exclusively included studies in which participants were anaemic or at risk for anaemia from chemotherapy, radiotherapy or combination therapy, or the underlying malignant disease.
We excluded studies including patients with anaemia pre‐planned for surgery or as a result of surgery, as well as patients suffering from anaemia due to haemolysis.
Types of interventions
Included trials addressed one or multiple of the following interventions:
-
ESA + IV iron;
-
ESA + oral iron;
-
ESA + no iron (including iron if necessary);
-
ESA + iron, unclear application;
-
ESA + placebo;
-
no ESA + IV iron;
-
no ESA + oral iron;
-
no treatment (including iron if necessary);
-
no ESA + iron, unclear application;
-
placebo;
-
placebo + IV iron;
-
placebo + oral iron;
-
placebo + iron, unclear application.
We used definitions from studies; most excluded administration of interventions of interest pre‐randomisation.
All interventions were compared to each other using a network meta‐analysis (Figure 1). We assumed that any patient that meets the inclusion criteria is, in principle, equally likely to be randomised to any of the eligible interventions. We grouped interventions by merging doses and administration frequencies according to the product characteristics. Our main comparator no treatment means that patients received no treatment for anaemia while standard therapies for cancer could be given.

Overview of the ideal network (created with yEd)
We decided to combine the treatments no iron and iron if necessary.
To minimise the uncertainty in the network, we decided to exclude the treatment iron unclear because it is not known whether the patient has received iron or not.
Types of outcome measures
We estimated the relative ranking of the competing interventions according to the following outcomes:
-
on‐study mortality (deaths occurring up to 30 days after the active study period);
-
haematological response (proportion of participants with an increase in haemoglobin (Hb) level of 2 g/dL or more, or increase in haematocrit (Hct) of six percentage points or more, unrelated to transfusion);
-
number of patients with red blood cell transfusions;
-
number of red blood cell (RBC) transfusions;
-
overall mortality (longest follow‐up available); and
-
adverse events (AEs) during the whole study period.
Primary outcomes
As primary outcome we evaluated on‐study mortality defined as deaths occurring up to 30 days after the active study period. This is due to the qualitatively low number of studies reporting long follow‐up time periods. Long‐term follow‐up is prone to be less precise when it comes to recording the number of deaths, hence on‐study mortality is more appropriate as a primary outcome measure.
Secondary outcomes
We analysed the following outcomes as secondary outcomes:
-
haematological (Hb) response;
-
number of patients with RBC transfusions;
-
number of RBC transfusions;
-
overall mortality; and
-
AEs.
Search methods for identification of studies
We adapted search strategies as suggested in Chapter Four of the Cochrane Handbook for Systematic Reviews of Interventions (Lefebvre 2021). We applied no language restrictions to reduce language bias. Only trials that compare at least two of the interventions were eligible. We searched for all possible comparisons formed by the interventions of interest.
Electronic searches
We searched the following databases and sources:
-
databases of medical literature:
-
the Cochrane Central Register of Controlled Trials (CENTRAL, 2021, Issue 06) in the Cochrane Library (searched 16 June 2021) (Appendix 1);
-
MEDLINE (Ovid; Epub Ahead of Print, In‐Process & Other Non‐Indexed Citations, Daily and Versions) (1946 to 15 June 2021) (searched 16 June 2021) (Appendix 2);
-
Embase (Ovid) (1972 to 15 June 2021) (searched 16 June 2021) (Appendix 3);
-
-
conference proceedings of annual meetings of the following societies for abstracts, if not included in CENTRAL (2010 to June 2021):
-
American Society of Hematology;
-
American Society of Clinical Oncology;
-
European Hematology Association;
-
-
databases of ongoing trials:
-
ClinicalTrials.gov (www.clinicaltrials.gov) (searched 16 June 2021) (Appendix 4);
-
World Health Organization International Clinical Trials Registry Platform (ICTRP) (www.who.int/trialsearch) (searched 16 June 2021) (Appendix 5);
-
-
databases and websites of relevant institutions, and organisations (e.g. pharmaceutical industries).
Searching other resources
-
Handsearching of references:
-
references of all identified trials and relevant review articles; current treatment guidelines as further literature.
-
We used the following sources to identify the studies for this network meta‐analysis:
-
previous Cochrane Reviews on the effect of ESAs on cancer patients with anaemia, as well as patients with CIA (Tonia 2012; Mhaskar 2016); and
-
reference lists of other systematic reviews and meta‐analyses.
Data collection and analysis
Selection of studies
Two of three review authors (AA, BS, NS) each independently screened results of search strategies for eligibility for this review by reading all abstracts. In cases of disagreement, we obtained the full‐text publication. If no consensus could be reached, we consulted a third review author (Lefebvre 2021).
We documented the process of study selection in a flow chart, as recommended by the Preferred Reporting Items for Systematic Reviews and Meta‐Analyses (PRISMA) statement (Moher 2009), showing total numbers of retrieved references and numbers of included and excluded studies.
Data extraction and management
Two of three review authors (AA, MH, NS) each extracted the data independently according to Chapter Five of the Cochrane Handbook for Systematic Reviews of Interventions (Li 2021). We contacted authors of individual studies to ask for additional information, if required. We used a standardised data extraction form containing the following items:
-
general information:
-
author, title, source, publication date, country, language, duplicate publications;
-
-
risk of bias assessment:
-
allocation concealment, blinding (participants, personnel, outcome assessors), incomplete outcome data, selective outcome reporting, other sources of bias;
-
-
study characteristics:
-
trial design, aims, setting and dates, source of participants, inclusion/exclusion criteria, subgroup analysis, treatment cross‐overs, compliance with assigned treatment, length of follow‐up;
-
-
participant characteristics:
-
patient's age, gender, number of participants recruited/allocated/evaluated, participants lost to follow‐up, type of treatment, underlying disease, newly diagnosed or relapsed;
-
-
interventions:
-
placebo use, ESA‐dose, iron‐dose, dosing regimen, duration, route of administration, RBC transfusion trigger, co‐medications with dose, co‐treatment, route and timing; and
-
-
outcomes:
-
on‐study mortality, haematological response, overall survival, AEs, number of RBC transfusions.
-
Data on potential effect modifiers
We extracted from each included study data on the following.
-
Intervention and population characteristics that may act as effect modifiers (age, sex, haemoglobin value at baseline, cancer type, type of therapy, type of ESA)
-
Year of publication
Assessment of risk of bias in included studies
Two of four review authors (AA, AH, MH, NS) each independently assessed risk of bias for each study using the following criteria, as outlined in Chapter 8 of the Cochrane Handbook for Systematic Reviews of Interventions (Higgins 2011):
-
sequence generation;
-
allocation concealment;
-
blinding (participants, personnel, outcome assessors);
-
incomplete outcome data;
-
selective outcome reporting; and
-
other sources of bias.
We made a judgement for each criterion, using one of the following categories:
-
'low risk': if the criterion is adequately fulfilled in the study (i.e. the study is at low risk of bias for the given criterion);
-
'high risk': if the criterion is not fulfilled in the study (i.e. the study is at high risk of bias for the given criterion); and
-
'unclear': if the study report does not provide sufficient information to allow a clear judgement, or if risk of bias is unknown for one of the criteria listed above.
Studies with two domains judged as high risk of bias were overall classified as having a high risk of bias.
Measures of treatment effect
We used intention‐to‐treat data. For binary outcomes, we used risk ratios (RRs) with 95% confidence intervals (CIs) as the measure of treatment effect. For time‐to‐event outcomes, we used hazard ratios (HRs) and their 95% CIs. Data were extracted from publications according to Parmar 1998 and Tierney 2007. We calculated continuous outcomes as mean differences (MDs) with 95% CIs. We did not expect continuous outcomes assessed with different instruments, so standardised mean difference (SMD) was not required.
Relative treatment ranking
We obtained a treatment hierarchy for each outcome using P scores (Rücker 2015). P scores allow ranking treatments on a continuous 0 to 1 scale in a frequentist network meta‐analysis.
Unit of analysis issues
In the case of cross‐over trials, only the first period of the trial was analysed.
Studies with multiple treatment groups
As recommended in Chapter 23.3.4 of the Cochrane Handbook for Systematic Reviews of Interventions (Higgins 2021b), for studies with multiple treatment groups, we combined arms as long as they could be regarded as subtypes of the same intervention.
When arms could not be pooled this way, we compared each arm with the common comparator separately. For pairwise meta‐analysis, we split the ‘shared’ group into two or more groups with smaller sample size, and included two or more (reasonably independent) comparisons. For this purpose, for dichotomous outcomes, both the number of events and the total number of patients were divided up, and for continuous outcomes, the total number of participants was divided up with unchanged means and standard deviations. For network meta‐analysis, instead of subdividing the common comparator, we used an approach that accounts for the within‐study correlation between the effect sizes by re‐weighting all comparisons of each multi‐arm study (Rücker 2012; Rücker 2014).
Dealing with missing data
As suggested in Chapter 10.12 of the Cochrane Handbook for Systematic Reviews of Interventions (Deeks 2021), we took the following steps to deal with missing data.
If the number of patients evaluated for a given outcome was not reported, we used the number of patients randomised per treatment arm as denominator. If only percentages but no absolute number of events were reported for binary outcomes, we calculated numerators using percentages. If estimates for mean and standard deviations were missing, we calculated these statistics from reported data whenever possible, using approaches described in Chapter 5.6 of the Cochrane Handbook for Systematic Reviews of Interventions (Li 2021). If standard deviations were missing and we were not able to calculate them from reported data, we calculated values according to a validated imputation method (Furukwa 2006). If data were not reported in a numerical but graphical format, we estimated missing data from figures. We performed sensitivity analyses to assess how sensitive results were to imputing data in some way. We addressed the potential impact of missing data on findings of the review in the Discussion section.
Assessment of heterogeneity
Assessment of clinical and methodological heterogeneity within treatment comparisons
We evaluated the assumption of transitivity epidemiologically by comparing the distribution of the potential effect modifiers across the different pairwise comparisons. For each set of studies, grouped by treatment comparison, we created a table of important clinical and methodological characteristics. We visually inspected the similarity of these factors, including the inclusion and exclusion criteria of every trial in the network.
Assessment of transitivity across treatment comparisons
To infer about the assumption of transitivity, we assessed whether the included interventions are similar when they are evaluated in RCTs with different designs. Furthermore, we compared the distribution of the potential effect modifiers across the different pairwise comparisons.
Assessment of statistical heterogeneity and inconsistency
Pairwise meta‐analyses
For each direct comparison, we visually inspected the forest plots as well as Cochran’s Q based on a Chi2 statistic and the I2 statistic in order to detect the presence of heterogeneity. We interpreted I2 values according to Chapter 10.10.2 of the Cochrane Handbook for Systematic Reviews of Interventions (Deeks 2021). We used the P value of the Chi2 test only for describing the extent of heterogeneity and not for determining statistical significance. In addition, we reported Ʈ2, the between‐study variance in random‐effects meta‐analysis.
Network meta‐analysis
A very important pre‐supposition for using network meta‐analysis is to make sure that the network is consistent, meaning that direct and indirect evidence on the same comparisons agree. Inconsistency can be caused by incomparable inclusion and exclusion criteria of the trials in the network.
To evaluate the presence of inconsistency locally, we used the Bucher method for single loops of evidence (Bucher 1997), as described for example in Dias 2013. For each closed loop, we calculated the difference between direct and indirect evidence together with its 95% confidence interval (CI). We used loop‐specific z‐tests to infer about the presence of inconsistency in each loop. We used graphical representation of estimates of inconsistency together with 95% CIs and reported the percentage of inconsistent loops in the network. It should be noted that in a network of evidence there may be many loops and with multiple testing and there was an increased likelihood that we might find an inconsistent loop by chance. Therefore, we were cautious deriving conclusions from this approach.
To evaluate the presence of inconsistency in the entire network, we gave the generalised heterogeneity statistic Qtotal and the generalised I2 statistic, as described in Schwarzer 2015. We used the decomp.design command in the R package netmeta (R 2019; netmeta 2021) for decomposition of the heterogeneity statistic into a Q statistic for assessing the heterogeneity between studies with the same design and a Q statistic for assessing the design's inconsistency to identify the amount of heterogeneity/inconsistency within as well as between designs. Furthermore, we created a netheat plot (Krahn 2013), a graphical tool for locating inconsistency in network meta‐analysis, using the command netheat in the R package netmeta. We gave Qtotal and its components as well as net heat plots based on fixed‐effect and random‐effects models to identify differences between these approaches. For random‐effects models, we reported Ʈ2.
If we found substantive heterogeneity and/or inconsistency, we explored possible sources by performing pre‐specified sensitivity and subgroup analyses (see below). In addition, we reviewed the evidence base, reconsidered inclusion criteria as well as discussed the potential role of unmeasured effect modifiers to identify further sources.
Assessment of reporting biases
In pairwise comparisons with at least 10 trials, we examined the presence of small‐study effects graphically by generating funnel plots. We used linear regression tests (Egger 1997) to test for funnel plot asymmetry. A P value less than 0.1 was considered significant for this test (Sterne 2011). We examined the presence of small‐study effects for the primary outcome only.
Data synthesis
Methods for direct treatment comparisons
We performed analyses according to recommendations provided in Chapter 10 of the Cochrane Handbook for Systematic Reviews of Interventions (Deeks 2021), and used R (R 2019) for analyses.
If adequate, we performed standard pairwise meta‐analyses using a random‐effects model for every treatment comparison with at least two studies. We calculated corresponding 95% confidence intervals for all analyses. Since the focus of this review is on the network meta‐analyses, and direct estimates are also reported in the league tables, we refrained from reporting forest plots of pairwise comparisons. When trials were clinically too heterogenous to be combined (e.g. various types of diseases), we performed only subgroup analyses without calculating an overall estimate.
Methods for indirect and mixed comparisons
If the data were considered sufficiently similar to be combined, we performed a network meta‐analysis on all efficacy and safety outcomes using the frequentist weighted least squared approach described by Rücker 2012. We used a random‐effects model, taking into account the correlated treatment effects in multi‐arm studies. We assumed a common estimate for the heterogeneity variance across the different comparisons. To evaluate the extent to which treatments are connected, we gave a network plot for our primary and secondary outcomes. In the case of a network which is not fully connected, all existing subnetworks (subnets) are displayed. For each comparison, we evaluated the estimated treatment effect along with its 95% confidence interval. We graphically presented the results using forest plots, with placebo as reference. We used the R package netmeta (R 2019, netmeta 2021) for statistical analyses.
Subgroup analysis and investigation of heterogeneity
The following subgroup analyses for network meta‐analyses were conducted on all efficacy and safety outcomes, if appropriate:
-
type of iron (iron dextran, ferrous gluconate, ferrous sulphate, etc.);
-
route of iron administration (IV versus oral);
-
type of ESA (epoetin versus darbepoetin);
-
type of anti‐cancer therapy (chemotherapy, radiotherapy, no treatment);
-
cancer type; and
-
duration of follow‐up.
Sensitivity analysis
To test the robustness of the results, we conducted fixed‐effect pairwise and network meta‐analyses. We reported the estimates of the fixed‐effect only if they showed a difference to the random‐effects model. We explored the influence of quality components with regard to low and high risk of bias for each outcome by excluding studies with at least two domains with high risk of bias. For overall mortality, blinding was always assessed as low, so for this outcome we excluded studies with at least one domain with high risk of bias.
Summary of findings and assessment of the certainty of the evidence
Review authors AA and NS independently rated the certainty of the evidence of each prioritised outcome. We used GRADEpro (Grades of Recommendation, Assessment, Development and Evaluation) software to rank the certainty of the evidence using the guidelines provided in Chapter 14.2 of the Cochrane Handbook for Systematic Reviews of Interventions (Schuenemann 2021) and specifically for network meta‐analyses (Puhan 2014). The GRADE working group suggests to assess the certainty of the evidence of no more than seven outcomes, and for each outcome included in the summary of findings tables. Therefore, only for the outcomes that are the most critical or important for decision‐making (Guyatt 2013).
The GRADE approach used five considerations (study limitations, consistency of effect, imprecision, indirectness and publication bias) to assess the certainty in the body of evidence for each outcome. The GRADE approach used the following criteria for assigning grade of evidence.
-
High certainty: we are very confident that the true effect lies close to that of the estimate of the effect.
-
Moderate certainty: we are moderately confident in the effect estimate; the true effect is likely to be close to the estimate of the effect, but there is a possibility that it is substantially different.
-
Low certainty: our confidence in the effect estimates is limited; the true effect may be substantially different from the estimate of the effect.
-
Very low certainty: we have very little confidence in the effect estimate; the true effect is likely to be substantially different from the estimate of the effect.
The GRADE system used the following criteria for assessing a certainty level to a body of evidence (Schuenemann 2021).
-
High: randomised trials; or double‐upgraded observational studies.
-
Moderate: downgraded randomised trials; or upgraded observational studies.
-
Low: double‐downgraded randomised trials; or observational studies.
-
Very low: triple‐downgraded randomised trials; or downgraded observational studies; or case series/case reports.
We decreased grade if:
-
serious (‐1) or very serious (‐2) risk of bias;
-
important inconsistency (‐1);
-
some (‐1) or major (‐2) uncertainty about indirectness;
-
imprecise data (‐1) or very imprecise data (‐2);
-
high probability of reporting bias (‐1).
We created summary of findings tables on absolute risks in each group, and in these tables, we summarised the evidence on on‐study mortality, number of patients with RBC transfusions, haematological response, overall mortality, thromboembolic events, thrombocytopenia/haemorrhage and hypertension. In the summary of findings tables comparisons of ESA with IV iron, ESA with oral iron, ESA without iron, IV iron alone and oral iron alone against no treatment are displayed.
Results
Description of studies
Results of the search
We identified 11,770 potentially relevant publications through database searches and handsearching. After we removed 4231 duplicates, we excluded a total of 7287 articles due to irrelevancy to our research question. The remaining 252 publications were screened in a full‐text and abstract screening, depending on the availability of resources. Out of 252, we excluded 70 publications after a consensus on the ineligibility of the publication was reached by two review authors. Most of the 70 publications, of which 12 publications were ongoing and 18 were awaiting classification, were excluded because of the wrong intervention. Other reasons for exclusion include wrong comparator or wrong study design.
The total of 182 publications we identified as relevant for our research question, yielded 96 studies including 25,157 participants, which were included in our analysis. The overall numbers of references screened, identified, selected, excluded and included are documented according to the PRISMA flow diagram (Figure 2).

Study flow diagram.
Included studies
All 96 included studies reported in 182 publications fit the inclusion criteria, set in our a‐priori protocol (Weigl 2017). The time‐line of recruitment ranged from late 1988 (Case 1993) to early 2020 (Hajigholami 2021), some studies did not provide information regarding time of recruitment. Detailed information on the included studies is summarised in the Characteristics of included studies table.
Design
All of the included studies consisted of randomised controlled trials (RCTs). Ninety‐three trials were designed as two‐armed RCTs, while three trials were designed as three‐arm comparisons (Auerbach 2004; Henry 2007; Steensma 2011). A total of 31 studies were double‐blinded, while 30 studies were not blinded (open‐label); the remaining 35 studies did not report any information regarding blinding. Furthermore, only one study was conducted single centre (Aravantinos 2003), while 12 studies were multicentric. Most studies did not provide any information of whether they were single‐ or multicentric.
Sample sizes
Sample size among included trials varied from 19 randomised participants (Hedenus 2014) to 2549 participants (Gascon 2019). The average number of included participants among all included trials was 262.
Participants
Participants of any age, with a confirmed malignancy including myelodysplastic syndrome (MDS) were represented within the 96 included trials. Participants included in this analysis were undergoing chemotherapy, radiotherapy, radiochemotherapy, a mix of both therapies or received no anticancer therapy.
Among the included 96 studies, the included participants were diagnosed with haematological malignancy (11 trials), non‐myeloid malignancy (one trial), MDS (two trials), mixed type of tumour (24 trials), and solid tumours (58 trials). The included participants were either female (19 studies), male (six studies) or both (56 trials). In the other 15 trials the gender distribution was not mentioned. In most studies, participants were older than 18 years. Only Ataollah Hiradfar 2018 and Razzouk 2006 included patients of younger age.
Interventions
Treatment groups were represented by any of the following intervention groups:
-
ESA + IV iron;
-
ESA + oral iron;
-
ESA + no iron (including iron if necessary);
-
ESA + iron, unclear application;
-
ESA + placebo;
-
no ESA + IV iron;
-
no ESA + oral iron;
-
no treatment (including iron if necessary);
-
no ESA + iron, unclear application;
-
placebo;
-
placebo + IV iron;
-
placebo + oral iron;
-
placebo + iron, unclear application.
The network graph of the ideal network comparing all different interventions is represented in Figure 1. Control arms were most commonly represented by the intervention group of "ESA + no iron" (67/96). These studies had either mentioned an absence of iron supplementation in their methods section, or had no mention of iron supplementation throughout their publication, including those studies in which iron supplementation was given if necessary. Interventions with explicit mention of iron supplementation, in addition to ESA treatment, were classified as ESA + intravenous iron, oral iron or iron, unclear application. These intervention groups occurred to 10.4%, 14.6% and 7.3%,respectively. One out of 96 studies treated participants with "ESA + placebo". Seven trials were conducted in the absence of ESA (Ansari 2016; Athibovonsuk 2013; Birgegard 2015; Gilreath 2019; Hedenus 2014; Ng 2018; Noronha 2016). These studies analysed the impact of intravenous versus placebo, oral or no iron supplementation for the treatment of cancer‐related anaemia.
Outcomes
Out of 96 trials, 66 trials reported our primary outcome of on‐study mortality. Patients undergoing red blood cell (RBC) transfusions were reported by 77 trials, while only 21 trials reported the number of RBC‐transfusions per patient. Moreover, 32 studies reported the haematological response (haemoglobin (Hb) response), while 80 trials reported overall survival (OS). Adverse events, including thromboembolic events, hypertension, haemorrhage, thrombocytopenia and rash were reported by 61, 28, 17, and 18 studies, respectively.
Ongoing studies
In total, there are 12 ongoing studies. Seven studies gave an exact date of the end of the study, which ranges from late 2017(ChiCTR‐IPR‐16009508; EUCTR2016‐002021‐11‐PL) to mid 2022 (NCT03683810). No data regarding the end of study were available for four studies (ACTRN12620001105932p; ChiCTR‐IPR‐16009059; CTRI/2019/05/019378; KCT0004311). Additionally, one study did not give an exact end date but reported an initial estimate of study duration of two years. It can therefore be assumed that the study most likely ended in 2020 (EUCTR2018‐001669‐17‐GB). Chen 2016 and NCT02731378 had the most patients with 603 patients each and both ended in November 2019. All ongoing studies planned to enrol patients with cancer. However, only five studies gave more information regarding the type of malignancy. Furthermore, six studies investigate the effect of ESA + different forms of iron supplementation (Chen 2016; ChiCTR‐IPR‐16009059; ChiCTR‐IPR‐16009508; KCT0004311; NCT02731378; NCT03683810), while the remaining six studies compared the effect of different forms of iron supplementation without the use of ESA (ACTRN12620001105932p; CTRI/2019/05/019378; EUCTR2016‐002021‐11‐PL; EUCTR2018‐001669‐17‐GB; ISRCTN13370767; Zur Hausen 2016). Detailed information on the ongoing studies is summarised in the Characteristics of ongoing studies table.
Studies awaiting classification
In total, there are 18 studies awaiting classification. Eight studies were completed, but no results were available (CTRI/2011/12/002273; EUCTR2004‐002176‐42‐IT; ISRCTN01957333; ISRCTN61345286; JPRN‐JapicCTI‐050013; JPRN‐JapicCTI‐080582; NCT03776032; NTR250). Another eight studies ended prematurely but no results were available (EUCTR2005‐005658‐37‐DK; EUCTR2006‐000137‐35‐LT; EUCTR2006‐005965‐20‐SE; EUCTR2007‐005777‐57‐GR; EUCTR2008‐002723‐85‐IT; EUCTR2009‐015766‐56‐GR; EUCTR2009‐015767‐14‐SE; EUCTR2011‐001664‐22‐AT). One trial was not started due to being cancelled (EUCTR2008‐001721‐34‐BE) and for one trial there was insufficient information about the status of the trial (Anthony 2011).
Excluded studies
We excluded 27 full‐texts studies for the following reasons:
-
22 wrong interventions (iron unclear) (Antonadou 2001; Bamias 2003; Cabanillas 2012; Carabantes 1999; EPO‐GER‐20 IPD; Fenaux 2017; Gebbia 2003; Hedenus 2002; Heidenreich 2015; Katakami 2008; Kunikane 2001; Leyland‐Jones 2015; List 2016; OBE/EPO‐INT‐03 IPD; P‐174 J&J 2004; Platzbecker 2017; Rosen 2003; Savonije 2005; Silvestris 1995; Suzuki 2008; Thompson 2000; Wurnig 1996);
-
one wrong study design (not randomised) (Mafodda 2017);
-
one wrong study design (two different ESA doses) (Vansteenkiste 2009);
-
one wrong comparator (two different IV iron preparations) (Boccia 2019);
-
one wrong comparator (prophylactic versus Hb‐based erythropoiesis‐stimulating agent administration) (Mountzios 2016);
-
one wrong comparator (iron versus physician choice (no treatment, oral iron, ESA, or both)) (Tesch 2019).
Detailed information on the excluded studies is summarised in the Characteristics of excluded studies table.
Risk of bias in included studies
The risk of bias for the included studies was assessed and graded independently by two of four review authors (AA, AH, MH, NS) under the domains as specified by Cochrane Handbook for Systematic Reviews of Interventions (Higgins 2011).
The risk of bias tables, which are part of the 'Characteristics of included studies' tables, addressed each domain for each study (Figure 3; Figure 4).

Risk of bias summary: review authors' judgements about each risk of bias item for each included study.

Risk of bias graph: review authors' judgements about each risk of bias item presented as percentages across all included studies.
Allocation
All 96 included studies reported that the trials were randomised. Forty‐five studies (47%) described the method of randomisation and were therefore judged as low risk of bias. However, 51 of the 96 studies (53%) did not provide sufficient information concerning the method of randomisation used, and therefore they were judged as unclear risk of selection bias.
Furthermore, 40% (38/96) of the studies provided information regarding the allocation concealment and were therefore judged as having a low risk of bias. 60% (58/96) of the trials were judged as unclear risk of bias, due to insufficient information regarding allocation concealment. Due to being published in abstract form, Toma 2013 could not be evaluated regarding selection bias.
Blinding
Blinding of participants and personnel (performance bias)
Thirty‐one studies (32%) were judged as having low risk of performance bias. Studies having a low risk rating most often reported their trial as being double‐blinded. For 35 studies (37%) blinding of participants and personnel was not reported and we judged them as unclear risk of bias. The remaining 30 studies (31%) were judged as high risk for performance bias since participants and personnel were not blinded.
Blinding of outcome assessment (detection bias)
All included studies were judged as having low risk for blinding of outcome assessment (detection bias) regarding mortality. They were judged as having low risk because mortality is an objective outcome.
For the other outcomes, the outcome assessor was blinded in 31 studies (32%), resulting in low risk of bias. For the remaining 65 studies (68%) blinding of outcome assessment was not reported, we judged as unclear risk of bias.
Incomplete outcome data
Eight studies (8%) of the included studies were classified as having low risk for attrition bias because analysis was most commonly based on the evaluation of the intention‐to‐treat population. The larger part of the evaluated trials did not give information regarding attrition bias. Hence, 90% (86/96) of all included studies were judged as unclear risk of attrition bias. Two trials (2%) among the included studies were deemed to have high risk for attrition bias (Auerbach 2004; Noronha 2016), due to a modification of their intention‐to‐treat (ITT) population for efficacy analysis.
Selective reporting
For 75% (72/96) of the included studies, it was possible to evaluate reporting bias; for the remaining studies no study protocol or study registry entry was available (unclear risk of bias). Seventy‐two out of the 96 trials were classified as having a low risk since there were no inconsistencies in the reported results. The remaining 25% (24/96) did not provide sufficient information to clarify any judgement regarding selective reporting and were therefore judged as unclear risk of bias.
Other potential sources of bias
We assessed 29% (28/96) as having a low risk of other bias, because we did not detect obvious reasons for bias. Due to insufficient information regarding other potential sources of bias, we judged the remaining 71% (68/96) as unclear risk of bias.
Effects of interventions
See: Summary of findings 1 ESA with or without iron versus no treatment; Summary of findings 2 IV or oral iron alone versus no treatment
The main findings are reported in the summary of findings tables (summary of findings Table 1; summary of findings Table 2). Since for most outcomes networks were not fully connected, we decided to report only treatments compared to our main comparator "no treatment" in the summary of findings tables. Results for other subnetworks (subnets) are reported in the text and additional tables.
For binary outcomes, studies with no events in both arms do not provide any indication of either direction or magnitude of the relative treatment effect and were therefore excluded from the analyses. In this section, our main comparator "No treatment" means that patients received no treatment for anaemia, while standard therapies for cancer could be given.
Since the focus of this review is on the network meta‐analyses, and direct estimates are also reported in the league tables, we refrain from reporting forest plots of pairwise comparisons. Forest plots for pairwise comparisons can be found in Tonia 2012 and Mhaskar 2016.
Transitivity
Included trials were similar in clinical and methodological characteristics that could potentially affect the relative treatment effects, thus we assumed the transitivity assumption holds. Distributions of potential effect modifiers across the different pairwise comparisons are displayed in Appendix 6. Since mechanisms and treatment strategies of anaemia in cancer patients are comparable between different cancer types, inclusion of different patient populations with different cancer types was considered unproblematic.
On‐study mortality
Sixty‐six RCTs (N = 17,688) reported on‐study mortality of their participants. Eight studies (Cascinu 1994; Del Mastro 1997; Kurz 1997; Maccio 2010; Moebus 2013; Strauss 2008; Sweeney 1998; Untch 2011) including 1839 participants reported no events and were excluded from the analyses. The network, based on 58 pairwise comparisons, was not fully connected, but consisted of two subnets (Figure 5), with one subnetwork (subnet) consisting of 55 pairwise comparisons and one subnet consisting of only three pairwise comparisons. Eight treatment options could be compared in subnet 1 and three in subnet 2.

Network Graph for outcome on‐study mortality (created with yEd). Red lines: Subnet 1. Green lines: Subnet 2. Orange lines: Subnet 3.
Pairwise comparisons
For five treatment comparisons only one study was included, therefore, no meta‐analysis was performed, and individual study results were reported. For "ESA + no iron" vs. "Placebo," pairwise comparison showed increased on‐study mortality for ESA administration (risk ratio (RR) 1.14, 95% confidence interval (CI) 1.03 to 1.26). Heterogeneity statistics showed no significant heterogeneity between the included studies, with I² = 0% for all pairwise comparisons. Pairwise meta‐analysis showed no further meaningful results. Funnel plot analyses using linear regression tests were performed in pairwise comparisons with at least 10 trials. Analysis of funnel plot asymmetry for the comparisons of "ESA + no iron" with "Placebo", and "ESA + no iron" with "No treatment" did not identify evidence of small‐study effects (P = 0.57, and P = 0.39, respectively) (data not shown).
Network meta‐analysis
For both subnets a network meta‐analysis was performed. A league table with results for all pairwise comparisons is shown in Table 1. In subnet 1, analysis resulted in increased on‐study mortality for "ESA + no iron" compared to "Placebo" (RR 1.14, 95% CI 1.03 to 1.26) as already shown in pairwise meta‐analysis. In subnet 2 no meaningful results were found. Cochran's Q‐test and I² statistics showed no significant heterogeneity between studies (subnet 1: Q = 36.41, df = 48, P = 0.89, I² = 0%, Tau² = 0, subnet 2: Q = 0.24, df = 1, P = 0.62, I² = 0%, Tau2 = 0). Ranking of treatments in both subnets showed no meaningful results since treatment effects had quite large confidence intervals (Figure 6).
| Subnet 1 | |||||||
|---|---|---|---|---|---|---|---|
| Heterogeneity / inconsistency: Q = 36.41, df = 48, P = 0.89; I² = 0%, Tau² = 0 | |||||||
| ESA + IV iron | . | 0.34 [0.01, 8.15] | . | . | . | 0.11 [0.01, 2.04] | . |
| 0.49 [0.02, 12.19] | No ESA + oral iron | 0.70 [0.41, 1.18] | . | . | 0.50 [0.05, 5.34] | . | . |
| 0.34 [0.01, 8.15] | 0.70 [0.41, 1.18] | ESA + oral iron | . | . | . | . | . |
| 0.13 [0.01, 2.34] | 0.27 [0.00, 20.17] | 0.38 [0.01, 27.99] | Placebo | . | . | 0.87 [0.79, 0.97] | . |
| 0.13 [0.01, 2.29] | 0.26 [0.00, 19.73] | 0.37 [0.01, 27.38] | 0.98 [0.78, 1.21] | No treatment | . | 0.90 [0.74, 1.09] | 0.34 [0.08, 1.41] |
| 0.17 [0.00, 8.94] | 0.35 [0.03, 3.95] | 0.50 [0.05, 5.34] | 1.30 [0.01, 174.72] | 1.34 [0.01, 179.66] | Placebo + oral iron | . | . |
| 0.11 [0.01, 2.04] | 0.23 [0.00, 17.61] | 0.34 [0.00, 24.44] | 0.87 [0.79, 0.97] | 0.90 [0.74, 1.09] | 0.67 [0.01, 90.01] | ESA + no iron | . |
| 0.04 [0.00, 1.09] | 0.09 [0.00, 8.41] | 0.13 [0.00, 11.68] | 0.33 [0.08, 1.40] | 0.34 [0.08, 1.41] | 0.25 [0.00, 41.84] | 0.38 [0.09, 1.60] | No ESA + IV iron |
| Subnet 2 | |||||||
| Heterogeneity / inconsistency: Q = 0.24, df = 1, P = 0.62; I² = 0%, Tau² = 0 | |||||||
| Placebo + iron, unclear application | 0.78 [0.51, 1.21] | . | |||||
| 0.78 [0.51, 1.21] | ESA + iron, unclear application | 0.42 [0.12, 1.53] | |||||
| 0.33 [0.08, 1.28] | 0.42 [0.12, 1.53] | No ESA + iron, unclear application | |||||
Upper triangle: direct estimates; lower triangle: network estimates. Only subnets with >1 designs. Comparisons should be read from left to right, and the estimate is in the cell in common between the column‐defining treatment and the row‐defining treatment. Effect estimates are presented as risk ratios (RR) with corresponding 95% confidence interval. For the network estimates in the lower triangle an RR below 1.0 favours the column‐defining treatment and for the direct estimates in the upper triangle an RR below 1.0 favours the row‐defining treatment (less presence of deaths). To obtain RRs for comparisons in the opposing direction, reciprocals should be taken. Treatments are ordered by P‐Score (ascending).
Subnet 1: No. of studies: 55. No. of treatments: 8. No. of pairwise comparisons: 55. No. of designs: 7
Subnet 2: No. of studies: 3. No. of treatments: 3. No. of pairwise comparisons: 3. No. of designs: 2

Forest plot for outcome on‐study mortality. (a) Subnet 1. Reference treatment: No treatment (b) Subnet 2: Reference treatment: No ESA + iron, unclear application. Treatments are ordered by P score (descending). RR: risk ratio. CI: confidence interval.
We rated the certainty of the evidence for on‐study mortality according to the GRADE approach for "ESA + intravenous IV) iron", "ESA + oral iron", "ESA + no iron", "No ESA + Iv iron" and "No ESA + oral iron" compared to our main comparator "No treatment", respectively. We found that treatment with ESA and IV iron and treatment with ESA and oral iron may decrease or increase on‐study mortality compared to no treatment (low certainty). We found that treatment with ESA alone probably slightly increases on‐study mortality compared to no treatment (moderate certainty). Additionally, we found that treatment with IV iron alone may increase and treatment with oral iron alone may increase or decrease on‐study mortality compared to no treatment (low certainty). Our main reason for downgrading was imprecision. Reasons for downgrading are provided in the summary of findings tables (summary of findings Table 1; summary of findings Table 2).
Since there were no closed loops in the networks, inconsistencies could not be statistically analysed.
Haematological response
Thirty‐two studies (N = 7314) reported haematological response, including three three‐arm studies. All studies reported at least one event and could be included in the analyses. The network was not fully connected, but consisted of two subnets (Figure 7) with one network consisting of 37 pairwise comparisons and one of only one pairwise comparison. Seven treatment options could be compared in subnet 1 and two in subnet 2.

Network graph for outcome Hb response (created with yEd). Red lines: Subnet 1. Green line: Subnet 2.
Pairwise comparisons
Pairwise comparisons showed a benefit for "ESA + no iron" compared to "Placebo" (RR 3.18, 95% CI 2.58 to 3.93) and to "No treatment" (RR 5.28, 95% CI 3.83 to 7.28). However, statistical tests suggest moderate heterogeneity for the studies comparing "ESA + no iron" and "No treatment" (I² = 44%, P = 0.09) and moderate to substantial heterogeneity for the studies comparing "ESA + no iron" and "Placebo" (I² = 57%, P < 0.01). "ESA + IV iron" showed a benefit compared to "ESA + no iron" (RR 1.25, 95% CI 1.17 to 1.36). Combination of ESA and oral iron also showed a beneficial effect compared to oral iron alone (RR 3.45, 95% CI 1.62 to 7.31). Furthermore, "ESA + iron, unclear application" showed a benefit compared to "Placebo + iron, unclear application" (RR 2.29, 95% CI 1.80 to 2.93) (data not shown).
Network meta‐analysis
For this outcome, subnet 1 could be examined in network meta‐analysis. The second network consisted only of one two‐arm study (Witzig 2005). Results of network meta‐analysis are illustrated in Table 2. "ESA + IV iron" resulted in higher Hb response compared to "ESA + no iron" (RR 1.29, 95% CI 1.09 to 1.54), "Placebo" (RR 3.95, 95% CI 3.10 to 5.04), "No ESA + oral iron" (RR 3.96, 95% CI 1.68 to 9.33) and "No treatment" (RR 6.71, 95% CI 4.93 to 9.14). Administration of "ESA + placebo" resulted in higher Hb response compared to "Placebo" (RR 3.67, 95% CI 2.42 to 5.58), "No ESA + oral iron" (RR 3.67, 95% CI 1.49 to 9.04) and "No treatment" (RR 6.23, 95% CI 3.93 to 9.87). Additionally, "ESA + oral iron" and "ESA + no iron" had a higher haemoglobin (Hb) response compared to "Placebo" (RR 3.45, 95% CI 2.53 to 4.70; RR 3.06, 95% CI 2.58 to 3.63), "No ESA + oral iron" (RR 3.45, 95% CI 1.50 to 7.90; RR 3.06, 95% CI 1.28 to 7.30) and "No treatment" (RR 5.85, 95% CI 4.06 to 8.42; RR 5.19, 95% CI 4.02 to 6.71). Finally, administration of "Placebo" resulted in higher Hb response compared to "No treatment" (RR 1.70, 95% CI 1.25 to 2.31). Cochran's Q‐test and I² statistics showed moderate heterogeneity between studies (subnet 1: Qtotal = 57.45, df = 28, P < 0.01 / Qwithin = 51.30, df = 25, P < 0.01 / Qbetween = 6.14, df = 3, P = 0.10, I² = 51.3%, Tau² = 0.0321). For subnet 1 a treatment ranking could be conducted. In subnet 1 "ESA + IV iron" was ranked highest compared to "No treatment" (P score: 0.92) (Figure 8). The ranking also suggests higher efficacy for ESA administration compared to placebo and no administration of ESA.
| Subnet 1 | ||||||
|---|---|---|---|---|---|---|
| Heterogeneity / inconsistency: Qtotal = 57.45, df = 28, P < 0.01 / Qwithin = 51.30, df = 25, P < 0.01 / Qbetween = 6.14, df = 3, P = 0.10; I² = 51.3%, Tau² = 0.0321 | ||||||
| ESA + IV iron | 1.04 [0.71, 1.52] | 1.14 [0.91, 1.43] | 1.32 [1.11, 1.57] | . | . | . |
| 1.08 [0.76, 1.53] | ESA + placebo | 1.03 [0.70, 1.51] | . | . | . | . |
| 1.15 [0.92, 1.43] | 1.07 [0.75, 1.51] | ESA + oral iron | 0.97 [0.67, 1.41] | . | 3.45 [1.50, 7.90] | . |
| 1.29 [1.09, 1.54] | 1.20 [0.82, 1.76] | 1.13 [0.87, 1.46] | ESA + no iron | 3.06 [2.58, 3.63] | . | 5.19 [4.02, 6.71] |
| 3.95 [3.10, 5.04] | 3.67 [2.42, 5.58] | 3.45 [2.53, 4.70] | 3.06 [2.58, 3.63] | Placebo | . | . |
| 3.96 [1.68, 9.33] | 3.67 [1.49, 9.04] | 3.45 [1.50, 7.90] | 3.06 [1.28, 7.30] | 1.00 [0.41, 2.43] | No ESA + oral iron | . |
| 6.71 [4.93, 9.14] | 6.23 [3.93, 9.87] | 5.85 [4.06, 8.42] | 5.19 [4.02, 6.71] | 1.70 [1.25, 2.31] | 1.70 [0.69, 4.20] | No treatment |
Upper triangle: direct estimates; lower triangle: network estimates. Only subnets with >1 designs. Comparisons should be read from left to right, and the estimate is in the cell in common between the column‐defining treatment and the row‐defining treatment. Effect estimates are presented as risk ratios (RR) with corresponding 95% confidence interval. For the network estimates in the lower triangle an RR above 1.0 favours the column‐defining treatment and for the direct estimates in the upper triangle an RR above 1.0 favours the row‐defining treatment (more presence of haemoglobin responses). To obtain RRs for comparisons in the opposing direction, reciprocals should be taken. Treatments are ordered by P‐Score (ascending).
Subnet 1: No. of studies: 31. No. of treatments: 7. No. of pairwise comparisons: 37. No. of designs: 7

Forest plot for outcome Hb response. (a) Subnet 1. Reference treatment: No treatment. Treatments are ordered by P‐Score (descending). RR: risk ratio. CI: confidence interval.
We rated the certainty of the evidence for Hb response according to the GRADE approach for "ESA + IV iron", "ESA + oral iron", "ESA + no iron", "No ESA + IV iron" and "No ESA + oral iron" compared to our main comparator "No treatment", respectively. Nevertheless, we could not rate the certainty of the evidence for "No ESA + IV iron" as this treatment is not included in our network. We found that treatment with ESA and IV iron, ESA and oral iron and ESA without iron probably increases Hb response compared to no treatment (moderate certainty). Additionally, treatment with oral iron alone may increase Hb response compared to no treatment (low certainty). Our main reasons for downgrading were inconsistency and imprecision. Reasons for downgrading are provided in the summary of findings tables (summary of findings Table 1; summary of findings Table 2).
For the closed loops in subnet 1, inconsistencies could be analysed. For "ESA + IV iron" vs. "ESA + no iron" there is a clear difference between direct and indirect estimate, but the confidence intervals are overlapping. For all other comparisons, no noticeable disagreements between direct and indirect estimates were found (Table 3, Figure 9). The netheat plot also showed small signs of inconsistencies for the comparison "ESA + IV iron" vs. "ESA + no iron" (Figure 10).
| Comparison | No. of studies | Network estimate | Direct estimate | Indirect estimate | Test |
|---|---|---|---|---|---|
| ESA + IV iron vs. | 6 | 1.29 [1.09, 1.54] | 1.32 [1.11, 1.57] | 0.53 [0.17, 1.67] | 0.1234 |
| ESA + IV iron vs. | 4 | 1.15 [0.92, 1.43] | 1.14 [0.91, 1.43] | 1.25 [0.47, 3.32] | 0.8565 |
| ESA + IV iron vs. | 1 | 1.08 [0.76, 1.53] | 1.04 [0.71, 1.52] | 1.29 [0.54, 3.06] | 0.6559 |
| ESA + no iron vs. | 2 | 0.89 [0.69, 1.15] | 1.03 [0.71, 1.50] | 0.77 [0.54, 1.11] | 0.2792 |
| ESA + oral iron vs. | 1 | 0.94 [0.66, 1.33] | 0.97 [0.66, 1.43] | 0.79 [0.34, 1.84] | 0.6559 |
Estimates are reported as risk ratios with corresponding 95% confidence interval. Result of test for disagreement between direct and indirect evidence reported as p‐value. Only comparisons for which both direct and indirect evidence exists are shown.

Comparison of direct and indirect evidence (in closed loops) for outcome Hb response. RR: risk ratio. CI: confidence interval.

Netheat plot for outcome hb response (random effects model).
Red blood cell transfusions
Seventy‐seven RCTs (N = 20,411) reported numbers of patients with red blood cell transfusions. Two studies (Hedenus 2014; Zhao 2018) including 99 participants reported no events and were therefore excluded from the analyses. The network, based on 81 pairwise comparisons, was not fully connected, but consisted of two subnets (Figure 11) with eight interventions in one network and three in the other one.

Network graph for outcome red blood cell transfusion (created with yEd). Red lines: Subnet 1. Green lines: Subnet 2.
Pairwise comparisons
Pairwise comparisons showed a lower risk for red blood cell transfusions for "ESA + no iron" compared to "Placebo" (RR 0.66, 95% CI 0.60 to 0.73) and to "No treatment" (RR 0.56, 95% CI 0.46 to 0.68). However, statistical tests suggest substantial heterogeneity for both comparisons (I² = 62%, P < 0.01 and I2 = 74%, P < 0.01). Combination of ESA and oral iron also showed a decreased need for red blood cell transfusions compared to oral iron alone (RR 0.45, 95% CI 0.36 to 0.55) and "ESA + no iron" (RR 0.43, 95% CI 0.19 to 0.99). Cochran's Q‐test and I² statistics showed no significant heterogeneity for these pairwise comparisons (I2 = 0%, P = 0.93 and I2 = 0%, P = 0.97). Additionally, "ESA + IV iron" showed a lower risk for red blood cell transfusions compared to "ESA + no iron" (RR 0.75, 95% CI 0.58 to 0.96). Cochran's Q‐test and I² statistics showed no significant heterogeneity for this pairwise comparison (I2 = 0%, P = 0.67). Furthermore, "ESA + iron, unclear application" showed a decreased need for transfusions compared to "No ESA + iron, unclear application" (RR 0.46, 95% CI 0.34 to 0.63). Cochran's Q‐test and I² statistics showed no significant heterogeneity for this pairwise comparison (I2 = 12%, P = 0.33). (data not shown)
Network meta‐analysis
For this outcome, both subnets could be examined in network meta‐analyses. Results of network meta‐analysis are illustrated in Table 4. "ESA + oral iron" resulted in lower need for red blood cell transfusions compared to "No ESA + IV iron" (RR 0.54, 95% CI 0.32 to 0.90), "Placebo" (RR 0.44, 95% CI 0.27 to 0.72), "No ESA + oral iron" (RR 0.43, 95% CI 0.33 to 0.57) and "No treatment" (RR 0.40, 95% CI 0.24 to 0.66). Administration of "ESA + IV iron" and "ESA + placebo" resulted in lower risk for need for red blood cell transfusions compared to "No ESA + oral iron" (RR 0.48, 95% CI 0.29 to 0.80; RR 0.49, 95% CI 0.25 to 0.97) and "No treatment" (RR 0.44, 95% CI 0.31 to 0.63; RR 0.45, 95% CI 0.22 to 0.91). Administration of "ESA + IV iron" further resulted in a lower risk for red blood cell transfusions compared to "Placebo" (RR 0.49, 95% CI 0.35 to 0.68). Additionally, "ESA + no iron" resulted in lower need for red blood cell transfusions compared to "Placebo" (RR 0.65, 95% CI 0.59 to 0.73) and "No treatment" (RR 0.59, 95% CI 0.51 to 0.69). In subnet 2, "ESA + iron, unclear application" and "Placebo + iron, unclear application" showed reduced need for red blood cell transfusions compared to "No ESA + iron, unclear application" (RR 0.46, 95% CI 0.33 to 0.64; RR 0.63, 95% CI 0.40 to 0.98). Cochran's Q‐test and I² statistics showed moderate to substantial heterogeneity between studies for subnet 1 (Qtotal = 162.04, df = 65, P < 0.01 / Qwithin = 159.35, df = 61, P < 0.01 / Qbetween = 2.68, df = 4, P = 0.61, I² = 59.9%, Tau² = 0.0447) and no statistical meaningful heterogeneity for subnet 2 (Q = 5.00, df = 4, P = 0.29, I2 = 19.9%, Tau2 = 0.0168). For both subnets a treatment ranking could be conducted. In subnet 1 "ESA + oral iron" was ranked highest compared to "No treatment" (P score: 0.90) (Figure 12). The ranking also suggests higher efficacy for ESA administration compared to placebo and no administration of ESA. For subnet 2 "ESA + iron, unclear application" was ranked first compared to "No ESA + iron, unclear application" (P score: 0.99).
| Subnet 1 | |||||||
|---|---|---|---|---|---|---|---|
| Heterogeneity/Inconsistency: Qtotal = 162.04, df = 65, P < 0.01 / Qwithin = 159.35, df = 61, P < 0.01 / Qbetween = 2.68, df = 4, P = 0.61; I² = 59.9%, Tau² = 0.0447 | |||||||
| ESA + oral iron | 0.81 [0.48, 1.38] | 0.95 [0.48, 1.91] | 0.41 [0.19, 0.91] | . | . | 0.45 [0.34, 0.60] | . |
| 0.90 [0.56, 1.43] | ESA + IV iron | 0.90 [0.45, 1.82] | 0.74 [0.53, 1.03] | . | . | . | . |
| 0.88 [0.46, 1.68] | 0.98 [0.51, 1.88] | ESA + placebo | . | . | . | . | . |
| 0.67 [0.41, 1.09] | 0.75 [0.54, 1.03] | 0.76 [0.38, 1.52] | ESA + no iron | . | 0.65 [0.59, 0.72] | . | 0.59 [0.51, 0.69] |
| 0.54 [0.32, 0.90] | 0.60 [0.34, 1.06] | 0.61 [0.28, 1.32] | 0.80 [0.47, 1.37] | No ESA + IV iron | 1.07 [0.48, 2.38] | 0.68 [0.39, 1.18] | 0.89 [0.23, 3.35] |
| 0.44 [0.27, 0.72] | 0.49 [0.35, 0.68] | 0.50 [0.25, 1.00] | 0.65 [0.59, 0.73] | 0.82 [0.48, 1.39] | Placebo | . | . |
| 0.43 [0.33, 0.57] | 0.48 [0.29, 0.80] | 0.49 [0.25, 0.97] | 0.64 [0.38, 1.07] | 0.80 [0.50, 1.29] | 0.98 [0.58, 1.65] | No ESA + oral iron | . |
| 0.40 [0.24, 0.66] | 0.44 [0.31, 0.63] | 0.45 [0.22, 0.91] | 0.59 [0.51, 0.69] | 0.74 [0.43, 1.28] | 0.90 [0.75, 1.09] | 0.92 [0.54, 1.57] | No treatment |
| Subnet 2 | |||||||
| Heterogeneity/Inconsistency: Q=5.00, df=4, p=0.29; I²=19.9%, Tau²=0.0168 | |||||||
| ESA + iron, unclear application | 0.74 [0.54, 1.00] | 0.46 [0.33, 0.64] | |||||
| 0.74 [0.54, 1.00] | Placebo + iron, unclear application | . | |||||
| 0.46 [0.33, 0.64] | 0.63 [0.40, 0.98] | No ESA + iron, unclear application | |||||
Upper triangle: direct estimates; lower triangle: network estimates. Only subnets with >1 designs. Comparisons should be read from left to right, and the estimate is in the cell in common between the column‐defining treatment and the row‐defining treatment. Effect estimates are presented as risk ratios (RR) with corresponding 95% confidence interval. For the network estimates in the lower triangle an RR below 1.0 favours the column‐defining treatment and for the direct estimates in the upper triangle an RR below 1.0 favours the row‐defining treatment (less presence of red blood cell transfusions). To obtain RRs for comparisons in the opposing direction, reciprocals should be taken. Treatments are ordered by P‐Score (ascending).
Subnet 1: No. of studies: 69. No. of treatments: 8. No. of pairwise comparisons: 75. No. of designs: 9
Subnet 2: No. of studies: 6. No. of treatments: 3. No. of pairwise comparisons: 6. No. of designs: 2

Forest plot for outcome red blood cell transfusions. (a) Subnet 1. Reference treatment: No treatment (b) Subnet 2. Reference treatment: No ESA + iron, unclear application. Treatments are ordered by P‐Score (descending). RR: risk ratio. CI: confidence interval.
We rated the certainty of the evidence for red blood cell transfusions according to the GRADE approach for "ESA + IV iron", "ESA + oral iron", "ESA + no iron", "No ESA + IV iron" and "No ESA + oral iron" compared to our main comparator "No treatment", respectively. We found that treatment with ESA and IV iron, ESA and oral iron and ESA alone probably decreases the need for red blood cell transfusions compared to no treatment (moderate certainty). Additionally, treatment with IV iron alone and with oral iron alone may decrease or increase the need for red blood cell transfusions compared to no treatment (low certainty). Our main reasons for downgrading were inconsistency and imprecision. Reasons for downgrading are provided in the summary of findings tables (summary of findings Table 1; summary of findings Table 2).
For closed loops in subnet 1, inconsistencies could be analysed. Test for disagreement showed no significant disagreement between direct and indirect estimates in closed loops (Table 5, Figure 13). The netheat plot also showed no conspicuous signs of inconsistencies (Figure 14).
| Comparison | No. of studies | Network estimate | Direct estimate | Indirect estimate | Test for disagreement |
|---|---|---|---|---|---|
| ESA + IV iron vs. ESA + no iron | 6 | 0.75 [0.54, 1.03] | 0.74 [0.53, 1.03] | 0.83 [0.27, 2.61] | 0.8487 |
| ESA + IV iron vs. ESA + oral iron | 3 | 1.12 [0.70, 1.78] | 1.23 [0.72, 2.09] | 0.80 [0.30, 2.13] | 0.4522 |
| ESA + IV iron vs. ESA + placebo | 1 | 0.98 [0.51, 1.88] | 0.90 [0.45, 1.82] | 1.58 [0.30, 8.46] | 0.5448 |
| ESA + no iron vs. ESA + oral iron | 2 | 1.49 [0.92, 2.41] | 2.43 [1.10, 5.37] | 1.12 [0.61, 2.05] | 0.1270 |
| ESA + no iron vs. No treatment | 19 | 0.59 [0.51, 0.69] | 0.59 [0.51, 0.69] | 0.74 [0.17, 3.14] | 0.7669 |
| ESA + no iron vs. Placebo | 33 | 0.65 [0.59, 0.73] | 0.65 [0.59, 0.72 | 1.07 [0.37, 3.11] | 0.3697 |
| ESA + oral iron vs. ESA + placebo | 1 | 0.88 [0.46, 1.68] | 0.95 [0.48, 1.91] | 0.54 [0.10, 2.99] | 0.5448 |
| ESA + oral iron vs. No ESA + oral iron | 6 | 0.43 [0.33, 0.57] | 0.45 [0.34, 0.60] | 0.24 [0.08, 0.69] | 0.2592 |
| No ESA + IV iron vs. No ESA + oral iron | 2 | 0.80 [0.50, 1.29] | 0.68 [0.39, 1.18] | 1.27 [0.50, 3.24] | 0.2592 |
| No ESA + IV iron vs. No treatment | 1 | 0.74 [0.43, 1.28] | 0.89 [0.23, 3.35] | 0.71 [0.39, 1.30] | 0.7669 |
| No ESA + IV iron vs. Placebo | 1 | 0.82 [0.48, 1.39] | 1.07 [0.48, 2.38] | 0.65 [0.32, 1.34] | 0.3697 |
Estimates are reported as risk ratios with corresponding 95% confidence interval. Result of test for disagreement between direct and indirect evidence reported as p‐value. Only comparisons for which both direct and indirect evidence exists are shown.

Comparison of direct and indirect evidence (in closed loops) for outcome red blood cell transfusions. RR: risk ratio. CI: confidence interval.

Net heat plot for outcome red blood cell transfusions (random effects model).
Number of red blood cell transfusions
Twenty‐one studies (N = 4908) reported this outcome. All studies could be included in the analyses. In 19 studies no iron administration was given. The network was not fully connected, but consisted of two subnets, each with a maximum of three interventions studied (Figure 15).

Network graph for outcome number of red blood cell transfusions (created with yEd). Red lines: Subnet 1. Green lines: Subnet 2.
Pairwise comparisons
Pairwise comparisons favoured the interventions in which ESA is administered versus no ESA. Administration of "ESA + no iron" resulted in less transfusions compared to "No treatment" (mean difference (MD) ‐0.83, 95% CI ‐1.64 to ‐0.02) or "Placebo" (MD ‐0.90, 95% CI ‐1.25 to ‐0.55). Nevertheless, the fixed‐effect model showed a different result for "ESA + no iron vs. no treatment" indicating no meaningful difference (RR ‐0.00, 95% CI ‐0.04 to 0.03). However, statistical tests suggest moderate heterogeneity for the studies comparing "ESA + no iron" and "Placebo" (I² = 51%, P = 0.02) and substantial heterogeneity for the studies comparing "ESA + no iron" and "No treatment" (I² = 67%, P < 0.01). Compared to "No ESA + oral iron", "ESA + oral iron" reduced number of transfusions (MD ‐0.80, 95% CI ‐1.15 to ‐0.45) as well as "No ESA + IV iron" (MD ‐0.50, 95% CI ‐0.99 to ‐0.01) (data not shown).
Network meta‐analysis
Network meta‐analyses confirmed results of pairwise comparisons (Table 6). Ranking in subnet 1 showed superiority of "ESA + no iron" compared to "No treatment" (P score: 0.99) (Figure 16). In subnet 2 "ESA + oral iron" reached highest P score when using "No ESA + oral iron" as reference treatment (P score: 0.92) (Figure 16).
| Subnet 1 | ||
|---|---|---|
| Heterogeneity / inconsistency: Q = 39.86, df = 17, P < 0.01; I² = 57.4%, Tau² = 0.2548 | ||
| ESA + no iron | ‐0.67 [‐1.31, ‐0.03] | ‐0.90 [‐1.29, ‐0.51] |
| ‐0.67 [‐1.31, ‐0.03] | No treatment | . |
| ‐0.90 [‐1.29, ‐0.51] | ‐0.23 [‐0.97, 0.52] | Placebo |
| Subnet 2 | ||
| Heterogeneity / inconsistency: Not applicable (subnet consists of only two pairwise comparisons) | ||
| ESA + oral iron | . | ‐0.80 [‐1.15, ‐0.45] |
| ‐0.30 [‐0.90, 0.30] | No ESA + IV iron | ‐0.50 [‐0.99, ‐0.01] |
| ‐0.80 [‐1.15, ‐0.45] | ‐0.50 [‐0.99, ‐0.01] | No ESA + oral iron |
Upper triangle: direct estimates; lower triangle: network estimates. Only subnets with >1 designs. Comparisons should be read from left to right, and the estimate is in the cell in common between the column‐defining treatment and the row‐defining treatment. Effect estimates are presented as standardised mean differences (SMD) with corresponding 95% confidence interval. For the network estimates in the lower triangle an SMD below 0.0 favours the column‐defining treatment and for the direct estimates in the upper triangle an SMD below 0.0 favours the row‐defining treatment (smaller number of red blood cell transfusions). To obtain RRs for comparisons in the opposing direction, reciprocals should be taken. Treatments are ordered by P‐Score (ascending).
Subnet 1: No. of studies: 19. No. of treatments: 3. No. of pairwise comparisons: 19. No. of designs: 2
Subnet 2: No. of studies: 2. No. of treatments: 3. No. of pairwise comparisons: 2. No. of designs: 2

Forest plot for outcome number of red blood cell transfusions. (a) Subnet 1. Reference treatment: No treatment (b) Subnet 2. Reference treatment: No ESA + oral iron. Treatments are ordered by P‐Score (descending). MD: mean difference. CI: confidence interval.
Since in the summary of findings table only seven outcomes can be displayed, the number of red blood cell transfusions was not included in the summary of findings table because numbers of patients with red blood cell transfusions were reported more often than numbers of red blood cell transfusions.
Inconsistencies could not be analysed since there were no closed loops.
Overall mortality
Since the intended outcome overall survival was reported heterogeneously in included studies, we used a different method to analyse the outcome from that reported in the protocol as binary outcome (overall mortality) to include as much study data as possible. 80 RCTs (N = 23,488) reported overall mortality of their participants. Four RCTs (Cascinu 1994; Kurz 1997; Maccio 2010; Sweeney 1998) including 331 participants reported no events and were therefore excluded from network meta‐analysis. The network, based on 80 pairwise comparisons, was not fully connected (Figure 17), but consisted of two subnets with nine interventions in one network and three in the other one.

Network graph for outcome overall mortality (created with yEd). Red lines: Subnet 1. Green lines: Subnet 2.
Pairwise comparisons
Pairwise comparison showed a benefit for“ESA + oral iron" compared to" No ESA + oral iron” indicating a lower mortality risk for "ESA + oral iron" (RR 0.91, 95% CI 0.84 to 0.98). Nevertheless, the fixed‐effect model showed a different result indicating no benefit for "ESA + oral iron" (RR 0.92, 95% CI 0.84 to 1.02). None of the other pairwise comparisons in both subnets showed important benefits. Heterogeneity statistics showed no meaningful heterogeneity in pairwise comparisons, with an I² of 0‐15% for all pairwise comparisons (data not shown).
Network meta‐analysis
For each subnet we performed a network meta‐analysis. Results for all network comparisons are shown in the league table in Table 7. "ESA + oral iron" resulted in lower overall mortality compared to "No ESA + oral iron" (RR 0.91, 95% CI 0.84 to 0.98). Cochran's Q‐test and I² statistics showed no significant heterogeneity between studies (subnet 1: Qtotal = 61.55, df = 65, P = 0.60 / Qwithin = 59.02, df = 61, P = 0.55 / Qbetween = 2.53, df = 4, P = 0.64; I² = 0%, Tau² = 0; subnet 2: Q = 1.27, df = 3, P = 0.74; I² = 0%, Tau² = 0). For each subnet a treatment ranking was conducted (Figure 18). Rankings of treatments in both subnets showed no meaningful results since treatment effects had quite large confidence intervals.
| Subnet 1 | ||||||||
|---|---|---|---|---|---|---|---|---|
| Heterogeneity / inconsistency: Qtotal = 61.55, df = 65, P = 0.60 / Qwithin = 59.02, df = 61, P = 0.55 / Qbetween = 2.53, df = 4, P = 0.64; I² = 0%, Tau² = 0 | ||||||||
| ESA + placebo | . | . | . | 0.50 [0.13, 1.97] | . | 0.38 [0.10, 1.40] | . | . |
| 0.61 [0.16, 2.34] | No treatment | 0.97 [0.91, 1.03] | . | . | 0.34 [0.08, 1.41] | . | . | . |
| 0.59 [0.15, 2.27] | 0.97 [0.91, 1.03] | ESA + no iron | 0.99 [0.96, 1.02] | 1.94 [0.18, 20.81] | . | 0.76 [0.45, 1.29] | . | . |
| 0.58 [0.15, 2.24] | 0.96 [0.90, 1.03] | 0.99 [0.96, 1.02] | Placebo | . | . | . | . | . |
| 0.44 [0.12, 1.62] | 0.72 [0.31, 1.66] | 0.74 [0.32, 1.71] | 0.75 [0.32, 1.73] | ESA + oral iron | . | 0.74 [0.30, 1.83] | 0.91 [0.84, 0.98] | 0.50 [0.05, 5.34] |
| 0.40 [0.11, 1.55] | 0.67 [0.28, 1.58] | 0.69 [0.29, 1.63] | 0.69 [0.29, 1.64] | 0.93 [0.66, 1.31] | No ESA + IV iron | . | 0.94 [0.67, 1.33] | . |
| 0.42 [0.12, 1.50] | 0.69 [0.41, 1.15] | 0.71 [0.43, 1.18] | 0.72 [0.43, 1.19] | 0.96 [0.44, 2.09] | 1.03 [0.46, 2.34] | ESA + IV iron | . | . |
| 0.40 [0.11, 1.47] | 0.65 [0.28, 1.51] | 0.67 [0.29, 1.56] | 0.68 [0.29, 1.57] | 0.91 [0.84, 0.98] | 0.98 [0.70, 1.37] | 0.95 [0.43, 2.07] | No ESA + oral iron | . |
| 0.22 [0.01, 3.27] | 0.36 [0.03, 4.43] | 0.37 [0.03, 4.57] | 0.37 [0.03, 4.62] | 0.50 [0.05, 5.34] | 0.54 [0.05, 5.91] | 0.52 [0.04, 6.33] | 0.55 [0.05, 5.90] | Placebo + oral iron |
| Subnet 2 | ||||||||
| Heterogeneity / inconsistency: Q = 1.27, df = 3, P = 0.74; I² = 0%, Tau² = 0 | ||||||||
| ESA + iron, unclear application | 1.00 [0.87, 1.15] | 1.25 [0.94, 1.66] | ||||||
| 1.00 [0.87, 1.15] | Placebo + iron, unclear application | . | ||||||
| 1.25 [0.94, 1.66] | 1.24 [0.90, 1.71] | No ESA + iron, unclear application | ||||||
Upper triangle: direct estimates; lower triangle: network estimates. Only subnets with >1 designs. Comparisons should be read from left to right, and the estimate is in the cell in common between the column‐defining treatment and the row‐defining treatment. Effect estimates are presented as risk ratios (RR) with corresponding 95% confidence interval. For the network estimates in the lower triangle an RR below 1.0 favours the column‐defining treatment and for the direct estimates in the upper triangle an RR below 1.0 favours the row‐defining treatment (less presence of deaths). To obtain RRs for comparisons in the opposing direction, reciprocals should be taken. Treatments are ordered by P‐Score (ascending).
Subnet 1: No. of studies: 71. No. of treatments: 9. No. of pairwise comparisons: 75. No. of designs: 10
Subnet 2: No. of studies: 5. No. of treatments: 3. No. of pairwise comparisons: 5. No. of designs: 2

Forest plot for outcome overall mortality. (a) Subnet 1. Reference treatment: No treatment (b) Subnet 2. Reference treatment: No ESA + iron, unclear application. Treatments are ordered by P‐Score (descending). RR: risk ratio. CI: confidence interval.
We rated the certainty of the evidence for overall mortality according to the GRADE approach for "ESA + IV iron", "ESA + oral iron", "ESA + no iron", "No ESA + IV iron" and "No ESA + oral iron" compared to our main comparator "No treatment", respectively. We found that treatment with ESA with or without IV or oral iron may decrease or increase overall mortality compared to no treatment (low certainty). Additionally, treatment with ESA alone may lead to little or no difference in overall mortality compared to no treatment (low certainty). Our main reasons for downgrading were imprecision and high risk of bias since excluding studies with overall high risk of bias changed results. Reasons for downgrading are provided in the summary of findings tables (summary of findings Table 1; summary of findings Table 2).
For closed loops in subnet 1, inconsistencies could be analysed. Test for disagreement showed no significant disagreement between direct and indirect estimates in closed loops (Table 8, Figure 19). The netheat plot also showed no conspicuous signs of inconsistencies (Figure 20).
| Comparison | No. of studies | Network estimate | Direct estimate | Indirect estimate | Test for disagreement |
|---|---|---|---|---|---|
| ESA + IV iron vs. ESA + no iron | 4 | 1.41 [0.85, 2.34] | 1.32 [0.78, 2.24] | 3.02 [0.51, 17.69] | 0.3785 |
| ESA + IV iron vs. ESA + oral iron | 3 | 1.05 [0.48, 2.28] | 1.35 [0.55, 3.32] | 0.48 [0.10, 2.31] | 0.2655 |
| ESA + IV iron vs. ESA + placebo | 1 | 2.40 [0.67, 8.59] | 2.65 [0.72, 9.81] | 0.34 [0.00, 107.93] | 0.4942 |
| ESA + no iron vs. ESA + oral iron | 1 | 0.74 [0.32, 1.71] | 1.94 [0.18, 20.81] | 0.65 [0.26, 1.58] | 0.3969 |
| ESA + no iron vs. No treatment | 21 | 1.03 [0.97, 1.10] | 1.03 [0.97, 1.10] | 2.98 [0.50, 17.88] | 0.2452 |
| ESA + oral iron vs. ESA + placebo | 1 | 2.29 [0.62, 8.51] | 2.00 [0.51, 7.86] | 10.64 [0.11, 1050.39] | 0.4942 |
| ESA + oral iron vs. No ESA + oral iron | 8 | 0.91 [0.84, 0.98] | 0.91 [0.84, 0.98] | 0.31 [0.05, 1.88] | 0.2452 |
| No ESA + IV iron vs. No ESA + oral iron | 1 | 0.98 [0.70, 1.37] | 0.94 [0.67, 1.33] | 2.72 [0.47, 15.81] | 0.2452 |
| No ESA + IV iron vs. No treatment | 1 | 1.50 [0.71, 3.56] | 2.95 [0.71, 12.34] | 1.02 [0.35, 3.01] | 0.2452 |
Estimates are reported as risk ratios with corresponding 95% confidence interval. Result of test for disagreement between direct and indirect evidence reported as p‐value. Only comparisons for which both direct and indirect evidence exists are shown.

Comparison of direct and indirect evidence (in closed loops) for outcome overall mortality. RR: risk ratio. CI: confidence interval.

Net heat plot for outcome overall mortality (random effects model).
Adverse events
Thromboembolic events
Thromboembolic events were reported in 61 studies (N = 19,370). Three studies (Cascinu 1994; Gupta 2009; Maccio 2010) including 363 participants reported no events and were therefore excluded from network meta‐analysis. The network, based on 58 pairwise comparisons, was not fully connected but consisted of three subnets (Figure 21), each with one to three pairwise comparisons. Four treatment options could be compared in subnet 1, three in subnet 2 and two in subnet 3.

Network graph for outcome thromboembolic events (created with yEd). Red lines: Subnet 1. Green lines: Subnet 2. Orange line: Subnet 3.
Pairwise comparisons
In subnet 1 the pairwise comparisons "ESA + no iron" vs. "No treatment" and "ESA + no iron" vs. "Placebo" showed a higher risk for "ESA + no iron" (RR 1.82, 95% CI 1.34 to 2.47; RR 1.35, 95% CI 1.16 to 1.58). In subnet 3, which only consists of one pairwise comparison, we also found a higher risk for thromboembolic events for ESA when added to oral iron compared to oral iron alone (RR 1.89, 95% CI 1.40 to 2.53). No meaningful statistical heterogeneity was found in these comparisons (I² = 0% for all comparisons) (data not shown).
Network meta‐analysis
For subnets containing more than two treatments (subnets 1 and 2) a network meta‐analysis was conducted. Results of all network comparisons are shown in the league table in Table 9 and confirmed results of pairwise comparisons. "No treatment" and "Placebo" resulted in fewer thromboembolic events compared to "ESA + no iron" (RR 0.55, 95% CI 0.41 to 0.74; RR 0.74, 95% CI 0.63 to 0.86). For subnet 1 Cochran's Q‐test and I2 statistics showed no significant heterogeneity between studies (Q = 31.54, df = 47, P = 0.96; I2 = 0%, Tau2 = 0), for subnet 2 heterogeneity could not be analysed as the network consisted of only two studies. For subnets 1 and 2 a treatment ranking was performed (Figure 22). In subnet 1 the reference treatment "No treatment" was ranked highest (P score: 0.98), since all other treatments were associated with increased risk of thromboembolic events. In subnet 2 reference treatment "No ESA + iron, unclear application" was ranked highest (P score: 0.69) compared to "Placebo + iron unclear application" and "ESA + unclear application", but confidence intervals are very large.
| Subnet 1 | |||
|---|---|---|---|
| Heterogeneity / inconsistency: Q = 31.54, df = 47, P = 0.96; I² = 0%, Tau² = 0 | |||
| No treatment | . | . | 0.55 [0.41, 0.74] |
| 0.74 [0.53, 1.04] | Placebo | . | 0.74 [0.63, 0.86] |
| 0.55 [0.29, 1.02] | 0.74 [0.42, 1.30] | ESA + IV iron | 1.00 [0.58, 1.73] |
| 0.55 [0.41, 0.74] | 0.74 [0.63, 0.86] | 1.00 [0.58, 1.73] | ESA + no iron |
| Subnet 2 | |||
| Heterogeneity / inconsistency: Not applicable (subnet consists of only 2 studies) | |||
| No ESA + iron, unclear application | . | 0.68 [0.36, 1.28] | |
| 1.01 [0.31, 3.31] | Placebo + iron, unclear application | 0.68 [0.25, 1.86] | |
| 0.68 [0.36, 1.28] | 0.68 [0.25, 1.86] | ESA + iron, unclear application | |
Upper triangle: direct estimates; lower triangle: network estimates. Only subnets with >1 designs. Comparisons should be read from left to right, and the estimate is in the cell in common between the column‐defining treatment and the row‐defining treatment. Effect estimates are presented as risk ratios (RR) with corresponding 95% confidence interval. For the network estimates in the lower triangle an RR below 1.0 favours the column‐defining treatment and for the direct estimates in the upper triangle an RR below 1.0 favours the row‐defining treatment (less presence of thromboembolic events). To obtain RRs for comparisons in the opposing direction, reciprocals should be taken. Treatments are ordered by P‐Score (ascending).
Subnet 1: No. of studies: 50. No. of treatments: 4. No. of pairwise comparisons: 50. No. of designs: 3
Subnet 2: No. of studies: 2. No. of treatments: 3. No. of pairwise comparisons: 2. No. of designs: 2

Forest plot for outcome thromboembolic events. (a) Subnet 1. Reference treatment: No treatment (b) Subnet 2. Reference treatment: No ESA + iron, unclear application. Treatments are ordered by P‐Score (descending). RR: risk ratio. CI: confidence interval.
We rated the certainty of the evidence for thromboembolic events according to the GRADE approach for "ESA + IV iron", "ESA + oral iron", "ESA + no iron", "No ESA + IV iron" and "No ESA + oral iron" compared to our main comparator "No treatment", respectively. Nevertheless, we could only rate the certainty in the evidence for "ESA + IV iron" and "ESA + no iron" as the other treatments are not included in our network. We found that treatment with ESA and IV iron probably increases the number of thromboembolic events slightly compared to no treatment (moderate certainty). Additionally, treatment with ESA alone slightly increases the number of thromboembolic events compared to no treatment (high certainty). Our main reason for downgrading was imprecision. Reasons for downgrading are provided in the summary of findings tables (summary of findings Table 1; summary of findings Table 2).
Since there were no closed loops, inconsistencies could not be analysed.
Thrombocytopenia or haemorrhage
The outcome thrombocytopenia was reported in 17 studies (N = 4006). Two studies (Cascinu 1994; Gupta 2009) including 215 participants reported no events and were therefore excluded from network meta‐analysis. The network, based on 15 pairwise comparisons, was not fully connected but consisted of two subnets (Figure 23) each with two pairwise comparisons and including three different treatments.

Network graph for outcome thrombocytopenia or haemorrhage (created with yEd). Red lines: Subnet 1. Green lines: Subnet 2.
Pairwise comparisons
Pairwise comparisons showed in subnet 1 a higher risk of thrombocytopenia or haemorrhage for "ESA + no iron" compared to "Placebo" (RR 1.18, 95% CI 1.01 to 1.39). No meaningful statistical heterogeneity was found in pairwise comparisons (I² = 0% for all comparisons). (data not shown)
Network meta‐analysis
For both subnets a network meta‐analysis was conducted. Results are shown in the league table in Table 10. "Placebo" resulted in fewer events of thrombocytopenia or haemorrhage than "ESA + no iron" (RR 0.84, 95% CI 0.72 to 0.99). For subnet 1 Cochran's Q‐test and I² statistics showed no significant heterogeneity between studies (Q = 7.84, df = 11, P = 0.73; I² = 0%, Tau² = 0); for subnet 2 heterogeneity could not be analysed as the network consisted of only two studies. For both subnets a treatment ranking was conducted (Figure 24). In subnet 1 "Placebo" was ranked highest compared to reference treatment "No treatment" (P score: 0.88). In subnet 2 "ESA + iron, unclear application" was ranked highest compared to reference treatment "No ESA + iron, unclear application" (P score: 0.64), but confidence intervals are very large.
| Subnet 1 | ||
|---|---|---|
| Heterogeneity / inconsistency: Q = 7.84, df = 11, P = 0.73, I² = 0%, Tau² = 0 | ||
| Placebo | . | 0.84 [0.72, 0.99] |
| 0.84 [0.55, 1.29] | No treatment | 1.00 [0.67, 1.49] |
| 0.84 [0.72, 0.99] | 1.00 [0.67, 1.49] | ESA + no iron |
| Subnet 2 | ||
| Heterogeneity / inconsistency: Not applicable (subnetwork consists of only 2 studies) | ||
| ESA + iron, unclear application | 1.00 [0.40, 2.49] | 0.69 [0.27, 1.76] |
| 1.00 [0.40, 2.49] | No ESA + iron, unclear application | . |
| 0.69 [0.27, 1.76] | 0.69 [0.19, 2.57] | Placebo + iron, unclear application |
Upper triangle: direct estimates; lower triangle: network estimates. Only subnets with >1 designs. Comparisons should be read from left to right, and the estimate is in the cell in common between the column‐defining treatment and the row‐defining treatment. Effect estimates are presented as risk ratios (RR) with corresponding 95% confidence interval. For the network estimates in the lower triangle an RR below 1.0 favours the column‐defining treatment and for the direct estimates in the upper triangle an RR below 1.0 favours the row‐defining treatment (less presence of thrombocytopenia or haemorrhage). To obtain RRs for comparisons in the opposing direction, reciprocals should be taken. Treatments are ordered by P‐Score (ascending).
Subnet 1: No. of studies: 13. No. of treatments: 3. No. of pairwise comparisons: 13. No. of designs: 2
Subnet 2: No. of studies: 2. No. of treatments: 3. No. of pairwise comparisons: 2. No. of designs: 2

Forest plot for outcome thrombocytopenia or haemorrhage. (a) Subnet 1. Reference treatment: No treatment (b) Subnet 2. Reference treatment: No ESA + iron, unclear application. Treatments are ordered by P‐Score (descending). RR: risk ratio. CI: confidence interval.
We rated the certainty of the evidence for thrombocytopenia or haemorrhage according to the GRADE approach for "ESA + IV iron", "ESA + oral iron", "ESA + no iron", "No ESA + IV iron" and "No ESA + oral iron" compared to our main comparator "No treatment", respectively. Nevertheless, we could only rate the certainty in the evidence for "ESA + no iron" as the other treatments are not included in our network. We found that treatment with ESA alone probably leads to little or no difference in number of patients with thrombocytopenia or haemorrhage compared to no treatment (moderate certainty). Our main reason for downgrading was imprecision. Reasons for downgrading are provided in the summary of findings tables (summary of findings Table 1; summary of findings Table 2).
Since there were no closed loops, inconsistencies could not be analysed.
Rash
The outcome rash was examined in 18 studies (N = 5245). Two studies (Gupta 2009; Kurz 1997) including 139 participants reported no events and were therefore excluded from network meta‐analysis. The network, based on 16 pairwise comparisons, was not fully connected but consisted of three subnets (Figure 25) each with one or two pairwise comparisons. Three treatment options could be compared in subnet 1 and two in subnet 2 and 3.
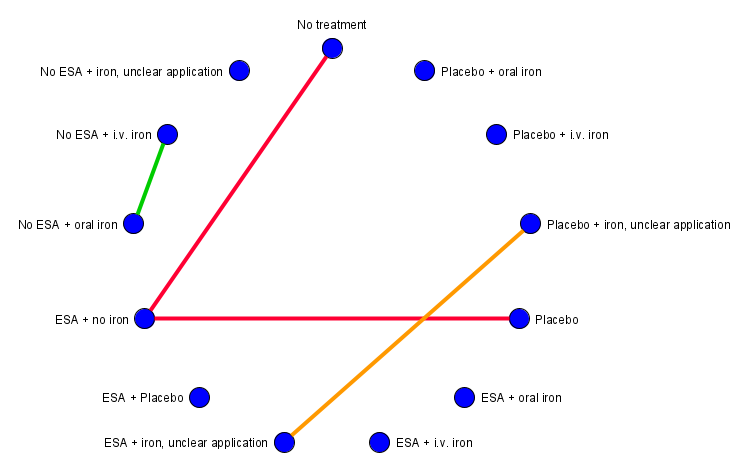
Network graph for outcome rash (created with yEd). Red lines: Subnet 1. Green line: Subnet 2. Orange line: Subnet 3.
Pairwise comparisons
Pairwise comparisons showed no meaningful results. (data not shown)
Network meta‐analysis
For subnet 1 a network meta‐analysis was conducted. Results are shown in the league table in Table 11. Network meta‐analysis even showed no meaningful results. For subnet 1 a treatment ranking was conducted (Figure 26). Reference treatment "No treatment" was ranked highest (P score: 0.75), but confidence intervals are very large.
| Subnet 1 | ||
|---|---|---|
| Heterogeneity / inconsistency: Q = 9.88, df = 12, P = 0.63; I² = 0%, Tau² = 0 | ||
| No treatment | . | 0.66 [0.28, 1.56] |
| 0.80 [0.30, 2.13] | Placebo | 0.83 [0.52, 1.32] |
| 0.66 [0.28, 1.56] | 0.83 [0.52, 1.32] | ESA + no iron |
Upper triangle: direct estimates; lower triangle: network estimates. Only subnets with >1 designs. Comparisons should be read from left to right, and the estimate is in the cell in common between the column‐defining treatment and the row‐defining treatment. Effect estimates are presented as risk ratios (RR) with corresponding 95% confidence interval. For the network estimates in the lower triangle an RR below 1.0 favours the column‐defining treatment and for the direct estimates in the upper triangle an RR below 1.0 favours the row‐defining treatment (less presence of rash. To obtain RRs for comparisons in the opposing direction, reciprocals should be taken. Treatments are ordered by P‐Score (ascending).
Subnet 1: No. of studies: 14. No. of treatments: 3. No. of pairwise comparisons: 14. No. of designs: 2

Forest plot for outcome rash. (a) Subnet 1. Reference treatment: No treatment. Treatments are ordered by P‐Score (descending). RR: risk ratio. CI: confidence interval.
Since only seven outcomes can be displayed, rash is not reported in the summary of findings tables.
Since there were no closed loops, inconsistencies could not be analysed.
Hypertension
The outcome hypertension was evaluated in 28 studies (N = 9190). Two studies (Cascinu 1994; Iconomou 2003) including 212 participants reported no events and were therefore excluded from network meta‐analysis. The network, based on 26 pairwise comparisons, was not fully connected and consisted of three subnets (Figure 27) each with one or two pairwise comparisons. Three treatment options could be compared in subnet 1 and two in subnet 2 and 3.

Network graph for outcome hypertension (created with yEd). Red lines: Subnet 1. Green line: Subnet 2. Orange line: Subnet 3.
Pairwise comparisons
For "ESA + no iron" pairwise comparison showed a higher risk for hypertension compared to "No treatment" (RR 2.93, 95% CI 1.19 to 7.25). No other pairwise comparisons showed meaningful results. No meaningful statistical heterogeneity was found in pairwise comparisons (I² = 0‐5% for all comparisons). (data not shown)
Network meta‐analysis
For subnet 1 a network meta‐analysis was performed. Results of network meta‐analysis are shown in the league table in Table 12. "ESA + no iron" and "Placebo" resulted in higher risk for hypertension compared to "No treatment" (RR 2.93, 95% CI 1.19 to 7.25; RR 2.82, 95% CI 1.12 to 7.09). Cochran's Q‐test and I² statistics showed no significant heterogeneity between studies (Q = 17.54, df = 22, P = 0.73; I² = 0%, Tau² = 0). For subnet 1 a treatment ranking was conducted (Figure 28). Reference treatment "No treatment" was ranked highest (P‐score: 0.99), compared to "Placebo" and "ESA + no iron", which both showed an increased risk for hypertension compared to reference treatment "No treatment".
| Subnet 1 | ||
|---|---|---|
| Heterogeneity / inconsistency: Q = 17.54, df = 22, P = 0.73; I² = 0%, Tau² = 0 | ||
| No treatment | . | 0.34 [0.14, 0.84] |
| 0.35 [0.14, 0.89] | Placebo | 0.96 [0.81, 1.15] |
| 0.34 [0.14, 0.84] | 0.96 [0.81, 1.15] | ESA + no iron |
Upper triangle: direct estimates; lower triangle: network estimates. Only subnets with >1 designs. Comparisons should be read from left to right, and the estimate is in the cell in common between the column‐defining treatment and the row‐defining treatment. Effect estimates are presented as risk ratios (RR) with corresponding 95% confidence interval. For the network estimates in the lower triangle an RR below 1.0 favours the column‐defining treatment and for the direct estimates in the upper triangle an RR below 1.0 favours the row‐defining treatment (less presence of hypertension). To obtain RRs for comparisons in the opposing direction, reciprocals should be taken. Treatments are ordered by P‐Score (ascending).
Subnet 1: No. of studies: 24. No. of treatments: 3. No. of pairwise comparisons: 24 No. of designs: 2

Forest plot for outcome hypertension. (a) Subnet 1. Reference treatment: No treatment. Treatments are ordered by P‐Score (descending). RR: risk ratio. CI: confidence interval.
We rated the certainty of the evidence for hypertension according to the GRADE approach for "ESA + IV iron", "ESA + oral iron", "ESA + no iron", "No ESA + IV iron" and "No ESA + oral iron" compared to our main comparator "No treatment", respectively. Nevertheless, we could only rate the certainty in the evidence for "ESA + no iron" as the other treatments are not included in our network. We found that treatment with ESA alone probably increases the number of hypertensions compared to no treatment (moderate certainty). Our main reason for downgrading was imprecision. Reasons for downgrading are provided in the summary of findings tables (summary of findings Table 1; summary of findings Table 2).
Since there were no closed loops in any subnet, inconsistencies could not be analysed.
Subgroup analyses
Comparison of different routes of iron administrations (IV, oral) were included in network meta‐analysis for each outcome.
Since trial data for type of iron and duration of follow‐up were less reported, no subgroup analyses were conducted for these predefined subgroups. For cancer type most studies included participants with solid or mixed tumours, so no subgroup analyses were performed.
Finally, subgroup analyses could only be performed for type of ESA (epoetin vs. darbepoetin) and type of therapy (chemotherapy vs. no chemotherapy). In the following, for each outcome results of network,meta‐analyses are described for each of the four subgroups (data not shown).
On‐study mortality
Forty‐six of the 58 studies, that reported at least one event, included participants treated with epoetin. "No ESA + IV iron" dropped out of subnet 1. Network meta‐analysis for subnet 1 yielded similar results, except that the comparison "ESA + no iron" vs. "Placebo" no longer showed a meaningful benefit for "ESA + no iron" (RR 1.14, 95% CI 0.98 to 1.30), but confidence intervals are overlapping. For the other subnet, network meta‐analyses yielded similar results.
Eleven of the 58 studies, that reported at least one event, included participants treated with darbepoetin instead. For this subgroup, only subnet 1 remained. For subnet 1, most treatments dropped out of the network, only "Placebo", "No treatment" and "ESA + no iron" remained in the network. Network meta‐analysis of the remaining treatments yielded similar effect estimates but larger confidence intervals.
Forty‐two of the 58 studies, that reported at least one event, included participants undergoing chemotherapy. "ESA + IV iron", "ESA + oral iron" and "No ESA + oral iron" dropped out of subnet 1. For this subnet, network meta‐analysis of the remaining treatments yielded similar results, except that "ESA + no iron" no longer showed a meaningful benefit compared to "Placebo" (RR 1.09, 95% CI 0.96 to 1.23), but confidence intervals are overlapping. Additionally, in the ranking of treatments "No treatment" and "Placebo" swapped their ranks, but confidence intervals are overlapping. For subnet 2 results did not change.
Sixteen of the 58 studies, that reported at least one event, included participants not undergoing chemotherapy. "ESA + oral iron", "No ESA + oral iron" and "Placebo + oral iron" dropped out of subnet 1. Network meta‐analysis on subnet 1 yielded similar effect estimates, but confidence intervals are partly a bit larger. Subnet 2 was completely omitted.
Haematological response
Twenty‐five of the 32 studies, that reported at least one event, included participants treated with epoetin. "ESA + placebo" dropped out of subnet 1. Network meta‐analysis for subnet 1 yielded slightly different effect estimates and larger confidence intervals.
Seven of the 32 studies, that reported at least one event, included participants treated with darbepoetin. "No ESA + oral iron" dropped out of subnet 1. Network meta‐analysis for subnet 1 yielded slightly larger effect estimates, but even much larger confidence intervals. The comparison "Placebo" vs. "No treatment" no longer showed a meaningful benefit for "Placebo" (RR 2.19, 95% CI 0.90 to 5.36), but confidence intervals are overlapping. The ranking of treatments did not change.
Twenty‐five of the 32 studies, that reported at least one event, included participants undergoing chemotherapy. Network meta‐analysis for subnet 1 yielded very similar results with strongly overlapping confidence intervals, except that the comparison "ESA + IV iron" vs. "ESA + no iron" no longer showed a meaningful benefit for "ESA + IV iron" (RR 1.23, 95% CI 0.98 to 1.56), but confidence intervals are overlapping. The ranking of treatments did not change.
Seven of the 32 studies, that reported at least one event, included participants not undergoing chemotherapy. "ESA + placebo", "ESA + oral iron" and "No ESA + oral iron" dropped out of subnet 1. Network meta‐analysis of the remaining treatments for subnet 1 yielded a bit larger effect estimates, but even much larger confidence intervals. The comparison "Placebo" vs. "No treatment" no longer showed a meaningful benefit for "Placebo" (RR 2.34, 95% CI 0.90 to 6.12), but confidence intervals are overlapping. The ranking of remaining treatments did not change.
Red blood cell transfusions
Fifty‐seven of the 75 studies, that reported at least one event, included participants treated with epoetin. "ESA + placebo" and "No ESA + IV iron" dropped out of subnet 1. Network meta‐analysis for subnet 1 yielded slightly different results. The comparison "ESA + IV iron" vs. "No ESA + oral iron" no longer showed a meaningful benefit for "ESA + IV iron" (RR 0.84, 95% CI 0.36 to 1.94). Instead, "ESA + oral iron" resulted in a lower need for red blood cell transfusions compared to "ESA + no iron" (RR 0.44, 95% CI 0.21 to 0.96). Additionally, the effect of "ESA + no iron" vs. "No ESA + oral iron" changed the direction, but confidence intervals are overlapping. In the ranking of treatments "No ESA + oral iron" and "Placebo" swapped their ranks, but confidence intervals are overlapping. For subnet 2, network meta‐analysis yielded similar results, except that "ESA + iron, unclear application" resulted in a lower need for red blood cell transfusions compared to "Placebo + iron, unclear application" (RR 0.73, 95% 0.55 to 0.98).
Fourteen of the 75 studies, that reported at least one event, included participants treated with darbepoetin. "No ESA + IV iron" and "No ESA + oral iron" dropped out of subnet 1. Network meta‐analysis for subnet 1 yielded slightly different results. The comparisons "ESA + oral iron", "ESA + placebo" and "ESA + no iron" vs. "No treatment" no longer showed a meaningful benefit compared to "No treatment" (RR 0.35, 95% CI 0.12 to 1.04; RR 0.37, 95% CI 0.13 to 1.08; RR 0.54, 95% CI 0.27 to 1.08). Additionally, the comparisons "ESA + oral iron" vs. "Placebo" and "ESA + placebo" vs. "Placebo" no longer showed a meaningful benefit compared to "Placebo" (RR 0.43, 95% CI 0.18 to 1.01; RR 0.45, 95% CI 0.19 to 1.05). In the ranking of treatments "ESA + IV iron" and "ESA + oral iron" swapped their ranks, but confidence intervals are overlapping. Subnet 2 consisted of only one study, so no further analyses could be performed.
Fifty‐nine of the 75 studies, that reported at least one event, included participants undergoing chemotherapy. Network meta‐analysis for subnet 1 yielded similar results, except that the comparison "ESA + placebo" vs. "No ESA + oral iron" no longer showed a meaningful benefit for "ESA + placebo" (RR 0.49, 95% CI 0.23 to 1.03). In the ranking of treatments "No ESA + oral iron" and "Placebo" swapped their ranks, but confidence intervals are overlapping. For subnet 2, network meta‐analysis yielded similar results, except that "Placebo + iron, unclear application" vs. "No ESA+ iron, unclear application" no longer showed a meaningful benefit for "Placebo + iron, unclear application" (RR 0.67, 95% 0.40 to 1.11).
Sixteen of the 75 studies, that reported at least one event, included participants not undergoing chemotherapy. "ESA + oral iron", "ESA + placebo", "No ESA + IV iron" and "No ESA + oral iron" dropped out of subnet 1, resulting in a much sparser network. Network meta‐analysis of the remaining treatments yielded slightly different effect estimates and a bit larger confidence intervals. The comparisons "ESA + IV iron" vs. "Placebo" and "No treatment" no longer showed a meaningful benefit for "ESA + IV iron" (RR 0.71, 95% CI 0.43 to 1.18; RR 0.54, 95% CI 0.28 to 1.06). Subnet 2 consisted of only one study, so no further analyses could be performed.
Number of red blood cell transfusions
Eighteen of the 21 studies included participants treated with epoetin. Network meta‐analysis for subnet 1 yielded very similar results. Subnet 2 consisted of only one study, so no further analyses could be performed.
Two of the 21 studies included participants treated with darbepoetin. For subnet 1, only one pairwise comparison remained so no network meta‐analysis was possible. Subnet 2 is completely omitted.
Eighteen of the 21 studies included participants undergoing chemotherapy. Network meta‐analysis for subnet 1 yielded very similar results. Subnet 2 consisted of only one study, so no further analyses could be performed.
Two of the 21 studies included participants not undergoing chemotherapy. For subnet 1, only one pairwise comparison remained so no network meta‐analysis was possible. Furthermore, subnet 2 consisted of only one study, so no further analyses could be performed.
Overall mortality
Fifty‐eight of the 76 studies, that reported at least one event, included participants treated with epoetin. "ESA + placebo" and "No ESA + IV iron" dropped out of subnet 1. Network meta‐analysis for subnet 1 yielded slightly different effect estimates and larger confidence intervals. For "ESA + oral iron", "Placebo" and "No ESA + oral iron" the direction of effect changed compared with "No treatment", but confidence intervals are overlapping. In the ranking of treatments "ESA + oral iron", "Placebo" and "No ESA + oral iron" are here better than "No treatment". For subnet 2, network meta‐analysis yielded similar results.
Sixteen of the 76 studies, that reported at least one event, included participants treated with darbepoetin. "Placebo + oral iron" and "No ESA + IV iron" dropped out of subnet 1. Network meta‐analysis for subnet 1 yielded slightly different results. The comparison "ESA + oral iron" vs. "No ESA + oral iron" no longer showed a meaningful benefit for "ESA + oral iron" and changed direction (RR 1.03 95% CI 0.67 to 1.60). Instead, "ESA + no iron" and "Placebo" resulted in a higher risk for overall mortality compared to "No treatment" (RR 1.23, 95% CI 1.04 to 1.45; RR 1.27, 95% CI 1.07 to 1.51). In the ranking of treatments "No ESA + oral iron" and "Placebo" swapped their ranks, but confidence intervals are overlapping. Subnet 2 consisted of only one study, so no further analyses could be performed.
Fifty‐three of the 76 studies, that reported at least one event, included participants undergoing chemotherapy. "Placebo + oral iron" dropped out of subnet 1. Network meta‐analysis for subnet 1 yielded similar results, except that the comparison "ESA + oral iron" vs. "No ESA + oral iron" no longer showed a meaningful benefit for "ESA + oral iron" (RR 0.90, 95% CI 0.76 to 1.07). In the ranking of treatments "No treatment" and "ESA + no iron" swapped their ranks, but confidence intervals are overlapping. For subnet 2, network meta‐analysis yielded very similar results.
Twenty=three of the 76 studies, that reported at least one event, included participants not undergoing chemotherapy. For subnet 1, the network split into two smaller subnets. The first network consisted of "No treatment", "Placebo", "ESA + no iron" and "ESA + IV iron". Network meta‐analysis for this network yielded similar results with a bit larger confidence intervals. Here, "ESA + no iron" resulted in a higher risk for overall mortality compared to "No treatment" (RR 1.16, 95% CI 1.02 to 1.31). In the ranking of treatments "ESA + no iron" here was ranked last, but confidence intervals are overlapping. "ESA + oral iron", "Placebo + oral iron" and "No ESA + oral iron" now form their own network. Here, results remained almost the same. Subnet 2 consisted of only one study, so no further analyses could be performed.
Thromboembolic events
Forty‐four of the 58 studies, that reported at least one event, included participants treated with epoetin. Network meta‐analysis for subnet 1 yielded similar results, but confidence intervals are partly a bit larger. For subnet 2, only one pairwise comparison remained so no network meta‐analysis was possible.
Fourteen of the 58 studies, that reported at least one event, included participants treated with darbepoetin. Network meta‐analysis for subnet 1 yielded a bit larger effect estimates, but even much larger confidence intervals. The comparison "ESA + no iron" vs. "No treatment" no longer showed a meaningful benefit for "ESA + no iron" (RR 2.28, 95% CI 0.74 to 7.02), but confidence intervals are overlapping. Subnet 2 consisted of only one study, so no further analyses could be performed.
Thirty‐five of the 58 studies, that reported at least one event, included participants undergoing chemotherapy. Network meta‐analysis for subnet 1 yielded similar results. For subnet 2, results did not change.
Twenty‐three of the 58 studies, that reported at least one event, included participants not undergoing chemotherapy. Network meta‐analysis for subnet 1 yielded partly a bit larger effect estimates, but even much larger confidence intervals. Subnet 2 is completely omitted.
Thrombocytopenia or haemorrhage
Thirteen of the 15 studies, that reported at least one event, included participants treated with epoetin. Network meta‐analysis for subnet 1 yielded similar results, except that the comparison "ESA + no iron" vs. "Placebo" no longer showed a meaningful benefit for "ESA + no iron" (RR 0.90, 95% CI 0.75 to 1.08), but confidence intervals are overlapping. Subnet 2 consisted of only one study, so no further analyses could be performed.
Two of the 15 studies, that reported at least one event, included participants treated with darbepoetin. Subnets 1 and 2 consisted each of only one study, so no further analyses could be performed.
Thirteen of the 15 studies, that reported at least one event, included participants undergoing chemotherapy. Network meta‐analysis for subnet 1 yielded very similar results. For subnet 2, results did not change.
Two of the 15 studies, that reported at least one event, included participants not undergoing chemotherapy. Network meta‐analysis for subnet 1 yielded a bit larger effect estimates and confidence intervals. In the ranking of treatments "ESA + no iron" and "No treatment" swapped their ranks, but confidence intervals are overlapping. Subnet 2 is completely omitted.
Rash
Thirteen of the 16 studies, that reported at least one event, included participants treated with epoetin. Network meta‐analysis for subnet 1 yielded slightly different results, but confidence intervals are overlapping. In the ranking of treatments "Placebo" and "No treatment" swapped their ranks, but confidence intervals are overlapping.
Two of the 16 studies, that reported at least one event, included participants treated with darbepoetin. For subnet 1, only one pairwise comparison remained so no network meta‐analysis was possible.
Thirteen of the 16 studies, that reported at least one event, included participants undergoing chemotherapy. Network meta‐analysis for subnet 1 yielded very similar results.
Two of the 16 studies, that reported at least one event, included participants not undergoing chemotherapy. Network meta‐analysis for subnet 1 yielded larger effect estimates and much larger confidence intervals. In the ranking of treatments "ESA + no iron" and "Placebo" swapped their ranks, but confidence intervals are overlapping.
Hypertension
Twenty of the 26 studies, that reported at least one event, included participants treated with epoetin. Network meta‐analysis for subnet 1 yielded very similar results.
Six of the 26 studies, that reported at least one event, included participants treated with darbepoetin. For subnet 1, only one pairwise comparison remained so no network meta‐analysis was possible.
Twenty‐one of the 26 studies, that reported at least one event, included participants undergoing chemotherapy. Network meta‐analysis for subnet 1 yielded similar results, except that the comparison "Placebo" vs. "No treatment" no longer showed a meaningful benefit for "Placebo" (RR 2.35, 95% CI 0.88 to 6.30), but confidence intervals are overlapping.
Five of the 26 studies, that reported at least one event, included participants not undergoing chemotherapy. Network meta‐analysis for subnet 1 yielded similar effect estimates, but confidence intervals are much larger and crossing unity. Additionally, in the ranking of treatments "ESA + no iron" and "Placebo" swapped their ranks, but confidence intervals are overlapping.
Sensitivity analysis
For statistical analysis a fixed‐effect model was compared to a random‐effects model. For on‐study mortality the comparison showed similar results (data not shown).
Furthermore, to explore the influence of quality components, studies rated as high overall risk of bias (Auerbach 2004; Noronha 2016) were excluded from sensitivity analyses.
For on‐study mortality, number of red blood cell transfusions, hypertension, thromboembolic events and thrombocytopenia or haemorrhage, no sensitivity analyses were performed, because these outcomes included no studies with high overall risk of bias.
For haematological response, in subnet 1 the exclusion of Auerbach 2004 yielded similar results and the ranking of treatment did not change.
For red blood cell transfusions, in subnet 1 the exclusion of Auerbach 2004 and Noronha 2016 yielded similar effect estimates and confidence intervals. The ranking of treatments remained the same, except that "ESA + oral iron" and "ESA + IV iron" and "No treatment" and "No ESA + oral iron" changed their ranks, but effect estimates and confidence intervals are similar and overlapping. Additionally, the confidence intervals of "ESA + oral iron vs. No ESA + IV iron", "ESA + placebo vs. No treatment" and "ESA + no iron vs. No ESA + oral iron" are larger and crosses unity (data not shown).
For overall mortality, the exclusion of Noronha 2016 resulted in a different ranking of treatments, and for some comparisons the effects changed their direction. Nevertheless, confidence intervals are very large and overlapping (data not shown).
With regard to the outcome rash, after excluding Noronha 2016 subnet 2 is omitted completely.
Discussion
Summary of main results
The objectives of this review were to systematically evaluate the effect of intravenous (IV), oral, or no iron in combination with erythropoiesis‐stimulating agents (ESAs) on the prevention or alleviation of anaemia in cancer patients, and to collect further information on the safety and efficacy of these interventions. We identified 96 randomised controlled trials (RCTs) including 25,157 participants. We investigated 12 different treatment options in our analyses. The treatment options included combinations of ESAs with IV or oral iron and placebo. From the 96 studies included in our review, four studies (Ansari 2016; Birgegard 2015; Goede 2016; Henke 1999) could not be analysed in network meta‐analyses as they did not report any of our studied outcomes. As there was no complete network for any outcome, we could not rank all treatments for each predefined outcome. The results and the certainty in the evidence for the main outcomes and comparisons are reported in summary of findings Table 1 and summary of findings Table 2 and are summarised below.
-
Regarding on‐study mortality, our network consisted of two subnets (subnet)s comparing 11 different treatment options. Evidence from network meta‐analyses (NMA) (55 RCTS, 15,074 participants) suggests that treatment with ESA alone leads to increased on‐study mortality compared to placebo alone. We found that administration of ESA with IV or oral iron may decrease or increase on‐study mortality compared to no treatment (low‐certainty evidence). Further, we found that treatment with ESA alone probably leads to slightly increased on‐study mortality compared to no treatment (moderate certainty). Additionally, we found that treatment withIV iron alone may increase, and treatment with oral iron alone may increase or decrease on‐study mortality compared to no treatment (low certainty).
-
Regarding haematological response, our network consisted of two subnets comparing nine different treatment options. Evidence from NMA (31 RCTs, 6985 participants) suggests that the treatment with ESA andIV iron leads to higher haemoglobin response compared to ESA alone, placebo alone, oral iron alone, and no treatment. Additionally, ESA with placebo, ESA with oral iron and ESA without iron resulted in higher haemoglobin response than placebo alone, oral iron alone and no treatment. Furthermore, placebo alone resulted in higher haemoglobin response compared to no treatment. In the ranking of treatments, ESA with IV iron was ranked highest. The ranking also suggests higher efficacy for ESA administration compared to placebo or no administration of ESAs. We found that treatment with ESA and IV iron, ESA and oral iron, and ESA alone probably increases haemoglobin response compared to no treatment (moderate certainty). Additionally, treatment with oral iron alone may increase haemoglobin response compared to no treatment (low certainty).
-
Regarding red blood cell transfusions, our network consisted of two subnets comparing 12 different treatment options. Evidence from NMA (69 RCTs, 18,684 participants) suggests that treatment with ESA and oral iron leads to a reduced need for red blood cell transfusions compared to IV iron alone, oral iron alone, placebo alone and no treatment. Additionally, administration of ESA withIV iron and ESA with placebo resulted in a reduced need for red blood cell transfusions compared to oral iron alone and no treatment. Administration of ESA with intravenous iron further resulted in reduced need for red blood cell transfusions compared to placebo alone. Finally, treatment with ESA alone resulted in a reduced need for red blood cell transfusions compared to placebo alone and no treatment. In the ranking of treatments ESA with oral iron was ranked highest compared to no treatment. Additionally, ranking suggests higher efficacy for ESA administration compared to placebo or no administration of ESA. In the second subnetwork, ESA with unclear application of iron and placebo with unclear application of iron resulted in a reduced need for red blood cell transfusions compared to unclear application of iron without ESAs. In the ranking of treatments, ESA with unclear application of iron was ranked first. We found that administration of ESA with IV or oral iron and ESA alone probably decreases the need for red blood cell transfusions compared to no treatment (moderate certainty). Additionally, treatment with intravenous iron alone and with oral iron alone may decrease or increase the need for red blood cell transfusions compared to no treatment (low certainty).
-
Regarding number of red blood cell transfusions, our network consisted of two subnets comparing six different treatment options. Evidence from NMA (19 RCTs, 4459 participants) suggests that administration of ESA alone leads to less red blood cell transfusions compared to no treatment and placebo alone. Additionally, administration of ESA with oral iron and IV alone resulted in less red blood cell transfusions than administration of oral iron alone.
-
Regarding overall mortality, our network consisted of two subnets comparing 12 different treatment options. Evidence from NMA (71 RCTs, 21,576 participants) suggests that treatment with ESA and oral iron leads to lower overall mortality than oral iron alone. We found that administration of ESA with or without IV or oral iron may decrease or increase overall mortality compared to no treatment (low certainty,) and treatment with ESA alone may lead to little or no difference in overall mortality compared to no treatment (low certainty).
-
Regarding thromboembolic events, our network consisted of three subnets comparing nine different treatment options. Evidence from NMA (50 RCTs, 15,408 participants) suggests that no treatment and treatment with placebo alone leads to fewer thromboembolic events compared to ESA alone. Additionally, pairwise comparison of ESA with oral iron and oral iron alone resulted in fewer thromboembolic events for oral iron alone. We found that treatment with ESA and intravenous iron probably increases the number of thromboembolic events slightly compared to no treatment (moderate certainty) and treatment with ESA alone slightly increases the number of thromboembolic events compared to no treatment (high certainty).
-
Regarding thrombocytopenia or haemorrhage, our network consisted of two subnets comparing six different treatment options. Evidence from NMA (13 RCTs, 2744 participants) suggests that ESA alone leads to a higher risk for thrombocytopenia or haemorrhage than placebo alone. In the ranking of treatments, placebo was ranked as the best option (lowest risk of thrombocytopenia or haemorrhage) compared to no treatment. We found that treatment with ESA alone probably leads to little or no difference in number of patients with thrombocytopenia or haemorrhage compared to no treatment (moderate certainty).
-
Regarding rash, our network consisted of three subnets comparing seven different treatment options. Evidence from NMA (14 RCTs, 4592 participants) showed no statistically meaningful results for this outcome.
-
Regarding hypertension, our network consisted of three subnets comparing seven different treatment options. Evidence from NMA (24 RCTs, 8383) suggests that administration of ESA alone and placebo alone leads to a higher risk for hypertension compared to no treatment. In the ranking of treatments reference "no treatment" was ranked highest compared to ESA alone and placebo alone. We found that treatment with ESA alone probably increases the number of participants with hypertension compared to no treatment (moderate certainty).
Overall completeness and applicability of evidence
We were able to compare a total of 12 different treatment options, combining ESAs with intravenous (IV) or oral iron, for the prevention or alleviation of anaemia in cancer patients. The only treatment option from our ideal network, which is not included in any network, was "Placebo + IV iron".
Not all trials reported all the studied outcomes, resulting in very different graphical networks for each outcome. The definitions of efficacy outcomes within the trials did not all correspond with our definitions. For example, we defined haematological response as proportion of participants with an increase in haemoglobin (Hb) level of 2 g/dL or more, or increase in haematocrit of six percentage points or more, unrelated to transfusion. However, some studies reported the outcome haematological response differently.
A connected network could not be formed for any of the outcomes of interest. Instead, for each outcome, there was a minimum of two different subnetworks (subnets). In some studies, the iron application was not clearly reported, so treatments with unclear application form of iron formed their own network.
We detected moderate inconsistency within the network for haemoglobin response and substantial inconsistency for the outcome red blood cell transfusions, both indicating differences within pairwise comparisons. We found no signs of inconsistencies between direct and indirect evidence. However, this inconsistency within pairwise comparisons could not be statistically explained or resolved in sensitivity and subgroup analyses. It probably originates from the interplay of some effect modifiers, in which our included trials slightly differ (e.g. cancer types, study start date, and regions). These are only minor differences. From a clinical point of view, our included studies, therefore, remain largely comparable.
In addition to the studies included in this review, we are aware of a further 31 trials which may be eligible for inclusion in our review. Of these, 19 trials are still awaiting assessment as no results are available, and 12 trials are still ongoing. These studies may alter our results if included in our analyses.
However, despite all these limitations, we were able to identify an extensive number of trials comparing treatment combinations for multiple outcomes to each other. We were able to consider the experience of almost 25,000 individuals, emphasising the overall completeness and applicability of our findings.
Quality of the evidence
Risk of bias
We rated the risk of bias for each trial. We took into consideration if outcomes were objective or subjective to participants and outcome assessors. Overall, only two studies showed high risk of bias in more than one domain. The risk of bias of the included studies was mostly related to the blinding of participants and personnel and attrition bias. Reasons why risk of bias was unclear were often due to insufficient available information to clarify any judgement.
Certainty of the evidence
Overall, the certainty of the evidence for most of the outcomes was assessed as moderate. This includes the outcomes haemoglobin response and red blood cell transfusions as they showed inconsistency (mostly downgraded one point). For all other outcomes network meta‐analysis showed no important inconsistencies. Furthermore, the outcomes hypertension, thrombocytopenia or haemorrhage and thromboembolic events were assessed as moderate as well. Here, we mostly downgraded one point due to imprecision since 95% confidence intervals (CIs) are wide and/or cross unity. Because sensitivity analyses for the outcome overall mortality showed differences in the effect size and direction if high risk of bias studies were excluded, we downgraded one point for study limitations. We additionally downgraded one point for imprecision since 95% CIs are wide and crosses unity as well, resulting in low‐certainty evidence. We rated the outcome on study mortality as low or moderate certainty of the evidence because we downgraded one to two points for imprecision for the different comparisons.
Potential biases in the review process
Review author IM is an information specialist experienced in medical terminology, who developed the sensitive search strategy. We searched all relevant databases, trial registries, conference proceedings, and reference lists and are therefore confident that we identified all relevant trials.
To minimise potential biases in the review process, we conducted the selection of studies, data extraction, risk of bias assessment and GRADE assessment in duplicate by two independent review authors and consulted a third review author in case no consensus could be reached. We collated multiple reports of the same study, so that each study rather than each report was the unit of interest in the review. However, comprehensive reporting of identified records was partially scarce which complicated correct allocation of the reports. In case we were uncertain whether two reports belonged to the same trial we considered them as individual trials.
We decided to pool the treatments no iron and iron, if necessary. By doing so, we gained networks, which are more connected and were able to compare most of our included treatment options directly.
It is important to clarify that many of the included studies used haemoglobin thresholds of >12 g/dL. Some people think that ESAs do not increase mortality when less aggressive doses are used with smaller haemoglobin thresholds. This distinction would certainly be interesting in future work.
There are some older studies included in this review that used higher dosing of ESAs than currently recommended. Nevertheless, the number of participants and therefore weight of these studies is very small, so the impact of these studies for the overall result is very limited.
To analyse the number of red blood cell transfusions given, we used the thresholds for transfusion of the individual studies, however, often the thresholds were not reported. Therefore, we cannot say whether thresholds differ across individual studies or whether red blood cell transfusions were given based on clinical considerations. As a result, it would be possible that studies with higher thresholds may not show evidence for a difference between study arms.
For our primary outcome, we created funnel plots for comparisons including at least 10 studies. Nevertheless, we could have also created comparison‐adjusted funnel plots, which requires an assumption regarding the difference between small studies and large studies (e.g. newer treatments favoured in small trials, active treatment versus placebo, sponsored versus non‐sponsored) (Chaimani 2013). However, the challenge in network meta‐analysis is that we would need to take into account several comparisons, which means that we do not have one single line of reference. We therefore decided not to create comparison‐adjusted funnel plots.
For a more comprehensive presentation of results, we estimated absolute treatment effects using the actual reported event rates for our chosen main comparator (no treatment). However, if we would choose another comparator to estimate absolute event rates, these effects could all change. Thus, when interpreting the results of our network meta‐analysis, it must be considered that the reported absolute event rates are for illustrative purposes and do not reflect anticipated real‐life event rates.
In our opinion, the summary of findings tables are not ideal to sum up such extensive analyses. Also, we surmise that the overall judgement of the risk of bias in included trials and the certainty in the evidence could diverge between different author teams. Both the risk of bias tool and the GRADE approach are sensitive to subjective assessments and can be done more or less stringent.
Agreements and disagreements with other studies or reviews
To our knowledge, this is the first comprehensive review with network meta‐analysis comparing all possible treatment combinations of erythropoiesis‐stimulating agents (ESAs) and iron for the prevention and alleviation of anaemia in cancer patients
Compared to a systematic review analysing the use of ESAs for prophylaxis or treatment of anaemia in cancer patients with or without concurrent antineoplastic therapy (Bohlius 2006), our results are in parallel regarding the use of ESAs leading to a reduction of the number of red blood cell transfusions and increasing the number of thromboembolic events. Regarding overall mortality, our results showed a slightly lower effect than Bohlius 2006 (in that review evaluated as overall survival, also based on number of patients who died), which found increased mortality in the ESA group. Regarding haematological response, our results showed an even higher effect of ESAs compared to no treatment than Bohlius 2006.
Compared to a Cochrane Review with meta‐analysis based on individual patient data analysing the use of ESAs plus red blood cell transfusions (if necessary) versus red blood cell transfusions (if necessary) alone (Bohlius 2009), our results showed similar results regarding on‐study mortality and overall mortality. Nevertheless, our results showed no clear effect for ESA alone compared to no treatment, but results indicate increased mortality for participants treated with ESA.
Compared to a systematic review with meta‐analysis looking at the use of iron as a supplement to ESA and iron alone compared with ESA alone in the management of chemotherapy‐induced anaemia (Mhaskar 2016), our results are in parallel regarding the use of intravenous or oral iron in combination with ESAs leading to a higher haematological response and a reduced need for red blood cell transfusions and showing no meaningful differences in the number of thromboembolic events.

Overview of the ideal network (created with yEd)
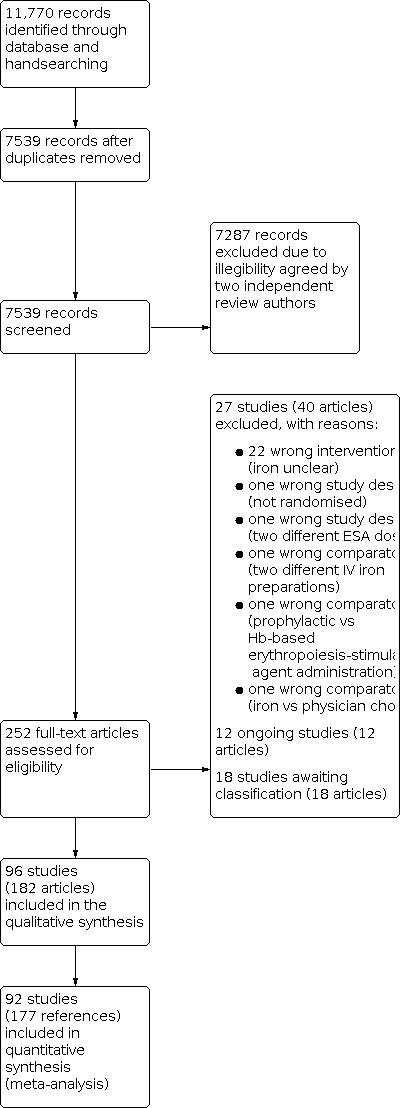
Study flow diagram.

Risk of bias summary: review authors' judgements about each risk of bias item for each included study.

Risk of bias graph: review authors' judgements about each risk of bias item presented as percentages across all included studies.

Network Graph for outcome on‐study mortality (created with yEd). Red lines: Subnet 1. Green lines: Subnet 2. Orange lines: Subnet 3.

Forest plot for outcome on‐study mortality. (a) Subnet 1. Reference treatment: No treatment (b) Subnet 2: Reference treatment: No ESA + iron, unclear application. Treatments are ordered by P score (descending). RR: risk ratio. CI: confidence interval.
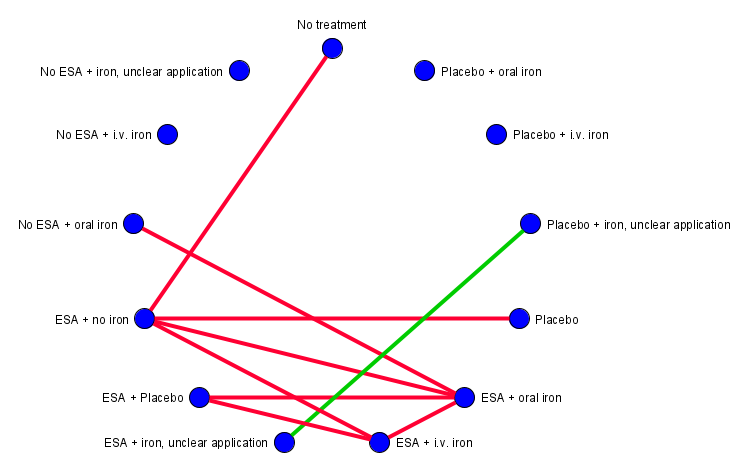
Network graph for outcome Hb response (created with yEd). Red lines: Subnet 1. Green line: Subnet 2.
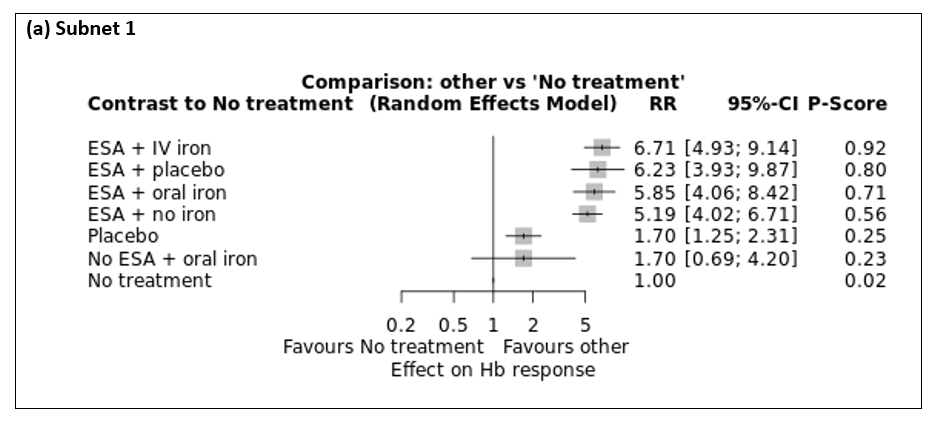
Forest plot for outcome Hb response. (a) Subnet 1. Reference treatment: No treatment. Treatments are ordered by P‐Score (descending). RR: risk ratio. CI: confidence interval.

Comparison of direct and indirect evidence (in closed loops) for outcome Hb response. RR: risk ratio. CI: confidence interval.

Netheat plot for outcome hb response (random effects model).
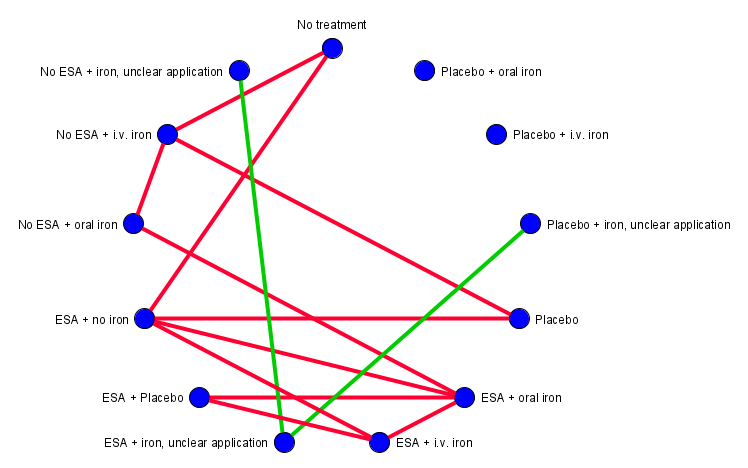
Network graph for outcome red blood cell transfusion (created with yEd). Red lines: Subnet 1. Green lines: Subnet 2.
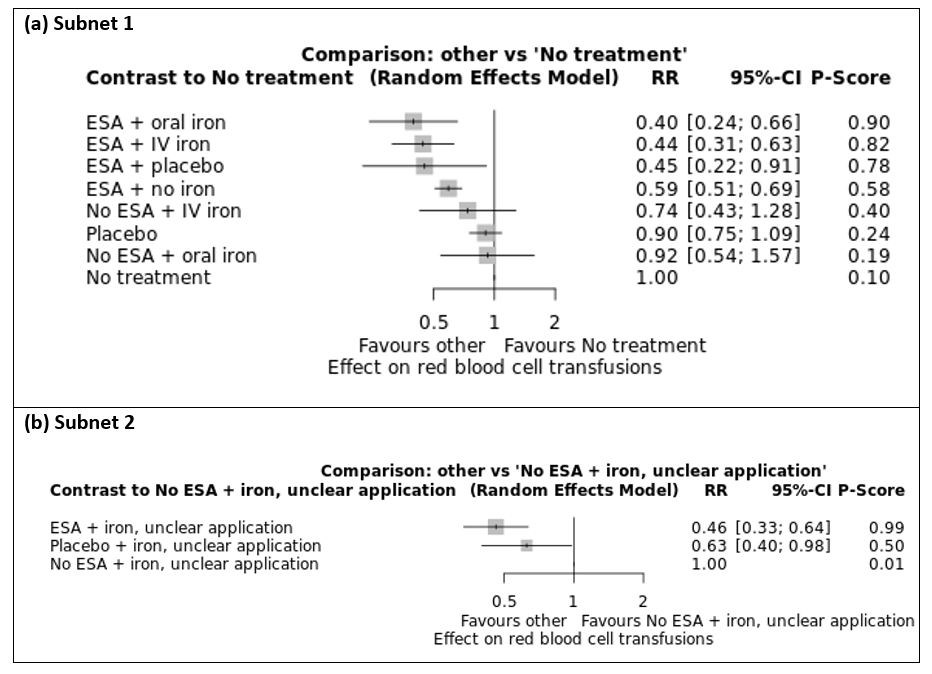
Forest plot for outcome red blood cell transfusions. (a) Subnet 1. Reference treatment: No treatment (b) Subnet 2. Reference treatment: No ESA + iron, unclear application. Treatments are ordered by P‐Score (descending). RR: risk ratio. CI: confidence interval.

Comparison of direct and indirect evidence (in closed loops) for outcome red blood cell transfusions. RR: risk ratio. CI: confidence interval.

Net heat plot for outcome red blood cell transfusions (random effects model).

Network graph for outcome number of red blood cell transfusions (created with yEd). Red lines: Subnet 1. Green lines: Subnet 2.
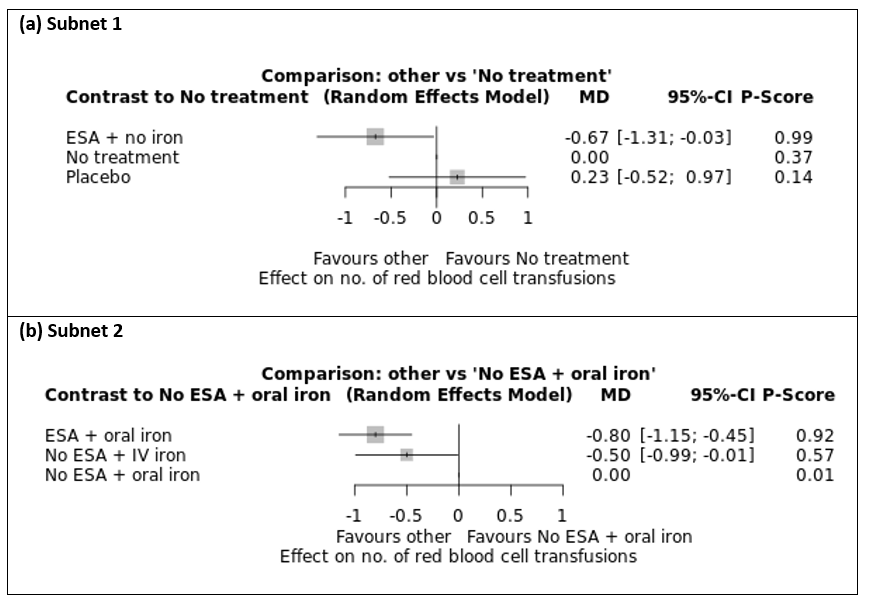
Forest plot for outcome number of red blood cell transfusions. (a) Subnet 1. Reference treatment: No treatment (b) Subnet 2. Reference treatment: No ESA + oral iron. Treatments are ordered by P‐Score (descending). MD: mean difference. CI: confidence interval.

Network graph for outcome overall mortality (created with yEd). Red lines: Subnet 1. Green lines: Subnet 2.

Forest plot for outcome overall mortality. (a) Subnet 1. Reference treatment: No treatment (b) Subnet 2. Reference treatment: No ESA + iron, unclear application. Treatments are ordered by P‐Score (descending). RR: risk ratio. CI: confidence interval.

Comparison of direct and indirect evidence (in closed loops) for outcome overall mortality. RR: risk ratio. CI: confidence interval.

Net heat plot for outcome overall mortality (random effects model).

Network graph for outcome thromboembolic events (created with yEd). Red lines: Subnet 1. Green lines: Subnet 2. Orange line: Subnet 3.

Forest plot for outcome thromboembolic events. (a) Subnet 1. Reference treatment: No treatment (b) Subnet 2. Reference treatment: No ESA + iron, unclear application. Treatments are ordered by P‐Score (descending). RR: risk ratio. CI: confidence interval.

Network graph for outcome thrombocytopenia or haemorrhage (created with yEd). Red lines: Subnet 1. Green lines: Subnet 2.

Forest plot for outcome thrombocytopenia or haemorrhage. (a) Subnet 1. Reference treatment: No treatment (b) Subnet 2. Reference treatment: No ESA + iron, unclear application. Treatments are ordered by P‐Score (descending). RR: risk ratio. CI: confidence interval.

Network graph for outcome rash (created with yEd). Red lines: Subnet 1. Green line: Subnet 2. Orange line: Subnet 3.

Forest plot for outcome rash. (a) Subnet 1. Reference treatment: No treatment. Treatments are ordered by P‐Score (descending). RR: risk ratio. CI: confidence interval.

Network graph for outcome hypertension (created with yEd). Red lines: Subnet 1. Green line: Subnet 2. Orange line: Subnet 3.

Forest plot for outcome hypertension. (a) Subnet 1. Reference treatment: No treatment. Treatments are ordered by P‐Score (descending). RR: risk ratio. CI: confidence interval.
| ESA with or without iron for cancer patients with anaemia | |||||
| Patient or population: patients at any age with solid cancer or haematological malignancy Settings: inpatient and outpatient care Intervention: ESA + IV iron, ESA + oral iron, ESA without iron Comparison: No treatment | |||||
| Outcomes | Anticipated absolute effects (95% CI)1 | Relative effects (95% CI)2 | Certainty of the evidence (GRADE) | Interpretation of findings | |
|---|---|---|---|---|---|
| Comparator | Intervention | ||||
| On‐study mortality3 (Subnet based on 55 studies including 15,074 participants) | No treatment 92 per 1000 | ESA plus IV iron 12 per 1000 (1 to 211) | RR 0.13 (0.01 to 2.29) | ⊕⊕⊝⊝ | Treatment with ESA and IV iron may decrease or increase on‐study mortality compared to no treatment. |
| ESA plus oral iron 34 per 1000 (1 to 1000 ) | RR 0.37 (0.01 to 27.38) | ⊕⊕⊝⊝ | Treatment with ESA and oral iron may decrease or increase on‐study mortality compared to no treatment. | ||
| ESA without iron 103 per 1000 (85 to 124) | RR 1.12 (0.92 to 1.35) | ⊕⊕⊕⊝ | Treatment with ESA probably slightly increases on‐study mortality compared to no treatment. | ||
| Haemoglobin response (Subnet based on 31 studies including 6985 participants) | No treatment 90 per 1000 | ESA plus IV iron 604 per 1000 (444 to 823) | RR 6.71 (4.93 to 9.14) | ⊕⊕⊕⊝ moderateb | Treatment with ESA and IV iron probably increases haemoglobin response compared to no treatment. |
| ESA plus oral iron 527 per 1000 (365 to 758) | RR 5.85 (4.06 to 8.42) | ⊕⊕⊕⊝ moderateb | Treatment with ESA and oral iron probably increases haemoglobin response compared to no treatment. | ||
| ESA without iron 467 per 1000 (362 to 604) | RR 5.19 (4.02 to 6.71) | ⊕⊕⊕⊝ moderateb | Treatment with ESA probably increases haemoglobin response compared to no treatment. | ||
| Red blood cell transfusions (Subnet based on 69 studies including 18,684 participants) | No treatment 360 per 1000 | ESA plus IV iron 158 per 1000 (112 to 227) | RR 0.44 (0.31 to 0.63) | ⊕⊕⊕⊝ moderateb | Treatment with ESA and IV iron probably decreases the need for red blood cell transfusions compared to no treatment. |
| ESA plus oral iron 144 per 1000 (86 to 238) | RR 0.40 (0.24 to 0.66) | ⊕⊕⊕⊝ moderateb | Treatment with ESA and oral iron probably decreases the need for red blood cell transfusions compared to no treatment. | ||
| ESA without iron 212 per 1000 (184 to 248) | RR 0.59 (0.51 to 0.69) | ⊕⊕⊕⊝ moderateb | Treatment with ESA probably decreases the need for red blood cell transfusions compared to no treatment. | ||
| Overall mortality4 (Subnet based on 71 studies including 21,576 participants) | No treatment 347 per 1000 | ESA plus IV iron 507 per 1000 (302 to 843) | RR 1.46 (0.87 to 2.43) | ⊕⊕⊝⊝ lowa,c | Treatment with ESA and IV iron may decrease or increase overall mortality compared to no treatment. |
| ESA plus oral iron 482 per 1000 (208 to 1000 ) | RR 1.39 (0.60 to 3.22) | ⊕⊕⊝⊝ lowa,c | Treatment with ESA and oral iron may decrease or increase overall mortality compared to no treatment. | ||
| ESA without iron 357 per 1000 (337 to 382) | RR 1.03 (0.97 to 1.10) | ⊕⊕⊝⊝ lowa,c | Treatment with ESA may lead to no or little difference in overall mortality compared to no treatment. | ||
| Thromboembolic events5 (Subnet based on 50 studies including 15,408 participants) | No treatment 36 per 1000 | ESA plus IV iron 66 per 1000 (35 to 123) | RR 1.82 (0.98 to 3.41) | ⊕⊕⊕⊝ | Treatment with ESA and IV iron probably increases the number of thromboembolic events slightly compared to no treatment. |
| ESA plus oral iron n.r. | ‐ | ‐ | ‐ | ||
| ESA without iron 66 per 1000 (48 to 89) | RR 1.82 (1.34 to 2.47) | ⊕⊕⊕⊕ high | Treatment with ESA slightly increases the number of thromboembolic events compared to no treatment. | ||
| Thrombocytopenia or haemorrhage5 (Subnet based on 13 studies including 2744 participants) | No treatment 76 per 1000 | ESA plus IV iron n.r. | ‐ | ‐ | ‐ |
| ESA plus oral iron n.r. | ‐ | ‐ | ‐ | ||
| ESA without iron 76 per 1000 (51 to 112) | RR 1.00 (0.67 to 1.48) | ⊕⊕⊕⊝ moderatea | Treatment with ESA probably leads to little or no difference in thrombocytopenia or haemorrhage compared to no treatment. | ||
| Hypertension5 (Subnet based on 24 studies including 8383 participants) | No treatment 10 per 1000 | ESA plus IV iron n.r. | ‐ | ‐ | ‐ |
| ESA plus oral iron n.r. | ‐ | ‐ | ‐ | ||
| ESA without iron 29 per 1000 (12 to 73) | RR 2.93 (1.19 to 7.25) | ⊕⊕⊕⊝ moderatea | Treatment with ESA probably increases the number of hypertensions compared to no treatment. | ||
| 1 Baseline risks obtained from the respective study population. Absolute risks in the intervention group result from product of control risk and risk ratio 2 Results from network meta‐analysis (random effects model). Network estimates are reported as risk ratios or mean difference with corresponding 95% confidence intervals. 3On‐study mortality is defined as deaths occurring up to 30 days after the active study period. 4Overall mortality is defined as deaths occurring up to the longest follow‐up available (median follow‐up: 12 weeks). 5Events occurring during the whole study period. aDowngraded one level for imprecision since 95% CI is wide and/or crosses unity bDowngraded one level for inconsistency (heterogeneity) cDowngraded one level for high risk of bias since exclusion of studies with overall high risk of bias changed results dDowngraded two levels for imprecision since 95% CI is very wide and crosses unity CI: confidence interval ;ESA: erythropoiesis‐stimulating agent; IV: intravenous; n.r.: not reported RR: risk ratio | |||||
| GRADE Working Group grades of evidence (or certainty in the evidence) High certainty: we are very confident that the true effect lies close to that of the estimate of the effect. | |||||
| IV or oral iron for cancer patients with anaemia | |||||
| Patient or population: patients at any age with solid cancer or haematological malignancy Settings: inpatient and outpatient care Intervention: No ESA + IV iron, No ESA + oral iron Comparison: No treatment | |||||
| Outcomes | Anticipated absolute effects (95% CI)1 | Relative effects (95% CI)2 | Certainty of the evidence (GRADE) | Interpretation of findings | |
|---|---|---|---|---|---|
| Comparator | Intervention | ||||
| On‐study mortality3 (Subnet based on 55 studies including 15,074 participants) | No treatment 92 per 1000 | No ESA plus IV iron 271 per 1000 (65 to 1000 ) | RR 2.95 (0.71 to 12.34) | ⊕⊕⊝⊝ | Treatment with IV iron alone may increase on‐study mortality compared to no treatment. |
| No ESA plus oral iron 24 per 1000 (0 to 1000 ) | RR 0.26 (0.00 to 19.73) | ⊕⊕⊝⊝ | Treatment with oral iron alone may decrease or increase on‐study mortality compared to no treatment. | ||
| Haemoglobin response (Subnet based on 31 studies including 6985 participants) | No treatment 90 per 1000 | No ESA plus IV iron n.r. | ‐ | ‐ | ‐ |
| No ESA plus oral iron 153 per 1000 (62 to 378) | RR 1.70 (0.69 to 4.20) | ⊕⊕⊝⊝ | Treatment with oral iron alone may increase haemoglobin response compared to no treatment. | ||
| Red blood cell transfusions (Subnet based on 69 studies including 18,684 participants) | No treatment 362 per 1000 | No ESA plus IV iron 268 per 1000 (156 to 463) | RR 0.74 (0.43 to 1.28) | ⊕⊕⊝⊝ | Treatment with IV iron alone may decrease or increase the need for red blood cell transfusions compared to no treatment. |
| No ESA plus oral iron 333 per 1000 (195 to 568) | RR 0.92 (0.54 to 1.57) | ⊕⊕⊝⊝ | Treatment with oral iron alone may decrease or increase the need for red blood cell transfusions compared to no treatment. | ||
| Overall mortality4 (Subnet based on 71 studies including 21,576 participants) | No treatment 347 per 1000 | No ESA plus IV iron 521 per 1000 (219 to 1000 ) | RR 1.50 (0.63 to 3.56) | ⊕⊕⊝⊝ | Treatment with IV iron alone may decrease or increase overall mortality compared to no treatment. |
| No ESA plus oral iron 534 per 1000 (229 to 1000 ) | RR 1.54 (0.66 to 3.56) | ⊕⊕⊝⊝ | Treatment with oral iron alone may decrease or increase overall mortality compared to no treatment. | ||
| Thromboembolic events5 (Subnet based on 50 studies including 15,408 participants) | No treatment n.r. | No ESA plus IV iron n.r. | ‐ | ‐ | ‐ |
| No ESA plus oral iron n.r. | ‐ | ‐ | ‐ | ||
| Thrombocytopenia or haemorrhage5 (Subnet based on 13 studies including 2744 participants) | No treatment n.r. | No ESA plus IV iron n.r. | ‐ | ‐ | ‐ |
| No ESA plus oral iron n.r. | ‐ | ‐ | ‐ | ||
| Hypertension5 (Subnet based on 24 studies including 8383 participants) | No treatment n.r. | No ESA plus IV iron n.r. | ‐ | ‐ | ‐ |
| No ESA plus oral iron n.r. | ‐ | ‐ | ‐ | ||
| 1 Baseline risks obtained from the respective study population. Absolute risks in the intervention group result from product of control risk and risk ratio 2 Results from network meta‐analysis (random effects model). Network estimates are reported as risk ratios or mean difference with corresponding 95% confidence intervals. 3On‐study mortality is defined as deaths occurring up to 30 days after the active study period. 4Overall mortality is defined as deaths occurring up to the longest follow‐up available (median follow‐up: 12 weeks). 5Events occurring during the whole study period. a Downgraded one level for imprecision since 95% CI is wide and/or crosses unity b Downgraded one level for inconsistency (heterogeneity) c Downgraded one level for high risk of bias since exclusion of studies with overall high risk of bias changed results dDowngraded two levels for imprecision since 95% CI is very wide and crosses unity ESA: erythropoiesis‐stimulating agent; IV: intravenous; RR: risk ratio; CI: confidence interval; n.r.: not reported | |||||
| GRADE Working Group grades of evidence (or certainty in the evidence) High certainty: we are very confident that the true effect lies close to that of the estimate of the effect. CI: confidence interval ;ESA: erythropoiesis‐stimulating agent; IV: intravenous; n.r.: not reported RR: risk ratio | |||||
| Subnet 1 | |||||||
|---|---|---|---|---|---|---|---|
| Heterogeneity / inconsistency: Q = 36.41, df = 48, P = 0.89; I² = 0%, Tau² = 0 | |||||||
| ESA + IV iron | . | 0.34 [0.01, 8.15] | . | . | . | 0.11 [0.01, 2.04] | . |
| 0.49 [0.02, 12.19] | No ESA + oral iron | 0.70 [0.41, 1.18] | . | . | 0.50 [0.05, 5.34] | . | . |
| 0.34 [0.01, 8.15] | 0.70 [0.41, 1.18] | ESA + oral iron | . | . | . | . | . |
| 0.13 [0.01, 2.34] | 0.27 [0.00, 20.17] | 0.38 [0.01, 27.99] | Placebo | . | . | 0.87 [0.79, 0.97] | . |
| 0.13 [0.01, 2.29] | 0.26 [0.00, 19.73] | 0.37 [0.01, 27.38] | 0.98 [0.78, 1.21] | No treatment | . | 0.90 [0.74, 1.09] | 0.34 [0.08, 1.41] |
| 0.17 [0.00, 8.94] | 0.35 [0.03, 3.95] | 0.50 [0.05, 5.34] | 1.30 [0.01, 174.72] | 1.34 [0.01, 179.66] | Placebo + oral iron | . | . |
| 0.11 [0.01, 2.04] | 0.23 [0.00, 17.61] | 0.34 [0.00, 24.44] | 0.87 [0.79, 0.97] | 0.90 [0.74, 1.09] | 0.67 [0.01, 90.01] | ESA + no iron | . |
| 0.04 [0.00, 1.09] | 0.09 [0.00, 8.41] | 0.13 [0.00, 11.68] | 0.33 [0.08, 1.40] | 0.34 [0.08, 1.41] | 0.25 [0.00, 41.84] | 0.38 [0.09, 1.60] | No ESA + IV iron |
| Subnet 2 | |||||||
| Heterogeneity / inconsistency: Q = 0.24, df = 1, P = 0.62; I² = 0%, Tau² = 0 | |||||||
| Placebo + iron, unclear application | 0.78 [0.51, 1.21] | . | |||||
| 0.78 [0.51, 1.21] | ESA + iron, unclear application | 0.42 [0.12, 1.53] | |||||
| 0.33 [0.08, 1.28] | 0.42 [0.12, 1.53] | No ESA + iron, unclear application | |||||
| Upper triangle: direct estimates; lower triangle: network estimates. Only subnets with >1 designs. Comparisons should be read from left to right, and the estimate is in the cell in common between the column‐defining treatment and the row‐defining treatment. Effect estimates are presented as risk ratios (RR) with corresponding 95% confidence interval. For the network estimates in the lower triangle an RR below 1.0 favours the column‐defining treatment and for the direct estimates in the upper triangle an RR below 1.0 favours the row‐defining treatment (less presence of deaths). To obtain RRs for comparisons in the opposing direction, reciprocals should be taken. Treatments are ordered by P‐Score (ascending). Subnet 1: No. of studies: 55. No. of treatments: 8. No. of pairwise comparisons: 55. No. of designs: 7 Subnet 2: No. of studies: 3. No. of treatments: 3. No. of pairwise comparisons: 3. No. of designs: 2 | |||||||
| Subnet 1 | ||||||
|---|---|---|---|---|---|---|
| Heterogeneity / inconsistency: Qtotal = 57.45, df = 28, P < 0.01 / Qwithin = 51.30, df = 25, P < 0.01 / Qbetween = 6.14, df = 3, P = 0.10; I² = 51.3%, Tau² = 0.0321 | ||||||
| ESA + IV iron | 1.04 [0.71, 1.52] | 1.14 [0.91, 1.43] | 1.32 [1.11, 1.57] | . | . | . |
| 1.08 [0.76, 1.53] | ESA + placebo | 1.03 [0.70, 1.51] | . | . | . | . |
| 1.15 [0.92, 1.43] | 1.07 [0.75, 1.51] | ESA + oral iron | 0.97 [0.67, 1.41] | . | 3.45 [1.50, 7.90] | . |
| 1.29 [1.09, 1.54] | 1.20 [0.82, 1.76] | 1.13 [0.87, 1.46] | ESA + no iron | 3.06 [2.58, 3.63] | . | 5.19 [4.02, 6.71] |
| 3.95 [3.10, 5.04] | 3.67 [2.42, 5.58] | 3.45 [2.53, 4.70] | 3.06 [2.58, 3.63] | Placebo | . | . |
| 3.96 [1.68, 9.33] | 3.67 [1.49, 9.04] | 3.45 [1.50, 7.90] | 3.06 [1.28, 7.30] | 1.00 [0.41, 2.43] | No ESA + oral iron | . |
| 6.71 [4.93, 9.14] | 6.23 [3.93, 9.87] | 5.85 [4.06, 8.42] | 5.19 [4.02, 6.71] | 1.70 [1.25, 2.31] | 1.70 [0.69, 4.20] | No treatment |
| Upper triangle: direct estimates; lower triangle: network estimates. Only subnets with >1 designs. Comparisons should be read from left to right, and the estimate is in the cell in common between the column‐defining treatment and the row‐defining treatment. Effect estimates are presented as risk ratios (RR) with corresponding 95% confidence interval. For the network estimates in the lower triangle an RR above 1.0 favours the column‐defining treatment and for the direct estimates in the upper triangle an RR above 1.0 favours the row‐defining treatment (more presence of haemoglobin responses). To obtain RRs for comparisons in the opposing direction, reciprocals should be taken. Treatments are ordered by P‐Score (ascending). Subnet 1: No. of studies: 31. No. of treatments: 7. No. of pairwise comparisons: 37. No. of designs: 7 | ||||||
| Comparison | No. of studies | Network estimate | Direct estimate | Indirect estimate | Test |
|---|---|---|---|---|---|
| ESA + IV iron vs. | 6 | 1.29 [1.09, 1.54] | 1.32 [1.11, 1.57] | 0.53 [0.17, 1.67] | 0.1234 |
| ESA + IV iron vs. | 4 | 1.15 [0.92, 1.43] | 1.14 [0.91, 1.43] | 1.25 [0.47, 3.32] | 0.8565 |
| ESA + IV iron vs. | 1 | 1.08 [0.76, 1.53] | 1.04 [0.71, 1.52] | 1.29 [0.54, 3.06] | 0.6559 |
| ESA + no iron vs. | 2 | 0.89 [0.69, 1.15] | 1.03 [0.71, 1.50] | 0.77 [0.54, 1.11] | 0.2792 |
| ESA + oral iron vs. | 1 | 0.94 [0.66, 1.33] | 0.97 [0.66, 1.43] | 0.79 [0.34, 1.84] | 0.6559 |
| Estimates are reported as risk ratios with corresponding 95% confidence interval. Result of test for disagreement between direct and indirect evidence reported as p‐value. Only comparisons for which both direct and indirect evidence exists are shown. | |||||
| Subnet 1 | |||||||
|---|---|---|---|---|---|---|---|
| Heterogeneity/Inconsistency: Qtotal = 162.04, df = 65, P < 0.01 / Qwithin = 159.35, df = 61, P < 0.01 / Qbetween = 2.68, df = 4, P = 0.61; I² = 59.9%, Tau² = 0.0447 | |||||||
| ESA + oral iron | 0.81 [0.48, 1.38] | 0.95 [0.48, 1.91] | 0.41 [0.19, 0.91] | . | . | 0.45 [0.34, 0.60] | . |
| 0.90 [0.56, 1.43] | ESA + IV iron | 0.90 [0.45, 1.82] | 0.74 [0.53, 1.03] | . | . | . | . |
| 0.88 [0.46, 1.68] | 0.98 [0.51, 1.88] | ESA + placebo | . | . | . | . | . |
| 0.67 [0.41, 1.09] | 0.75 [0.54, 1.03] | 0.76 [0.38, 1.52] | ESA + no iron | . | 0.65 [0.59, 0.72] | . | 0.59 [0.51, 0.69] |
| 0.54 [0.32, 0.90] | 0.60 [0.34, 1.06] | 0.61 [0.28, 1.32] | 0.80 [0.47, 1.37] | No ESA + IV iron | 1.07 [0.48, 2.38] | 0.68 [0.39, 1.18] | 0.89 [0.23, 3.35] |
| 0.44 [0.27, 0.72] | 0.49 [0.35, 0.68] | 0.50 [0.25, 1.00] | 0.65 [0.59, 0.73] | 0.82 [0.48, 1.39] | Placebo | . | . |
| 0.43 [0.33, 0.57] | 0.48 [0.29, 0.80] | 0.49 [0.25, 0.97] | 0.64 [0.38, 1.07] | 0.80 [0.50, 1.29] | 0.98 [0.58, 1.65] | No ESA + oral iron | . |
| 0.40 [0.24, 0.66] | 0.44 [0.31, 0.63] | 0.45 [0.22, 0.91] | 0.59 [0.51, 0.69] | 0.74 [0.43, 1.28] | 0.90 [0.75, 1.09] | 0.92 [0.54, 1.57] | No treatment |
| Subnet 2 | |||||||
| Heterogeneity/Inconsistency: Q=5.00, df=4, p=0.29; I²=19.9%, Tau²=0.0168 | |||||||
| ESA + iron, unclear application | 0.74 [0.54, 1.00] | 0.46 [0.33, 0.64] | |||||
| 0.74 [0.54, 1.00] | Placebo + iron, unclear application | . | |||||
| 0.46 [0.33, 0.64] | 0.63 [0.40, 0.98] | No ESA + iron, unclear application | |||||
| Upper triangle: direct estimates; lower triangle: network estimates. Only subnets with >1 designs. Comparisons should be read from left to right, and the estimate is in the cell in common between the column‐defining treatment and the row‐defining treatment. Effect estimates are presented as risk ratios (RR) with corresponding 95% confidence interval. For the network estimates in the lower triangle an RR below 1.0 favours the column‐defining treatment and for the direct estimates in the upper triangle an RR below 1.0 favours the row‐defining treatment (less presence of red blood cell transfusions). To obtain RRs for comparisons in the opposing direction, reciprocals should be taken. Treatments are ordered by P‐Score (ascending). Subnet 1: No. of studies: 69. No. of treatments: 8. No. of pairwise comparisons: 75. No. of designs: 9 Subnet 2: No. of studies: 6. No. of treatments: 3. No. of pairwise comparisons: 6. No. of designs: 2 | |||||||
| Comparison | No. of studies | Network estimate | Direct estimate | Indirect estimate | Test for disagreement |
|---|---|---|---|---|---|
| ESA + IV iron vs. ESA + no iron | 6 | 0.75 [0.54, 1.03] | 0.74 [0.53, 1.03] | 0.83 [0.27, 2.61] | 0.8487 |
| ESA + IV iron vs. ESA + oral iron | 3 | 1.12 [0.70, 1.78] | 1.23 [0.72, 2.09] | 0.80 [0.30, 2.13] | 0.4522 |
| ESA + IV iron vs. ESA + placebo | 1 | 0.98 [0.51, 1.88] | 0.90 [0.45, 1.82] | 1.58 [0.30, 8.46] | 0.5448 |
| ESA + no iron vs. ESA + oral iron | 2 | 1.49 [0.92, 2.41] | 2.43 [1.10, 5.37] | 1.12 [0.61, 2.05] | 0.1270 |
| ESA + no iron vs. No treatment | 19 | 0.59 [0.51, 0.69] | 0.59 [0.51, 0.69] | 0.74 [0.17, 3.14] | 0.7669 |
| ESA + no iron vs. Placebo | 33 | 0.65 [0.59, 0.73] | 0.65 [0.59, 0.72 | 1.07 [0.37, 3.11] | 0.3697 |
| ESA + oral iron vs. ESA + placebo | 1 | 0.88 [0.46, 1.68] | 0.95 [0.48, 1.91] | 0.54 [0.10, 2.99] | 0.5448 |
| ESA + oral iron vs. No ESA + oral iron | 6 | 0.43 [0.33, 0.57] | 0.45 [0.34, 0.60] | 0.24 [0.08, 0.69] | 0.2592 |
| No ESA + IV iron vs. No ESA + oral iron | 2 | 0.80 [0.50, 1.29] | 0.68 [0.39, 1.18] | 1.27 [0.50, 3.24] | 0.2592 |
| No ESA + IV iron vs. No treatment | 1 | 0.74 [0.43, 1.28] | 0.89 [0.23, 3.35] | 0.71 [0.39, 1.30] | 0.7669 |
| No ESA + IV iron vs. Placebo | 1 | 0.82 [0.48, 1.39] | 1.07 [0.48, 2.38] | 0.65 [0.32, 1.34] | 0.3697 |
| Estimates are reported as risk ratios with corresponding 95% confidence interval. Result of test for disagreement between direct and indirect evidence reported as p‐value. Only comparisons for which both direct and indirect evidence exists are shown. | |||||
| Subnet 1 | ||
|---|---|---|
| Heterogeneity / inconsistency: Q = 39.86, df = 17, P < 0.01; I² = 57.4%, Tau² = 0.2548 | ||
| ESA + no iron | ‐0.67 [‐1.31, ‐0.03] | ‐0.90 [‐1.29, ‐0.51] |
| ‐0.67 [‐1.31, ‐0.03] | No treatment | . |
| ‐0.90 [‐1.29, ‐0.51] | ‐0.23 [‐0.97, 0.52] | Placebo |
| Subnet 2 | ||
| Heterogeneity / inconsistency: Not applicable (subnet consists of only two pairwise comparisons) | ||
| ESA + oral iron | . | ‐0.80 [‐1.15, ‐0.45] |
| ‐0.30 [‐0.90, 0.30] | No ESA + IV iron | ‐0.50 [‐0.99, ‐0.01] |
| ‐0.80 [‐1.15, ‐0.45] | ‐0.50 [‐0.99, ‐0.01] | No ESA + oral iron |
| Upper triangle: direct estimates; lower triangle: network estimates. Only subnets with >1 designs. Comparisons should be read from left to right, and the estimate is in the cell in common between the column‐defining treatment and the row‐defining treatment. Effect estimates are presented as standardised mean differences (SMD) with corresponding 95% confidence interval. For the network estimates in the lower triangle an SMD below 0.0 favours the column‐defining treatment and for the direct estimates in the upper triangle an SMD below 0.0 favours the row‐defining treatment (smaller number of red blood cell transfusions). To obtain RRs for comparisons in the opposing direction, reciprocals should be taken. Treatments are ordered by P‐Score (ascending). Subnet 1: No. of studies: 19. No. of treatments: 3. No. of pairwise comparisons: 19. No. of designs: 2 Subnet 2: No. of studies: 2. No. of treatments: 3. No. of pairwise comparisons: 2. No. of designs: 2 | ||
| Subnet 1 | ||||||||
|---|---|---|---|---|---|---|---|---|
| Heterogeneity / inconsistency: Qtotal = 61.55, df = 65, P = 0.60 / Qwithin = 59.02, df = 61, P = 0.55 / Qbetween = 2.53, df = 4, P = 0.64; I² = 0%, Tau² = 0 | ||||||||
| ESA + placebo | . | . | . | 0.50 [0.13, 1.97] | . | 0.38 [0.10, 1.40] | . | . |
| 0.61 [0.16, 2.34] | No treatment | 0.97 [0.91, 1.03] | . | . | 0.34 [0.08, 1.41] | . | . | . |
| 0.59 [0.15, 2.27] | 0.97 [0.91, 1.03] | ESA + no iron | 0.99 [0.96, 1.02] | 1.94 [0.18, 20.81] | . | 0.76 [0.45, 1.29] | . | . |
| 0.58 [0.15, 2.24] | 0.96 [0.90, 1.03] | 0.99 [0.96, 1.02] | Placebo | . | . | . | . | . |
| 0.44 [0.12, 1.62] | 0.72 [0.31, 1.66] | 0.74 [0.32, 1.71] | 0.75 [0.32, 1.73] | ESA + oral iron | . | 0.74 [0.30, 1.83] | 0.91 [0.84, 0.98] | 0.50 [0.05, 5.34] |
| 0.40 [0.11, 1.55] | 0.67 [0.28, 1.58] | 0.69 [0.29, 1.63] | 0.69 [0.29, 1.64] | 0.93 [0.66, 1.31] | No ESA + IV iron | . | 0.94 [0.67, 1.33] | . |
| 0.42 [0.12, 1.50] | 0.69 [0.41, 1.15] | 0.71 [0.43, 1.18] | 0.72 [0.43, 1.19] | 0.96 [0.44, 2.09] | 1.03 [0.46, 2.34] | ESA + IV iron | . | . |
| 0.40 [0.11, 1.47] | 0.65 [0.28, 1.51] | 0.67 [0.29, 1.56] | 0.68 [0.29, 1.57] | 0.91 [0.84, 0.98] | 0.98 [0.70, 1.37] | 0.95 [0.43, 2.07] | No ESA + oral iron | . |
| 0.22 [0.01, 3.27] | 0.36 [0.03, 4.43] | 0.37 [0.03, 4.57] | 0.37 [0.03, 4.62] | 0.50 [0.05, 5.34] | 0.54 [0.05, 5.91] | 0.52 [0.04, 6.33] | 0.55 [0.05, 5.90] | Placebo + oral iron |
| Subnet 2 | ||||||||
| Heterogeneity / inconsistency: Q = 1.27, df = 3, P = 0.74; I² = 0%, Tau² = 0 | ||||||||
| ESA + iron, unclear application | 1.00 [0.87, 1.15] | 1.25 [0.94, 1.66] | ||||||
| 1.00 [0.87, 1.15] | Placebo + iron, unclear application | . | ||||||
| 1.25 [0.94, 1.66] | 1.24 [0.90, 1.71] | No ESA + iron, unclear application | ||||||
| Upper triangle: direct estimates; lower triangle: network estimates. Only subnets with >1 designs. Comparisons should be read from left to right, and the estimate is in the cell in common between the column‐defining treatment and the row‐defining treatment. Effect estimates are presented as risk ratios (RR) with corresponding 95% confidence interval. For the network estimates in the lower triangle an RR below 1.0 favours the column‐defining treatment and for the direct estimates in the upper triangle an RR below 1.0 favours the row‐defining treatment (less presence of deaths). To obtain RRs for comparisons in the opposing direction, reciprocals should be taken. Treatments are ordered by P‐Score (ascending). Subnet 1: No. of studies: 71. No. of treatments: 9. No. of pairwise comparisons: 75. No. of designs: 10 Subnet 2: No. of studies: 5. No. of treatments: 3. No. of pairwise comparisons: 5. No. of designs: 2 | ||||||||
| Comparison | No. of studies | Network estimate | Direct estimate | Indirect estimate | Test for disagreement |
|---|---|---|---|---|---|
| ESA + IV iron vs. ESA + no iron | 4 | 1.41 [0.85, 2.34] | 1.32 [0.78, 2.24] | 3.02 [0.51, 17.69] | 0.3785 |
| ESA + IV iron vs. ESA + oral iron | 3 | 1.05 [0.48, 2.28] | 1.35 [0.55, 3.32] | 0.48 [0.10, 2.31] | 0.2655 |
| ESA + IV iron vs. ESA + placebo | 1 | 2.40 [0.67, 8.59] | 2.65 [0.72, 9.81] | 0.34 [0.00, 107.93] | 0.4942 |
| ESA + no iron vs. ESA + oral iron | 1 | 0.74 [0.32, 1.71] | 1.94 [0.18, 20.81] | 0.65 [0.26, 1.58] | 0.3969 |
| ESA + no iron vs. No treatment | 21 | 1.03 [0.97, 1.10] | 1.03 [0.97, 1.10] | 2.98 [0.50, 17.88] | 0.2452 |
| ESA + oral iron vs. ESA + placebo | 1 | 2.29 [0.62, 8.51] | 2.00 [0.51, 7.86] | 10.64 [0.11, 1050.39] | 0.4942 |
| ESA + oral iron vs. No ESA + oral iron | 8 | 0.91 [0.84, 0.98] | 0.91 [0.84, 0.98] | 0.31 [0.05, 1.88] | 0.2452 |
| No ESA + IV iron vs. No ESA + oral iron | 1 | 0.98 [0.70, 1.37] | 0.94 [0.67, 1.33] | 2.72 [0.47, 15.81] | 0.2452 |
| No ESA + IV iron vs. No treatment | 1 | 1.50 [0.71, 3.56] | 2.95 [0.71, 12.34] | 1.02 [0.35, 3.01] | 0.2452 |
| Estimates are reported as risk ratios with corresponding 95% confidence interval. Result of test for disagreement between direct and indirect evidence reported as p‐value. Only comparisons for which both direct and indirect evidence exists are shown. | |||||
| Subnet 1 | |||
|---|---|---|---|
| Heterogeneity / inconsistency: Q = 31.54, df = 47, P = 0.96; I² = 0%, Tau² = 0 | |||
| No treatment | . | . | 0.55 [0.41, 0.74] |
| 0.74 [0.53, 1.04] | Placebo | . | 0.74 [0.63, 0.86] |
| 0.55 [0.29, 1.02] | 0.74 [0.42, 1.30] | ESA + IV iron | 1.00 [0.58, 1.73] |
| 0.55 [0.41, 0.74] | 0.74 [0.63, 0.86] | 1.00 [0.58, 1.73] | ESA + no iron |
| Subnet 2 | |||
| Heterogeneity / inconsistency: Not applicable (subnet consists of only 2 studies) | |||
| No ESA + iron, unclear application | . | 0.68 [0.36, 1.28] | |
| 1.01 [0.31, 3.31] | Placebo + iron, unclear application | 0.68 [0.25, 1.86] | |
| 0.68 [0.36, 1.28] | 0.68 [0.25, 1.86] | ESA + iron, unclear application | |
| Upper triangle: direct estimates; lower triangle: network estimates. Only subnets with >1 designs. Comparisons should be read from left to right, and the estimate is in the cell in common between the column‐defining treatment and the row‐defining treatment. Effect estimates are presented as risk ratios (RR) with corresponding 95% confidence interval. For the network estimates in the lower triangle an RR below 1.0 favours the column‐defining treatment and for the direct estimates in the upper triangle an RR below 1.0 favours the row‐defining treatment (less presence of thromboembolic events). To obtain RRs for comparisons in the opposing direction, reciprocals should be taken. Treatments are ordered by P‐Score (ascending). Subnet 1: No. of studies: 50. No. of treatments: 4. No. of pairwise comparisons: 50. No. of designs: 3 Subnet 2: No. of studies: 2. No. of treatments: 3. No. of pairwise comparisons: 2. No. of designs: 2 | |||
| Subnet 1 | ||
|---|---|---|
| Heterogeneity / inconsistency: Q = 7.84, df = 11, P = 0.73, I² = 0%, Tau² = 0 | ||
| Placebo | . | 0.84 [0.72, 0.99] |
| 0.84 [0.55, 1.29] | No treatment | 1.00 [0.67, 1.49] |
| 0.84 [0.72, 0.99] | 1.00 [0.67, 1.49] | ESA + no iron |
| Subnet 2 | ||
| Heterogeneity / inconsistency: Not applicable (subnetwork consists of only 2 studies) | ||
| ESA + iron, unclear application | 1.00 [0.40, 2.49] | 0.69 [0.27, 1.76] |
| 1.00 [0.40, 2.49] | No ESA + iron, unclear application | . |
| 0.69 [0.27, 1.76] | 0.69 [0.19, 2.57] | Placebo + iron, unclear application |
| Upper triangle: direct estimates; lower triangle: network estimates. Only subnets with >1 designs. Comparisons should be read from left to right, and the estimate is in the cell in common between the column‐defining treatment and the row‐defining treatment. Effect estimates are presented as risk ratios (RR) with corresponding 95% confidence interval. For the network estimates in the lower triangle an RR below 1.0 favours the column‐defining treatment and for the direct estimates in the upper triangle an RR below 1.0 favours the row‐defining treatment (less presence of thrombocytopenia or haemorrhage). To obtain RRs for comparisons in the opposing direction, reciprocals should be taken. Treatments are ordered by P‐Score (ascending). Subnet 1: No. of studies: 13. No. of treatments: 3. No. of pairwise comparisons: 13. No. of designs: 2 Subnet 2: No. of studies: 2. No. of treatments: 3. No. of pairwise comparisons: 2. No. of designs: 2 | ||
| Subnet 1 | ||
|---|---|---|
| Heterogeneity / inconsistency: Q = 9.88, df = 12, P = 0.63; I² = 0%, Tau² = 0 | ||
| No treatment | . | 0.66 [0.28, 1.56] |
| 0.80 [0.30, 2.13] | Placebo | 0.83 [0.52, 1.32] |
| 0.66 [0.28, 1.56] | 0.83 [0.52, 1.32] | ESA + no iron |
| Upper triangle: direct estimates; lower triangle: network estimates. Only subnets with >1 designs. Comparisons should be read from left to right, and the estimate is in the cell in common between the column‐defining treatment and the row‐defining treatment. Effect estimates are presented as risk ratios (RR) with corresponding 95% confidence interval. For the network estimates in the lower triangle an RR below 1.0 favours the column‐defining treatment and for the direct estimates in the upper triangle an RR below 1.0 favours the row‐defining treatment (less presence of rash. To obtain RRs for comparisons in the opposing direction, reciprocals should be taken. Treatments are ordered by P‐Score (ascending). Subnet 1: No. of studies: 14. No. of treatments: 3. No. of pairwise comparisons: 14. No. of designs: 2 | ||
| Subnet 1 | ||
|---|---|---|
| Heterogeneity / inconsistency: Q = 17.54, df = 22, P = 0.73; I² = 0%, Tau² = 0 | ||
| No treatment | . | 0.34 [0.14, 0.84] |
| 0.35 [0.14, 0.89] | Placebo | 0.96 [0.81, 1.15] |
| 0.34 [0.14, 0.84] | 0.96 [0.81, 1.15] | ESA + no iron |
| Upper triangle: direct estimates; lower triangle: network estimates. Only subnets with >1 designs. Comparisons should be read from left to right, and the estimate is in the cell in common between the column‐defining treatment and the row‐defining treatment. Effect estimates are presented as risk ratios (RR) with corresponding 95% confidence interval. For the network estimates in the lower triangle an RR below 1.0 favours the column‐defining treatment and for the direct estimates in the upper triangle an RR below 1.0 favours the row‐defining treatment (less presence of hypertension). To obtain RRs for comparisons in the opposing direction, reciprocals should be taken. Treatments are ordered by P‐Score (ascending). Subnet 1: No. of studies: 24. No. of treatments: 3. No. of pairwise comparisons: 24 No. of designs: 2 | ||