Intravenous iron versus oral iron versus no iron with or without erythropoiesis‐ stimulating agents (ESA) for cancer patients with anaemia: a systematic review and network meta‐analysis
Information
- DOI:
- https://doi.org/10.1002/14651858.CD012633.pub2Copy DOI

- Database:
-
- Cochrane Database of Systematic Reviews
- Version published:
-
- 20 June 2022see what's new
- Type:
-
- Intervention
- Stage:
-
- Review
- Cochrane Editorial Group:
-
Cochrane Haematology Group
- Copyright:
-
- Copyright © 2022 The Cochrane Collaboration. Published by John Wiley & Sons, Ltd.
Article metrics
Altmetric:
Cited by:
Authors
Contributions of authors
Anne Adams: review development, screening, data extraction, risk of bias assessment, grading, statistical evaluation, interpretation of results, writing of the review
Benjamin Scheckel: review development, screening, data extraction, writing of the review
Anissa Habsaoui: review development, risk of bias assessment, writing of the review
Madhuri Haque: review development, risk of bias assessment, data extraction
Kathrin Kuhr: statistical evaluation
Ina Monsef: search strategy development
Julia Bohlius: methodological expertise
Nicole Skoetz: review development, methodological expertise, screening, data extraction, risk of bias assessment, grading, interpretation of results
Sources of support
Internal sources
-
University Hospital Cologne, Department I of Internal Medicine, Center for Integrated Oncology Aachen Bonn Cologne Duesseldorf, Germany
Provision of the offices, including technical equipment
-
Institute of Medical Statistics and Computational Biology, Germany
Support with statistical expertise
External sources
-
Federal Ministry of Education and Research, Germany
Funding number 01KG1405
Declarations of interest
Anne Adams: none known; she is a statistical editor with Cochrane Haematology, but was not involved in the editorial process for this review.
Benjamin Scheckel: none known.
Anissa Habsaoui: none known.
Madhuri Haque: none known.
Kathrin Kuhr: none known.
Ina Monsef: none known.
Julia Bohlius: none known; she is an editor with Cochrane Haematology, but was not involved in the editorial process for this review.
Nicole Skoetz: none known; she is an editor with Cochrane Haematology, but was not involved in the editorial process for this review.
Acknowledgements
We would like to thank the following members of Cochrane Haematology for their comments and improving the review: Dr Guido Schwarzer, Prof. Benjamin Djulbegovic, Prof. Rahul Mhaskar and the consumer editor Anne Lyddiatt.
We would like to thank the Cochrane Member Yuan Chi for translating a Chinese paper.
The following people conducted the editorial process for this article:
-
Sign‐off Editor (final editorial decision): Toby Lasserson, Deputy Editor in Chief, Cochrane
-
Managing Editor (selected peer reviewers, collated peer‐reviewer comments, provided editorial guidance to authors, edited the article): Colleen Olveman, Cochrane Central Editorial Service
-
Editorial Assistant (conducted editorial policy checks and supported editorial team): Leticia Rodrigues, Cochrane Central Editorial Service
-
Copy Editor (copy editing and production): Heather Maxwell, Cochrane Production Team
-
Peer‐reviewers (provided comments and recommended an editorial decision): Prof. Sunday Ocheni, Department of Haematology & Immunology, University of Nigeria (clinical review), Nuala Livingstone, Cochrane Evidence Production and Methods Directorate (methods review), Andrew Bäck, Statistical Editor, Methods Support Unit, Cochrane (methods review), Douglas M Salzwedel, Cochrane Hypertension (search review). Two additional peer reviewers provided clinical peer review but chose not to be publicly acknowledged.
Version history
| Published | Title | Stage | Authors | Version |
| 2022 Jun 20 | Intravenous iron versus oral iron versus no iron with or without erythropoiesis‐ stimulating agents (ESA) for cancer patients with anaemia: a systematic review and network meta‐analysis | Review | Anne Adams, Benjamin Scheckel, Anissa Habsaoui, Madhuri Haque, Kathrin Kuhr, Ina Monsef, Julia Bohlius, Nicole Skoetz | |
| 2017 Apr 16 | Intravenous iron versus oral iron versus no iron with or without erythropoiesis‐ stimulating agents (ESA) for cancer patients with anaemia: A systematic review and network meta‐analysis | Protocol | Aaron Weigl, Nicola Köhler, Ina Monsef, Julia Bohlius, Kathrin Kuhr, Ingrid Becker, Nicole Skoetz | |
Differences between protocol and review
Types of interventions
Since the indication and application form of iron often in the included studies remained unclear we had to add treatment comparisons to the intended network (compare bullet list in methods section and results).
To minimise the uncertainty in the network, we decided to exclude the treatment iron unclear because it is not known whether the patient has received iron or not.
Additionally, we decided to combine the treatments no iron and iron if necessary. According to the study protocols, both patient populations did not receive any iron at the start of the study. Therefore we consider both groups similar. However, in both populations (also in the "no iron" population), participants may have received iron if the attending physician deemed iron necessary. As the attending physician's decision could be different in different situations, participants may or may not have received iron (no clear criteria in studies indicated when iron was considered “necessary”).
Types of outcome measures
As the outcome overall survival was rarely reported in studies, we could not analyse this pre‐planned time‐to‐event outcome. Instead, most studies reported numbers of people being dead (binary outcome, overall mortality). As survival/mortality outcomes are of utmost importance for participants, we analysed the binary outcome overall mortality, integrating also results form studies which reported overall survival.
We also decided to add the outcome number of patients with red blood cell transfusions, as this outcome is highly relevant for patients (more visits in specialised care centres for blood transfusion).
Missing outcome data
We did not contact study authors, because data were already available based on the IPD meta‐analysis (Bohlius 2009).
Data synthesis
Since the focus of this review is on the network meta‐analyses, and direct estimates are also reported in the league tables, we refrained from reporting forest plots of pairwise comparisons.
Subgroup analyses
We did not analyse subgroups for different routes of iron administration (IV, oral) since these were included as different treatment options in our network meta‐analysis for each outcome.
Additionally, we did not conduct subgroup analyses for type of iron and duration of follow‐up because these were less reported.
Furthermore, most of the studies included participants with solid or mixed tumours, so no subgroup analyses were performed for cancer type.
Notes
Some passages in the protocol and review, especially in the methods part, are from the standard template of Cochrane Haematology.
Keywords
MeSH
Medical Subject Headings (MeSH) Keywords
Medical Subject Headings Check Words
Humans;
PICOs

Overview of the ideal network (created with yEd)


Risk of bias summary: review authors' judgements about each risk of bias item for each included study.

Risk of bias graph: review authors' judgements about each risk of bias item presented as percentages across all included studies.

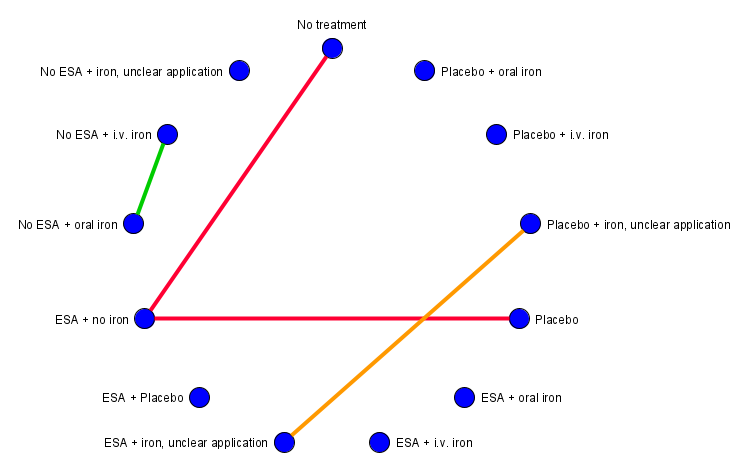
Network Graph for outcome on‐study mortality (created with yEd). Red lines: Subnet 1. Green lines: Subnet 2. Orange lines: Subnet 3.

Forest plot for outcome on‐study mortality. (a) Subnet 1. Reference treatment: No treatment (b) Subnet 2: Reference treatment: No ESA + iron, unclear application. Treatments are ordered by P score (descending). RR: risk ratio. CI: confidence interval.

Network graph for outcome Hb response (created with yEd). Red lines: Subnet 1. Green line: Subnet 2.

Forest plot for outcome Hb response. (a) Subnet 1. Reference treatment: No treatment. Treatments are ordered by P‐Score (descending). RR: risk ratio. CI: confidence interval.

Comparison of direct and indirect evidence (in closed loops) for outcome Hb response. RR: risk ratio. CI: confidence interval.

Netheat plot for outcome hb response (random effects model).

Network graph for outcome red blood cell transfusion (created with yEd). Red lines: Subnet 1. Green lines: Subnet 2.

Forest plot for outcome red blood cell transfusions. (a) Subnet 1. Reference treatment: No treatment (b) Subnet 2. Reference treatment: No ESA + iron, unclear application. Treatments are ordered by P‐Score (descending). RR: risk ratio. CI: confidence interval.

Comparison of direct and indirect evidence (in closed loops) for outcome red blood cell transfusions. RR: risk ratio. CI: confidence interval.

Net heat plot for outcome red blood cell transfusions (random effects model).

Network graph for outcome number of red blood cell transfusions (created with yEd). Red lines: Subnet 1. Green lines: Subnet 2.

Forest plot for outcome number of red blood cell transfusions. (a) Subnet 1. Reference treatment: No treatment (b) Subnet 2. Reference treatment: No ESA + oral iron. Treatments are ordered by P‐Score (descending). MD: mean difference. CI: confidence interval.

Network graph for outcome overall mortality (created with yEd). Red lines: Subnet 1. Green lines: Subnet 2.

Forest plot for outcome overall mortality. (a) Subnet 1. Reference treatment: No treatment (b) Subnet 2. Reference treatment: No ESA + iron, unclear application. Treatments are ordered by P‐Score (descending). RR: risk ratio. CI: confidence interval.

Comparison of direct and indirect evidence (in closed loops) for outcome overall mortality. RR: risk ratio. CI: confidence interval.

Net heat plot for outcome overall mortality (random effects model).

Network graph for outcome thromboembolic events (created with yEd). Red lines: Subnet 1. Green lines: Subnet 2. Orange line: Subnet 3.

Forest plot for outcome thromboembolic events. (a) Subnet 1. Reference treatment: No treatment (b) Subnet 2. Reference treatment: No ESA + iron, unclear application. Treatments are ordered by P‐Score (descending). RR: risk ratio. CI: confidence interval.

Network graph for outcome thrombocytopenia or haemorrhage (created with yEd). Red lines: Subnet 1. Green lines: Subnet 2.

Forest plot for outcome thrombocytopenia or haemorrhage. (a) Subnet 1. Reference treatment: No treatment (b) Subnet 2. Reference treatment: No ESA + iron, unclear application. Treatments are ordered by P‐Score (descending). RR: risk ratio. CI: confidence interval.
Network graph for outcome rash (created with yEd). Red lines: Subnet 1. Green line: Subnet 2. Orange line: Subnet 3.

Forest plot for outcome rash. (a) Subnet 1. Reference treatment: No treatment. Treatments are ordered by P‐Score (descending). RR: risk ratio. CI: confidence interval.

Network graph for outcome hypertension (created with yEd). Red lines: Subnet 1. Green line: Subnet 2. Orange line: Subnet 3.

Forest plot for outcome hypertension. (a) Subnet 1. Reference treatment: No treatment. Treatments are ordered by P‐Score (descending). RR: risk ratio. CI: confidence interval.
| ESA with or without iron for cancer patients with anaemia | |||||
| Patient or population: patients at any age with solid cancer or haematological malignancy Settings: inpatient and outpatient care Intervention: ESA + IV iron, ESA + oral iron, ESA without iron Comparison: No treatment | |||||
| Outcomes | Anticipated absolute effects (95% CI)1 | Relative effects (95% CI)2 | Certainty of the evidence (GRADE) | Interpretation of findings | |
|---|---|---|---|---|---|
| Comparator | Intervention | ||||
| On‐study mortality3 (Subnet based on 55 studies including 15,074 participants) | No treatment 92 per 1000 | ESA plus IV iron 12 per 1000 (1 to 211) | RR 0.13 (0.01 to 2.29) | ⊕⊕⊝⊝ | Treatment with ESA and IV iron may decrease or increase on‐study mortality compared to no treatment. |
| ESA plus oral iron 34 per 1000 (1 to 1000 ) | RR 0.37 (0.01 to 27.38) | ⊕⊕⊝⊝ | Treatment with ESA and oral iron may decrease or increase on‐study mortality compared to no treatment. | ||
| ESA without iron 103 per 1000 (85 to 124) | RR 1.12 (0.92 to 1.35) | ⊕⊕⊕⊝ | Treatment with ESA probably slightly increases on‐study mortality compared to no treatment. | ||
| Haemoglobin response (Subnet based on 31 studies including 6985 participants) | No treatment 90 per 1000 | ESA plus IV iron 604 per 1000 (444 to 823) | RR 6.71 (4.93 to 9.14) | ⊕⊕⊕⊝ moderateb | Treatment with ESA and IV iron probably increases haemoglobin response compared to no treatment. |
| ESA plus oral iron 527 per 1000 (365 to 758) | RR 5.85 (4.06 to 8.42) | ⊕⊕⊕⊝ moderateb | Treatment with ESA and oral iron probably increases haemoglobin response compared to no treatment. | ||
| ESA without iron 467 per 1000 (362 to 604) | RR 5.19 (4.02 to 6.71) | ⊕⊕⊕⊝ moderateb | Treatment with ESA probably increases haemoglobin response compared to no treatment. | ||
| Red blood cell transfusions (Subnet based on 69 studies including 18,684 participants) | No treatment 360 per 1000 | ESA plus IV iron 158 per 1000 (112 to 227) | RR 0.44 (0.31 to 0.63) | ⊕⊕⊕⊝ moderateb | Treatment with ESA and IV iron probably decreases the need for red blood cell transfusions compared to no treatment. |
| ESA plus oral iron 144 per 1000 (86 to 238) | RR 0.40 (0.24 to 0.66) | ⊕⊕⊕⊝ moderateb | Treatment with ESA and oral iron probably decreases the need for red blood cell transfusions compared to no treatment. | ||
| ESA without iron 212 per 1000 (184 to 248) | RR 0.59 (0.51 to 0.69) | ⊕⊕⊕⊝ moderateb | Treatment with ESA probably decreases the need for red blood cell transfusions compared to no treatment. | ||
| Overall mortality4 (Subnet based on 71 studies including 21,576 participants) | No treatment 347 per 1000 | ESA plus IV iron 507 per 1000 (302 to 843) | RR 1.46 (0.87 to 2.43) | ⊕⊕⊝⊝ lowa,c | Treatment with ESA and IV iron may decrease or increase overall mortality compared to no treatment. |
| ESA plus oral iron 482 per 1000 (208 to 1000 ) | RR 1.39 (0.60 to 3.22) | ⊕⊕⊝⊝ lowa,c | Treatment with ESA and oral iron may decrease or increase overall mortality compared to no treatment. | ||
| ESA without iron 357 per 1000 (337 to 382) | RR 1.03 (0.97 to 1.10) | ⊕⊕⊝⊝ lowa,c | Treatment with ESA may lead to no or little difference in overall mortality compared to no treatment. | ||
| Thromboembolic events5 (Subnet based on 50 studies including 15,408 participants) | No treatment 36 per 1000 | ESA plus IV iron 66 per 1000 (35 to 123) | RR 1.82 (0.98 to 3.41) | ⊕⊕⊕⊝ | Treatment with ESA and IV iron probably increases the number of thromboembolic events slightly compared to no treatment. |
| ESA plus oral iron n.r. | ‐ | ‐ | ‐ | ||
| ESA without iron 66 per 1000 (48 to 89) | RR 1.82 (1.34 to 2.47) | ⊕⊕⊕⊕ high | Treatment with ESA slightly increases the number of thromboembolic events compared to no treatment. | ||
| Thrombocytopenia or haemorrhage5 (Subnet based on 13 studies including 2744 participants) | No treatment 76 per 1000 | ESA plus IV iron n.r. | ‐ | ‐ | ‐ |
| ESA plus oral iron n.r. | ‐ | ‐ | ‐ | ||
| ESA without iron 76 per 1000 (51 to 112) | RR 1.00 (0.67 to 1.48) | ⊕⊕⊕⊝ moderatea | Treatment with ESA probably leads to little or no difference in thrombocytopenia or haemorrhage compared to no treatment. | ||
| Hypertension5 (Subnet based on 24 studies including 8383 participants) | No treatment 10 per 1000 | ESA plus IV iron n.r. | ‐ | ‐ | ‐ |
| ESA plus oral iron n.r. | ‐ | ‐ | ‐ | ||
| ESA without iron 29 per 1000 (12 to 73) | RR 2.93 (1.19 to 7.25) | ⊕⊕⊕⊝ moderatea | Treatment with ESA probably increases the number of hypertensions compared to no treatment. | ||
| 1 Baseline risks obtained from the respective study population. Absolute risks in the intervention group result from product of control risk and risk ratio 2 Results from network meta‐analysis (random effects model). Network estimates are reported as risk ratios or mean difference with corresponding 95% confidence intervals. 3On‐study mortality is defined as deaths occurring up to 30 days after the active study period. 4Overall mortality is defined as deaths occurring up to the longest follow‐up available (median follow‐up: 12 weeks). 5Events occurring during the whole study period. aDowngraded one level for imprecision since 95% CI is wide and/or crosses unity bDowngraded one level for inconsistency (heterogeneity) cDowngraded one level for high risk of bias since exclusion of studies with overall high risk of bias changed results dDowngraded two levels for imprecision since 95% CI is very wide and crosses unity CI: confidence interval ;ESA: erythropoiesis‐stimulating agent; IV: intravenous; n.r.: not reported RR: risk ratio | |||||
| GRADE Working Group grades of evidence (or certainty in the evidence) High certainty: we are very confident that the true effect lies close to that of the estimate of the effect. | |||||
| IV or oral iron for cancer patients with anaemia | |||||
| Patient or population: patients at any age with solid cancer or haematological malignancy Settings: inpatient and outpatient care Intervention: No ESA + IV iron, No ESA + oral iron Comparison: No treatment | |||||
| Outcomes | Anticipated absolute effects (95% CI)1 | Relative effects (95% CI)2 | Certainty of the evidence (GRADE) | Interpretation of findings | |
|---|---|---|---|---|---|
| Comparator | Intervention | ||||
| On‐study mortality3 (Subnet based on 55 studies including 15,074 participants) | No treatment 92 per 1000 | No ESA plus IV iron 271 per 1000 (65 to 1000 ) | RR 2.95 (0.71 to 12.34) | ⊕⊕⊝⊝ | Treatment with IV iron alone may increase on‐study mortality compared to no treatment. |
| No ESA plus oral iron 24 per 1000 (0 to 1000 ) | RR 0.26 (0.00 to 19.73) | ⊕⊕⊝⊝ | Treatment with oral iron alone may decrease or increase on‐study mortality compared to no treatment. | ||
| Haemoglobin response (Subnet based on 31 studies including 6985 participants) | No treatment 90 per 1000 | No ESA plus IV iron n.r. | ‐ | ‐ | ‐ |
| No ESA plus oral iron 153 per 1000 (62 to 378) | RR 1.70 (0.69 to 4.20) | ⊕⊕⊝⊝ | Treatment with oral iron alone may increase haemoglobin response compared to no treatment. | ||
| Red blood cell transfusions (Subnet based on 69 studies including 18,684 participants) | No treatment 362 per 1000 | No ESA plus IV iron 268 per 1000 (156 to 463) | RR 0.74 (0.43 to 1.28) | ⊕⊕⊝⊝ | Treatment with IV iron alone may decrease or increase the need for red blood cell transfusions compared to no treatment. |
| No ESA plus oral iron 333 per 1000 (195 to 568) | RR 0.92 (0.54 to 1.57) | ⊕⊕⊝⊝ | Treatment with oral iron alone may decrease or increase the need for red blood cell transfusions compared to no treatment. | ||
| Overall mortality4 (Subnet based on 71 studies including 21,576 participants) | No treatment 347 per 1000 | No ESA plus IV iron 521 per 1000 (219 to 1000 ) | RR 1.50 (0.63 to 3.56) | ⊕⊕⊝⊝ | Treatment with IV iron alone may decrease or increase overall mortality compared to no treatment. |
| No ESA plus oral iron 534 per 1000 (229 to 1000 ) | RR 1.54 (0.66 to 3.56) | ⊕⊕⊝⊝ | Treatment with oral iron alone may decrease or increase overall mortality compared to no treatment. | ||
| Thromboembolic events5 (Subnet based on 50 studies including 15,408 participants) | No treatment n.r. | No ESA plus IV iron n.r. | ‐ | ‐ | ‐ |
| No ESA plus oral iron n.r. | ‐ | ‐ | ‐ | ||
| Thrombocytopenia or haemorrhage5 (Subnet based on 13 studies including 2744 participants) | No treatment n.r. | No ESA plus IV iron n.r. | ‐ | ‐ | ‐ |
| No ESA plus oral iron n.r. | ‐ | ‐ | ‐ | ||
| Hypertension5 (Subnet based on 24 studies including 8383 participants) | No treatment n.r. | No ESA plus IV iron n.r. | ‐ | ‐ | ‐ |
| No ESA plus oral iron n.r. | ‐ | ‐ | ‐ | ||
| 1 Baseline risks obtained from the respective study population. Absolute risks in the intervention group result from product of control risk and risk ratio 2 Results from network meta‐analysis (random effects model). Network estimates are reported as risk ratios or mean difference with corresponding 95% confidence intervals. 3On‐study mortality is defined as deaths occurring up to 30 days after the active study period. 4Overall mortality is defined as deaths occurring up to the longest follow‐up available (median follow‐up: 12 weeks). 5Events occurring during the whole study period. a Downgraded one level for imprecision since 95% CI is wide and/or crosses unity b Downgraded one level for inconsistency (heterogeneity) c Downgraded one level for high risk of bias since exclusion of studies with overall high risk of bias changed results dDowngraded two levels for imprecision since 95% CI is very wide and crosses unity ESA: erythropoiesis‐stimulating agent; IV: intravenous; RR: risk ratio; CI: confidence interval; n.r.: not reported | |||||
| GRADE Working Group grades of evidence (or certainty in the evidence) High certainty: we are very confident that the true effect lies close to that of the estimate of the effect. CI: confidence interval ;ESA: erythropoiesis‐stimulating agent; IV: intravenous; n.r.: not reported RR: risk ratio | |||||
| Subnet 1 | |||||||
|---|---|---|---|---|---|---|---|
| Heterogeneity / inconsistency: Q = 36.41, df = 48, P = 0.89; I² = 0%, Tau² = 0 | |||||||
| ESA + IV iron | . | 0.34 [0.01, 8.15] | . | . | . | 0.11 [0.01, 2.04] | . |
| 0.49 [0.02, 12.19] | No ESA + oral iron | 0.70 [0.41, 1.18] | . | . | 0.50 [0.05, 5.34] | . | . |
| 0.34 [0.01, 8.15] | 0.70 [0.41, 1.18] | ESA + oral iron | . | . | . | . | . |
| 0.13 [0.01, 2.34] | 0.27 [0.00, 20.17] | 0.38 [0.01, 27.99] | Placebo | . | . | 0.87 [0.79, 0.97] | . |
| 0.13 [0.01, 2.29] | 0.26 [0.00, 19.73] | 0.37 [0.01, 27.38] | 0.98 [0.78, 1.21] | No treatment | . | 0.90 [0.74, 1.09] | 0.34 [0.08, 1.41] |
| 0.17 [0.00, 8.94] | 0.35 [0.03, 3.95] | 0.50 [0.05, 5.34] | 1.30 [0.01, 174.72] | 1.34 [0.01, 179.66] | Placebo + oral iron | . | . |
| 0.11 [0.01, 2.04] | 0.23 [0.00, 17.61] | 0.34 [0.00, 24.44] | 0.87 [0.79, 0.97] | 0.90 [0.74, 1.09] | 0.67 [0.01, 90.01] | ESA + no iron | . |
| 0.04 [0.00, 1.09] | 0.09 [0.00, 8.41] | 0.13 [0.00, 11.68] | 0.33 [0.08, 1.40] | 0.34 [0.08, 1.41] | 0.25 [0.00, 41.84] | 0.38 [0.09, 1.60] | No ESA + IV iron |
| Subnet 2 | |||||||
| Heterogeneity / inconsistency: Q = 0.24, df = 1, P = 0.62; I² = 0%, Tau² = 0 | |||||||
| Placebo + iron, unclear application | 0.78 [0.51, 1.21] | . | |||||
| 0.78 [0.51, 1.21] | ESA + iron, unclear application | 0.42 [0.12, 1.53] | |||||
| 0.33 [0.08, 1.28] | 0.42 [0.12, 1.53] | No ESA + iron, unclear application | |||||
| Upper triangle: direct estimates; lower triangle: network estimates. Only subnets with >1 designs. Comparisons should be read from left to right, and the estimate is in the cell in common between the column‐defining treatment and the row‐defining treatment. Effect estimates are presented as risk ratios (RR) with corresponding 95% confidence interval. For the network estimates in the lower triangle an RR below 1.0 favours the column‐defining treatment and for the direct estimates in the upper triangle an RR below 1.0 favours the row‐defining treatment (less presence of deaths). To obtain RRs for comparisons in the opposing direction, reciprocals should be taken. Treatments are ordered by P‐Score (ascending). Subnet 1: No. of studies: 55. No. of treatments: 8. No. of pairwise comparisons: 55. No. of designs: 7 Subnet 2: No. of studies: 3. No. of treatments: 3. No. of pairwise comparisons: 3. No. of designs: 2 | |||||||
| Subnet 1 | ||||||
|---|---|---|---|---|---|---|
| Heterogeneity / inconsistency: Qtotal = 57.45, df = 28, P < 0.01 / Qwithin = 51.30, df = 25, P < 0.01 / Qbetween = 6.14, df = 3, P = 0.10; I² = 51.3%, Tau² = 0.0321 | ||||||
| ESA + IV iron | 1.04 [0.71, 1.52] | 1.14 [0.91, 1.43] | 1.32 [1.11, 1.57] | . | . | . |
| 1.08 [0.76, 1.53] | ESA + placebo | 1.03 [0.70, 1.51] | . | . | . | . |
| 1.15 [0.92, 1.43] | 1.07 [0.75, 1.51] | ESA + oral iron | 0.97 [0.67, 1.41] | . | 3.45 [1.50, 7.90] | . |
| 1.29 [1.09, 1.54] | 1.20 [0.82, 1.76] | 1.13 [0.87, 1.46] | ESA + no iron | 3.06 [2.58, 3.63] | . | 5.19 [4.02, 6.71] |
| 3.95 [3.10, 5.04] | 3.67 [2.42, 5.58] | 3.45 [2.53, 4.70] | 3.06 [2.58, 3.63] | Placebo | . | . |
| 3.96 [1.68, 9.33] | 3.67 [1.49, 9.04] | 3.45 [1.50, 7.90] | 3.06 [1.28, 7.30] | 1.00 [0.41, 2.43] | No ESA + oral iron | . |
| 6.71 [4.93, 9.14] | 6.23 [3.93, 9.87] | 5.85 [4.06, 8.42] | 5.19 [4.02, 6.71] | 1.70 [1.25, 2.31] | 1.70 [0.69, 4.20] | No treatment |
| Upper triangle: direct estimates; lower triangle: network estimates. Only subnets with >1 designs. Comparisons should be read from left to right, and the estimate is in the cell in common between the column‐defining treatment and the row‐defining treatment. Effect estimates are presented as risk ratios (RR) with corresponding 95% confidence interval. For the network estimates in the lower triangle an RR above 1.0 favours the column‐defining treatment and for the direct estimates in the upper triangle an RR above 1.0 favours the row‐defining treatment (more presence of haemoglobin responses). To obtain RRs for comparisons in the opposing direction, reciprocals should be taken. Treatments are ordered by P‐Score (ascending). Subnet 1: No. of studies: 31. No. of treatments: 7. No. of pairwise comparisons: 37. No. of designs: 7 | ||||||
| Comparison | No. of studies | Network estimate | Direct estimate | Indirect estimate | Test |
|---|---|---|---|---|---|
| ESA + IV iron vs. | 6 | 1.29 [1.09, 1.54] | 1.32 [1.11, 1.57] | 0.53 [0.17, 1.67] | 0.1234 |
| ESA + IV iron vs. | 4 | 1.15 [0.92, 1.43] | 1.14 [0.91, 1.43] | 1.25 [0.47, 3.32] | 0.8565 |
| ESA + IV iron vs. | 1 | 1.08 [0.76, 1.53] | 1.04 [0.71, 1.52] | 1.29 [0.54, 3.06] | 0.6559 |
| ESA + no iron vs. | 2 | 0.89 [0.69, 1.15] | 1.03 [0.71, 1.50] | 0.77 [0.54, 1.11] | 0.2792 |
| ESA + oral iron vs. | 1 | 0.94 [0.66, 1.33] | 0.97 [0.66, 1.43] | 0.79 [0.34, 1.84] | 0.6559 |
| Estimates are reported as risk ratios with corresponding 95% confidence interval. Result of test for disagreement between direct and indirect evidence reported as p‐value. Only comparisons for which both direct and indirect evidence exists are shown. | |||||
| Subnet 1 | |||||||
|---|---|---|---|---|---|---|---|
| Heterogeneity/Inconsistency: Qtotal = 162.04, df = 65, P < 0.01 / Qwithin = 159.35, df = 61, P < 0.01 / Qbetween = 2.68, df = 4, P = 0.61; I² = 59.9%, Tau² = 0.0447 | |||||||
| ESA + oral iron | 0.81 [0.48, 1.38] | 0.95 [0.48, 1.91] | 0.41 [0.19, 0.91] | . | . | 0.45 [0.34, 0.60] | . |
| 0.90 [0.56, 1.43] | ESA + IV iron | 0.90 [0.45, 1.82] | 0.74 [0.53, 1.03] | . | . | . | . |
| 0.88 [0.46, 1.68] | 0.98 [0.51, 1.88] | ESA + placebo | . | . | . | . | . |
| 0.67 [0.41, 1.09] | 0.75 [0.54, 1.03] | 0.76 [0.38, 1.52] | ESA + no iron | . | 0.65 [0.59, 0.72] | . | 0.59 [0.51, 0.69] |
| 0.54 [0.32, 0.90] | 0.60 [0.34, 1.06] | 0.61 [0.28, 1.32] | 0.80 [0.47, 1.37] | No ESA + IV iron | 1.07 [0.48, 2.38] | 0.68 [0.39, 1.18] | 0.89 [0.23, 3.35] |
| 0.44 [0.27, 0.72] | 0.49 [0.35, 0.68] | 0.50 [0.25, 1.00] | 0.65 [0.59, 0.73] | 0.82 [0.48, 1.39] | Placebo | . | . |
| 0.43 [0.33, 0.57] | 0.48 [0.29, 0.80] | 0.49 [0.25, 0.97] | 0.64 [0.38, 1.07] | 0.80 [0.50, 1.29] | 0.98 [0.58, 1.65] | No ESA + oral iron | . |
| 0.40 [0.24, 0.66] | 0.44 [0.31, 0.63] | 0.45 [0.22, 0.91] | 0.59 [0.51, 0.69] | 0.74 [0.43, 1.28] | 0.90 [0.75, 1.09] | 0.92 [0.54, 1.57] | No treatment |
| Subnet 2 | |||||||
| Heterogeneity/Inconsistency: Q=5.00, df=4, p=0.29; I²=19.9%, Tau²=0.0168 | |||||||
| ESA + iron, unclear application | 0.74 [0.54, 1.00] | 0.46 [0.33, 0.64] | |||||
| 0.74 [0.54, 1.00] | Placebo + iron, unclear application | . | |||||
| 0.46 [0.33, 0.64] | 0.63 [0.40, 0.98] | No ESA + iron, unclear application | |||||
| Upper triangle: direct estimates; lower triangle: network estimates. Only subnets with >1 designs. Comparisons should be read from left to right, and the estimate is in the cell in common between the column‐defining treatment and the row‐defining treatment. Effect estimates are presented as risk ratios (RR) with corresponding 95% confidence interval. For the network estimates in the lower triangle an RR below 1.0 favours the column‐defining treatment and for the direct estimates in the upper triangle an RR below 1.0 favours the row‐defining treatment (less presence of red blood cell transfusions). To obtain RRs for comparisons in the opposing direction, reciprocals should be taken. Treatments are ordered by P‐Score (ascending). Subnet 1: No. of studies: 69. No. of treatments: 8. No. of pairwise comparisons: 75. No. of designs: 9 Subnet 2: No. of studies: 6. No. of treatments: 3. No. of pairwise comparisons: 6. No. of designs: 2 | |||||||
| Comparison | No. of studies | Network estimate | Direct estimate | Indirect estimate | Test for disagreement |
|---|---|---|---|---|---|
| ESA + IV iron vs. ESA + no iron | 6 | 0.75 [0.54, 1.03] | 0.74 [0.53, 1.03] | 0.83 [0.27, 2.61] | 0.8487 |
| ESA + IV iron vs. ESA + oral iron | 3 | 1.12 [0.70, 1.78] | 1.23 [0.72, 2.09] | 0.80 [0.30, 2.13] | 0.4522 |
| ESA + IV iron vs. ESA + placebo | 1 | 0.98 [0.51, 1.88] | 0.90 [0.45, 1.82] | 1.58 [0.30, 8.46] | 0.5448 |
| ESA + no iron vs. ESA + oral iron | 2 | 1.49 [0.92, 2.41] | 2.43 [1.10, 5.37] | 1.12 [0.61, 2.05] | 0.1270 |
| ESA + no iron vs. No treatment | 19 | 0.59 [0.51, 0.69] | 0.59 [0.51, 0.69] | 0.74 [0.17, 3.14] | 0.7669 |
| ESA + no iron vs. Placebo | 33 | 0.65 [0.59, 0.73] | 0.65 [0.59, 0.72 | 1.07 [0.37, 3.11] | 0.3697 |
| ESA + oral iron vs. ESA + placebo | 1 | 0.88 [0.46, 1.68] | 0.95 [0.48, 1.91] | 0.54 [0.10, 2.99] | 0.5448 |
| ESA + oral iron vs. No ESA + oral iron | 6 | 0.43 [0.33, 0.57] | 0.45 [0.34, 0.60] | 0.24 [0.08, 0.69] | 0.2592 |
| No ESA + IV iron vs. No ESA + oral iron | 2 | 0.80 [0.50, 1.29] | 0.68 [0.39, 1.18] | 1.27 [0.50, 3.24] | 0.2592 |
| No ESA + IV iron vs. No treatment | 1 | 0.74 [0.43, 1.28] | 0.89 [0.23, 3.35] | 0.71 [0.39, 1.30] | 0.7669 |
| No ESA + IV iron vs. Placebo | 1 | 0.82 [0.48, 1.39] | 1.07 [0.48, 2.38] | 0.65 [0.32, 1.34] | 0.3697 |
| Estimates are reported as risk ratios with corresponding 95% confidence interval. Result of test for disagreement between direct and indirect evidence reported as p‐value. Only comparisons for which both direct and indirect evidence exists are shown. | |||||
| Subnet 1 | ||
|---|---|---|
| Heterogeneity / inconsistency: Q = 39.86, df = 17, P < 0.01; I² = 57.4%, Tau² = 0.2548 | ||
| ESA + no iron | ‐0.67 [‐1.31, ‐0.03] | ‐0.90 [‐1.29, ‐0.51] |
| ‐0.67 [‐1.31, ‐0.03] | No treatment | . |
| ‐0.90 [‐1.29, ‐0.51] | ‐0.23 [‐0.97, 0.52] | Placebo |
| Subnet 2 | ||
| Heterogeneity / inconsistency: Not applicable (subnet consists of only two pairwise comparisons) | ||
| ESA + oral iron | . | ‐0.80 [‐1.15, ‐0.45] |
| ‐0.30 [‐0.90, 0.30] | No ESA + IV iron | ‐0.50 [‐0.99, ‐0.01] |
| ‐0.80 [‐1.15, ‐0.45] | ‐0.50 [‐0.99, ‐0.01] | No ESA + oral iron |
| Upper triangle: direct estimates; lower triangle: network estimates. Only subnets with >1 designs. Comparisons should be read from left to right, and the estimate is in the cell in common between the column‐defining treatment and the row‐defining treatment. Effect estimates are presented as standardised mean differences (SMD) with corresponding 95% confidence interval. For the network estimates in the lower triangle an SMD below 0.0 favours the column‐defining treatment and for the direct estimates in the upper triangle an SMD below 0.0 favours the row‐defining treatment (smaller number of red blood cell transfusions). To obtain RRs for comparisons in the opposing direction, reciprocals should be taken. Treatments are ordered by P‐Score (ascending). Subnet 1: No. of studies: 19. No. of treatments: 3. No. of pairwise comparisons: 19. No. of designs: 2 Subnet 2: No. of studies: 2. No. of treatments: 3. No. of pairwise comparisons: 2. No. of designs: 2 | ||
| Subnet 1 | ||||||||
|---|---|---|---|---|---|---|---|---|
| Heterogeneity / inconsistency: Qtotal = 61.55, df = 65, P = 0.60 / Qwithin = 59.02, df = 61, P = 0.55 / Qbetween = 2.53, df = 4, P = 0.64; I² = 0%, Tau² = 0 | ||||||||
| ESA + placebo | . | . | . | 0.50 [0.13, 1.97] | . | 0.38 [0.10, 1.40] | . | . |
| 0.61 [0.16, 2.34] | No treatment | 0.97 [0.91, 1.03] | . | . | 0.34 [0.08, 1.41] | . | . | . |
| 0.59 [0.15, 2.27] | 0.97 [0.91, 1.03] | ESA + no iron | 0.99 [0.96, 1.02] | 1.94 [0.18, 20.81] | . | 0.76 [0.45, 1.29] | . | . |
| 0.58 [0.15, 2.24] | 0.96 [0.90, 1.03] | 0.99 [0.96, 1.02] | Placebo | . | . | . | . | . |
| 0.44 [0.12, 1.62] | 0.72 [0.31, 1.66] | 0.74 [0.32, 1.71] | 0.75 [0.32, 1.73] | ESA + oral iron | . | 0.74 [0.30, 1.83] | 0.91 [0.84, 0.98] | 0.50 [0.05, 5.34] |
| 0.40 [0.11, 1.55] | 0.67 [0.28, 1.58] | 0.69 [0.29, 1.63] | 0.69 [0.29, 1.64] | 0.93 [0.66, 1.31] | No ESA + IV iron | . | 0.94 [0.67, 1.33] | . |
| 0.42 [0.12, 1.50] | 0.69 [0.41, 1.15] | 0.71 [0.43, 1.18] | 0.72 [0.43, 1.19] | 0.96 [0.44, 2.09] | 1.03 [0.46, 2.34] | ESA + IV iron | . | . |
| 0.40 [0.11, 1.47] | 0.65 [0.28, 1.51] | 0.67 [0.29, 1.56] | 0.68 [0.29, 1.57] | 0.91 [0.84, 0.98] | 0.98 [0.70, 1.37] | 0.95 [0.43, 2.07] | No ESA + oral iron | . |
| 0.22 [0.01, 3.27] | 0.36 [0.03, 4.43] | 0.37 [0.03, 4.57] | 0.37 [0.03, 4.62] | 0.50 [0.05, 5.34] | 0.54 [0.05, 5.91] | 0.52 [0.04, 6.33] | 0.55 [0.05, 5.90] | Placebo + oral iron |
| Subnet 2 | ||||||||
| Heterogeneity / inconsistency: Q = 1.27, df = 3, P = 0.74; I² = 0%, Tau² = 0 | ||||||||
| ESA + iron, unclear application | 1.00 [0.87, 1.15] | 1.25 [0.94, 1.66] | ||||||
| 1.00 [0.87, 1.15] | Placebo + iron, unclear application | . | ||||||
| 1.25 [0.94, 1.66] | 1.24 [0.90, 1.71] | No ESA + iron, unclear application | ||||||
| Upper triangle: direct estimates; lower triangle: network estimates. Only subnets with >1 designs. Comparisons should be read from left to right, and the estimate is in the cell in common between the column‐defining treatment and the row‐defining treatment. Effect estimates are presented as risk ratios (RR) with corresponding 95% confidence interval. For the network estimates in the lower triangle an RR below 1.0 favours the column‐defining treatment and for the direct estimates in the upper triangle an RR below 1.0 favours the row‐defining treatment (less presence of deaths). To obtain RRs for comparisons in the opposing direction, reciprocals should be taken. Treatments are ordered by P‐Score (ascending). Subnet 1: No. of studies: 71. No. of treatments: 9. No. of pairwise comparisons: 75. No. of designs: 10 Subnet 2: No. of studies: 5. No. of treatments: 3. No. of pairwise comparisons: 5. No. of designs: 2 | ||||||||
| Comparison | No. of studies | Network estimate | Direct estimate | Indirect estimate | Test for disagreement |
|---|---|---|---|---|---|
| ESA + IV iron vs. ESA + no iron | 4 | 1.41 [0.85, 2.34] | 1.32 [0.78, 2.24] | 3.02 [0.51, 17.69] | 0.3785 |
| ESA + IV iron vs. ESA + oral iron | 3 | 1.05 [0.48, 2.28] | 1.35 [0.55, 3.32] | 0.48 [0.10, 2.31] | 0.2655 |
| ESA + IV iron vs. ESA + placebo | 1 | 2.40 [0.67, 8.59] | 2.65 [0.72, 9.81] | 0.34 [0.00, 107.93] | 0.4942 |
| ESA + no iron vs. ESA + oral iron | 1 | 0.74 [0.32, 1.71] | 1.94 [0.18, 20.81] | 0.65 [0.26, 1.58] | 0.3969 |
| ESA + no iron vs. No treatment | 21 | 1.03 [0.97, 1.10] | 1.03 [0.97, 1.10] | 2.98 [0.50, 17.88] | 0.2452 |
| ESA + oral iron vs. ESA + placebo | 1 | 2.29 [0.62, 8.51] | 2.00 [0.51, 7.86] | 10.64 [0.11, 1050.39] | 0.4942 |
| ESA + oral iron vs. No ESA + oral iron | 8 | 0.91 [0.84, 0.98] | 0.91 [0.84, 0.98] | 0.31 [0.05, 1.88] | 0.2452 |
| No ESA + IV iron vs. No ESA + oral iron | 1 | 0.98 [0.70, 1.37] | 0.94 [0.67, 1.33] | 2.72 [0.47, 15.81] | 0.2452 |
| No ESA + IV iron vs. No treatment | 1 | 1.50 [0.71, 3.56] | 2.95 [0.71, 12.34] | 1.02 [0.35, 3.01] | 0.2452 |
| Estimates are reported as risk ratios with corresponding 95% confidence interval. Result of test for disagreement between direct and indirect evidence reported as p‐value. Only comparisons for which both direct and indirect evidence exists are shown. | |||||
| Subnet 1 | |||
|---|---|---|---|
| Heterogeneity / inconsistency: Q = 31.54, df = 47, P = 0.96; I² = 0%, Tau² = 0 | |||
| No treatment | . | . | 0.55 [0.41, 0.74] |
| 0.74 [0.53, 1.04] | Placebo | . | 0.74 [0.63, 0.86] |
| 0.55 [0.29, 1.02] | 0.74 [0.42, 1.30] | ESA + IV iron | 1.00 [0.58, 1.73] |
| 0.55 [0.41, 0.74] | 0.74 [0.63, 0.86] | 1.00 [0.58, 1.73] | ESA + no iron |
| Subnet 2 | |||
| Heterogeneity / inconsistency: Not applicable (subnet consists of only 2 studies) | |||
| No ESA + iron, unclear application | . | 0.68 [0.36, 1.28] | |
| 1.01 [0.31, 3.31] | Placebo + iron, unclear application | 0.68 [0.25, 1.86] | |
| 0.68 [0.36, 1.28] | 0.68 [0.25, 1.86] | ESA + iron, unclear application | |
| Upper triangle: direct estimates; lower triangle: network estimates. Only subnets with >1 designs. Comparisons should be read from left to right, and the estimate is in the cell in common between the column‐defining treatment and the row‐defining treatment. Effect estimates are presented as risk ratios (RR) with corresponding 95% confidence interval. For the network estimates in the lower triangle an RR below 1.0 favours the column‐defining treatment and for the direct estimates in the upper triangle an RR below 1.0 favours the row‐defining treatment (less presence of thromboembolic events). To obtain RRs for comparisons in the opposing direction, reciprocals should be taken. Treatments are ordered by P‐Score (ascending). Subnet 1: No. of studies: 50. No. of treatments: 4. No. of pairwise comparisons: 50. No. of designs: 3 Subnet 2: No. of studies: 2. No. of treatments: 3. No. of pairwise comparisons: 2. No. of designs: 2 | |||
| Subnet 1 | ||
|---|---|---|
| Heterogeneity / inconsistency: Q = 7.84, df = 11, P = 0.73, I² = 0%, Tau² = 0 | ||
| Placebo | . | 0.84 [0.72, 0.99] |
| 0.84 [0.55, 1.29] | No treatment | 1.00 [0.67, 1.49] |
| 0.84 [0.72, 0.99] | 1.00 [0.67, 1.49] | ESA + no iron |
| Subnet 2 | ||
| Heterogeneity / inconsistency: Not applicable (subnetwork consists of only 2 studies) | ||
| ESA + iron, unclear application | 1.00 [0.40, 2.49] | 0.69 [0.27, 1.76] |
| 1.00 [0.40, 2.49] | No ESA + iron, unclear application | . |
| 0.69 [0.27, 1.76] | 0.69 [0.19, 2.57] | Placebo + iron, unclear application |
| Upper triangle: direct estimates; lower triangle: network estimates. Only subnets with >1 designs. Comparisons should be read from left to right, and the estimate is in the cell in common between the column‐defining treatment and the row‐defining treatment. Effect estimates are presented as risk ratios (RR) with corresponding 95% confidence interval. For the network estimates in the lower triangle an RR below 1.0 favours the column‐defining treatment and for the direct estimates in the upper triangle an RR below 1.0 favours the row‐defining treatment (less presence of thrombocytopenia or haemorrhage). To obtain RRs for comparisons in the opposing direction, reciprocals should be taken. Treatments are ordered by P‐Score (ascending). Subnet 1: No. of studies: 13. No. of treatments: 3. No. of pairwise comparisons: 13. No. of designs: 2 Subnet 2: No. of studies: 2. No. of treatments: 3. No. of pairwise comparisons: 2. No. of designs: 2 | ||
| Subnet 1 | ||
|---|---|---|
| Heterogeneity / inconsistency: Q = 9.88, df = 12, P = 0.63; I² = 0%, Tau² = 0 | ||
| No treatment | . | 0.66 [0.28, 1.56] |
| 0.80 [0.30, 2.13] | Placebo | 0.83 [0.52, 1.32] |
| 0.66 [0.28, 1.56] | 0.83 [0.52, 1.32] | ESA + no iron |
| Upper triangle: direct estimates; lower triangle: network estimates. Only subnets with >1 designs. Comparisons should be read from left to right, and the estimate is in the cell in common between the column‐defining treatment and the row‐defining treatment. Effect estimates are presented as risk ratios (RR) with corresponding 95% confidence interval. For the network estimates in the lower triangle an RR below 1.0 favours the column‐defining treatment and for the direct estimates in the upper triangle an RR below 1.0 favours the row‐defining treatment (less presence of rash. To obtain RRs for comparisons in the opposing direction, reciprocals should be taken. Treatments are ordered by P‐Score (ascending). Subnet 1: No. of studies: 14. No. of treatments: 3. No. of pairwise comparisons: 14. No. of designs: 2 | ||
| Subnet 1 | ||
|---|---|---|
| Heterogeneity / inconsistency: Q = 17.54, df = 22, P = 0.73; I² = 0%, Tau² = 0 | ||
| No treatment | . | 0.34 [0.14, 0.84] |
| 0.35 [0.14, 0.89] | Placebo | 0.96 [0.81, 1.15] |
| 0.34 [0.14, 0.84] | 0.96 [0.81, 1.15] | ESA + no iron |
| Upper triangle: direct estimates; lower triangle: network estimates. Only subnets with >1 designs. Comparisons should be read from left to right, and the estimate is in the cell in common between the column‐defining treatment and the row‐defining treatment. Effect estimates are presented as risk ratios (RR) with corresponding 95% confidence interval. For the network estimates in the lower triangle an RR below 1.0 favours the column‐defining treatment and for the direct estimates in the upper triangle an RR below 1.0 favours the row‐defining treatment (less presence of hypertension). To obtain RRs for comparisons in the opposing direction, reciprocals should be taken. Treatments are ordered by P‐Score (ascending). Subnet 1: No. of studies: 24. No. of treatments: 3. No. of pairwise comparisons: 24 No. of designs: 2 | ||