Trihexifenidilo para la distonía en la parálisis cerebral
Referencias
Referencias de los estudios incluidos en esta revisión
Referencias de los estudios excluidos de esta revisión
Referencias adicionales
Referencias de otras versiones publicadas de esta revisión
Characteristics of studies
Characteristics of included studies [ordered by study ID]
Ir a:
| Methods | Study type: randomised, double‐blind, placebo‐controlled cross‐over trial Study start and end dates: not stated Study duration: 28 weeks | |
| Participants | Country: Australia Study site: the rehabilitation department of the Children's Hospital at Westmead, Australia Sample size: 16 Withdrawals/dropouts: 2 Age: mean 9 years (SD 4.3 years, range 2‐17 years, median 7.9 years) Sex: 10 boys, 6 girls Diagnosis: predominant dystonic cerebral palsy, with or without associated spasticity Diagnostic tool: physician clinical assessment ‐ no specific tool used Inclusion criteria: children aged 2‐18 years with predominant dystonic cerebral palsy; not treated with trihexyphenidyl or another anticholinergic medication in the previous 3 months; and use of other treatments, such as oral baclofen or intrathecal baclofen, at a stable dose for 3 months and unlikely to be altered Exclusion criteria: planned change in therapy programme over the duration of the study; surgical or medical interventions, such as orthopaedic surgery or botulinum toxin injections, scheduled during the study or in the 6 months prior to study entry | |
| Interventions | Intervention: trihexyphenidyl for 12 weeks. Started at 0.2 mg/kg/d in 3 divided doses and increased over 6 weeks up to a maximum of 2.5 mg/kg/d in 3 divided doses. Delivered orally in liquid format 10 mg/mL Placebo: placebo liquid delivered orally at 2.5 mg/kg/d of liquid in 3 divided doses (equals same volume as intervention) for 12 weeks Washout period: 4 weeks | |
| Outcomes | Primary outcomes
Secondary outcomes
Assessment time points: baseline, 12 weeks and 28 weeks after commencement | |
| Notes | Funding: not stated Declarations/conflicts of interest: none *The study reported on side effects, which we considered as adverse effects. We counted all side effects as adverse effects as defined in our protocol (Baker 2017). | |
| Risk of bias | ||
| Bias | Authors' judgement | Support for judgement |
| Random sequence generation (selection bias) | Low risk | Comment: used a randomisation table |
| Allocation concealment (selection bias) | Low risk | Comment: the trial site pharmacy generated the randomisation table and kept codes concealed until after data collection was complete |
| Blinding of participants and personnel (performance bias) | Low risk | Comment: assessors, patient and family all blinded to intervention and placebo. Breaking the code in the event of severe adverse effects was possible by accessing the on‐call pharmacist. However, there is no mention of whether the code needed to be broken, even for the 2 participants who withdrew |
| Blinding of outcome assessment (detection bias) | Low risk | Comment: assessors were blinded as to whether child had received intervention or placebo |
| Incomplete outcome data (attrition bias) | Low risk | Comment: 2 of 8 children who both received the active treatment in the first phase did not complete the study |
| Selective reporting (reporting bias) | Low risk | Comment: reported all pre‐specified outcomes |
| Other bias | Low risk | Comment: no other sources of bias identified |
SD: standard deviation
Characteristics of excluded studies [ordered by study ID]
Ir a:
| Study | Reason for exclusion |
| Not a randomised controlled trial |
Data and analyses
| Outcome or subgroup title | No. of studies | No. of participants | Statistical method | Effect size |
| 1 Adverse effects Show forest plot | 1 | Risk Ratio (M‐H, Fixed, 95% CI) | Totals not selected | |
| Analysis 1.1  Comparison 1 Trihexphenidyl versus placebo, Outcome 1 Adverse effects. | ||||
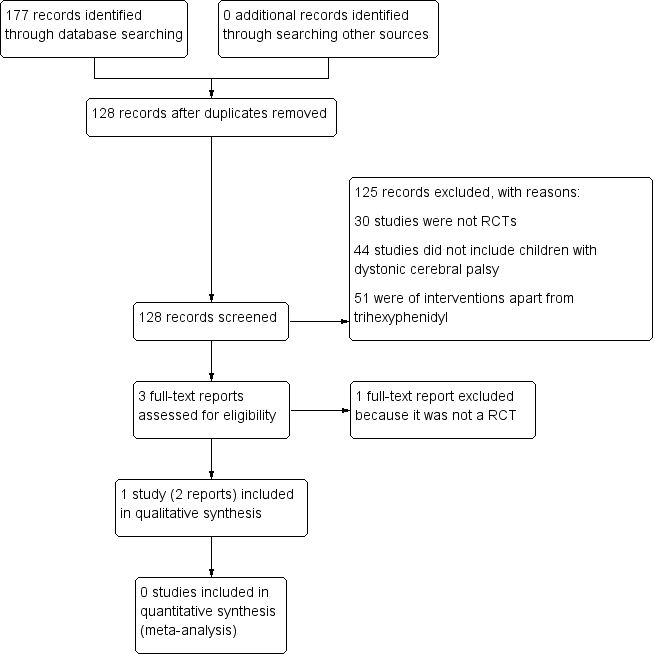
Study flow diagram.

Risk of bias summary: review authors' judgements about each risk of bias item for each included study.

ANCOVA analyses, page 1
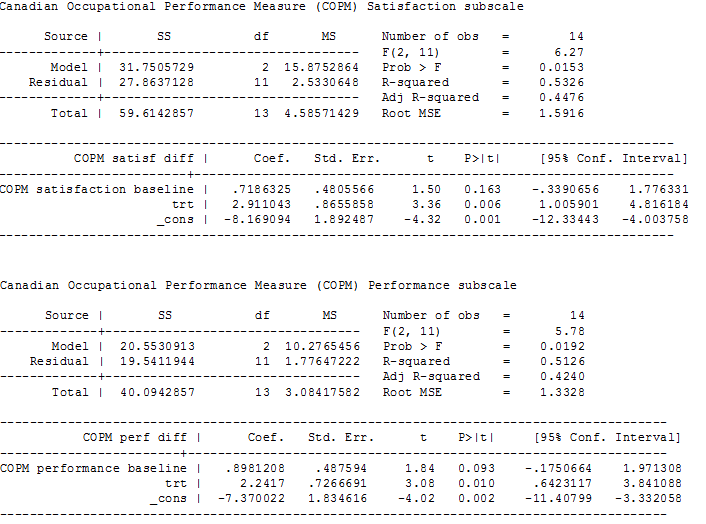
ANCOVA analyses, page 2

Comparison 1 Trihexphenidyl versus placebo, Outcome 1 Adverse effects.
| Trihexyphenidyl compared with placebo for dystonia in cerebral palsy | |||||
| Patient or population: children with dystonic cerebral palsy Settings: one tertiary care hospital Intervention: trihexyphenidyl Comparison: placebo | |||||
| Outcomes | Illustrative comparative risks* (95% CI) | Relative effect | Number of participants | Quality of the evidence | |
| Assumed risk | Corresponding risk | ||||
| Placebo | Trihexyphenidyl | ||||
| Change in dystonia from baseline Measured by: BADS (eight body regions assessed for dystonia on a five‐point scale (0 = none to 4 = severe), minimum score 0 to maximum score 32; higher score = greater severity of dystonia) Follow‐up: 12 weeks | The mean follow‐up score in the control group was 15.50 points | The mean follow‐up score in the intervention group was 2.67 points higher (2.55 lower to 7.90 higher) | — | 16 | ⊕⊕⊝⊝ Lowa |
| Adverse effectsb (mood disturbance, irritability, behavioural change, constipation) Measured by: counts of number and type Follow‐up: various (includes data assessed at both 12 and 28 weeks) | 375 per 1000 | 1000 per 1000 | RR 2.54 (1.38 to 4.67) | 16 | ⊕⊕⊝⊝ |
| Participation in activities of daily living:individual goal setting Measured by: GAS (up to 5 functional goals scored on a 5‐point scale (−2 = much less than expected to +2 = much more than expected); higher score = better than expected outcome) Follow‐up: 12 weeks | The mean follow‐up score in the control group was 27.63 points | The mean follow‐up score in the intervention group was 18.86 points higher (5.68 higher to 32.03 higher) | — | 16 | ⊕⊕⊝⊝ |
| Participation in activities of daily living:satisfaction with individual goals Measured by: satisfaction subscale of the COPM (satisfaction with performance in up to 5 problem areas scored on a 10‐point scale (1 = not satisfied at all to 10 = extremely satisfied); higher score = greater satisfaction) Follow‐up: 12 weeks | The mean follow‐up score in the control group was 2.96 points | The mean follow‐up score in the intervention group was 2.91 points higher (1.01 higher to 4.82 higher) | — | 16 | ⊕⊕⊝⊝ |
| Participation in activities of daily living:performance of individual goals Measured by: performance subscale of the COPM (up to five problem areas scored on a 10‐point scale (1 = not able to do to 10 = able to do extremely well; higher score = better performance) Follow‐up: 12 weeks | The mean follow‐up score in the control group was 3.14 points | The mean follow‐up score in the intervention group was2.24 points higher (0.64 higher to 3.84 higher) | — | 16 | ⊕⊕⊝⊝ |
| Quality of life | Not measured | ||||
| *The basis for the assumed risk is provided in the footnotes. The corresponding risk (and its 95% CI) is based on the assumed risk in the comparison group and the relative effect of the intervention (and its 95% CI) | |||||
| GRADE Working Group grades of evidence | |||||
| aDowngraded two levels due to imprecision; small sample size from one study only. | |||||
| Method | Unused methods |
| Measures of treatment effect | Continuous data For continuous outcomes we will calculate the MD and corresponding 95% CI if studies use the same rating scales. We will calculate the SMD with 95% CIs if studies use different scales to measure the same outcomes. As recommended in section 9.4.5.2 of the Cochrane Handbook for Systematic Reviews of Interventions (Deeks 2017), we will focus on final values unless some of the studies use change scores. We will combine studies that report final values with studies that report only change scores in the same meta‐analysis, provided that the studies use the same rating scale. We will conduct the analysis according to age, as children and adults respond differently to medication. We will combine the data from all groups in studies that have trihexyphenidyl in more than one group (i.e. different frequencies) and then separate these when performing the subgroup analysis to see how the different frequencies influence the results (see item four in the Subgroup analysis and investigation of heterogeneity section). |
| Multiple outcomes If studies provide multiple, interchangeable measures of the same construct at the same point in time, we will calculate the average SMD across the outcomes and the average estimated variances, as recommended in section 16.1.2 of the Cochrane Handbook for Systematic Reviews of Interventions (Higgins 2011b). | |
| Unit of analysis issues | Cluster‐RCTs If included trials use cluster randomisation, we will extract an ICC and use this to reanalyse the data. Where no ICC is given and a unit of analysis error appears to exist, we will contact the trial authors and ask them to provide either an ICC or the raw data to enable calculation of an ICC. Where no ICC is made available, we will search for similar studies from which we can impute an ICC, or seek statistical advice to obtain an estimate of the ICC. |
| Dealing with missing data | We will contact trial investigators to request missing data. If the trialists provide missing data, we will conduct a meta‐analysis according to intention‐to‐treat principles using all data and keeping participants in the treatment group to which they were originally randomised, regardless of the treatment they actually received, as recommended in section 16.1.2 of the Cochrane Handbook for Systematic Reviews of Interventions (Higgins 2011b). If missing data are not provided, we will analyse only the available data. If there is concern regarding a high level of missing data, such that data could not be included in a meta‐analysis, we will include a qualitative summary in the text of the review. We will document missing data and attrition in the 'Risk of bias' tables, and we will explore how missing data might affect the interpretation of the results by conducting a sensitivity analysis. |
| Assessment of heterogeneity | We will assess clinical heterogeneity by comparing the between‐trials distribution of participant characteristics (e.g. children versus adults) and intervention characteristics (e.g. treatment type and dose), and assess methodological heterogeneity by comparing trial characteristics (e.g. cross‐over versus parallel design). We will evaluate statistical heterogeneity using the I2 statistic and the Chi2 test of heterogeneity, with statistical significance set at P value < 0.10. As recommended in section 9.5.2 of the Cochrane Handbook for Systematic Reviews of Interventions (Deeks 2017), we will consider I2 values as follows.
We will report Tau2 as an estimate of the between‐study variance when reporting the results from the random‐effects model. |
| Assessment of reporting biases | If we identify 10 or more studies, we will use funnel plots to investigate the relationship between intervention effect and study size. We will explore possible reasons for any asymmetry found. We will analyse the funnel plot of the data to ascertain asymmetry. Asymmetry of a funnel plot may indicate, among other things, publication bias or poor methodological quality (Egger 1997). |
| Data synthesis | We will synthesise results in a meta‐analysis using a fixed‐effect model when studies are similar enough with regard to the intervention, population and methods, to assume that the same treatment effect is estimated. We will synthesise results in a meta‐analysis using a random‐effects model when statistical heterogeneity is found or when studies differ enough with regard to the intervention, population, and methods, to assume that different yet related treatment effects are estimated, and when it is deemed to be clinically relevant, as recommended in section 9.4.3.1 of the Cochrane Handbook for Systematic Reviews of Interventions (Deeks 2017). |
| Subgroup analysis and investigation of heterogeneity | We will conduct the subgroup analyses listed below.
We will also look at the number of participants per study to determine if this is sufficient to perform a subgroup analysis. |
| Sensitivity analysis | We will conduct sensitivity analyses to investigate the effect on the overall results of excluding trials that meet the criteria described below.
We will also conduct a sensitivity analysis for studies with very low risk of bias. In addition, we will conduct a sensitivity analysis using a range of ICCs to assess the impact on treatment effect. |
| CI: confidence intervals; ICC: intraclass correlation coefficient; MD: mean difference; SMD: standardised mean difference. | |
| Outcome or subgroup title | No. of studies | No. of participants | Statistical method | Effect size |
| 1 Adverse effects Show forest plot | 1 | Risk Ratio (M‐H, Fixed, 95% CI) | Totals not selected | |