Scolaris Content Display Scolaris Content Display

Process for sifting search results and selecting studies for inclusion.
Figuras y tablas -
Figure 1

Process for sifting search results and selecting studies for inclusion.

'Risk of bias' graph: review authors' judgements about each risk of bias item presented as percentages across all included studies.
Figuras y tablas -
Figure 2

'Risk of bias' graph: review authors' judgements about each risk of bias item presented as percentages across all included studies.

'Risk of bias' summary: review authors' judgements about each risk of bias item for each included study.
Figuras y tablas -
Figure 3

'Risk of bias' summary: review authors' judgements about each risk of bias item for each included study.

Forest plot of comparison: 1 High‐dose versus low‐dose intranasal corticosteroids, outcome: 1.1 Disease severity ‐ overall symptoms, measured as average change from baseline at 4 months (range 0 to 3).
Figuras y tablas -
Figure 4

Forest plot of comparison: 1 High‐dose versus low‐dose intranasal corticosteroids, outcome: 1.1 Disease severity ‐ overall symptoms, measured as average change from baseline at 4 months (range 0 to 3).

Forest plot of comparison: 1 High‐dose versus low‐dose intranasal corticosteroids, outcome: 1.2 Disease severity ‐ individual symptoms, measured as average change from baseline at 4 months (range 0 to 3).
Figuras y tablas -
Figure 5

Forest plot of comparison: 1 High‐dose versus low‐dose intranasal corticosteroids, outcome: 1.2 Disease severity ‐ individual symptoms, measured as average change from baseline at 4 months (range 0 to 3).

Comparison 1 High‐dose versus low‐dose intranasal corticosteroids, Outcome 1 Disease severity ‐ overall symptoms, measured as average change from baseline at 4 months (range 0 to 3).
Figuras y tablas -
Analysis 1.1

Comparison 1 High‐dose versus low‐dose intranasal corticosteroids, Outcome 1 Disease severity ‐ overall symptoms, measured as average change from baseline at 4 months (range 0 to 3).

Comparison 1 High‐dose versus low‐dose intranasal corticosteroids, Outcome 2 Disease severity ‐ individual symptoms, measured as average change from baseline at 4 months (range 0 to 3).
Figuras y tablas -
Analysis 1.2

Comparison 1 High‐dose versus low‐dose intranasal corticosteroids, Outcome 2 Disease severity ‐ individual symptoms, measured as average change from baseline at 4 months (range 0 to 3).

Comparison 1 High‐dose versus low‐dose intranasal corticosteroids, Outcome 3 Adverse effects: epistaxis.
Figuras y tablas -
Analysis 1.3

Comparison 1 High‐dose versus low‐dose intranasal corticosteroids, Outcome 3 Adverse effects: epistaxis.

Comparison 1 High‐dose versus low‐dose intranasal corticosteroids, Outcome 4 Adverse effects: local irritation.
Figuras y tablas -
Analysis 1.4

Comparison 1 High‐dose versus low‐dose intranasal corticosteroids, Outcome 4 Adverse effects: local irritation.

Comparison 1 High‐dose versus low‐dose intranasal corticosteroids, Outcome 5 Nasal polyps size, measured as change from baseline (0 to 3 range scale) at 4 months.
Figuras y tablas -
Analysis 1.5

Comparison 1 High‐dose versus low‐dose intranasal corticosteroids, Outcome 5 Nasal polyps size, measured as change from baseline (0 to 3 range scale) at 4 months.

Comparison 1 High‐dose versus low‐dose intranasal corticosteroids, Outcome 6 Nasal polyps ‐ proportion with improvement at 12 weeks.
Figuras y tablas -
Analysis 1.6

Comparison 1 High‐dose versus low‐dose intranasal corticosteroids, Outcome 6 Nasal polyps ‐ proportion with improvement at 12 weeks.

Summary of findings for the main comparison. Different types of intranasal corticosteroid molecules for chronic rhinosinusitis

Different types of intranasal corticosteroid molecules for chronic rhinosinusitis

Patient or population: chronic rhinosinusitis (all studies recruited patients with bilateral polyps)
Setting: Europe/North America about 20 years ago, in secondary care settings
Intervention: fluticasone propionate
Comparison: beclomethasone dipropionate or mometasone furoate

Outcomes

№ of participants
(studies)

Relative effect (95%)

Anticipated absolute effects* (95% CI)

Quality

What happens

Low‐dose intranasal corticosteroids

High‐dose intranasal corticosteroids

Difference

Disease‐specific health‐related quality of life

Not measured

Impact unknown

Disease severity ‐ overall symptoms

  • Study 1: 37 participants

  • Study 2: 19 participants

  • Study 3: 100 participants

  • Study 1 (fluticasone propionate versus beclomethasone dipropionate): seemed to report results selectively, showing some benefits of fluticasone propionate for some symptoms

  • Study 2 (fluticasone propionate versus beclomethasone dipropionate): reported a "trend" towards less severity with fluticasone propionate compared to beclomethasone dipropionate

  • Study 3 (fluticasone propionate versus mometasone furoate): reported no statistically significant differences

⊕⊝⊝⊝
VERY LOW 1 2 3

No differences observed but evidence was too low quality to draw a conclusion

Adverse events: epistaxis

  • Study 1: 37 participants

  • Study 2: 19 participants

  • Study 3: 100 participants

  • Study 1 (fluticasone propionate versus beclomethasone dipropionate): 13/19 in fluticasone propionate group and 16/18 in beclomethasone dipropionate group had some form of adverse event, including epistaxis

  • Study 2 (fluticasone propionate versus beclomethasone dipropionate): 7/10 in fluticasone propionate group and 3/10 in beclomethasone dipropionate group had epistaxis

  • Study 3 (fluticasone propionate versus mometasone furoate): both drugs were "well tolerated"

⊕⊝⊝⊝
VERY LOW 1 2 3

Unclear whether the risk of epistaxis varies for different types of steroid molecules

*The risk in the intervention group (and its 95% confidence interval) is based on the assumed risk in the comparison group and the relative effect of the intervention (and its 95% CI).
CI: confidence interval

GRADE Working Group grades of evidence
High quality: We are very confident that the true effect lies close to that of the estimate of the effect
Moderate quality: We are moderately confident in the effect estimate: The true effect is likely to be close to the estimate of the effect, but there is a possibility that it is substantially different
Low quality: Our confidence in the effect estimate is limited: The true effect may be substantially different from the estimate of the effect
Very low quality: We have very little confidence in the effect estimate: The true effect is likely to be substantially different from the estimate of effect

1Studies were either very small (n = 20 and n = 26) and had important drop‐outs or were only reported as an abstract with inadequate information available (n = 100). We considered all studies to be at unclear to high risk of selective reporting and attrition bias. The evidence was very low quality due to very serious imprecision and very serious risk of bias concerns.

Figuras y tablas -
Summary of findings for the main comparison. Different types of intranasal corticosteroid molecules for chronic rhinosinusitis
Summary of findings 2. High‐dose versus low‐dose intranasal corticosteroids for chronic rhinosinusitis

High‐dose versus low‐dose intranasal corticosteroids for chronic rhinosinusitis

Patient or population: chronic rhinosinusitis (all studies recruited patients with bilateral polyps)
Setting: studies mostly conducted in Europe/North America about 10 years ago, in secondary care settings
Intervention: high‐dose intranasal corticosteroids
Comparison: low‐dose intranasal corticosteroids

Outcomes

№ of participants
(studies)

Relative effect
(95% CI)

Anticipated absolute effects* (95% CI)

Quality

What happens

Low‐dose intranasal corticosteroids

High‐dose intranasal corticosteroids

Difference

Disease‐specific health‐related quality of life

Not measured

Impact unknown

Disease severity ‐ overall symptoms, measured as average change from baseline at 4 months

All 4 EPOS domains

No information available

3 domains (nasal blockage, rhinorrhoea, loss of sense of smell) Range 0 to 3, lower score = less severe

№ of participants: 237
(1 RCT)

The mean disease severity ‐ overall symptoms, measured as average change from baseline at 4 months (range 0 to 3) ‐ average symptom score (3 domains) without high‐dose was

‐0.66 points

MD 0.13 points lower (0.37 lower to 0.11 more) than low‐dose group

⊕⊕⊝⊝
LOW 1 2 3

The average score for 3 types of symptoms seems to be similar between the high‐dose and low‐dose groups.

(2 domains: nasal blockage, rhinorrhoea)
Range 0 to 3, lower score = less severe

№ of participants: 441
(2 RCTs)

The mean disease severity ‐ overall symptoms, measured as average change from baseline at 4 months (range 0 to 3) ‐ average symptom score (2 domains) without high‐dose was

‐0.73 points

MD 0.19 points lower (0.36 lower to 0.02 lower) than low‐dose group

⊕⊕⊝⊝
LOW 1 2 3

The average score for 2 types of symptoms seems to be slightly lower for the high‐dose group. The clinical significance of this reduction is unclear.

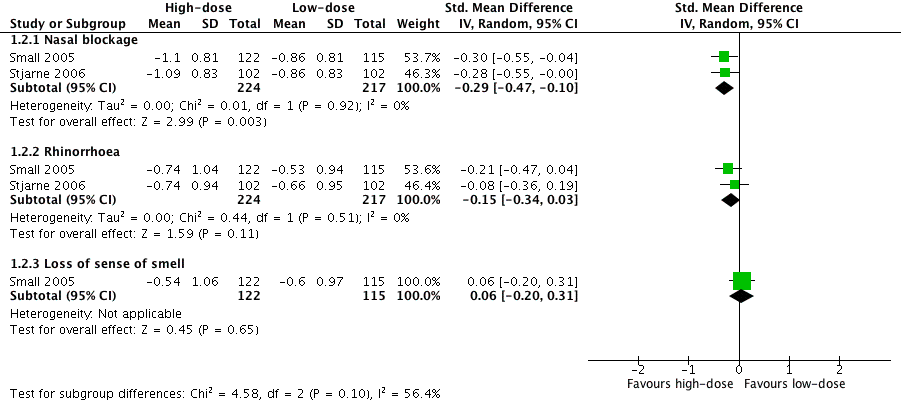
Disease severity ‐ measured as average change from baseline at 4 months (range 0 to 3)

  • Nasal blockage (lower score = less severe)

№ of participants: 441
(2 RCTs)

The mean disease severity ‐ individual symptoms, measured as average change from baseline at 4 months (range 0 to 3) ‐ nasal blockage without high‐dose was

‐0.86 points

MD 0.24 points lower (0.39 lower to 0.08 lower) than low‐dose group

⊕⊕⊝⊝
LOW 1 2 3

The nasal blockage score seems to be slightly lower in the high‐dose group. The clinical significance of this reduction is unclear.

  • Rhinorrhoea (lower score = less severe)

№ of participants: 441

(2 RCTs)

The mean disease severity ‐ individual symptoms, measured as average change from baseline at 4 months (range 0 to 3) ‐ rhinorrhoea without high‐dose was

‐0.6 points

MD 0.15 points lower (0.33 lower to 0.03 higher) than low‐dose group

⊕⊕⊝⊝
LOW 1 2 3

The average score for rhinorrhoea seems to be similar between the high‐dose and low‐dose groups.

  • Loss of sense of smell (lower score = less severe)

№ of participants: 237
(1 RCT)

The mean disease severity ‐ individual symptoms, measured as average change from baseline at 4 months (range 0 to 3) ‐ loss of sense of smell without high‐dose was

‐0.6 points

MD 0.06 points higher (0.2 lower to 0.32 higher) than low‐dose group

⊕⊕⊝⊝
LOW 1 2 3

The average score for loss of sense of smell seems to be very similar between the high‐dose and low‐dose groups.

Adverse effects: epistaxis

№ of participants: 637
(4 RCTs)

RR 2.06
(1.20 to 3.54)

Study population

⊕⊕⊕⊝
MODERATE 4 5

The risk of epistaxis is likely to be higher in the higher‐dose groups. However, the studies included very minor nosebleeds, such as blood stains in the mucus, and most of these events are not likely to be severe.

57 per 1000

118 per 1000
(69 to 202)

61 more per 1000

(11 more to 145 more)

Moderate

60 per 1000

124 per 1000
(72 to 214)

64 more per 1000

(12 more to 153 more)

Adverse effects: local irritation

№ of participants: 542
(3 RCTs)

RR 0.97
(0.28 to 3.31)

Study population

⊕⊕⊝⊝
LOW 4 6 7

The risk of local irritation seems to be similar between groups, but the overall risks are underestimated due to the way the data were reported.

19 per 1000

18 per 1000
(5 to 62)

10 fewer per 1000

(13 fewer to 43 more)

Moderate

17 per 1000

17 per 1000
(5 to 58)

10 fewer per 1000

(13 fewer to 40 more)

*The risk in the intervention group (and its 95% confidence interval) is based on the assumed risk in the comparison group and the relative effect of the intervention (and its 95% CI).
CI: confidence interval; EPOS: European Position Paper on Rhinosinusitis and Nasal Polyps 2012;MD: mean difference; RCT: randomised controlled trial; RR: risk ratio; SD: standard deviation

GRADE Working Group grades of evidence
High quality: We are very confident that the true effect lies close to that of the estimate of the effect
Moderate quality: We are moderately confident in the effect estimate: The true effect is likely to be close to the estimate of the effect, but there is a possibility that it is substantially different
Low quality: Our confidence in the effect estimate is limited: The true effect may be substantially different from the estimate of the effect
Very low quality: We have very little confidence in the effect estimate: The true effect is likely to be substantially different from the estimate of effect

1Scale validity, particularly discriminant validity (ability to distinguish the differences between groups), was unclear. There was a high risk of reporting bias. Studies tended to report enough information for meta‐analysis only for statistically significant results. One study, which had 101 participants, reported very similar values for both intervention arms for all disease scores but had no information related to SD.

2Small sample size ‐ evidence only from one or two relatively small studies.

3Only data from patients with bilateral nasal polyposis. We considered this to be indirectness of the evidence to patients without polyps but have not further downgraded the evidence.

4One of the studies had inadequate blinding ‐ a double dummy was not used to mask the twice daily (higher) versus once daily (lower) dose; the study had 101 participants.

5Sample size relatively small for a precise estimate of adverse events. We downgraded this outcome once, after taking into consideration the inadequate blinding in one of the studies and the relatively small sample size.

6Studies did not use consistent terminology/methods to report different types of local irritation. For analysis we only selected the most frequent types of local irritation from a list (to avoid double counting). This is a possible underestimation of overall event rates. The relatively low event rates and small sample size contributed to the large confidence intervals.

Figuras y tablas -
Summary of findings 2. High‐dose versus low‐dose intranasal corticosteroids for chronic rhinosinusitis
Comparison 1. High‐dose versus low‐dose intranasal corticosteroids

Outcome or subgroup title

No. of studies

No. of participants

Statistical method

Effect size

1 Disease severity ‐ overall symptoms, measured as average change from baseline at 4 months (range 0 to 3) Show forest plot

2

Std. Mean Difference (IV, Random, 95% CI)

Subtotals only

1.1 Average symptom score (3 domains)

1

237

Std. Mean Difference (IV, Random, 95% CI)

‐0.14 [‐0.39, 0.12]

1.2 Average symptom score (2 domains)

2

441

Std. Mean Difference (IV, Random, 95% CI)

‐0.21 [‐0.40, ‐0.03]

2 Disease severity ‐ individual symptoms, measured as average change from baseline at 4 months (range 0 to 3) Show forest plot

2

Std. Mean Difference (IV, Random, 95% CI)

Subtotals only

2.1 Nasal blockage

2

441

Std. Mean Difference (IV, Random, 95% CI)

‐0.29 [‐0.47, ‐0.10]

2.2 Rhinorrhoea

2

441

Std. Mean Difference (IV, Random, 95% CI)

‐0.15 [‐0.34, 0.03]

2.3 Loss of sense of smell

1

237

Std. Mean Difference (IV, Random, 95% CI)

0.06 [‐0.20, 0.31]

3 Adverse effects: epistaxis Show forest plot

4

637

Risk Ratio (M‐H, Fixed, 95% CI)

2.06 [1.20, 3.54]

4 Adverse effects: local irritation Show forest plot

3

542

Risk Ratio (M‐H, Fixed, 95% CI)

0.97 [0.28, 3.31]

5 Nasal polyps size, measured as change from baseline (0 to 3 range scale) at 4 months Show forest plot

1

237

Mean Difference (IV, Fixed, 95% CI)

0.19 [‐0.16, 0.54]

6 Nasal polyps ‐ proportion with improvement at 12 weeks Show forest plot

1

92

Risk Ratio (M‐H, Fixed, 95% CI)

1.71 [0.91, 3.21]

Figuras y tablas -
Comparison 1. High‐dose versus low‐dose intranasal corticosteroids