| 1 Disease‐specific health‐related quality of life ‐ no pooling (2 to 3 weeks) Show forest plot | 2 | | Std. Mean Difference (IV, Fixed, 95% CI) | Subtotals only |
|
| 1.1 Severity score of RSOM | 1 | 40 | Std. Mean Difference (IV, Fixed, 95% CI) | ‐1.24 [‐1.92, ‐0.56] |
| 1.2 Mini‐RQLQ | 1 | 58 | Std. Mean Difference (IV, Fixed, 95% CI) | ‐0.79 [‐1.32, ‐0.25] |
| 2 Disease‐specific health‐related quality of life ‐ RQLQ (3 to 6 months) Show forest plot | 1 | 50 | Std. Mean Difference (IV, Fixed, 95% CI) | ‐0.59 [‐1.16, ‐0.02] |
|
| 3 Disease severity (patient‐reported total symptom score) Show forest plot | 4 | | Std. Mean Difference (IV, Fixed, 95% CI) | Totals not selected |
|
| 3.1 Final value (2 to 3 weeks) | 3 | | Std. Mean Difference (IV, Fixed, 95% CI) | 0.0 [0.0, 0.0] |
| 3.2 Change from baseline (2 to 3 weeks) | 1 | | Std. Mean Difference (IV, Fixed, 95% CI) | 0.0 [0.0, 0.0] |
| 3.3 Final value (3 to 6 months) | 1 | | Std. Mean Difference (IV, Fixed, 95% CI) | 0.0 [0.0, 0.0] |
| 3.4 Change from baseline (3 to 6 months) | 1 | | Std. Mean Difference (IV, Fixed, 95% CI) | 0.0 [0.0, 0.0] |
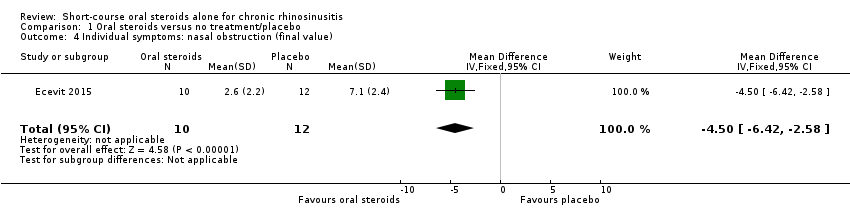
| 4 Individual symptoms: nasal obstruction (final value) Show forest plot | 1 | 22 | Mean Difference (IV, Fixed, 95% CI) | ‐4.5 [‐6.42, ‐2.58] |
|
| 5 Individual symptoms: nasal obstruction (change from baseline) Show forest plot | 1 | | Mean Difference (IV, Fixed, 95% CI) | Subtotals only |
|
| 5.1 Change from baseline (2 to 3 weeks) | 1 | 114 | Mean Difference (IV, Fixed, 95% CI) | ‐38.02 [‐48.16, ‐27.88] |
| 5.2 Change from baseline (3 to 6 months) | 1 | 114 | Mean Difference (IV, Fixed, 95% CI) | 0.90 [‐8.97, 10.77] |
| 6 Individual symptoms: nasal discharge (final value) Show forest plot | 1 | 22 | Mean Difference (IV, Fixed, 95% CI) | ‐4.7 [‐6.79, ‐2.61] |
|
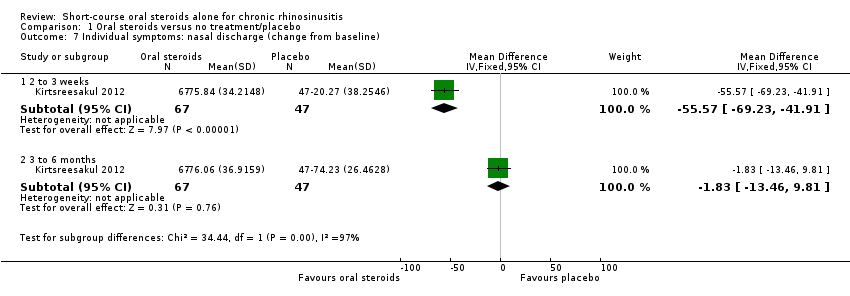
| 7 Individual symptoms: nasal discharge (change from baseline) Show forest plot | 1 | | Mean Difference (IV, Fixed, 95% CI) | Subtotals only |
|
| 7.1 2 to 3 weeks | 1 | 114 | Mean Difference (IV, Fixed, 95% CI) | ‐55.57 [‐69.23, ‐41.91] |
| 7.2 3 to 6 months | 1 | 114 | Mean Difference (IV, Fixed, 95% CI) | ‐1.83 [‐13.46, 9.81] |
| 8 Individual symptoms: facial pressure (final value) Show forest plot | 1 | 22 | Mean Difference (IV, Fixed, 95% CI) | ‐3.7 [‐6.02, ‐1.38] |
|
| 9 Individual symptoms: facial pressure (change from baseline) Show forest plot | 1 | | Mean Difference (IV, Fixed, 95% CI) | Subtotals only |
|
| 9.1 2 to 3 weeks | 1 | 114 | Mean Difference (IV, Fixed, 95% CI) | ‐30.66 [‐46.28, ‐15.04] |
| 9.2 3 to 6 months | 1 | 114 | Mean Difference (IV, Fixed, 95% CI) | 0.60 [‐12.56, 13.76] |
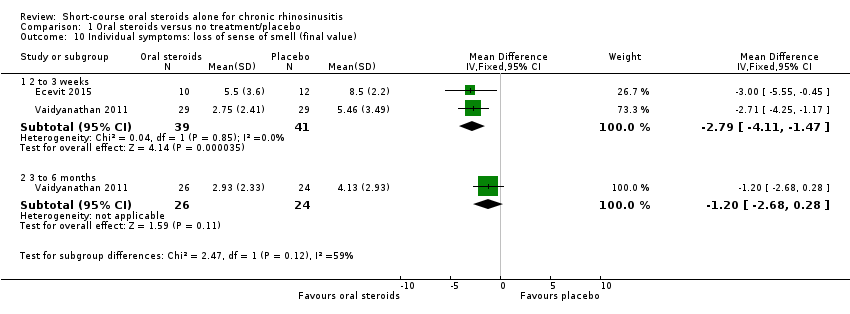
| 10 Individual symptoms: loss of sense of smell (final value) Show forest plot | 2 | | Mean Difference (IV, Fixed, 95% CI) | Subtotals only |
|
| 10.1 2 to 3 weeks | 2 | 80 | Mean Difference (IV, Fixed, 95% CI) | ‐2.79 [‐4.11, ‐1.47] |
| 10.2 3 to 6 months | 1 | 50 | Mean Difference (IV, Fixed, 95% CI) | ‐1.20 [‐2.68, 0.28] |
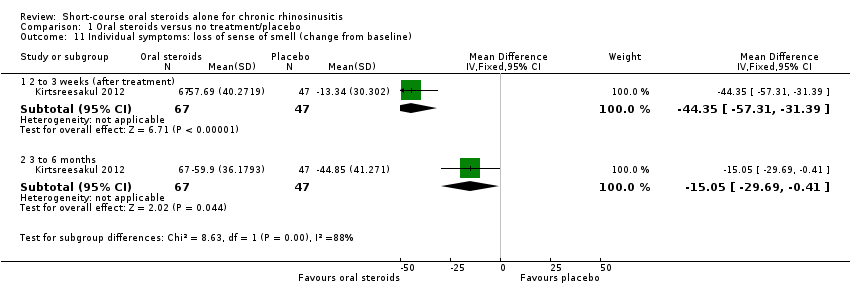
| 11 Individual symptoms: loss of sense of smell (change from baseline) Show forest plot | 1 | | Mean Difference (IV, Fixed, 95% CI) | Subtotals only |
|
| 11.1 2 to 3 weeks (after treatment) | 1 | 114 | Mean Difference (IV, Fixed, 95% CI) | ‐44.35 [‐57.31, ‐31.39] |
| 11.2 3 to 6 months | 1 | 114 | Mean Difference (IV, Fixed, 95% CI) | ‐15.05 [‐29.69, ‐0.41] |
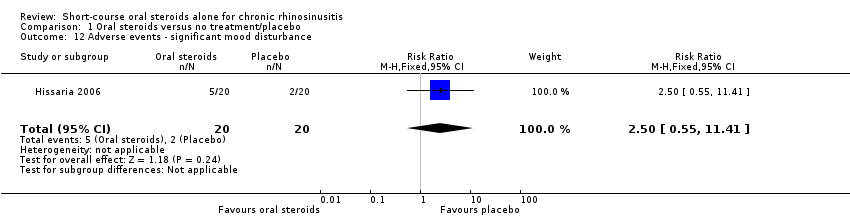
| 12 Adverse events ‐ significant mood disturbance Show forest plot | 1 | 40 | Risk Ratio (M‐H, Fixed, 95% CI) | 2.5 [0.55, 11.41] |
|
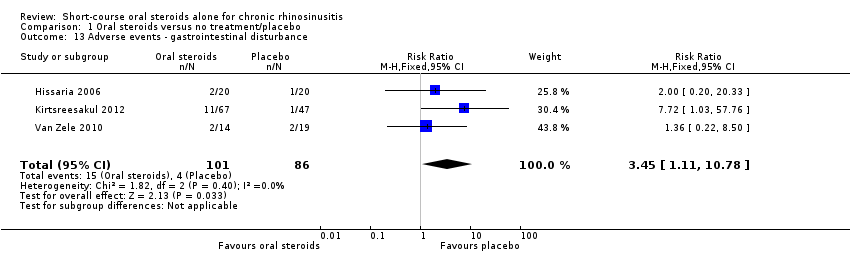
| 13 Adverse events ‐ gastrointestinal disturbance Show forest plot | 3 | 187 | Risk Ratio (M‐H, Fixed, 95% CI) | 3.45 [1.11, 10.78] |
|
| 14 Adverse events ‐ insomnia Show forest plot | 3 | 187 | Risk Ratio (M‐H, Fixed, 95% CI) | 3.63 [1.10, 11.95] |
|
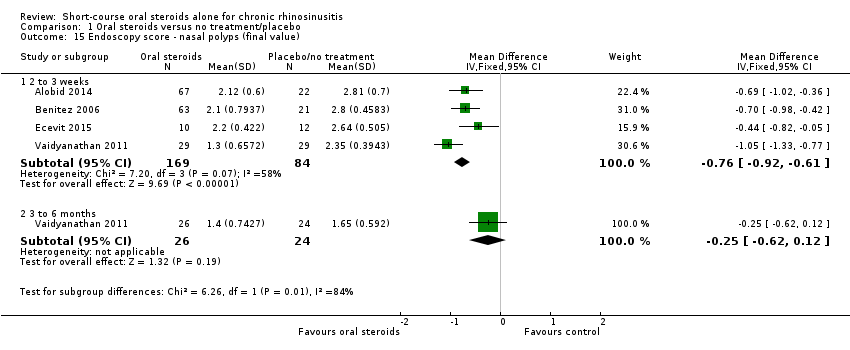
| 15 Endoscopy score ‐ nasal polyps (final value) Show forest plot | 4 | | Mean Difference (IV, Fixed, 95% CI) | Subtotals only |
|
| 15.1 2 to 3 weeks | 4 | 253 | Mean Difference (IV, Fixed, 95% CI) | ‐0.76 [‐0.92, ‐0.61] |
| 15.2 3 to 6 months | 1 | 50 | Mean Difference (IV, Fixed, 95% CI) | ‐0.25 [‐0.62, 0.12] |
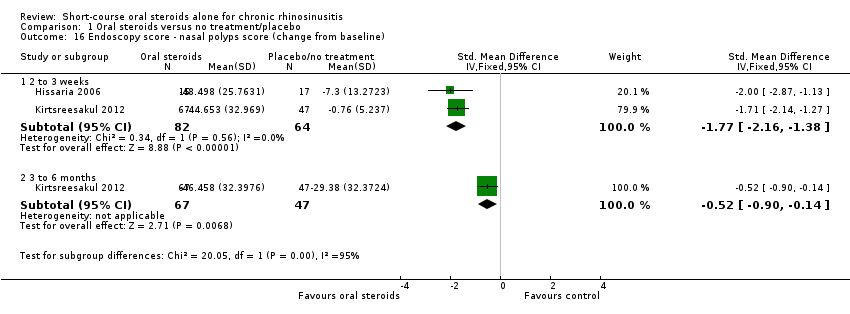
| 16 Endoscopy score ‐ nasal polyps score (change from baseline) Show forest plot | 2 | | Std. Mean Difference (IV, Fixed, 95% CI) | Subtotals only |
|
| 16.1 2 to 3 weeks | 2 | 146 | Std. Mean Difference (IV, Fixed, 95% CI) | ‐1.77 [‐2.16, ‐1.38] |
| 16.2 3 to 6 months | 1 | 114 | Std. Mean Difference (IV, Fixed, 95% CI) | ‐0.52 [‐0.90, ‐0.14] |