Corticosteroides orales de corta duración solos para la rinosinusitis crónica
Información
- DOI:
- https://doi.org/10.1002/14651858.CD011991.pub2Copiar DOI

- Base de datos:
-
- Cochrane Database of Systematic Reviews
- Versión publicada:
-
- 26 abril 2016see what's new
- Tipo:
-
- Intervention
- Etapa:
-
- Review
- Grupo Editorial Cochrane:
-
Grupo Cochrane de Enfermedades de oído, nariz y garganta
- Copyright:
-
- Copyright © 2016 The Cochrane Collaboration. Published by John Wiley & Sons, Ltd.
Cifras del artículo
Altmetric:
Citado por:
Autores
Contributions of authors
Karen Head: reviewed and edited the protocol. Abstract screening, full paper review, data extraction, data analysis, drafting and writing the report.
Lee Yee Chong: scoped, designed and wrote the protocol. Abstract screening, full paper review, data extraction, data analysis and editing the report.
Claire Hopkins: clinical guidance at all stages of project scoping and protocol development. Clinical input into data analysis, reviewing and editing the report.
Carl Philpott: clinical guidance at all stages of project scoping and protocol development. Clinical input into data analysis, reviewing and editing the report.
Martin J Burton: helped to draft the protocol; clinical guidance at all stages of project scoping and protocol development. Clinical input into data analysis, reviewing and editing the report.
Anne GM Schilder: clinical input into data analysis, reviewing and editing the report.
Sources of support
Internal sources
-
No sources of support supplied
External sources
-
National Institute for Health Research, UK.
Funding to complete a suite of reviews on medical interventions for chronic rhinosinusitis in 2015/2016 (award reference 14/174/03), in addition to infrastructure funding for Cochrane ENT
Declarations of interest
Lee Yee Chong: none known.
Karen Head: none known.
Claire Hopkins: I have received financial support from several companies involved in producing instruments for sinus surgery: Acclarent, Sinusys, Cryolife and Medtronic.
Carl Philpott: I have previously received consultancy fees from the companies Acclarent, Navigant, Aerin Medical and Entellus.
Martin J Burton: Professor Martin Burton is joint Co‐ordinating Editor of Cochrane ENT, but had no role in the editorial process for this review.
Anne GM Schilder: Professor Anne Schilder is joint Co‐ordinating Editor of Cochrane ENT, but had no role in the editorial process for this review. Her evidENT team at UCL is supported by her NIHR Research Professorship award with the remit to develop a UK infrastructure and programme of clinical research in ENT, Hearing and Balance. Her institution has received a grant from GSK for a study on the microbiology of acute tympanostomy tube otorrhoea.
Acknowledgements
This project is one of a suite of reviews on the medical treatment of chronic rhinosinusitis, funded by the National Institute for Health Research (award reference 14/174/03).
This project was also supported by the National Institute for Health Research, via Cochrane Infrastructure, Cochrane Programme Grant or Cochrane Incentive funding to Cochrane ENT. The views and opinions expressed therein are those of the authors and do not necessarily reflect those of the Systematic Reviews Programme, NIHR, NHS or the Department of Health.
We would like to express our thanks to the external peer reviewer, Professor Wytske Fokkens, the consumer referee Joan Blakley and the Cochrane ENT editors for their detailed and insightful comments, which helped to strengthen this review. Thank you also to acting Co‐ordinating Editor, Professor Richard Harvey, for his oversight of this publication.
We are indebted to Samuel MacKeith for translation help for this review.
The authors are grateful for the assistance provided by Jenny Bellorini and Samantha Faulkner, with editorial support and searching for studies.
Version history
| Published | Title | Stage | Authors | Version |
| 2016 Apr 26 | Short‐course oral steroids alone for chronic rhinosinusitis | Review | Karen Head, Lee Yee Chong, Claire Hopkins, Carl Philpott, Martin J Burton, Anne GM Schilder | |
| 2015 Dec 15 | Short‐course oral steroids alone for chronic rhinosinusitis | Protocol | Lee Yee Chong, Karen Head, Claire Hopkins, Carl Philpott, Martin J Burton | |
Differences between protocol and review
As part of the discussions about the use of a total symptom score we noted that many papers within the suite of reviews did not present information for all four elements of the EPOS criteria for defining chronic rhinosinusitis (EPOS 2012). In particular, many studies that only included patients with nasal polyps did not present information on facial pressure or pain. We made the decision that where individual symptoms were recorded, they should be presented within the outcome of disease severity symptom score within the paper as this information would be useful for the reader.
Keywords
MeSH
Medical Subject Headings (MeSH) Keywords
Medical Subject Headings Check Words
Humans;
PICO
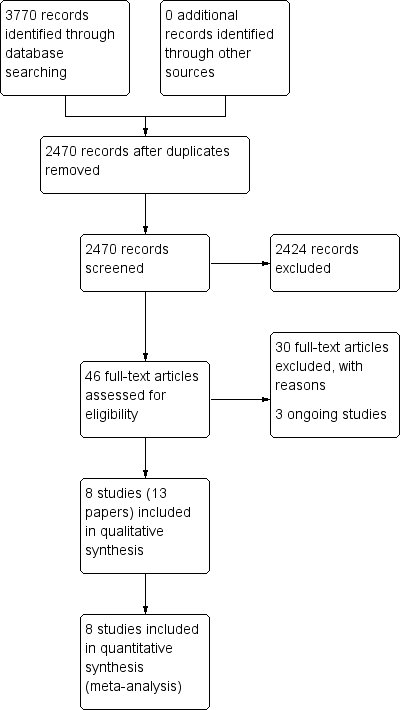
Process for sifting search results and selecting studies for inclusion.

'Risk of bias' summary: review authors' judgements about each risk of bias item for each included study.

'Risk of bias' graph: review authors' judgements about each risk of bias item presented as percentages across all included studies.

Forest plot of comparison: 1 Oral steroids versus no treatment/placebo, outcome: 1.1 Disease‐specific health‐related quality of life ‐ no pooling (2 to 3 weeks).

Forest plot of comparison: 1 Oral steroids versus no treatment/placebo, outcome: 1.3 Disease severity (patient‐reported total symptom score).

Comparison 1 Oral steroids versus no treatment/placebo, Outcome 1 Disease‐specific health‐related quality of life ‐ no pooling (2 to 3 weeks).

Comparison 1 Oral steroids versus no treatment/placebo, Outcome 2 Disease‐specific health‐related quality of life ‐ RQLQ (3 to 6 months).

Comparison 1 Oral steroids versus no treatment/placebo, Outcome 3 Disease severity (patient‐reported total symptom score).
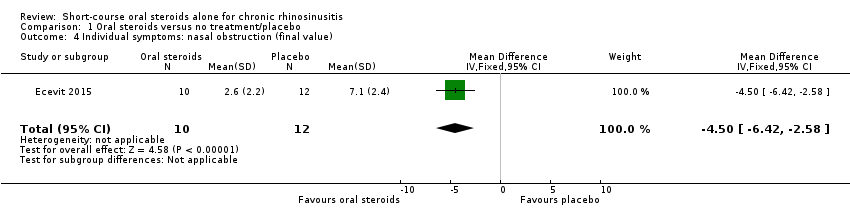
Comparison 1 Oral steroids versus no treatment/placebo, Outcome 4 Individual symptoms: nasal obstruction (final value).

Comparison 1 Oral steroids versus no treatment/placebo, Outcome 5 Individual symptoms: nasal obstruction (change from baseline).

Comparison 1 Oral steroids versus no treatment/placebo, Outcome 6 Individual symptoms: nasal discharge (final value).
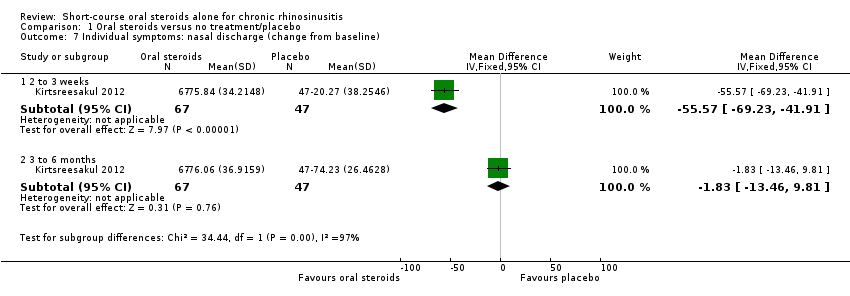
Comparison 1 Oral steroids versus no treatment/placebo, Outcome 7 Individual symptoms: nasal discharge (change from baseline).

Comparison 1 Oral steroids versus no treatment/placebo, Outcome 8 Individual symptoms: facial pressure (final value).

Comparison 1 Oral steroids versus no treatment/placebo, Outcome 9 Individual symptoms: facial pressure (change from baseline).
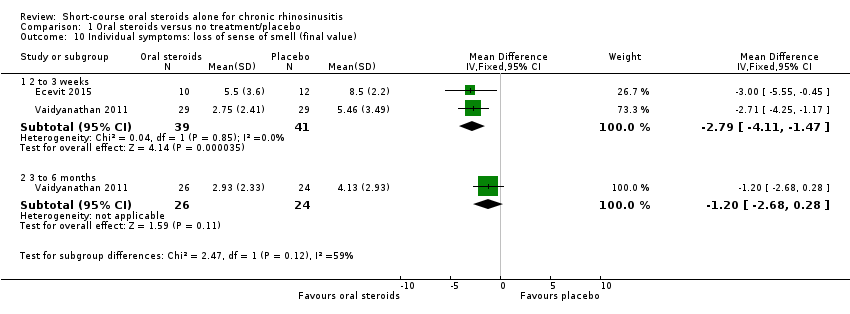
Comparison 1 Oral steroids versus no treatment/placebo, Outcome 10 Individual symptoms: loss of sense of smell (final value).
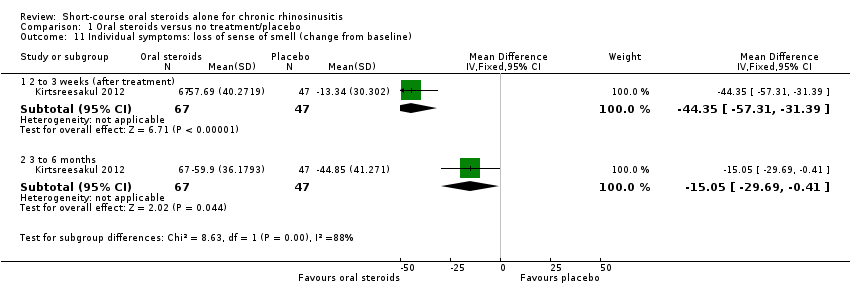
Comparison 1 Oral steroids versus no treatment/placebo, Outcome 11 Individual symptoms: loss of sense of smell (change from baseline).
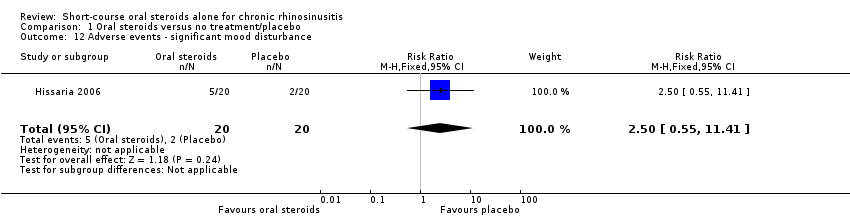
Comparison 1 Oral steroids versus no treatment/placebo, Outcome 12 Adverse events ‐ significant mood disturbance.
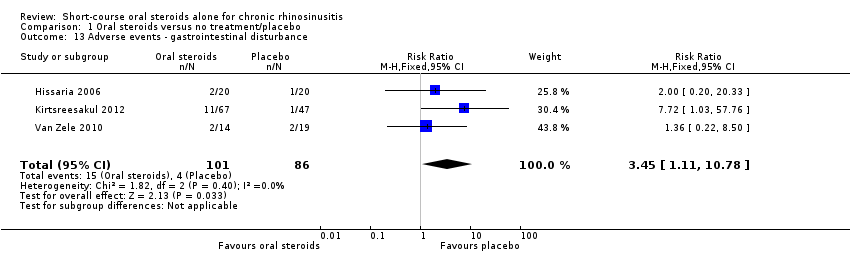
Comparison 1 Oral steroids versus no treatment/placebo, Outcome 13 Adverse events ‐ gastrointestinal disturbance.

Comparison 1 Oral steroids versus no treatment/placebo, Outcome 14 Adverse events ‐ insomnia.
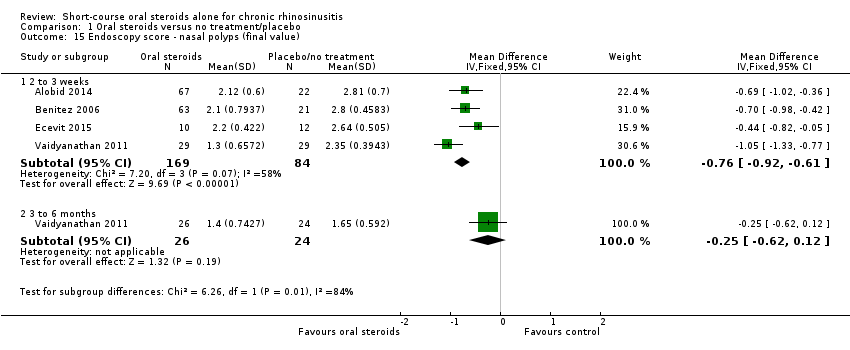
Comparison 1 Oral steroids versus no treatment/placebo, Outcome 15 Endoscopy score ‐ nasal polyps (final value).
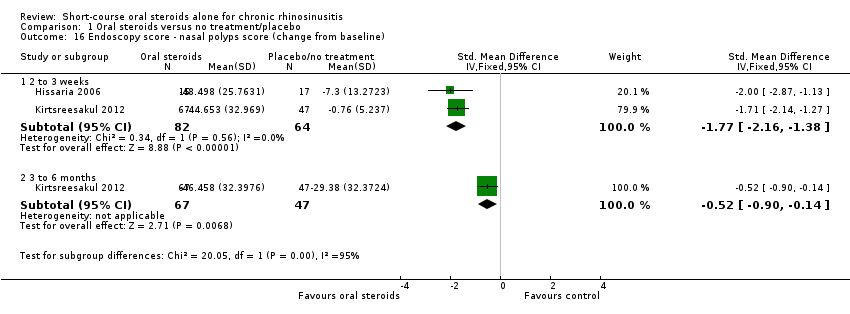
Comparison 1 Oral steroids versus no treatment/placebo, Outcome 16 Endoscopy score ‐ nasal polyps score (change from baseline).
| Short‐course oral corticosteroids compared with placebo/no treatment for chronic rhinosinusitis | ||||||
| Patient or population: chronic rhinosinusitis with nasal polyps | ||||||
| Outcomes № of participants | Relative effect | Anticipated absolute effects* (95% CI) | Quality | What happens | ||
| Without oral steroids | With oral steroids | Difference | ||||
| Disease‐specific health‐related quality of life measured by Follow‐up: 2 weeks № of participants: 40 | — | Not estimable | — | The mean disease‐specific health‐related quality of life in the intervention group was 1.24 standard deviations lower (1.92 lower to 0.56 lower) | ⊕⊕⊝⊝ | A lower score indicates reduced impairment. Treatment effect in favour of short‐course oral steroids.
|
| Disease severity, as measured by patient‐reported symptom score,
| — | — | — |
| ⊕⊕⊝⊝ ⊕⊕⊝⊝ ⊕⊕⊝⊝ | A lower score indicates milder symptoms in favour of short‐course oral steroids.
|
| Adverse events: significant mood disturbance № of participants: 40 | RR 2.50 | Study population | ⊕⊕⊝⊝ | It is uncertain whether there were more mood disturbance adverse events in the oral corticosteroids group. | ||
| 100 per 1000 | 250 per 1000 | 150 more per 1000 (45 fewer to 1041 more) | ||||
| Health‐related quality of life, using generic quality of life scores | This outcome was not reported in any of the studies | |||||
| Adverse events: gastrointestinal disturbance Follow‐up: 3 months № of participants:187 | RR 3.45 | Study population | ⊕⊕⊝⊝ | There were more gastrointestinal disturbance adverse events in the oral corticosteroids group. | ||
| 47 per 1000 | 160 per 1000 | 114 more per 1000 (5 more to 455 more) | ||||
| Adverse events: insomnia Follow‐up: 3 months № of participants:187 | RR 3.63 | Study population | ⊕⊕⊝⊝ | There were more insomnia adverse events in the oral corticosteroids group. | ||
| 23 per 1000 | 84 per 1000 | 61 more per 1000 (2 more to 255 more) | ||||
| *The risk in the intervention group (and its 95% confidence interval) is based on the assumed risk in the comparison group and the relative effect of the intervention (and its 95% CI). | ||||||
| GRADE Working Group grades of evidence | ||||||
| 1Downgraded to low quality due to limitations in study methodology and imprecision. Only the disease severity scale of the RSOM‐31 was used (unknown validity of this subscale and the range of scores is unclear). One small study (n = 40), which lacked information about the method of randomisation and allocation concealment. There is a also concern that the magnitude of improvement is not sustained; one study that used a non‐validated instrument reported smaller benefit at three to six months than at two to three weeks for health‐related quality of life. 2The individual symptoms measured were: nasal obstruction, nasal discharge, sense of smell and pressure over the sinuses. Scores for the individual symptoms (0 to 10 visual analogue scale (VAS)) were summed to find the total score.The effect size could be underestimated with this method. 3Downgraded to low quality due to imprecision. Results are from one very small study (n = 22) and the results were only measured at the end of treatment (17 days). There is a concern that the magnitude of improvement is not sustained. The outcome was not measured using a validated tool. 4Downgraded to low quality due to limitations in study methodology and imprecision. One small study (n = 40), which lacked information about the method of randomisation and allocation concealment. The definition of 'mood disturbance' is not provided in the paper. The results have large confidence intervals. 5Downgraded to low quality due to inconsistency and imprecision. The terminology between the papers for this outcome differed from "diarrhoea/GI disturbance" to "gastrointestinal disturbance" to "reflux and/or gastric pain". A low number of events were reported resulting in large confidence intervals. 6Downgraded to low quality due to inconsistency and imprecision. The definition of 'insomnia' is not provided in the papers. A low number of events were reported resulting in large confidence intervals. 7The individual symptoms measured were: blocked nose, rhinorrhoea, hyposmia and sinonasal pain. The results were measured as individual symptoms on a seven‐point Likert scale (0 = no symptoms) and presented as percentage change from baseline for each symptom, which was averaged across the four symptoms to create an average change from baseline. The effect size could be underestimated with this method. 8All patients in both groups received intranasal steroids at the end of the treatment period until the end of follow‐up (12 weeks). 9Downgraded to low quality due to limitations in study methodology and imprecision. Results are from one small study (n = 117) with unclear randomisation and allocation concealment. The results were measured at the end of treatment (two weeks). There is a concern that the results are not sustained. The outcome was not measured using a validated tool. 10Downgraded to low quality due to limitations in study methodology and imprecision. Results are from one small study (n = 117) with unclear randomisation and allocation concealment. There is a small effect size with large confidence intervals. The outcome was not measured using a validated tool. | ||||||
| System | Adverse events | Notes |
| Musculoskeletal | Osteoporosis | Largely limited to long‐term use Significantly increased risk of fractures with prolonged use |
| Osteonecrosis | Rare, appears to be dose‐dependent | |
| Endocrine | Hyperglycaemia | Common; dose‐dependent, usually reversible |
| Cardiovascular | Hypertension | Common; dose‐dependent, usually reversible |
| Dermatological | Striae, bruising | Dose‐dependent; occurs after > 1 month usage |
| Ophthalmological | Cataracts | Irreversible; largely related to long‐term usage |
| Glaucoma | High risk with pre‐existing disease | |
| Gastrointestinal tract | Peptic ulceration | Increased risk largely due to concomitant NSAIDs |
| Psychological | Psychosis | Common; increased risk with dosages > 40 mg/day |
| References: Da Silva 2006; Naber 1996; Stanbury 1998 NSAIDs: non‐steroidal anti‐inflammatory drugs | ||
| Outcome or subgroup title | No. of studies | No. of participants | Statistical method | Effect size |
| 1 Disease‐specific health‐related quality of life ‐ no pooling (2 to 3 weeks) Show forest plot | 2 | Std. Mean Difference (IV, Fixed, 95% CI) | Subtotals only | |
| 1.1 Severity score of RSOM | 1 | 40 | Std. Mean Difference (IV, Fixed, 95% CI) | ‐1.24 [‐1.92, ‐0.56] |
| 1.2 Mini‐RQLQ | 1 | 58 | Std. Mean Difference (IV, Fixed, 95% CI) | ‐0.79 [‐1.32, ‐0.25] |
| 2 Disease‐specific health‐related quality of life ‐ RQLQ (3 to 6 months) Show forest plot | 1 | 50 | Std. Mean Difference (IV, Fixed, 95% CI) | ‐0.59 [‐1.16, ‐0.02] |
| 3 Disease severity (patient‐reported total symptom score) Show forest plot | 4 | Std. Mean Difference (IV, Fixed, 95% CI) | Totals not selected | |
| 3.1 Final value (2 to 3 weeks) | 3 | Std. Mean Difference (IV, Fixed, 95% CI) | 0.0 [0.0, 0.0] | |
| 3.2 Change from baseline (2 to 3 weeks) | 1 | Std. Mean Difference (IV, Fixed, 95% CI) | 0.0 [0.0, 0.0] | |
| 3.3 Final value (3 to 6 months) | 1 | Std. Mean Difference (IV, Fixed, 95% CI) | 0.0 [0.0, 0.0] | |
| 3.4 Change from baseline (3 to 6 months) | 1 | Std. Mean Difference (IV, Fixed, 95% CI) | 0.0 [0.0, 0.0] | |
| 4 Individual symptoms: nasal obstruction (final value) Show forest plot | 1 | 22 | Mean Difference (IV, Fixed, 95% CI) | ‐4.5 [‐6.42, ‐2.58] |
| 5 Individual symptoms: nasal obstruction (change from baseline) Show forest plot | 1 | Mean Difference (IV, Fixed, 95% CI) | Subtotals only | |
| 5.1 Change from baseline (2 to 3 weeks) | 1 | 114 | Mean Difference (IV, Fixed, 95% CI) | ‐38.02 [‐48.16, ‐27.88] |
| 5.2 Change from baseline (3 to 6 months) | 1 | 114 | Mean Difference (IV, Fixed, 95% CI) | 0.90 [‐8.97, 10.77] |
| 6 Individual symptoms: nasal discharge (final value) Show forest plot | 1 | 22 | Mean Difference (IV, Fixed, 95% CI) | ‐4.7 [‐6.79, ‐2.61] |
| 7 Individual symptoms: nasal discharge (change from baseline) Show forest plot | 1 | Mean Difference (IV, Fixed, 95% CI) | Subtotals only | |
| 7.1 2 to 3 weeks | 1 | 114 | Mean Difference (IV, Fixed, 95% CI) | ‐55.57 [‐69.23, ‐41.91] |
| 7.2 3 to 6 months | 1 | 114 | Mean Difference (IV, Fixed, 95% CI) | ‐1.83 [‐13.46, 9.81] |
| 8 Individual symptoms: facial pressure (final value) Show forest plot | 1 | 22 | Mean Difference (IV, Fixed, 95% CI) | ‐3.7 [‐6.02, ‐1.38] |
| 9 Individual symptoms: facial pressure (change from baseline) Show forest plot | 1 | Mean Difference (IV, Fixed, 95% CI) | Subtotals only | |
| 9.1 2 to 3 weeks | 1 | 114 | Mean Difference (IV, Fixed, 95% CI) | ‐30.66 [‐46.28, ‐15.04] |
| 9.2 3 to 6 months | 1 | 114 | Mean Difference (IV, Fixed, 95% CI) | 0.60 [‐12.56, 13.76] |
| 10 Individual symptoms: loss of sense of smell (final value) Show forest plot | 2 | Mean Difference (IV, Fixed, 95% CI) | Subtotals only | |
| 10.1 2 to 3 weeks | 2 | 80 | Mean Difference (IV, Fixed, 95% CI) | ‐2.79 [‐4.11, ‐1.47] |
| 10.2 3 to 6 months | 1 | 50 | Mean Difference (IV, Fixed, 95% CI) | ‐1.20 [‐2.68, 0.28] |
| 11 Individual symptoms: loss of sense of smell (change from baseline) Show forest plot | 1 | Mean Difference (IV, Fixed, 95% CI) | Subtotals only | |
| 11.1 2 to 3 weeks (after treatment) | 1 | 114 | Mean Difference (IV, Fixed, 95% CI) | ‐44.35 [‐57.31, ‐31.39] |
| 11.2 3 to 6 months | 1 | 114 | Mean Difference (IV, Fixed, 95% CI) | ‐15.05 [‐29.69, ‐0.41] |
| 12 Adverse events ‐ significant mood disturbance Show forest plot | 1 | 40 | Risk Ratio (M‐H, Fixed, 95% CI) | 2.5 [0.55, 11.41] |
| 13 Adverse events ‐ gastrointestinal disturbance Show forest plot | 3 | 187 | Risk Ratio (M‐H, Fixed, 95% CI) | 3.45 [1.11, 10.78] |
| 14 Adverse events ‐ insomnia Show forest plot | 3 | 187 | Risk Ratio (M‐H, Fixed, 95% CI) | 3.63 [1.10, 11.95] |
| 15 Endoscopy score ‐ nasal polyps (final value) Show forest plot | 4 | Mean Difference (IV, Fixed, 95% CI) | Subtotals only | |
| 15.1 2 to 3 weeks | 4 | 253 | Mean Difference (IV, Fixed, 95% CI) | ‐0.76 [‐0.92, ‐0.61] |
| 15.2 3 to 6 months | 1 | 50 | Mean Difference (IV, Fixed, 95% CI) | ‐0.25 [‐0.62, 0.12] |
| 16 Endoscopy score ‐ nasal polyps score (change from baseline) Show forest plot | 2 | Std. Mean Difference (IV, Fixed, 95% CI) | Subtotals only | |
| 16.1 2 to 3 weeks | 2 | 146 | Std. Mean Difference (IV, Fixed, 95% CI) | ‐1.77 [‐2.16, ‐1.38] |
| 16.2 3 to 6 months | 1 | 114 | Std. Mean Difference (IV, Fixed, 95% CI) | ‐0.52 [‐0.90, ‐0.14] |