Intubación orotraqueal en lactantes realizada con y sin estilete
Appendices
Appendix 1. Standard search methods
MEDLINE: ((infant, newborn[MeSH] OR newborn OR neonate OR neonatal OR premature OR low birth weight OR VLBW OR LBW or infan* or neonat*) AND (randomized controlled trial [pt] OR controlled clinical trial [pt] OR randomized [tiab] OR placebo [tiab] OR drug therapy [sh] OR randomly [tiab] OR trial [tiab] OR groups [tiab]) NOT (animals [mh] NOT humans [mh]))
Appendix 2. Risk of bias tool
We used the 'Risk of bias' table, which addresses the following questions.
Sequence generation (checking for possible selection bias). Was the allocation sequence adequately generated? For each included study, we categorised the method used to generate the allocation sequence as low risk (any truly random process, e.g. random number table; computer random number generator); unclear risk; or high risk (any non‐random process, e.g. odd or even date of birth; hospital or clinic record number).
Allocation concealment (checking for possible selection bias). Was allocation adequately concealed? For each included study, we categorised the method used to conceal the allocation sequence as low risk (e.g. telephone or central randomisation; consecutively numbered, sealed, opaque envelopes); unclear risk; or high risk (open random allocation; unsealed or non‐opaque envelopes, alternation; date of birth).
Blinding (checking for possible performance bias). Was knowledge of the allocated intervention adequately prevented during the study, at study entry, or at the time of outcome assessment? For each included study, we categorised the methods used to blind study participants and personnel from knowledge of which intervention a participant received. We assessed blinding separately for different outcomes or classes of outcomes. We categorised the methods as low risk, high risk, or unclear risk for participants; low risk, high risk, or unclear risk for outcome assessors; low risk, high risk, or unclear risk for personnel.
Incomplete outcome data (checking for possible attrition bias through withdrawals, dropouts, protocol deviations). Were incomplete outcome data adequately addressed? For each included study, we described the completeness of data including attrition and exclusions from the analysis. We also noted reasons for attrition and exclusions if possible. We categorised the methods as low risk (< 20% missing data); unclear risk; or high risk (≥ 20% missing data).
Selective reporting bias. Were reports of the study free of suggestion of selective outcome reporting? We planned to contact study authors, asking them to provide missing outcome data, when we suspected reporting bias. For each included study, we planned to describe how we investigated the possibility of selective outcome reporting bias. We planned to assess the methods as low risk (when it is clear that all of the study's prespecified outcomes and all expected outcomes of interest to the review have been reported); unclear risk; or high risk (when not all of the study's prespecified outcomes have been reported).
Other sources of bias. Was the study apparently free of other problems that could put it at high risk of bias? For each included study, we described any important concerns we had about other possible sources of bias (e.g. whether a potential source of bias was related to the specific study design, whether the trial was stopped early owing to some data‐dependent process). We also assessed whether each study was free of other problems that could put it at risk of bias as low risk; unclear risk; or high risk.
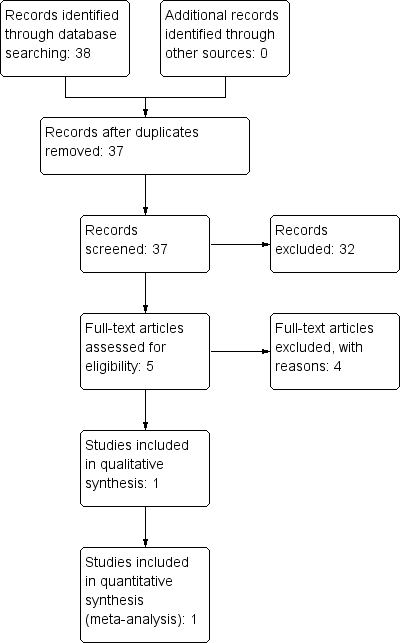
Study flow diagram.

Risk of bias graph: review authors' judgements about each risk of bias item presented as percentages across all included studies.
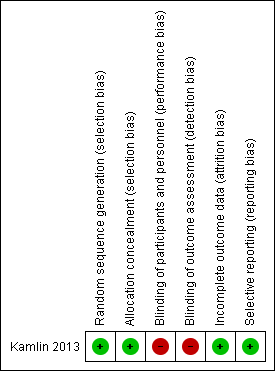
Risk of bias summary: review authors' judgements about each risk of bias item for each included study.
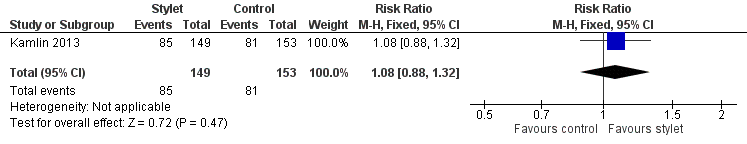
Forest plot of comparison: 1 First intubation attempt success rate with use of stylet versus non‐use of stylet, outcome: 1.1 First intubation attempt success rate.
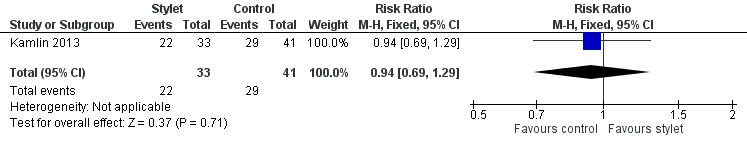
Forest plot of comparison: 2 Intubation success: Professional category, outcome: 2.1 Fellow: first intubation attempt success rate.
Forest plot of comparison: 2 Intubation success: Professional category, outcome: 2.2 Resident: first intubation attempt success rate.
Forest plot of comparison: 3 Intubation success: use of premedication, outcome: 3.1 Intubations without premedication given to the infant.
Forest plot of comparison: 3 Intubation success: use of premedication, outcome: 3.2 Intubations following premedication given to the infant.
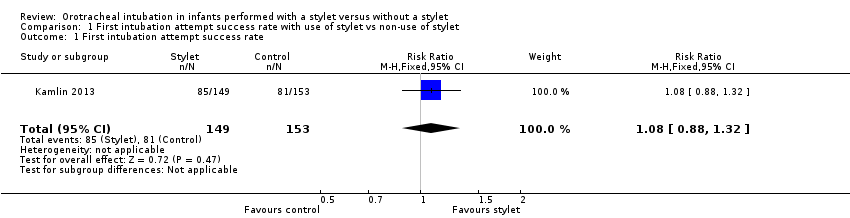
Comparison 1 First intubation attempt success rate with use of stylet vs non‐use of stylet, Outcome 1 First intubation attempt success rate.
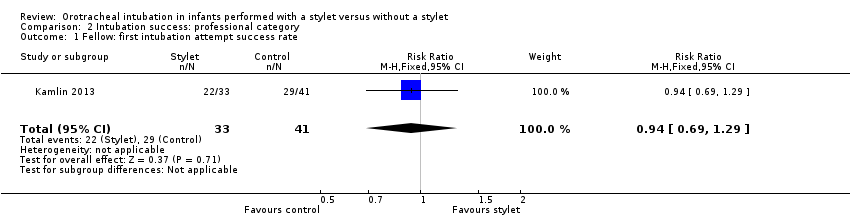
Comparison 2 Intubation success: professional category, Outcome 1 Fellow: first intubation attempt success rate.
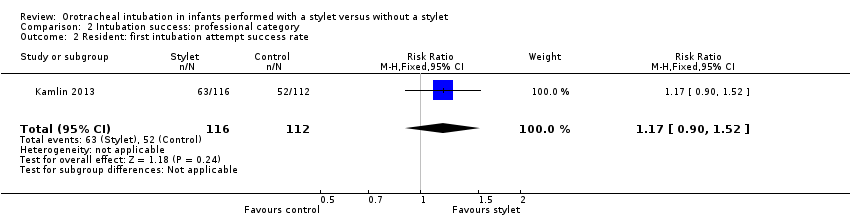
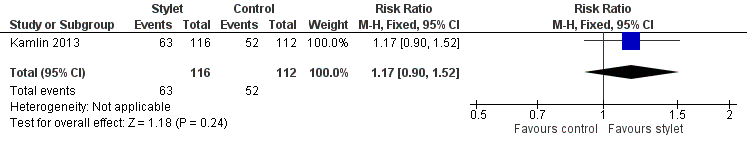
Comparison 2 Intubation success: professional category, Outcome 2 Resident: first intubation attempt success rate.
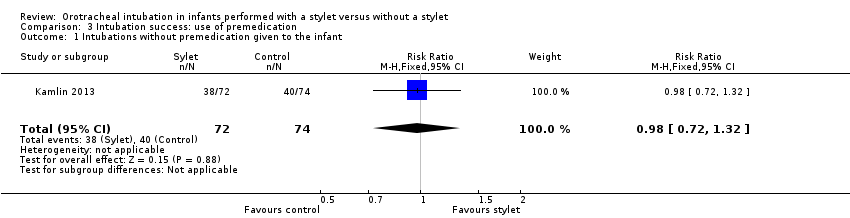
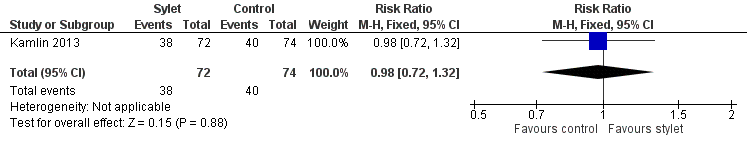
Comparison 3 Intubation success: use of premedication, Outcome 1 Intubations without premedication given to the infant.
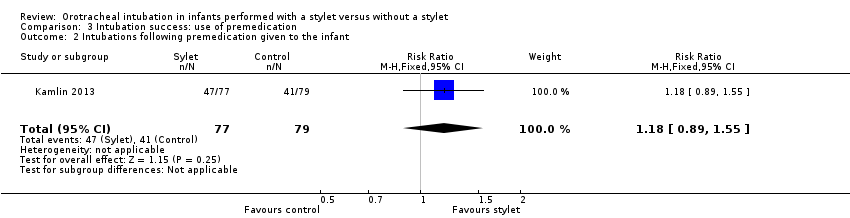
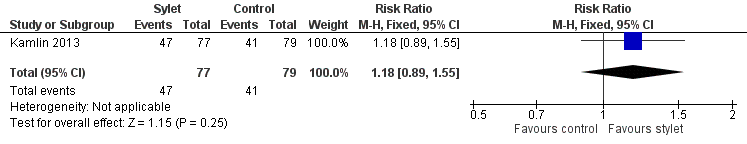
Comparison 3 Intubation success: use of premedication, Outcome 2 Intubations following premedication given to the infant.
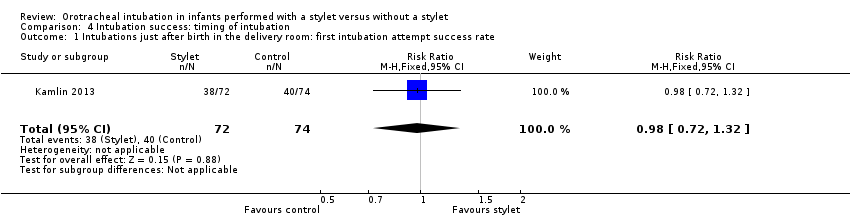
Comparison 4 Intubation success: timing of intubation, Outcome 1 Intubations just after birth in the delivery room: first intubation attempt success rate.
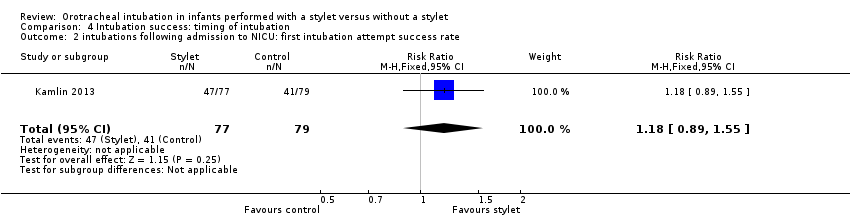
Comparison 4 Intubation success: timing of intubation, Outcome 2 intubations following admission to NICU: first intubation attempt success rate.
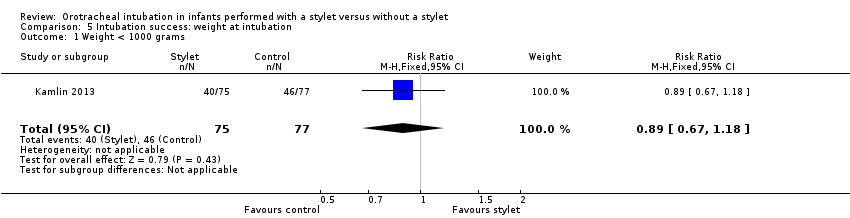
Comparison 5 Intubation success: weight at intubation, Outcome 1 Weight < 1000 grams.
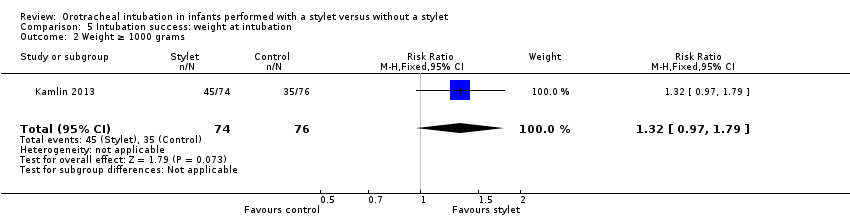
Comparison 5 Intubation success: weight at intubation, Outcome 2 Weight ≥ 1000 grams.
| Stylet compared with no stylet for neonatal intubation | ||||||
| Patient or population: neonates requiring endotracheal intubation Settings: neonatal intensive care unit or delivery room or theatre Intervention: a stylet inserted into the endotracheal tube Comparison: no stylet inserted into the endotracheal tube | ||||||
| Outcomes | Illustrative comparative risks* (95% CI) | Relative effect | Number of intubations | Quality of the evidence | Comments | |
| Assumed risk | Corresponding risk | |||||
| Control | Stylet | |||||
| First intubation attempt success rate (outcome achieved at time of intubation attempt and not followed up) | 529 per 1000 | 570 per 1000 | RR 1.08 | 302 | ⊕⊕⊕⊝a,b | Unblinded trial with no blinded outcome assessment Single study |
| Gestational age of the infant | no data | no data | no data | no data | absence of evidence | |
| Professional category of the intubator ‐ fellow: first intubation attempt success rate (outcome achieved at time of intubation attempt and not followed up) | 707 per 1000 | 667 per 1000 | RR 0.94 | 74 | ⊕⊕⊝⊝a,b | Unblinded trial with no blinded outcome assessment Single study |
| Professional category of the intubator ‐ resident: first intubation attempt success rate (outcome achieved at time of intubation attempt and not followed up) | 464 per 1000 | 543 per 1000 | RR 1.17 | 228 | ⊕⊕⊕⊝a,b | Unblinded trial with no blinded outcome assessment Single study |
| Level of experience of the intubator | no data | no data | no data | no data | absence of evidence | |
| Premedication given ‐ no premedication given: first intubation attempt success rate (outcome achieved at time of intubation attempt and not followed up) | 540 per 1000 | 528 per 1000 | RR 0.98 | 146 | ⊕⊕⊕⊝a,b | Unblinded trial with no blinded outcome assessment Single study |
| Premedication given ‐ no premedication given: first intubation attempt success rate (outcome achieved at time of intubation attempt and not followed up) | 519 per 1000 | 610 per 1000 | RR 1.18 | 156 | ⊕⊕⊕⊝a,b | Unblinded trial with no blinded outcome assessment Single study |
| Timing of intubation ‐ just after birth in the delivery room: first intubation attempt success rate (outcome achieved at time of intubation attempt and not followed up) | 540 per 1000 | 528 per 1000 | RR 0.98 | 146 | ⊕⊕⊕⊝a,b | Unblinded trial with no blinded outcome assessment Single study |
| Timing of intubation ‐ following admission to NICU: first intubation attempt success rate (outcome achieved at time of intubation attempt and not followed up) | 519 per 1000 | 610 per 1000 | RR 1.18 | 156 | ⊕⊕⊕⊝a,b | Unblinded trial with no blinded outcome assessment Single study |
| Type of stylet | no data | no data | no data | no data | absence of evidence | |
| Weight < 1000 g (outcome achieved at time of intubation attempt and not followed up) | 597 per 1000 | 533 per 1000 | RR 0.89 | 152 | ⊕⊕⊕⊝a,b | Unblinded trial with no blinded outcome assessment Single study |
| *The basis for the assumed risk (e.g. median control group risk across studies) is provided in footnotes. The corresponding risk (and its 95% confidence interval) is based on assumed risk in the comparison group and relative effect of the intervention (and its 95% CI) | ||||||
| GRADE Working Group grades of evidence | ||||||
| aHigh risk of detection bias (due to lack of blinding of caregivers and outcome assessors) bSerious imprecision (due to small number of events and small sample sizes; 95% CIs include null effects) | ||||||
| Outcome or subgroup title | No. of studies | No. of participants | Statistical method | Effect size |
| 1 First intubation attempt success rate Show forest plot | 1 | 302 | Risk Ratio (M‐H, Fixed, 95% CI) | 1.08 [0.88, 1.32] |
| Outcome or subgroup title | No. of studies | No. of participants | Statistical method | Effect size |
| 1 Fellow: first intubation attempt success rate Show forest plot | 1 | 74 | Risk Ratio (M‐H, Fixed, 95% CI) | 0.94 [0.69, 1.29] |
| 2 Resident: first intubation attempt success rate Show forest plot | 1 | 228 | Risk Ratio (M‐H, Fixed, 95% CI) | 1.17 [0.90, 1.52] |
| Outcome or subgroup title | No. of studies | No. of participants | Statistical method | Effect size |
| 1 Intubations without premedication given to the infant Show forest plot | 1 | 146 | Risk Ratio (M‐H, Fixed, 95% CI) | 0.98 [0.72, 1.32] |
| 2 Intubations following premedication given to the infant Show forest plot | 1 | 156 | Risk Ratio (M‐H, Fixed, 95% CI) | 1.18 [0.89, 1.55] |
| Outcome or subgroup title | No. of studies | No. of participants | Statistical method | Effect size |
| 1 Intubations just after birth in the delivery room: first intubation attempt success rate Show forest plot | 1 | 146 | Risk Ratio (M‐H, Fixed, 95% CI) | 0.98 [0.72, 1.32] |
| 2 intubations following admission to NICU: first intubation attempt success rate Show forest plot | 1 | 156 | Risk Ratio (M‐H, Fixed, 95% CI) | 1.18 [0.89, 1.55] |
| Outcome or subgroup title | No. of studies | No. of participants | Statistical method | Effect size |
| 1 Weight < 1000 grams Show forest plot | 1 | 152 | Risk Ratio (M‐H, Fixed, 95% CI) | 0.89 [0.67, 1.18] |
| 2 Weight ≥ 1000 grams Show forest plot | 1 | 150 | Risk Ratio (M‐H, Fixed, 95% CI) | 1.32 [0.97, 1.79] |