| Stylet compared with no stylet for neonatal intubation |
| Patient or population: neonates requiring endotracheal intubation Settings: neonatal intensive care unit or delivery room or theatre Intervention: a stylet inserted into the endotracheal tube Comparison: no stylet inserted into the endotracheal tube |
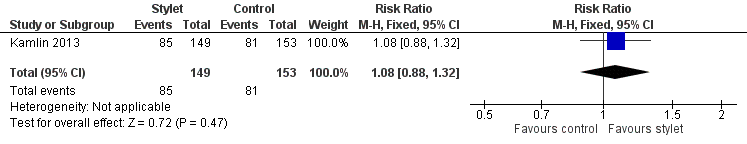
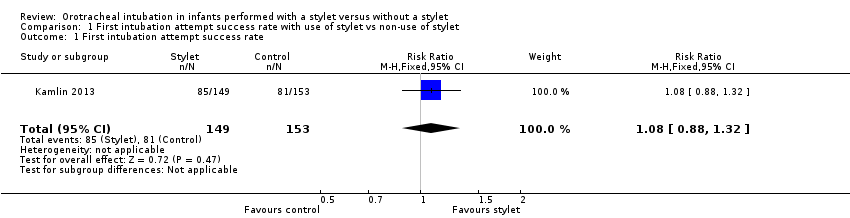
| First intubation attempt success rate (outcome achieved at time of intubation attempt and not followed up) | 529 per 1000 | 570 per 1000
(466 to 698) | RR 1.08
(0.88 to 1.32) | 302
(1) | ⊕⊕⊕⊝a,b
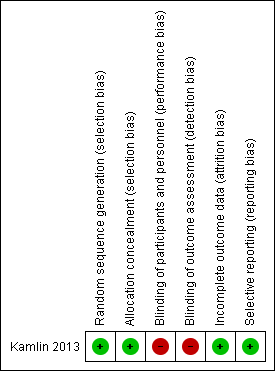
low | Unblinded trial with no blinded outcome assessment Single study |
| Gestational age of the infant | no data | no data | no data | no data | absence of evidence | |
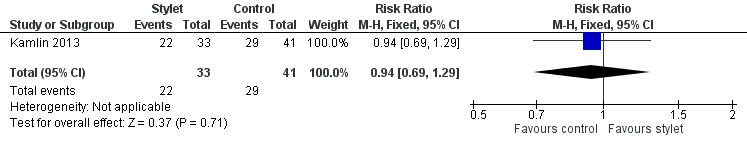
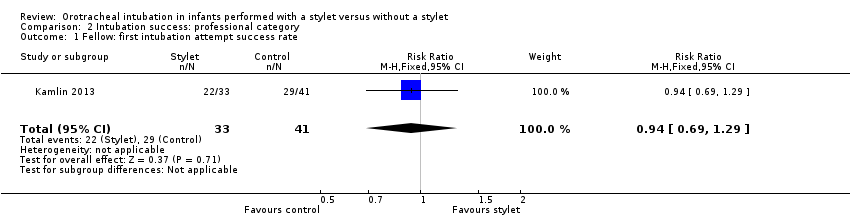
| Professional category of the intubator ‐ fellow: first intubation attempt success rate (outcome achieved at time of intubation attempt and not followed up) | 707 per 1000 | 667 per 1000
(488 to 548) | RR 0.94
(0.69 to 1.29) | 74
(1) | ⊕⊕⊝⊝a,b
low | Unblinded trial with no blinded outcome assessment Single study |
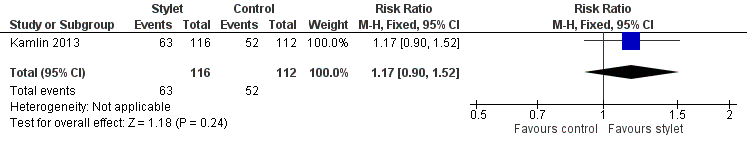
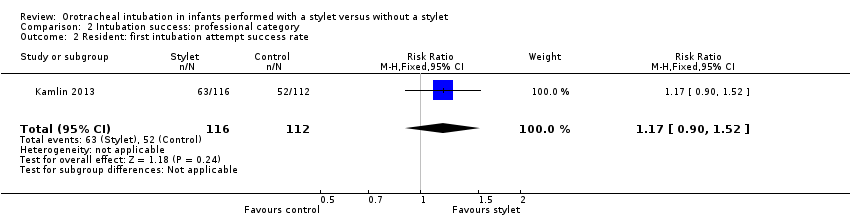
| Professional category of the intubator ‐ resident: first intubation attempt success rate (outcome achieved at time of intubation attempt and not followed up) | 464 per 1000 | 543 per 1000
(418 to 705) | RR 1.17
(0.90 to 1.52) | 228
(1) | ⊕⊕⊕⊝a,b
low | Unblinded trial with no blinded outcome assessment Single study |
| Level of experience of the intubator | no data | no data | no data | no data | absence of evidence | |
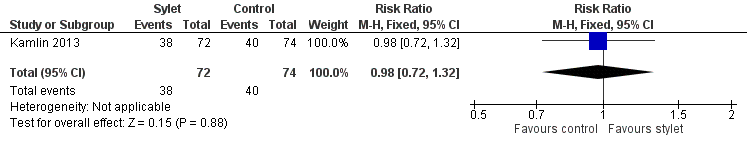
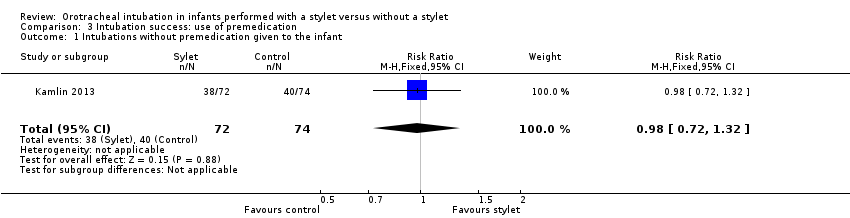
| Premedication given ‐ no premedication given: first intubation attempt success rate (outcome achieved at time of intubation attempt and not followed up) | 540 per 1000 | 528 per 1000
(389 to 713) | RR 0.98
(0.72 to 1.32) | 146
(1) | ⊕⊕⊕⊝a,b
low | Unblinded trial with no blinded outcome assessment Single study |
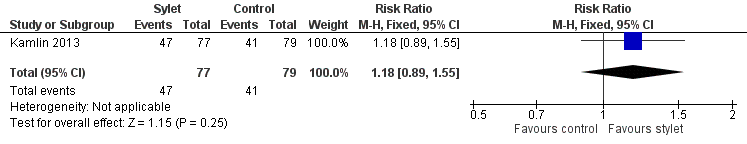
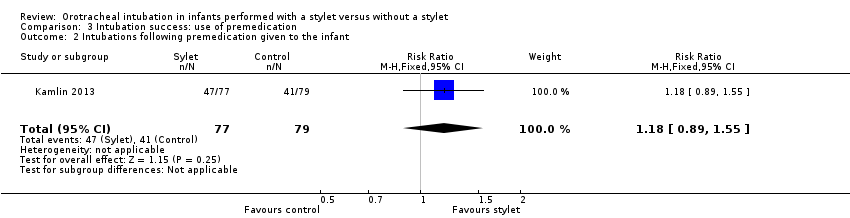
| Premedication given ‐ no premedication given: first intubation attempt success rate (outcome achieved at time of intubation attempt and not followed up) | 519 per 1000 | 610 per 1000
(462 to 804) | RR 1.18
(0.89 to 1.55) | 156
(1) | ⊕⊕⊕⊝a,b
low | Unblinded trial with no blinded outcome assessment Single study |
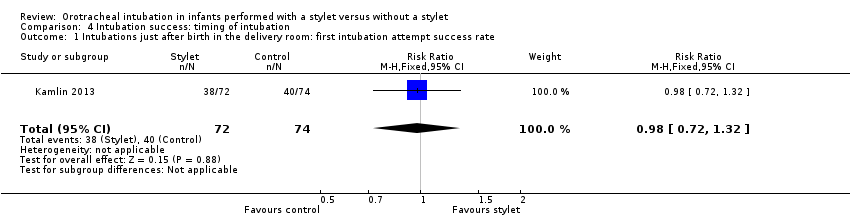
| Timing of intubation ‐ just after birth in the delivery room: first intubation attempt success rate (outcome achieved at time of intubation attempt and not followed up) | 540 per 1000 | 528 per 1000
(389 to 713) | RR 0.98
(0.72 to 1.32) | 146
(1) | ⊕⊕⊕⊝a,b
low | Unblinded trial with no blinded outcome assessment Single study |
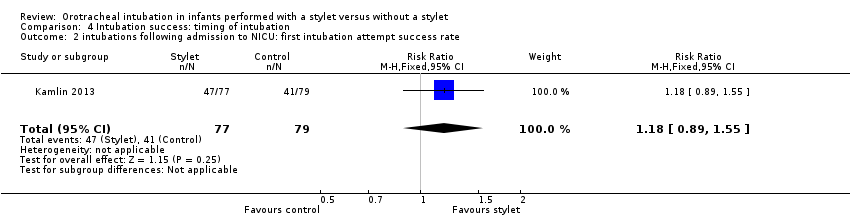
| Timing of intubation ‐ following admission to NICU: first intubation attempt success rate (outcome achieved at time of intubation attempt and not followed up) | 519 per 1000 | 610 per 1000
(462 to 804) | RR 1.18
(0.89 to 1.55) | 156
(1) | ⊕⊕⊕⊝a,b
low | Unblinded trial with no blinded outcome assessment Single study |
| Type of stylet | no data | no data | no data | no data | absence of evidence | |
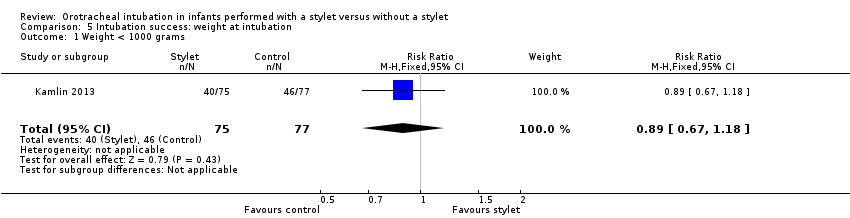
| Weight < 1000 g (outcome achieved at time of intubation attempt and not followed up) | 597 per 1000 | 533 per 1000
(400 to 704) | RR 0.89
(0.67 to 1.18) | 152
(1) | ⊕⊕⊕⊝a,b
low | Unblinded trial with no blinded outcome assessment Single study |
| *The basis for the assumed risk (e.g. median control group risk across studies) is provided in footnotes. The corresponding risk (and its 95% confidence interval) is based on assumed risk in the comparison group and relative effect of the intervention (and its 95% CI)
CI: confidence interval; RR: risk ratio |
| GRADE Working Group grades of evidence
High quality: Further research is very unlikely to change our confidence in the estimate of effect
Moderate quality: Further research is likely to have an important impact on our confidence in the estimate of effect and may change the estimate
Low quality: Further research is very likely to have an important impact on our confidence in the estimate of effect and is likely to change the estimate
Very low quality: We are very uncertain about the estimate |