Scolaris Content Display Scolaris Content Display

Study flow diagram.
Figuras y tablas -
Figure 1

Study flow diagram.

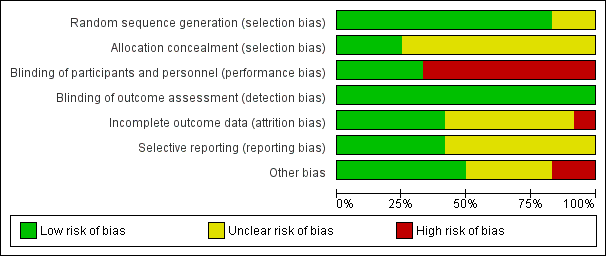
Risk of bias graph: review authors' judgements about each risk of bias item presented as percentages across all included studies.
Figuras y tablas -
Figure 2

Risk of bias graph: review authors' judgements about each risk of bias item presented as percentages across all included studies.

Risk of bias summary: review authors' judgements about each risk of bias item for each included study.
Figuras y tablas -
Figure 3

Risk of bias summary: review authors' judgements about each risk of bias item for each included study.

Forest plot of comparison: 1 Intrauterine human chorionic gonadotropin (hCG) versus no hCG, outcome: 1.1 Live birth.
Figuras y tablas -
Figure 4

Forest plot of comparison: 1 Intrauterine human chorionic gonadotropin (hCG) versus no hCG, outcome: 1.1 Live birth.

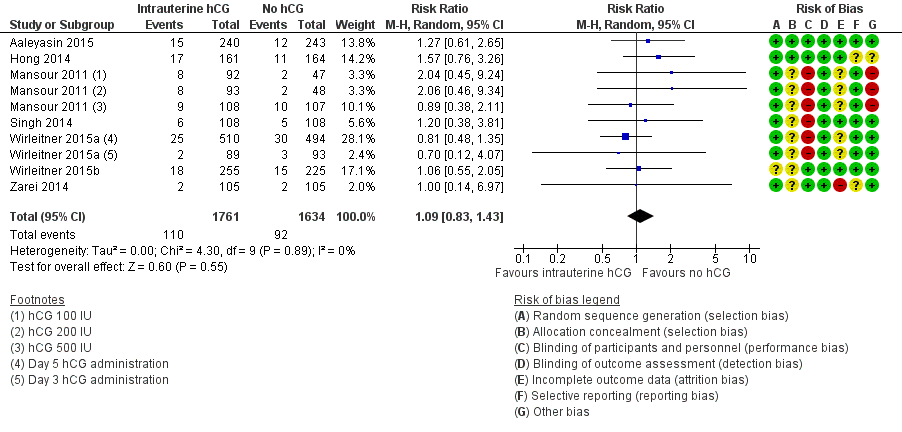
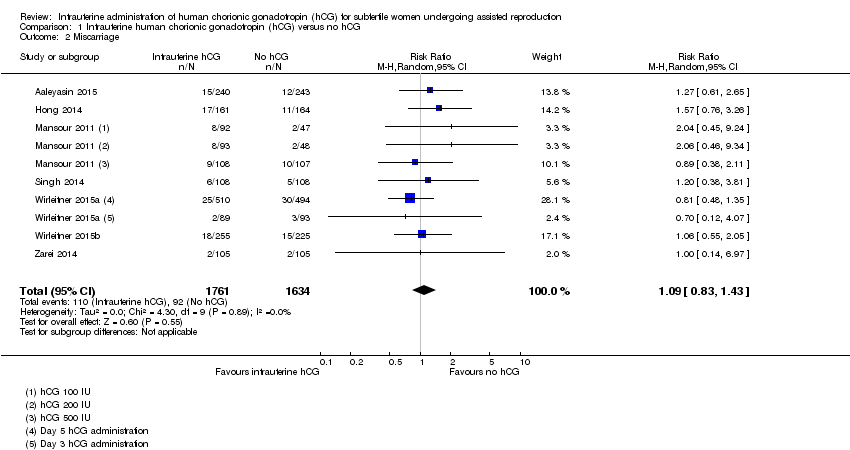
Forest plot of comparison: 1 Intrauterine human chorionic gonadotropin (hCG) versus no hCG, outcome: 1.2 Miscarriage.
Figuras y tablas -
Figure 5

Forest plot of comparison: 1 Intrauterine human chorionic gonadotropin (hCG) versus no hCG, outcome: 1.2 Miscarriage.

Forest plot of comparison: 1 Intrauterine human chorionic gonadotropin (hCG) versus no hCG, outcome: 1.4 Clinical pregnancy.
Figuras y tablas -
Figure 6

Forest plot of comparison: 1 Intrauterine human chorionic gonadotropin (hCG) versus no hCG, outcome: 1.4 Clinical pregnancy.

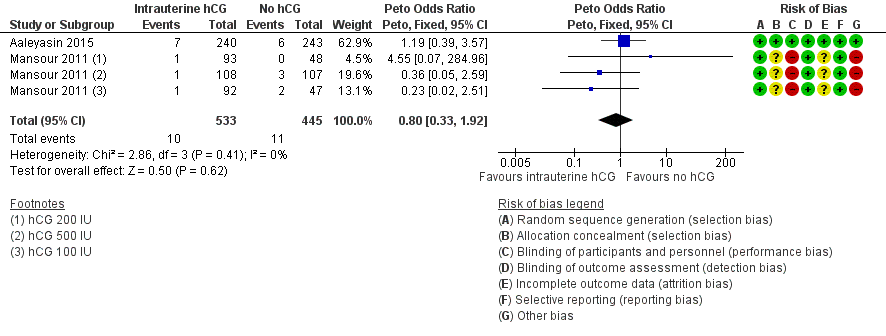
Forest plot of comparison: 1 Intrauterine human chorionic gonadotropin (hCG) versus no hCG, outcome: 1.5 Complications: intrauterine death.
Figuras y tablas -
Figure 7

Forest plot of comparison: 1 Intrauterine human chorionic gonadotropin (hCG) versus no hCG, outcome: 1.5 Complications: intrauterine death.

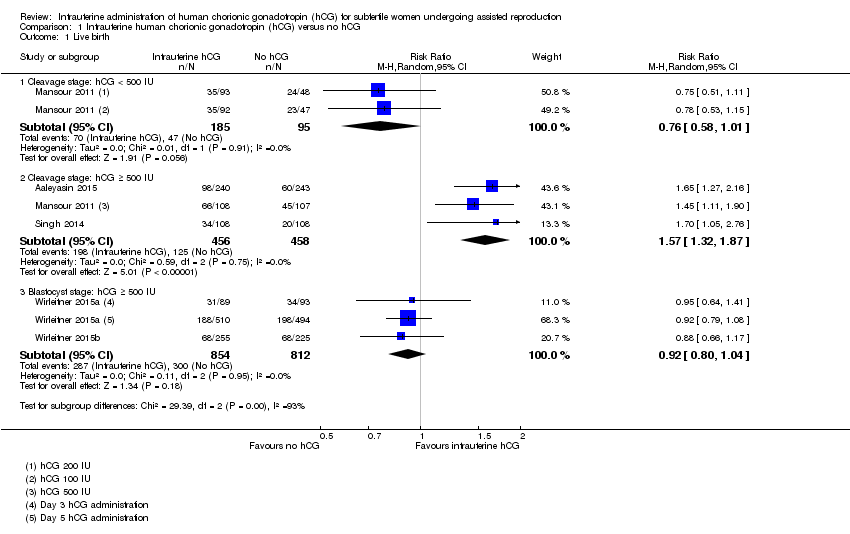
Comparison 1 Intrauterine human chorionic gonadotropin (hCG) versus no hCG, Outcome 1 Live birth.
Figuras y tablas -
Analysis 1.1

Comparison 1 Intrauterine human chorionic gonadotropin (hCG) versus no hCG, Outcome 1 Live birth.

Comparison 1 Intrauterine human chorionic gonadotropin (hCG) versus no hCG, Outcome 2 Miscarriage.
Figuras y tablas -
Analysis 1.2

Comparison 1 Intrauterine human chorionic gonadotropin (hCG) versus no hCG, Outcome 2 Miscarriage.

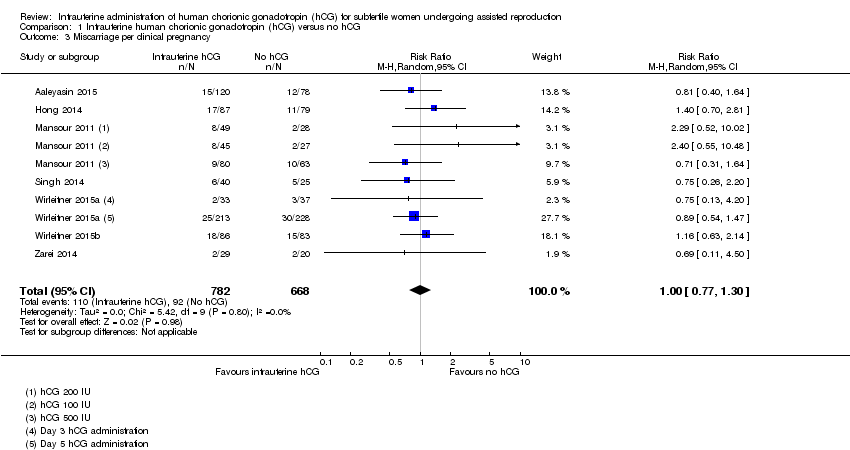
Comparison 1 Intrauterine human chorionic gonadotropin (hCG) versus no hCG, Outcome 3 Miscarriage per clinical pregnancy.
Figuras y tablas -
Analysis 1.3

Comparison 1 Intrauterine human chorionic gonadotropin (hCG) versus no hCG, Outcome 3 Miscarriage per clinical pregnancy.

Comparison 1 Intrauterine human chorionic gonadotropin (hCG) versus no hCG, Outcome 4 Clinical pregnancy.
Figuras y tablas -
Analysis 1.4

Comparison 1 Intrauterine human chorionic gonadotropin (hCG) versus no hCG, Outcome 4 Clinical pregnancy.

Comparison 1 Intrauterine human chorionic gonadotropin (hCG) versus no hCG, Outcome 5 Complications: intrauterine death.
Figuras y tablas -
Analysis 1.5

Comparison 1 Intrauterine human chorionic gonadotropin (hCG) versus no hCG, Outcome 5 Complications: intrauterine death.

Summary of findings for the main comparison. Intrauterine administration of hCG for women undergoing assisted reproduction

Intrauterine administration of hCG for women undergoing assisted reproduction

Population: women undergoing assisted reproduction
Settings: assisted reproduction units
Intervention: intrauterine administration of hCG

Outcomes

Illustrative comparative risks* (95% CI)

Relative effect
(95% CI)

No of participants
(studies)

Quality of the evidence
(GRADE)

Assumed risk

Corresponding risk

Control

Intrauterine administration of hCG

Live birth ‐ cleavage stage: hCG < 500 IU
RR
Follow‐up: mean 40 weeks

495 per 1000

376 per 1000
(287 to 500)

RR 0.76
(0.58 to 1.01)

280
(1 study)

⊕⊝⊝⊝
very low1,2

Live birth ‐ cleavage stage: hCG ≥ 500 IU
RR
Follow‐up: mean 40 weeks

247 per 1000

388 per 1000
(326 to 462)

RR 1.57
(1.32 to 1.87)

914
(3 studies)

⊕⊕⊕⊝
moderate3

Live birth ‐ blastocyst stage: hCG ≥ 500 IU
RR
Follow‐up: mean 40 weeks

366 per 1000

337 per 1000
(293 to 381)

RR 0.92
(0.80 to 1.04)

1666
(2 studies)

⊕⊕⊕⊝
moderate3

Pregnancy ‐ cleavage stage: hCG < 500 IU
RR
Follow‐up: mean 12 weeks

579 per 1000

509 per 1000

(405 to 637)

RR 0.88

(0.70 to 1.10)

280
(1 study)

⊕⊝⊝⊝
very low2,3,4

Pregnancy ‐ cleavage stage: hCG ≥ 500 IU
RR
Follow‐up: mean 12 weeks

321 per 1000

453 per 1000

(401 to 507)

RR 1.41

(1.25 to 1.58)

1414

(7 studies)

⊕⊕⊕⊝
moderate3

Pregnancy ‐ blastocyst stage: hCG ≥ 500 IU
RR
Follow‐up: mean 12 weeks

430 per 1000

408 per 1000

(370 to 455)

RR 0.95

(0.86 to 1.06)

1991

(3 studies)

⊕⊕⊕⊝
moderate3

Miscarriage

Follow‐up: mean 40 weeks

48 per 1000

52 per 1000

(40 to 68)

RR 1.09

(0.83 to 1.43)

3395

(7 studies)

⊕⊝⊝⊝
very low2,3,4

Other complications

Other complications reported in the included studies were ectopic pregnancy (3 studies, n = 915, 3 events overall), heterotopic pregnancy (1 study, n = 495, 1 event), intrauterine death (2 studies, n = 978, 21 events) and triplets (1 study, n = 48, 3 events). There were too few events to allow any conclusions to be drawn

⊕⊝⊝⊝
very low2,3,4

*The basis for the assumed risk is the median control group risk across studies. The corresponding risk (and its 95% confidence interval) is based on the assumed risk in the comparison group and the relative effect of the intervention (and its 95% CI).
CI: confidence interval; hCG: human chorionic gonadotropin; IU: international units; RR: risk ratio

GRADE Working Group grades of evidence
High quality: Further research is very unlikely to change our confidence in the estimate of effect.
Moderate quality: Further research is likely to have an important impact on our confidence in the estimate of effect and may change the estimate.
Low quality: Further research is very likely to have an important impact on our confidence in the estimate of effect and is likely to change the estimate.
Very low quality: We are very uncertain about the estimate.

1 Downgraded two levels due to very serious risk of bias: lack of blinding of participants and personnel, no clear description of allocation concealment and premature termination of the study following interim analysis.
2 Downgraded one level due to imprecision: total number of events was fewer than 300.
3 Downgraded one level due to serious risk of bias: lack of blinding of participants and personnel, no allocation concealment.
4 Downgraded two levels due to very serious imprecision: total number of events was fewer than 300 and 95% confidence interval around the pooled effect includes both no effect and appreciable benefit or appreciable harm.

Figuras y tablas -
Summary of findings for the main comparison. Intrauterine administration of hCG for women undergoing assisted reproduction
Comparison 1. Intrauterine human chorionic gonadotropin (hCG) versus no hCG

Outcome or subgroup title

No. of studies

No. of participants

Statistical method

Effect size

1 Live birth Show forest plot

5

Risk Ratio (M‐H, Random, 95% CI)

Subtotals only

1.1 Cleavage stage: hCG < 500 IU

1

280

Risk Ratio (M‐H, Random, 95% CI)

0.76 [0.58, 1.01]

1.2 Cleavage stage: hCG ≥ 500 IU

3

914

Risk Ratio (M‐H, Random, 95% CI)

1.57 [1.32, 1.87]

1.3 Blastocyst stage: hCG ≥ 500 IU

2

1666

Risk Ratio (M‐H, Random, 95% CI)

0.92 [0.80, 1.04]

2 Miscarriage Show forest plot

7

3395

Risk Ratio (M‐H, Random, 95% CI)

1.09 [0.83, 1.43]

3 Miscarriage per clinical pregnancy Show forest plot

7

1450

Risk Ratio (M‐H, Random, 95% CI)

1.00 [0.77, 1.30]

4 Clinical pregnancy Show forest plot

10

Risk Ratio (M‐H, Random, 95% CI)

Subtotals only

4.1 Cleavage stage: hCG < 500 IU

1

280

Risk Ratio (M‐H, Random, 95% CI)

0.88 [0.70, 1.10]

4.2 Cleavage stage: hCG ≥ 500 IU

7

1414

Risk Ratio (M‐H, Random, 95% CI)

1.41 [1.25, 1.58]

4.3 Blastocyst stage: hCG ≥ 500 IU

3

1991

Risk Ratio (M‐H, Random, 95% CI)

0.95 [0.86, 1.06]

5 Complications: intrauterine death Show forest plot

2

978

Peto Odds Ratio (Peto, Fixed, 95% CI)

0.80 [0.33, 1.92]

Figuras y tablas -
Comparison 1. Intrauterine human chorionic gonadotropin (hCG) versus no hCG