Fármacos orales como el citrato de clomifeno o los inhibidores de la aromatasa con gonadotrofinas para la estimulación ovárica controlada en pacientes sometidas a fecundación in vitro
Resumen
Antecedentes
Las gonadotrofinas son los medicamentos utilizados con mayor frecuencia para la estimulación ovárica controlada en la fecundación in vitro (FIV). Sin embargo, son costosas, invasivas y se asocian con el riesgo desarrollar el síndrome de hiperestimulación ovárica (SHEO). Los pedidos recientes de regímenes menos molestos para las pacientes han aumentado el interés en la administración de citrato de clomifeno (CC) y de inhibidores de la aromatasa con o sin gonadotrofinas para reducir la carga de las inyecciones hormonales. Se desconoce en la actualidad si los regímenes que usan CC o inhibidores de la aromatasa como el letrozol (Ltz) son tan efectivos como las gonadotrofinas solas.
Objetivos
Determinar la efectividad y la seguridad de los regímenes con medicamentos de inducción oral (como el citrato de clomifeno o el letrozol) versus regímenes de gonadotrofinas solas para la estimulación ovárica controlada en la FIV o la inyección intracitoplasmática de espermatozoides (ICSI, por sus siglas en inglés).
Métodos de búsqueda
Se hicieron búsquedas en las siguientes bases de datos: registro especializado del Grupo Cochrane de Ginecología y Fertilidad (Cochrane Gynaecology and Fertility Group Specialised Register) (búsqueda enero 2017), Registro Cochrane Central de Ensayos Controlados (Cochrane Central Register of Controlled Trials) (CENTRAL CRSO), MEDLINE (1946 hasta enero 2017), Embase (1980 hasta enero 2017), y en listas de referencias de artículos relevantes. También se hicieron búsquedas en registros de ensayos ClinicalTrials.gov (clinicaltrials.gov/) y en la World Health Organization International Clinical Trials Registry Platform (www.who.int/trialsearch/Default.aspx). Se hicieron búsquedas manuales en las actas de congresos relevantes.
Criterios de selección
Se incluyeron ensayos controlados aleatorios (ECA). Los resultados primarios fueron la tasa de nacidos vivos (TNV) y el SHEO.
Obtención y análisis de los datos
Tres autores de la revisión evaluaron de forma independiente la elegibilidad y el riesgo de sesgo de los ensayos. Se calcularon los cocientes de riesgos (CR) y el odds ratio (OR) de Peto con intervalos de confianza del 95% (IC) para los resultados dicotómicos, y las diferencias de medias (DM) para los resultados continuos. Se analizó a la población general de pacientes sometidas a tratamiento de FIV y (como otro análisis) las pacientes identificadas como bajas respondedoras. La calidad general de la evidencia se evaluó mediante el enfoque GRADE.
Resultados principales
En esta revisión actualizada se incluyeron 27 estudios. La mayoría de los ensayos nuevos de la revisión actualizada incluían a bajas respondedoras y evaluaron protocolos de Ltz. Se pudo realizar el metanálisis con datos de 22 estudios incluidos y un total de 3599 participantes. La calidad de la evidencia para diferentes comparaciones varió de baja a moderada. Las limitaciones principales en la calidad de la evidencia fueron: el riesgo de sesgo, asociado con el informe deficiente de los métodos de estudio, y la imprecisión.
En la población general de pacientes sometidas a FIV, no está claro si el uso de CC o el Ltz con o sin gonadotrofinas en comparación con el uso de gonadotrofinas con agonistas o antagonistas de la hormona liberadora de gonadotrofina (GnRH) dio lugar a una diferencia en la tasa de nacidos vivos (CR 0,92; IC del 95%: 0,66 a 1,27; cuatro ECA, n = 493; I2= 0%, evidencia de baja calidad) o de embarazo clínico (CR 1,00; IC del 95%: 0,86 a 1,16; 12 ECA; n = 1998, I2 = 3%, evidencia de calidad moderada). Estos datos significan que para un consultorio típico con una TNV del 23% que utiliza un régimen con agonista de GnRH, se esperaría que el cambio a los protocolos de CC o Ltz dé lugar a TNV de entre el 15% y el 30%. Los protocolos de citrato de clomifeno o Ltz se asociaron con una reducción de la incidencia de SHEO (OR de Peto 0,21; IC del 95%: 0,11 a 0,41; 5 ECA, n = 1067, I2 = 0%, evidencia de baja calidad). Estos datos significan que para un consultorio típico con una prevalencia del SHEO del 6% y un régimen con agonista GnRH, se esperaría que el cambio a los protocolos de CC o Ltz reduzca la incidencia entre el 0,5% y el 2,5%. Se halló evidencia de un aumento de la tasa de interrupción del ciclo con el protocolo de CC en comparación con las gonadotrofinas en los protocolos de GnRH (CR 1,87; IC del 95%: 1,43 a 2,45; 9 ECA, n = 1784, I2 = 61%, ‐evidencia de baja calidad). Había evidencia de calidad moderada de una disminución en el número medio de ampollas usadas y en el número medio de ovocitos recuperados con CC con o sin gonadotrofinas en comparación con las gonadotrofinas en los protocolos de agonistas de GnRH, aunque los datos fueron demasiado heterogéneos como para ser agrupados.
De manera similar, en la población de bajas respondedoras, no está claro si hubo diferencias en las tasas de nacidos vivos (CR 1,16; IC del 95%: 0,49 a 2,79; dos ECA, n = 357; I2= 38%, evidencia de baja calidad) o embarazo clínico (CR 0,85; IC del 95%: 0,64 a 1,12; ocho ECA, n = 1462; I2= 0%, evidencia de baja calidad) después del protocolo de CC o Ltz con o sin gonadotrofina versus gonadotrofina y GnRH. Lo anterior significa que para un consultorio típico con una TNV de 5% en las bajas respondedoras y el uso de un protocolo de GnRH, se esperaría que el cambio a los protocolos de CC o Ltz resulte en TNV de entre 2% y 14%. Había evidencia de baja calidad de que los protocolos de CC o Ltz se asociaron con un aumento de la tasa de interrupción del ciclo (CR 1,46; IC del 95%: 1,18 a 1,81; diez ECA, n = 1601; I2= 64%) y evidencia de calidad moderada de una disminución en el número medio de ampollas de gonadotrofina usadas y el número medio de ovocitos recuperados, aunque los datos fueron demasiado heterogéneos como para ser agrupados. Los efectos adversos de estos protocolos se informaron de manera deficiente. Además, faltan datos sobre las anomalías fetales después del uso de protocolos de CC o Ltz.
Conclusiones de los autores
No se halló evidencia definitiva que indicara diferencias entre el citrato de clomifeno o el letrozol con o sin gonadotrofinas y las gonadotrofinas en los protocolos de agonistas o antagonistas de la GnRH en lo que se refiere a los efectos sobre las tasas de nacidos vivos o embarazo, tanto en la población general de pacientes sometidas a tratamiento de FIV como en las pacientes que fueron bajas respondedoras. El uso de clomifeno o letrozol resultó en una reducción de la cantidad de gonadotrofinas requerida y la incidencia de SHEO. Sin embargo, la administración de citrato de clomifeno o letrozol puede asociarse con un aumento significativo de la incidencia de interrupción del ciclo, así como una reducción en el número medio de ovocitos recuperados tanto en la población general de FIV como en las bajas respondedoras. Se necesitan ensayos aleatorios más amplios y de alta calidad para establecer una conclusión firme antes de que sean adoptados en la práctica clínica habitual.
PICO
Resumen en términos sencillos
Uso de citrato de clomifeno o letrozol en el tratamiento de fecundación in vitro
Pregunta de la revisión
El objetivo de esta revisión era comparar el tratamiento con el citrato de clomifeno (CC) o letrozol (Ltz) versus las gonadotrofinas solas para la estimulación de los ovarios durante el tratamiento de fecundación in vitro (FIV).
Antecedentes
Las inyecciones de gonadotrofina se usan comúnmente en el tratamiento de la FIV con objeto de estimular los ovarios para que aumenten el número de óvulos disponibles, que luego pueden combinarse con espermatozoides en el laboratorio para crear embriones que se transfieren al útero. Sin embargo, estas inyecciones son costosas, incómodas y se asocian con efectos secundarios. Los pedidos de regímenes de estimulación menos molestos para las pacientes han llevado al uso de comprimidos de clomifeno o letrozol en lugar de las inyecciones, pero no está claro si se asocian con tasas similares de embarazo.
Características de los estudios
Se incluyeron 27 estudios, de los cuales 22 con un total de 3599 participantes tenían datos apropiados para el análisis. Se estudió por separado a la población general de FIV y a las pacientes con menos óvulos (bajas respondedoras) durante la FIV. Ésta es una actualización de una revisión Cochrane anterior, publicada por primera vez en 2012. La evidencia está actualizada hasta el 10 enero de 2017.
Resultados clave
No hubo evidencia clara de una diferencia en las tasas de nacidos vivos o embarazo en los grupos de la población general de FIV. La evidencia de baja calidad indica que para un consultorio típico con una tasa de nacidos vivos (TNV) del 23% que usa la inyección de gonadotrofina sola, se esperaría que el cambio al régimen de CC o Ltz dé lugar a TNV de entre el 15% y el 30%.
El riesgo del síndrome de hiperestimulación ovárica (SHEO) fue inferior con el uso de CC o Ltz en comparación con las gonadotrofinas solas. La evidencia de baja calidad indica que para un consultorio típico con una prevalencia de SHEO asociado con la inyección de gonadotrofina del 6%, se esperaría que el cambio a un régimen de CC o Ltz reduzca la incidencia en 0,5% a 2,5%.
Entre las pacientes designadas como bajas respondedoras, no hubo evidencia clara de una diferencia entre los grupos con respecto a las tasas de nacidos vivos o embarazo. La evidencia de baja calidad indica que para un consultorio típico con una TNV del 5% en bajas respondedoras y el uso de la inyección de gonadotrofina sola, se esperaría que el cambio al régimen de CC o Ltz dé lugar a TNV de entre el 2% y el 14%. Los efectos secundarios de estos fármacos y los datos sobre anomalías fetales después de los protocolos de CC o Ltz se informaron de manera deficiente.
Calidad de la evidencia
La calidad de la evidencia para las diferentes comparaciones varió de baja a moderada. Las principales limitaciones fueron el riesgo de sesgo asociado con el informe deficiente de los métodos de estudio y la imprecisión.
Authors' conclusions
Summary of findings
| Clomiphene citrate or letrozole with or without gonadotropins (with or without midcycle antagonist) compared to gonadotropins (with GnRH agonists or midcycle antagonist) in IVF and ICSI cycles in general population for controlled ovarian stimulation | ||||||
| Patient or population: Women undergoing controlled ovarian stimulation in IVF and ICSI cycles (general population) | ||||||
| Outcomes | Anticipated absolute effects* (95% CI) | Relative effect | № of participants | Quality of the evidence | Comments | |
| Risk with gonadotropins (with GnRH agonists or midcycle antagonist) | Risk with clomiphene citrate or letrozole with or without gonadotropins (with or without midcycle antagonist) | |||||
| Live birth per woman | 235 per 1000 | 216 per 1000 | RR 0.92 | 493 | ⊕⊕⊝⊝ | |
| Ovarian hyperstimulation syndrome per woman | 63 per 1000 | 14 per 1000 | Peto OR 0.21 | 1067 | ⊕⊕⊝⊝ | |
| Clinical pregnancy rate per woman | 248 per 1000 | 248 per 1000 | RR 1.00 | 1998 | ⊕⊕⊕⊝ | |
| Cancellation rate per woman | 80 per 1000 | 150 per 1000 | RR 1.87 | 1784 | ⊕⊕⊝⊝ | |
| Mean number of gonadotropin ampoules used per woman | The mean number of ampoules used in the control group ranged from 18 to 50. | In all studies CC plus gonadotropins was associated with use of fewer ampoules. The mean difference ranged from 5.6 to 24.6 ampoules | ‐ | 1098 | ⊕⊕⊕⊝ | |
| Mean number of oocytes retrieved per woman | The mean number of oocytes retrieved in the control group ranged from 5 to 17. | In seven studies CC plus gonadotropins was associated with retrieval of fewer oocytes, with the mean difference ranging from 1.02 to 6.20 oocytes. The difference was statistically significant in five of these studies. The eighth study found no evidence of a difference between the groups | ‐ | 1481 | ⊕⊕⊕⊝ | |
| *The risk in the intervention group (and its 95% confidence interval) is based on the mean risk in the comparison group and the relative effect of the intervention (and its 95% CI). | ||||||
| GRADE Working Group grades of evidence | ||||||
| 1Downgraded one level (serious risk of bias). All included studies had unclear risk of bias for allocation concealment. | ||||||
| Clomiphene citrate or letrozole with or without gonadotropins (with or without midcycle antagonist) compared to gonadotropins (with GnRH agonist or midcycle antagonist) in IVF and ICSI cycles in poor responders for controlled ovarian stimulation | ||||||
| Patient or population: Women undergoing controlled ovarian stimulation in IVF and ICSI cycles (poor responders) | ||||||
| Outcomes | Anticipated absolute effects* (95% CI) | Relative effect | № of participants | Quality of the evidence | Comments | |
| Risk with gonadotropins (with GnRH agonist or midcycle antagonist) | Risk with clomiphene citrate or letrozole with or without gonadotropins (with or without midcycle antagonist) | |||||
| Live birth per woman | 49 per 1000 | 57 per 1000 | RR 1.16 | 357 | ⊕⊕⊝⊝ | |
| Clinical pregnancy rate per woman | 128 per 1000 | 109 per 1000 | RR 0.85 | 1462 | ⊕⊕⊝⊝ | |
| Cancellation rate per woman | 145 per 1000 | 212 per 1000 | RR 1.46 | 1601 | ⊕⊕⊝⊝ | |
| Mean number of gonadotropin ampoules used per woman | The mean number of ampoules used in the control group ranged from 39 to 71. | There were fewer ampoules used in the intervention groups (CC plus gonadotropins: MD ‐23.98, 95% CI ‐27.41 to ‐20.56; participants = 87; studies = 2); letrozole plus gonadotropins: MD ‐46.24, 95% CI ‐50.93 to ‐41.55; participants = 49; studies = 1). | ‐ | 136 | ⊕⊕⊕⊝ | |
| Mean number of oocytes retrieved per woman | The mean number oocytes retrieved in the control group ranged from 2 to 5. | In three of four studies CC plus gonadotropins versus gonadotropins in an agonist protocol was associated with retrieval of fewer oocytes, with the mean difference ranging from 0.75 to 2.10 oocytes. The difference was statistically significant in two of these studies. One study found no evidence of difference between CC plus gonadotropin versus gonadotropin in an antagonist protocol. Of three studies comparing letrozole plus gonadotrophins, one study reported significantly lower oocyte retrieval while the other two studies found no clear evidence of a difference. | ‐ | 1203 | ⊕⊕⊕⊝ | |
| *The risk in the intervention group (and its 95% confidence interval) is based on the mean risk in the comparison group and the relative effect of the intervention (and its 95% CI). | ||||||
| GRADE Working Group grades of evidence | ||||||
| 1Downgraded one level (serious risk of bias). Many of the included studies had unclear risk of bias for allocation concealment. | ||||||
Background
Description of the condition
Controlled ovarian stimulation (COS) is an essential step in in vitro fertilisation (IVF) treatment (Arslan 2005). The goal of COS is to encourage the recruitment of a larger number of oocytes and hence maximise the number of dominant follicles that are available for retrieval (Strickler 1995). A number of different hormones, used within a variety of protocols, have been described for COS in IVF (Balasch 2001; Gregoriou 2008; Khalaf 2002; Kingsland 1992; Out 2000; Weigert 2002). Conventional regimens for ovarian stimulation are based on gonadotropins alone and are complex and expensive. In addition, they are associated with the risk of complications such as ovarian hyperstimulation syndrome and multiple pregnancies (Fauser 1999; Olivennes 1998; Verberg 2009).
Description of the intervention
Administered initially on its own (Trounson 1981), and then later in conjunction with gonadotropins (Lopata 1983; Quigley 1983), clomiphene citrate (CC) was the first drug to be used for COS in IVF (Marrs 1984). Concerns about anti‐oestrogenic side effects on the whole reproductive tract, Eden 1989, Kokko 1981, Nakamura 1997, Rogers 1991, Yagel 1992, and premature luteinising hormone surge with subsequent premature ovulation and luteinisation as well as poor follicular development, Abdalla 1990, Messinis 1985, have led to a search for alternative strategies. Aromatase inhibitors have emerged as an alternative to CC as an oral ovulation induction drug (Holzer 2006). The combining of the aromatase inhibitor letrozole (Ltz) with gonadotropin during COS has been suggested as a way to reduce the total gonadotropin requirement in IVF (Goswami 2004). Gonadotropin‐releasing hormone (GnRH) agonists were introduced into clinical practice for pituitary downregulation in order to achieve better control of ovarian stimulation and timing of ovulation (Porter 1984). Long protocol GnRH agonist pituitary downregulation followed by administration of gonadotropins became the norm. A number of reports suggested that its use resulted in improved follicular development, lower rates of cycle cancellation, and higher rates of fertilisation and implantation (Abdalla 1990; Macnamee 1989; Smitz 1987), as well as significantly better IVF outcomes (Hughes 1992). Later, GnRH antagonists were introduced for pituitary control. Most conventional stimulation regimens now use either GnRH agonists or antagonists along with gonadotropins. In recent years, the use of CC or Ltz along with gonadotropins has grown, particularly in women expected to respond poorly to controlled ovarian hyperstimulation (Goswami 2004; Lee 2012; Ragni 2012).
How the intervention might work
Clomiphene citrate has both oestrogenic and anti‐oestrogenic effects (Glasier 1989). It acts primarily by occupying the hypothalamic oestrogen receptors for a longer period than oestrogens (weeks versus hours) (Mikkelson 1986). Consequently, it increases the release of GnRH through a negative feedback mechanism, with an ultimate increase in follicle‐stimulating hormone and luteinising hormone (Dickey 1996). This increase in endogenous gonadotropin levels stimulates the ovaries and increases the number of follicles reaching ovulation (Kousta 1997). A selective aromatase inhibitor such as letrozole acts by preventing conversion of androgens to oestrogens in the ovary, thus releasing the hypothalamo‐pituitary axis from the negative feedback of oestrogen. This results in an increase in follicle‐stimulating hormone secretion, eventually leading to follicular development (Holzer 2006)
Why it is important to do this review
Calls for milder forms of ovarian stimulation in IVF have led to a revival of the use of CC (Edwards 1996). It has been suggested that the use of CC, alone or in combination with other drugs, is consistent with the concept of 'patient‐friendly IVF' (Engel 2002; Ingerslev 2001), as it is inexpensive, readily available, safe, and can be administered orally (Lehmann 1988; Quigley 1983; Ronen 1988). The concept of patient‐friendly IVF involves the use of natural cycle IVF, low‐dose gonadotropins, or oral ovulation induction medications such as CC or aromatase inhibitors alone or with gonadotropins (Fauser 1999; Ingerslev 2001). While the effects of adding GnRH agonists or antagonists to gonadotropins compared to gonadotropins alone have been examined in previous systematic reviews (Al‐Inany 2016; Hughes 1992), reports on the effectiveness of CC and gonadotropins compared to standard long or short protocols have demonstrated conflicting results (Dhont 1995; Grochowski 1999; Weigert 2002). Hence we decided to undertake this systematic review of randomized trials to investigate the effectiveness of oral ovulation induction medications along with gonadotropins versus gonadotropins alone (with GnRH agonists or antagonists) in controlled ovarian stimulation for IVF or intracytoplasmic sperm injection (ICSI) treatments.
Objectives
To determine the effectiveness and safety of regimens including oral induction medication (such as clomiphene citrate or letrozole) versus gonadotropin‐only regimens for controlled ovarian stimulation in IVF or ICSI treatment.
Methods
Criteria for considering studies for this review
Types of studies
We included parallel‐group randomized controlled trials (RCTs) if they compared oral ovarian stimulation agents, alone or in combination with gonadotropins, versus conventional gonadotropin (with GnRH agonist or antagonist) protocols in women undergoing IVF or ICSI. We excluded cross‐over trials and quasi‐randomised trials.
Types of participants
Women who were subfertile and undergoing fresh IVF or ICSI were eligible for inclusion.
Types of interventions
Interventions
-
Clomiphene citrate with or without gonadotropins
-
Aromatase inhibitors with or without gonadotropins
-
Other oral induction medications with or without gonadotropins
Control
-
Gonadotropins
Types of outcome measures
All outcome measures were expressed as per woman.
Primary outcomes
-
Live‐birth rate per woman randomized, defined as delivery of a live foetus after 20 completed weeks of gestation
-
Ovarian hyperstimulation syndrome (OHSS) for the general IVF population only
Secondary outcomes
-
Ongoing pregnancy rate, defined as evidence of a gestational sac with foetal heart motion at 12 weeks confirmed with ultrasound
-
Clinical pregnancy rate, defined as evidence of a gestational sac confirmed with ultrasound
-
Cycle cancellation rate
-
Mean number of ampoules of gonadotropin used
-
Mean number of oocytes retrieved
-
Multiple pregnancy rate
-
Rate of miscarriage, defined as foetal loss after confirmation of a gestational sac confirmed on ultrasound, and up to 20 completed weeks of gestation
-
Rate of ectopic pregnancies
-
Rate of foetal abnormalities
Search methods for identification of studies
We sought all published and unpublished RCTs comparing oral ovulation induction medications alone or in combination with gonadotropins versus conventional gonadotropin (with GnRH agonist or antagonist) protocols in women undergoing IVF or ICSI. We used the following search strategy without language restrictions and in consultation with the Cochrane Gynaecology and Fertility Group Information Specialist.
Electronic searches
We performed an updated search of the following electronic databases, trials registers, and websites ( from inception to 10 January 2017): Cochrane Gynaecology and Fertility Group Specialised Register (Appendix 1), Cochrane Central Register of Controlled Trials (CENTRAL CRSO) (Appendix 2), MEDLINE (Appendix 3), Embase (Appendix 4), PsycINFO (Appendix 5), and CINAHL (Cumulative Index to Nursing and Allied Health Literature) (Appendix 6). We combined the MEDLINE search with the Cochrane Highly Sensitive Search Strategy for identifying randomized trials, as described in Chapter 6 of the Cochrane Handbook for Systematic Reviews of Interventions (Lefebvre 2011). We combined the Embase search with trial filters developed by the Scottish Intercollegiate Guidelines Network (SIGN) (www.sign.ac.uk/search‐filters.html).
Other electronic sources of trials included registers for ongoing and registered trials: ClinicalTrials.gov, a service of the US National Institutes of Health (clinicaltrials.gov/) and the World Health Organization International Clinical Trials Registry Platform (www.who.int/trialsearch/Default.aspx) (Appendix 7); conference abstracts in the Clarivate analytics Web of Science (www.wokinfo.com); LILACS (Latin American and Caribbean Health Sciences Literature) database as a source of Portuguese and Spanish trials (lilacs.bvsalud.org/en/); PubMed (www.ncbi.nlm.nih.gov/pubmed/), where the random control filter for PubMed was taken from Chapter 6 of the Cochrane Handbook for Systematic Reviews of Interventions; and the OpenGrey database (www.opengrey.eu/) and Google for grey literature. We also searched PubMed and Google in order to find any published trials not yet indexed in the major databases .
Searching other resources
We handsearched the reference lists of articles retrieved by the search. Any relevant journals and conference abstracts that were not covered in the Cochrane Gynaecology and Fertility Group Specialised Register were handsearched in liaison with the Information Specialist.
Data collection and analysis
We conducted data collection and analysis in accordance with the Cochrane Handbook for Systematic Reviews of Interventions (Higgins 2011).
Selection of studies
Three review authors (AG, MSK, KY) scanned the titles and abstracts of articles retrieved by the updated search, removing those that were clearly irrelevant. We retrieved the full text of all potentially eligible studies. Three review authors (KY, AG, MSK) independently examined the full‐text articles for compliance with the inclusion criteria and selected those studies that were eligible for inclusion in the review. Where required we corresponded with study investigators to clarify study eligibility (e.g. with respect to participant eligibility criteria and allocation methods). Disagreements as to study eligibility were resolved by consensus or by discussion with a fourth review author (AM).
Data extraction and management
We entered study details into the 'Characteristics of included studies' table using Review Manager software (RevMan 2014) and collected outcome data.
We extracted the following information from the included studies.
Trial methods
-
Method of randomization.
-
Method of allocation concealment.
-
Exclusion of participants after randomization, proportion of and reasons for losses at follow‐up.
-
Duration, timing, and location of the trial (single‐centre or multicentre trial), duration of follow‐up.
-
Co‐interventions.
-
The presence of a power calculation.
Participants
-
Cause and duration of pre‐existing infertility.
-
Age of the women and parity.
-
Investigative work‐up.
-
Previously administered treatment(s).
Intervention
-
Type of intervention and control comparator.
-
Dose and type of regimen for controlled ovarian stimulation.
-
We differentiated between whether the study population included all women undergoing assisted reproductive technology or if it was limited to women who had responded poorly in a previous attempt or were expected to have a diminished response.
Outcomes
-
Outcomes reported.
-
How outcomes were defined.
-
Timing of outcome measurement.
We extracted data were extracted from eligible studies using a data extraction form designed and pilot‐tested by the authors. Where studies had multiple publications, we used the main trial report as the reference and supplemented additional details from secondary papers. Review authors corresponded with study investigators in order to resolve any data queries, as required. Three review authors (AG, MSK, KYKY) independently extracted the data. Any disagreements between these review authors were resolved by a fourth review author (SB).
Assessment of risk of bias in included studies
We assessed and reported on the risk of bias of included studies in accordance with the Cochrane Handbook for Systematic Reviews of Interventions (Higgins 2011), which recommends the explicit reporting of the following domains.
Sequence generation
Was sequence generation at low risk of bias (e.g. use of a random number table, a computer random number generator, or coin tossing), or unclear risk of bias (insufficient information provided about the process of sequence generation)?
Allocation concealment
Was allocation concealment at low risk of bias (e.g. use of central allocation or opaque, sealed envelopes), high risk of bias (e.g. use of an open random allocation schedule), or unclear risk of bias (insufficient information provided about the process of allocation concealment)?
Blinding of participants and assessors
There were two comparisons in this review. For the general IVF population, we considered lack of blinding as high risk since assessment of one of the primary outcomes (OHSS) may be subject to bias. For the poor responder population, the primary outcome (live birth) was objective, therefore we judged studies evaluating the poor responder population without use of blinding as low risk as it was not likely to influence the outcome.
Selective outcome reporting
Was the study free of selective reporting, that is at low risk of bias (e.g. the study protocol was available and all prespecified outcomes had been reported on, or the study protocol was not available but all prespecified outcomes had been reported); high risk of bias (e.g. not all prespecified primary outcomes had been reported); or unclear risk of bias (insufficient information provided about the process of outcome reporting)? We tried to ascertain the risk of within‐study reporting bias by seeking protocols for the original studies and checking whether the planned outcomes had been reported.
Other sources of bias
Other problems that could put a trial at high risk of bias include differences at baseline between study groups.
Two review authors (AG, MSK) assessed these domains, resolving any disagreements by consensus or by discussion with a third review author (AM). We presented the conclusions in the 'Risk of bias' table and incorporated them into the interpretation of the review findings. Where included studies failed to report the primary outcome of live birth, but did report interim outcomes such as pregnancy, we undertook informal assessment as to whether those studies reporting the primary outcome have similar values as the interim outcomes.
We presented the 'Risk of bias' assessment in the 'Characteristics of included studies' table, including commentary about each of the domains. This led to an overall assessment of the risk of bias of included studies.
Measures of treatment effect
For dichotomous data (e.g. live‐birth rates), we used the numbers of events in the control and intervention groups of each study to calculate risk ratios (RR). Where events were very rare, we calculated the Peto odds ratio (OR). For continuous data (e.g. mean number of retrieved oocytes), we calculated mean differences (MD) between treatment groups. We presented the 95% confidence intervals (CI) for all outcomes.
Unit of analysis issues
We pooled data that reported outcomes per woman randomized wherever possible.
Dealing with missing data
In the case of missing data in the included studies, we contacted the original investigators by email or post to request the relevant missing information. We reported the data according to the intention‐to‐treat principle wherever possible. We assumed live births not to have occurred in participants without a reported outcome. For other outcomes (e.g number of oocytes retrieved and ampoules of gonadotropins used), we only analyzed the available data.
Assessment of heterogeneity
We judged whether the clinical and methodological characteristics of the included studies were sufficiently similar for meta‐analysis to provide a meaningful summary. We assessed statistical heterogeneity by using the Chi2 test. A low P value (or a large Chi2 statistic relative to its degree of freedom) potentially provides evidence of heterogeneity of intervention effects and shows that results are not influenced by chance alone (Higgins 2011). We also used the I2 statistic to assess the impact of the heterogeneity on the meta‐analysis. We took an I2 greater than 50% to indicate substantial heterogeneity.
Assessment of reporting biases
In view of the difficulty in detecting and correcting for publication bias and other reporting biases, we tried to minimise their potential impact by ensuring a comprehensive search for eligible studies and by being alert to duplication of data. Whenever there was an adequate number of studies in an analysis, we used a funnel plot to explore whether a difference was due to publication or reporting bias.
Data synthesis
If studies were sufficiently similar, we performed meta‐analysis whenever there were at least two trials assessing the same outcome. We performed statistical analysis in accordance with the guidelines for statistical analysis in Chapter 9 of the Cochrane Handbook for Systematic Reviews of Interventions (Higgins 2011). We combined the data from primary studies using a fixed‐effect model, unless heterogeneity was considerable (I2 > 50%), in which case we used a random‐effects model. This applied to the following comparisons.
-
Clomiphene citrate or letrozole with or without gonadotropins in conjunction with or without midcycle GnRH antagonist versus gonadotropins (with GnRH agonist or midcycle antagonist protocols) in IVF and ICSI cycles in the general population.
-
Clomiphene citrate or letrozole with or without gonadotropins in conjunction with or without midcycle GnRH antagonist versus gonadotropins (with GnRH agonist or midcycle antagonist protocols) in IVF and ICSI cycles in a population of poor responders.
An increase in the risk of a particular outcome, which may be beneficial (e.g. live birth) or detrimental (e.g. OHSS), was displayed graphically in the meta‐analyses to the right of the centre line, and a decrease in the risk of an outcome was displayed to the left of the centre line.
Subgroup analysis and investigation of heterogeneity
We planned to the following subgroup analyses.
-
Clomiphene citrate with or without gonadotropins in conjunction with or without antagonist versus GnRH agonist protocol.
-
Clomiphene citrate with or without gonadotropins in conjunction with or without antagonist versus GnRH antagonist protocol.
-
Letrozole with or without gonadotropins in conjunction with or without antagonist versus GnRH agonist protocol.
-
Letrozole with or without gonadotropins in conjunction with or without antagonist versus GnRH antagonist protocol.
Sensitivity analysis
We conducted sensitivity analysis for primary outcomes (live birth and OHSS) to determine whether the conclusions were robust to decisions made during the review process. These analyses included consideration of whether the review conclusions would have differed if:
-
eligibility was restricted to studies without high risk of bias (not at high risk of bias in any domain and at low risk for randomization procedures);
-
a random‐effects model had been adopted;
-
the summary effect measure was odds ratio (OR) rather than risk ratio (RR) and vice versa.
Overall quality of the body of evidence: 'Summary of findings' tables
We used the GRADE approach to summarise and interpret findings (Schünemann 2011), and GRADEpro GDT 2015 software to import data from RevMan 2014 to create 'Summary of findings' tables. These tables provide outcome‐specific information concerning within‐study risk of bias (methodological quality), directness of evidence, heterogeneity, precision of effect estimates, and risk of publication bias, and the sum of available data on all outcomes rated as important to patient care and decision‐making. The GRADE approach specifies four levels of quality, as follows.
-
High quality: Further research is very unlikely to change our confidence in the estimate of effect.
-
Moderate quality: Further research is likely to have an important impact on our confidence in the estimate of effect and may change the estimate.
-
Low quality: Further research is very likely to have an important impact on our confidence in the estimate of effect and is likely to change the estimate.
-
Very low quality: We are very uncertain about the estimate.
Two review authors independently assessed the quality of the evidence, resolving any disagreements by discussion.
The main comparisons were: CC or Ltz with or without gonadotropins (with or without midcycle GnRH antagonist) versus gonadotropins (with GnRH agonist or midcycle antagonist protocols) in IVF and ICSI cycles in the general population and in poor responders. We presented 'Summary of findings' tables for the two comparisons separately.
We included the following outcomes in the 'Summary of findings' tables.
-
Live‐birth rate
-
Ovarian hyperstimulation syndrome for the general IVF population only
-
Clinical pregnancy rate
-
Cycle cancellation rate
-
Mean number of ampoules of gonadotropin used
-
Mean number of oocytes retrieved.
Results
Description of studies
Results of the search
The original search strategy identified 61 records through database searching. We identified one additional record as an abstract for an ongoing trial through our search of registered trials (Youssef 2011); we contacted the corresponding author by email for more information and obtained some of the missing data. Of the 62 studies identified, five duplicates were removed, leaving 57 records. We excluded abstracts if a full article was detected for the same study, and excluded 30 abstracts that did not meet the basic inclusion criteria as identified from the study title and abstract. Where the title or abstract identified a study as 'possibly for inclusion', or if there was any doubt about the exclusion of a study, we obtained the full article for further evaluation. Of the remaining 27 studies identified as possibly for inclusion (Abdalla 1990; Ashrafi 2005; Cassidenti 1992; Dhont 1995; Engel 2002; Fenichel 1988; Ferrier 1990; Fiedler 2001; Ghosh Dastidar 2010; Gonen 1990; Grochowski 1999; Harrison 1994; Imoedemhe 1987; Jutras 1991; Karimzadeh 2010; Karimzadeh 2011; Kingsland 1992; Kubik 1990; Lin 2006; Long 1995; Macnamee 1989; Martinez 2003; Quigley 1984; Shelton 1991; Tummon 1992; Weigert 2002; Youssef 2011), 14 studies were eligible for inclusion in the final analysis of the original review (Ashrafi 2005; Fenichel 1988; Fiedler 2001; Ghosh Dastidar 2010; Grochowski 1999; Harrison 1994; Jutras 1991; Karimzadeh 2010; Kingsland 1992; Lin 2006; Long 1995; Tummon 1992; Weigert 2002; Youssef 2011).
The targeted update search resulted in 191 records. Three review authors independently examined the titles and abstracts, identifying 43 records as potentially eligible, for which full papers were obtained. We excluded 27 full texts (Ferraretti 2015; Ghanem 2013; Goldman 2014; Ibrahim 2012; Kim 2000; Legro 2012; Liu 2016; Nagulapally 2012; Nahid 2012; Nakajo 2011; NCT01577199; NCT01577472; NCT01679574; NCT01718444; NCT01791751; NCT01856062; NIH/NICHD Reproductive Medicine Network 2013; Oktem 2015; Oride 2015; Reindollar 2011; Rose 2015; Roy 2012; Sharma 2014; Siristatidis 2016; Wagman 2010; Ye 2016; Zhang 2014), and included 14 new studies (15 articles; one study had a companion paper) (Bastu 2016; Elnashar 2016; Fujimoto 2014; Galal 2012; Goswami 2004; Jindal 2013; Lee 2012; Mohsen 2013; Mukherjee 2012; Nabati 2016; Pilehvari 2016; Ragni 2012; Revelli 2014; Schimberni 2016). In addition, we identified a companion paper to one of the already included studies (Youssef 2011), but it did not provide any new data. We identified three ongoing studies (NCT 01921166; NCT 01948804; NCT 02237755). See Characteristics of included studies; Characteristics of excluded studies; Characteristics of studies awaiting classification; and Characteristics of ongoing studies for further details.
We excluded a trial that was included in original review (Fiedler 2001), since both groups included clomiphene citrate (CC) and gonadotropins. The final number of studies included in the updated review was 27 (13 studies from original review and 14 new studies from the updated search). The search result is summarized in the PRISMA figure (Figure 1).

Study flow diagram.
Included studies
See Characteristics of included studies for details.
Design
Our update includes 13 RCTs that were included in the original review (Ashrafi 2005; Fenichel 1988; Ghosh Dastidar 2010; Grochowski 1999; Harrison 1994; Jutras 1991; Karimzadeh 2010; Kingsland 1992; Lin 2006; Long 1995; Tummon 1992; Weigert 2002; Youssef 2011). None were multicentred. Three studies reported an a priori power calculation (Grochowski 1999; Lin 2006; Tummon 1992). None of the included trials reported financial support by any pharmaceutical company.
Following the updated search, we included 14 more RCTs in the current review (Bastu 2016; Elnashar 2016; Fujimoto 2014; Galal 2012; Ghosh Dastidar 2010; Jindal 2013; Lee 2012; Mohsen 2013; Mukherjee 2012; Nabati 2016; Pilehvari 2016; Ragni 2012; Revelli 2014; Schimberni 2016). All trials were single‐centre trials, and none received financial support from any pharmaceutical company.
Participants
All of the included studies involved subfertile couples undergoing IVF treatment, but the inclusion criteria differed among the studies (Table 1). One study did not mention the total number of participants (Jutras 1991), and one study did not mention the number of participants allocated to each interventional arm (Ghosh Dastidar 2010).
| Study ID | Downregulation used | Type of FSH used | Starting dose of FSH | Dose of clomiphene citrateor letrozole | Cycle monitoring | Luteal support | Timing of hCG |
| Buserelin | hMG | 150 to 225 IU/day | 100 mg CC | Ultrasound | Progesterone | Leading follicle 17 mm | |
| Antagonist (cetrorelix subcutaneous) | hMG and recombinant FSH | hMG and recombinant FSH but in different doses: Group 1: 225 IU hMG + 225 IU rFSH Group 2: 150 IU hMG + 150 IU rFSH Group 3: 5mg Ltz + 150 IU rFSH | 5 mg Ltz | Ultrasound | Progesterone | Leading follicle > 17 mm | |
| Antagonist (ganirelix (Orgalutran) subcutaneous) for the Ltz group and triptorelin subcutaneous in the agonist control group | FSH | 75 IU for the Ltz group versus 150 to 225 IU for the control FSH/agonist group | 10 mg Ltz | Not mentioned | Not mentioned | Not mentioned | |
| Triptorelin intramuscular | hMG | hMG 125 to 300 IU/day | 200 mg CC | Ultrasound and oestradiol | hCG | Leading follicle 17 mm | |
| Ganirelix | hMG | Not mentioned | 100 mg CC | Not mentioned | Not mentioned | Not mentioned | |
| Not mentioned | hMG | 150 to 225 IU | 10 mg Ltz | Not mentioned | Not mentioned | Not mentioned | |
| Not mentioned | Recombinant FSH | 100 to 150 IU in the CC + gonadotropins group; 200 to 225 IU in the gonadotropins + GnRH agonist group) | Not mentioned | Not mentioned | Not mentioned | Not mentioned | |
| Triptorelin intramuscular depot | hMG | 150 to 225 IU/day | 100 mg CC | Ultrasound and oestradiol | Progesterone | Leading follicle 18 mm | |
| Triptorelin intramuscular and buserelin intranasal | hMG | 150 IU/day | 100 mg CC | Ultrasound and oestradiol | Progesterone | Leading follicle 17 mm | |
| Antagonist (cetrorelix subcutaneous) for the Ltz or CC group and GnRH agonist for the control group, type not mentioned | Not mentioned | Not mentioned | Not mentioned | Not mentioned | Not mentioned | Not mentioned | |
| Leuprorelin | hMG | 150 IU/day | 50 mg CC | Ultrasound and oestradiol | Not mentioned | Leading follicle 15 mm | |
| Buserelin | Recombinant FSH | 150 to 225 IU/day | 100 mg CC | Ultrasound | Progesterone | Leading follicle 18 mm | |
| Buserelin nasal spray | hMG | According to age (225 IU for women < 35 years and 300 IU for women > 35 years) | 100 mg CC | Ultrasound and oestradiol | hCG | Leading follicle 17 mm | |
| Antagonist (cetrorelix subcutaneous) | hMG | 225 IU | 2.5 mg Ltz | Ultrasound and oestradiol | Progesterone | Leading follicle 18 mm | |
| Antagonist (cetrorelix subcutaneous) | hMG | 150 to 300 IU/day | 100 mg CC | Ultrasound, serum oestradiol, LH, and progesterone | Progesterone | Leading follicle 18 mm | |
| Leuprorelin (Lupron) | hMG | 150 IU/day | 50 mg CC | Ultrasound and oestradiol | None | Leading follicle 15 mm | |
| Antagonist (cetrorelix subcutaneous) for the Ltz group and agonist (leuprorelin) for the conventional agonist group | hMG | 150 IU for the Ltz group versus 300 IU for the control hMG/agonist group | 2.5 mg Ltz | Ultrasound and oestradiol | Progesterone | 18 mm | |
| Antagonist (ganirelix (Orgalutran) subcutaneous) | Recombinant FSH | 75 IU for the Ltz group versus 150 to 225 IU for the control FSH/antagonist group | 5 mg Ltz | Ultrasound and oestradiol | Progesterone | 18 mm | |
| The type of antagonist used was not mentioned in the study while the agonist used in the control group was buserelin | Recombinant FSH | 300 IU for the Ltz group versus 450 IU for the control FSH/agonist group | 5 mg Ltz | Ultrasound | Progesterone | 17 mm | |
| Antagonist (cetrorelix subcutaneous) | hMG | 150 IU for the CC group versus 300 IU for the control hMG/antagonist group | 100 mg CC | Ultrasound | Progesterone | 17 to 18 mm | |
| Buserelin | Recombinant FSH | 450 IU | 150 mg CC | Ultrasound and oestradiol | Progesterone | 18 to 20 mm | |
| Antagonist (cetrorelix or ganirelix (Orgalutran) subcutaneous); agonist was leuprorelin | hMG | 150 IU for the CC group versus 300 to 450 IU for the control hMG/antagonist group | 100 mg CC | Ultrasound and oestradiol | Progesterone | 18 to 20 mm | |
| Antagonist (cetrorelix subcutaneous) | Recombinant FSH | 450 IU for both groups | 100 mg CC | Ultrasound and oestradiol | Progesterone | 18 mm | |
| Leuprorelin subcutaneous | hMG | According to body weight (less than 52 kg would start with 75 IU/day, 52 to 75 kg would start with 112.5 IU/day, and 150 IU/day for women who weighed more than 75 kg) | 100 mg CC | Ultrasound and oestradiol | Progesterone | Leading follicle 16 mm | |
| Buserelin | Recombinant FSH | 150 IU/day | 100 mg | Ultrasound | Progesterone | Leading follicle 18 mm | |
| Buserelin | hMG | 225 to 300 IU/day | 100 mg | Ultrasound | Progesterone | Not mentioned |
CC: clomiphene citrate
FSH: follicle‐stimulating hormone
GnRH: gonadotropin‐releasing hormone
hCG: human chorionic gonadotropin
hMG: human menopausal gonadotropin
LH: luteinising hormone
Ltz: letrozole
rFSH: recombinant follicle‐stimulating hormone
We separated the trials that included the general IVF population (15 trials), Elnashar 2016, Fenichel 1988, Ghosh Dastidar 2010, Galal 2012, Grochowski 1999, Harrison 1994, Jindal 2013, Jutras 1991, Karimzadeh 2010, Kingsland 1992, Lin 2006, Long 1995, Mukherjee 2012, Tummon 1992, Weigert 2002, from those that included poor responders (12 trials) (Ashrafi 2005; Bastu 2016; Fujimoto 2014; Goswami 2004; Lee 2012; Mohsen 2013; Nabati 2016; Pilehvari 2016; Ragni 2012; Revelli 2014; Schimberni 2016; Youssef 2011), and evaluated them separately.
Interventions
Cycle characteristics of included studies have been shown in Table 1.
Among the 15 trials evaluating the intervention in the general population of women undergoing IVF, 11 compared CC with gonadotropin (with or without antagonist) versus gonadotropin in short or long protocol (Fenichel 1988; Ghosh Dastidar 2010; Grochowski 1999; Harrison 1994; Jutras 1991; Karimzadeh 2010; Kingsland 1992; Lin 2006; Long 1995; Tummon 1992; Weigert 2002). One trial compared letrozole (Ltz) with gonadotropin and antagonist versus gonadotropin in long protocol (Elnashar 2016). Two trials compared Ltz with gonadotropin and antagonist versus gonadotropin in antagonist protocol (Galal 2012; Mukherjee 2012). One trial used both CC or Ltz along with gonadotropin and antagonist versus gonadotropin in long protocol (Jindal 2013).
Among the 12 trials evaluating the intervention in poor responders, three compared CC with gonadotropin (with or without antagonist) versus gonadotropin in either short or long protocol (Ashrafi 2005; Revelli 2014; Youssef 2011). One trial compared CC versus gonadotropin in short protocol (Ragni 2012). One trial compared CC along with gonadotropins and an antagonist versus two comparator arms ‐ short protocol and antagonist protocol (Schimberni 2016). Two trials compared CC with gonadotropin (with or without antagonist) versus antagonist protocol (Fujimoto 2014; Pilehvari 2016). The remaining five trials compared Ltz with gonadotropin (with or without antagonist) versus gonadotropin in agonist protocol, Goswami 2004, Nabati 2016, Mohsen 2013, and antagonist protocol (Bastu 2016; Lee 2012).
Outcomes
Of the trials involving the general IVF population, four trials reported the primary outcome of live birth (Harrison 1994; Kingsland 1992; Lin 2006; Long 1995), and five trials reported the primary outcome of ovarian hyperstimulation syndrome (OHSS) (Grochowski 1999; Karimzadeh 2010; Lin 2006; Mukherjee 2012; Weigert 2002).
Of the trials on poor responders, three trials reported live‐birth rate (Fujimoto 2014; Lee 2012; Ragni 2012), and one trial reported cumulative live‐birth rate (fresh and frozen cycles) per woman randomized (Fujimoto 2014).
Excluded studies
A list of excluded studies along with the reasons for their exclusion is provided in the Characteristics of excluded studies table. We excluded four studies that used quasi‐randomisation methods (Abdalla 1990; Kubik 1990; Macnamee 1989; Siristatidis 2016). We excluded nine studies that were non‐randomised trials (Engel 2002; Ferraretti 2015; Gonen 1990; Kim 2000; Oktem 2015; Oride 2015; Rose 2015; Sharma 2014; Shelton 1991). We excluded two studies in which participants may have had either gamete intrafallopian transfer (GIFT) or IVF and it was not possible to separate the outcomes of the two forms of assisted reproduction (Dhont 1995; Ferrier 1990). We excluded one study in which participants were fertile oocyte donors (Cassidenti 1992). We excluded eight trials because of an inappropriate comparison (Fiedler 2001; Goldman 2014; Imoedemhe 1987; Karimzadeh 2011; Martinez 2003; Nagulapally 2012; Nakajo 2011; Quigley 1984). We excluded seven trials in which participants were not undergoing IVF or ICSI treatment (Ghanem 2013; Ibrahim 2012; Legro 2012; Nahid 2012; Reindollar 2011; Roy 2012; Wagman 2010). We excluded three trials because participants did not undergo fresh transfers (Liu 2016; Ye 2016; Zhang 2014).
Risk of bias in included studies
We assessed the included studies for methodological quality using the Cochrane 'Risk of bias' tool (Higgins 2011). See the 'Risk of bias' graph (Figure 2) and 'Risk of bias' summary (Figure 3).

Risk of bias graph: review authors' judgements about each risk of bias item presented as percentages across all included studies.

Risk of bias summary: review authors' judgements about each risk of bias item for each included study.
Allocation
Generation of random sequence
The method of randomization was computer based in 11 studies (Bastu 2016; Harrison 1994; Jindal 2013; Karimzadeh 2010; Lee 2012; Mohsen 2013; Ragni 2012; Revelli 2014; Schimberni 2016; Weigert 2002; Youssef 2011). Two studies employed simple randomization using a sequence of randomized numbers (Goswami 2004; Tummon 1992). The method of randomization was not mentioned in 14 studies (Ashrafi 2005; Elnashar 2016; Fenichel 1988; Fujimoto 2014; Galal 2012; Ghosh Dastidar 2010; Grochowski 1999; Jutras 1991; Kingsland 1992; Lin 2006; Long 1995; Mukherjee 2012; Nabati 2016; Pilehvari 2016). See the 'Risk of bias' graph (Figure 2) and 'Risk of bias' summary (Figure 3).
Allocation concealment
Thirteen studies partially described the method of allocation concealment (e.g. "sealed envelope") and were assessed as at unclear risk of bias (Ashrafi 2005; Bastu 2016; Elnashar 2016; Goswami 2004; Grochowski 1999; Karimzadeh 2010; Kingsland 1992; Lee 2012; Lin 2006; Mohsen 2013; Mukherjee 2012; Ragni 2012; Youssef 2011). In one study participant allocation was performed by an independent second party (Harrison 1994). Twelve studies did not mention the method of allocation concealment and were assessed as at unclear risk of bias (Fenichel 1988; Fujimoto 2014; Galal 2012; Jindal 2013; Jutras 1991; Long 1995; Nabati 2016; Pilehvari 2016; Schimberni 2016; Tummon 1992; Weigert 2002). Only one study stated that allocation concealment was done using consecutively numbered, opaque, sealed envelopes, which we assessed as at low risk of bias (Figure 2; Figure 3) (Revelli 2014).
Blinding
Most of the included studies did not report blinding of either clinician or participant. One trial stated that blinding was not used (Youssef 2011). Two trials described single‐blinding of the clinician to the treatment allocation (Goswami 2004; Harrison 1994), while two other trials described blinding of clinicians and embryologists to the treatment allocation (Bastu 2016; Nabati 2016).
Incomplete outcome data
We assessed a total of 15 trials as at low risk of attrition bias; the majority of these reported no loss to follow‐up (Goswami 2004; Grochowski 1999; Harrison 1994; Kingsland 1992; Lee 2012; Lin 2006; Long 1995; Mohsen 2013; Mukherjee 2012; Pilehvari 2016; Revelli 2014), while the few that had dropouts stated clear reasons for them, and numbers were similar in both groups (Bastu 2016; Ragni 2012; Schimberni 2016; Youssef 2011). We assessed nine trials as at unclear risk of bias due to lack of information regarding dropouts, the majority of these trials being conference abstracts (Ashrafi 2005; Elnashar 2016; Fenichel 1988; Fujimoto 2014; Galal 2012; Ghosh Dastidar 2010; Jindal 2013; Nabati 2016; Weigert 2002). We assessed three trials as at high risk of attrition bias, of which two studies had high dropout rates without clearly stated reasons (Karimzadeh 2010; Tummon 1992), and one study did not provide information regarding number of women randomized (Jutras 1991). Wherever possible, we took the denominator as the number of women randomized.
Selective reporting
None of the included studies appeared to publish or fail to publish any outcomes according to their statistical significance. Generally, few studies reported on live birth. There was a paucity of information on side effects of the CC or Ltz protocols. Most studies reported cycle cancellation due to poor response; few reported miscarriage rate and ectopic pregnancy rate; and only one trial reported foetal abnormalities. There were no data on acceptability of the adjuvant treatments.
Seven trials were published as conference abstracts (Elnashar 2016; Fujimoto 2014; Galal 2012; Ghosh Dastidar 2010; Jindal 2013; Jutras 1991; Schimberni 2016), making judgement difficult due to lack of information. Five trials had a registered protocol available (Bastu 2016; Lee 2012; Nabati 2016; Ragni 2012; Schimberni 2016).
Other potential sources of bias
One of the trial was at high risk of other bias (Ragni 2012). This study was interrupted after the scheduled two years of recruitment before reaching the sample size, leaving the study power at 60% instead of the planned 80%. One of the reasons for premature closure of the trial was slow recruitment.
We assessed studies published as conference abstracts as at unclear risk of other bias due to lack of information (Elnashar 2016; Fujimoto 2014; Galal 2012; Ghosh Dastidar 2010; Jindal 2013; Jutras 1991; Schimberni 2016). The majority of the remaining studies were at low risk for other bias.
Effects of interventions
See: Summary of findings for the main comparison Clomiphene citrate or letrozole with or without gonadotropins (with or without midcycle antagonist) compared to gonadotropins (with GnRH agonists or midcycle antagonist) in IVF and ICSI cycles in general population for controlled ovarian stimulation; Summary of findings 2 Clomiphene citrate or letrozole with or without gonadotropins (with or without midcycle antagonist) compared to gonadotropins (with GnRH agonist or midcycle antagonist) in IVF and ICSI cycles in poor responders for controlled ovarian stimulation
1. Clomiphene citrate or letrozole with or without gonadotropins in conjunction with or without midcycle antagonist versus gonadotropins (with GnRH agonists or midcycle antagonist) in IVF and ICSI cycles in the general IVF population
We pooled results from 12 trials (1998 women) in this comparison (Elnashar 2016; Fenichel 1988; Galal 2012; Grochowski 1999; Harrison 1994; Karimzadeh 2010; Kingsland 1992; Lin 2006; Long 1995; Mukherjee 2012; Tummon 1992; Weigert 2002). For two included trials requisite data were not available for pooling the results (Ghosh Dastidar 2010; Jutras 1991). In the intervention group of one trial, both CC or Ltz was used along with gonadotropin, hence results could not be pooled (Jindal 2013).
Primary outcomes
1.1 Live‐birth rate
Four studies reported live birth. There was no clear evidence of a difference between the groups in live‐birth rate (risk ratio (RR) 0.92, 95% confidence interval (CI) 0.66 to 1.27, 4 RCTs, n = 493, I2 = 0%, low‐quality evidence) (Analysis 1.1; Figure 4). This means that for a typical clinic with 23% success using a standard GnRH agonist regimen, switching to CC would be expected to result in live‐birth rates between 15% and 30%. All four trials compared CC protocol versus agonist protocol. None of the included trials reported live‐birth outcome for the other three subgroups. Sensitivity analysis done after removing studies without clear randomization, or by switching to odds ratio (OR), did not show any evidence of a difference in the live‐birth rate.

Forest plot of comparison: 1 Clomiphene citrate or letrozole with or without gonadotropins in conjunction with or without midcycle antagonist versus gonadotropins (with GnRH agonists or midcycle antagonist) in IVF and ICSI cycles in general population, outcome: 1.1 Live birth.
1.2 Ovarian hyperstimulation syndrome
Five studies reported OHSS. There was evidence of a decrease in the incidence of OHSS when CC or Ltz protocol was used (Peto OR 0.21, 95% CI 0.11 to 0.41, 5 RCTs, n = 1067, I2 = 0%, low‐quality evidence) (Analysis 1.2; Figure 5). This means that for a typical clinic with a 6% prevalence of OHSS using a standard GnRH regimen, switching to CC or Ltz protocol would be expected to reduce the incidence to between 0.5% and 2.5%. Sensitivity analysis done after removing studies without clear randomization showed a persistent decrease in the incidence of OHSS with CC or Ltz protocol.

Forest plot of comparison: 1 Clomiphene citrate or letrozole with or without gonadotropins in conjunction with or without midcycle antagonist versus gonadotropins (with GnRH agonists or midcycle antagonist) in IVF and ICSI cycles in general population, outcome: 1.2 Ovarian hyperstimulation syndrome.
Subgroup analysis according to the types of protocol compared showed no evidence of a difference between the subgroups: test for subgroup differences: Chi2 = 0.29, df = 1 (P = 0.59), I2 = 0%.
Secondary outcomes
1.3 Ongoing pregnancy rate
Only six studies reported the outcome of ongoing pregnancy. There was no clear evidence of a difference between the groups in ongoing pregnancy rate (RR 1.00, 95% CI 0.77 to 1.30, 6 RCTs, n = 758, I2 = 0%) (Analysis 1.3). This means that for a typical clinic with 23% success using a standard regimen, switching to CC protocol would be expected to result in pregnancy rates between 18% and 30%. None of the included trials reported ongoing pregnancy outcome for the other three subgroups.
1.4 Clinical pregnancy rate
Twelve studies reported clinical pregnancy rate. There was no clear evidence of a difference between the groups in clinical pregnancy rate (RR 1.00, 95% CI 0.86 to 1.16, 12 RCTs, n = 1998, I2 = 3%, moderate‐quality evidence) (Analysis 1.4). This means that for a typical clinic with 25% success using a standard regimen, switching to CC or Ltz would be expected to result in pregnancy rates between 21% and 29%. Sensitivity analysis done after removing studies without clear randomization did not show any evidence of a difference in the clinical pregnancy rate (RR 1.10, 95% CI 0.89 to 1.37). Four studies reported adequate randomization. A funnel plot for this outcome showed no evidence of publication bias (Figure 6).
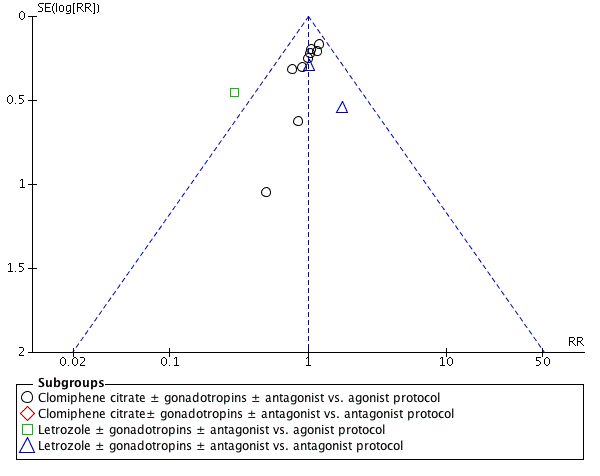
Funnel plot of comparison: 1 Clomiphene citrate or letrozole with gonadotropins in conjunction with or without midcycle antagonist versus gonadotropins with GnRH protocols in IVF and ICSI cycles in general population, outcome: 1.4 Clinical pregnancy rate.
Subgroup analysis according to the types of protocol compared showed evidence of a difference between the subgroups: test for subgroup differences: Chi2 = 7.76, df = 2 (P = 0.02), I2 = 74.2%. All the heterogeneity in this analysis was due to a single study comparing Ltz with follicle‐stimulating hormone and antagonist versus long protocol with follicle‐stimulating hormone (Elnashar 2016), which reported a higher clinical pregnancy rate in the intervention group (RR 0.29, 95% CI 0.12 to 0.72). There was no evidence of a difference between the groups in the other subgroups.
1.5 Cycle cancellation rate
Nine studies reported on the number of cycles cancelled due to a poor response. There was evidence of an increase in cycle cancellation rate with the CC protocol compared to gonadotropins in GnRH protocol (RR 1.87, 95% CI 1.43 to 2.45, 9 RCTs, n = 1784, I2 = 61%, low‐quality evidence) (Analysis 1.5). This means that for a typical clinic with 8% prevalence of cycle cancellation using a GnRH agonist regimen, switching to CC would be expected to increase the incidence to between 11% and 20%. The increase in cycle cancellation rate persisted even after adopting a random‐effects model (RR 1.74, 95% CI 1.01 to 3.00). Sensitivity analysis done after removing studies with inadequate randomization did not show any difference (RR 1.96, 95% CI 1.44 to 2.66).
1.6 Number of ampoules of gonadotropin
Six studies reported the number of ampoules of gonadotropins used along with a measure of variance. The data were too heterogeneous to pool (I2=97%). All studies reported that CC plus gonadotropins was associated with use of fewer ampoules than gonadotropin‐only regimens in agonist protocols, with the mean difference ranging from 5.6 to 24.6 ampoules (Analysis 1.6). The heterogeneity may be attributable to differences in the starting dose of gonadotropins. Sensitivity analysis, whether by removing studies with inadequate randomization or by using a random‐effects model, showed persistent evidence of an increased requirement for gonadotropins in GnRH protocol.
1.7 Number of oocytes
Eight studies reported the number of oocytes retrieved, along with a measure of variance. Eight studies reported the number of oocytes retrieved, along with a measure of variance. The data were too heterogeneous to pool (I2=92%). In seven studies CC plus gonadotropins was associated with retrieval of fewer oocytes than gonadotropin‐only regimens in agonist protocols, with the mean difference ranging from 1.02 to 6.20 oocytes. The difference was statistically significant in five of these studies. The eighth study made the same comparison and found no evidence of a difference between the groups. The heterogeneity may be attributable to differences in the starting dose of gonadotropins (Analysis 1.7). Sensitivity analysis, whether by removing studies with inadequate randomization or by using a random‐effects model, showed persistent evidence of a decrease in the number of oocytes retrieved with the CC with or without gonadotropins protocol compared to gonadotropins in GnRH agonist protocol.
1.8 Multiple pregnancy rate
Five trials measured multiple pregnancy rate. There was no clear evidence of a difference between the groups (RR 0.74, 95% CI 0.39 to 1.43, 5 RCTs, n = 791, I2 = 3%) (Analysis 1.8). Subgroup analysis according to the types of protocol compared did not suggest a difference between the subgroups: test for subgroup differences: Chi2 = 0.30, df = 1 (P = 0.58), I2 = 0%.
1.9 Miscarriage rate
Seven trials reported miscarriage rate. There was no clear evidence of a difference between the groups (RR 0.95, 95% CI 0.61 to 1.47, 7 RCTs, n = 1116, I2 = 0%) (Analysis 1.9). Subgroup analysis according to the types of protocol compared did not suggest a difference between the subgroups: test for subgroup differences: Chi2 = 0.39, df = 1 (P = 0.53), I2 = 0%.
1.10 Ectopic pregnancy rate
Two trials reported ectopic pregnancy rate. There was no clear evidence of a difference between the groups (Peto OR 7.56, 95% CI 0.47 to 120.94, 2 RCTs, n = 223, I2 = 0%) (Analysis 1.10).
1.11 Foetal abnormalities
Only one trial reported the rate of foetal abnormalities (Harrison 1994). There were no reported cases of foetal abnormalities within the two groups.
2. Clomiphene citrate or letrozole with or without gonadotropins in conjunction with or without midcycle antagonist versus gonadotropins (with GnRH agonists or midcycle antagonist) in IVF and ICSI cycles in poor responders
We could pool results from 10 trials (1601 women) in this comparison (Ashrafi 2005; Bastu 2016; Goswami 2004; Lee 2012; Mohsen 2013; Nabati 2016; Pilehvari 2016; Ragni 2012; Revelli 2014; Youssef 2011). As one trial reported only cumulative live‐birth rate, we could not pool results (Fujimoto 2014). Another trial evaluated CC with gonadotropin with antagonist versus two control arms of short agonist protocol and antagonist protocol (Schimberni 2016), hence due to two different control arms we could not pool the data.
Primary outcomes
2.1 Live‐birth rate
Two studies reported live‐birth rate. There was no clear evidence of a difference between the groups (RR 1.16, 95% CI 0.49 to 2.79, 2 RCTs, n = 357, I2 = 38%, low‐quality evidence) (Analysis 2.1; Figure 7). This means that for a typical clinic with 5% success using a standard GnRH analogue regimen, switching to CC or Ltz with gonadotropin would be expected to result in live‐birth rates between 2% and 14%. Sensitivity analysis performed by changing summary measure effect to odds ratio or adopting a random‐effects model did not show evidence of a difference in live‐birth rate.

Forest plot of comparison: 2 Clomiphene citrate or letrozole with or without gonadotropins in conjunction with or without midcycle antagonist versus gonadotropins (with GnRH agonist or midcycle antagonist) in IVF and ICSI cycles in poor responders, outcome: 2.1 Live birth.
Subgroup analysis according to the types of protocol compared showed no evidence of a difference between the subgroups: test for subgroup differences: Chi2 = 1.61, df = 1 (P = 0.21), I2 = 37.7%.
2.2 Ovarian hyperstimulation syndrome
This outcome was not applicable to this population.
Secondary outcomes
2.3 Ongoing pregnancy rate
Only two studies reported ongoing pregnancy rate. There was no clear evidence of a difference between the groups (RR 0.86 , 95% CI 0.58 to 1.28, 2 RCTs, n = 748, I2 = 53%) (Analysis 2.2). This means that for a typical clinic with 12% success using a standard regimen, switching to CC or Ltz protocol would be expected to result in pregnancy rates between 7% and 16%. Sensitivity analysis done using a random‐effects model did not suggest a difference (RR 1.12, 95% CI 0.38 to 3.28).
Subgroup analysis according to the types of protocol compared did not suggest a difference between the subgroups: test for subgroup differences: Chi2 = 2.14, df = 1 (P = 0.14), I2 = 53.4%.
2.4 Clinical pregnancy rate
Eight studies reported clinical pregnancy rate. There was no clear evidence of a difference between the groups (RR 0.85, 95% CI 0.64 to 1.12, 8 RCTs, n = 1462, I2 = 0%, low‐quality evidence) (Analysis 2.3). This means that for a typical clinic with 13% success using a standard regimen, switching to CC or Ltz protocol would be expected to result in pregnancy rates between 8% and 14%. Sensitivity analysis done after excluding studies without clear randomization did not show any evidence of a difference in clinical pregnancy rate (RR 0.92, 95% CI 0.68 to 1.23). Six studies had adequate randomization.
Subgroup analysis according to the types of protocol compared did not suggest a difference between the subgroups: test for subgroup differences: Chi2 = 1.64, df = 3 (P = 0.65), I2 = 0%.
2.5 Cycle cancellation rate
Ten studies reported on the number of cycles cancelled due to a poor response. There was evidence of an increase in cycle cancellation rate with the CC or Ltz with or without gonadotropin compared to gonadotropins in GnRH protocol (RR 1.46, 95% CI 1.18 to 1.81, 10 RCTs, n = 1601, I2 = 64%, low‐quality evidence) (Analysis 2.4). This means that for a typical clinic with 14% prevalence of cycle cancellation using a GnRH regimen, switching to CC or Ltz protocol would be expected to increase the incidence to between 17% and 26%. The increase in cycle cancellation rate did not differ after adopting a random‐effects model (RR 1.35, 95% CI 0.93 to 1.98). Sensitivity analysis after removing studies with inadequate randomization revealed persistence of difference (RR 1.48, 95% CI 1.16 to 1.89).
Subgroup analysis according to the types of protocol compared did not suggest a difference between the subgroups: test for subgroup differences: Chi2 = 5.10, df = 3 (P = 0.16), I2 = 41.2%.
2.6 Mean number of ampoules of gonadotropin used
Three studies reported the number of ampoules of gonadotropins used along with a measure of variance.
In two studies the intervention group received CC plus gonadotropins and in the other one the intervention group received letrozole. These subgroups were too heterogeneous to pool (I2=96%) and the test for subgroup differences between the subgroups was statistically significant: Chi2 = 56.37, df = 1 (P < 0.001), I2 = 98.2%.
Compared with use of gonadotropin‐only regimens in agonist protocols, there was evidence of a decrease in the mean number of ampoules used associated with the use of CC plus gonadotropins (MD ‐23.98, 95% CI ‐27.41 to ‐20.56; participants = 87; studies = 2; I2 = 0%) and also with the use of letrozole plus gonadotropins (MD ‐46.24, 95% CI ‐50.93 to ‐41.55; participants = 49; studies = 1) (Analysis 2.5).
Sensitivity analysis done using a random‐effects model showed persistent evidence of an increased requirement for gonadotropins in GnRH agonist protocols.
2.7 Mean number of oocytes retrieved
Eight studies reported the number of oocytes retrieved, along with a measure of variance.
Four of these studies compared CC plus gonadotropins versus gonadotropins in an agonist protocol. One study compared CC plus gonadotropins versus gonadotropins in an antagonist protocol, and three studies compared letrozole plus gonadotropins versus gonadotropin only in an agonist protocol. The studies were too heterogeneous to pool, either overall (I2=83%) or within protocol subgroups (I2=85%‐88%). However, in seven of the eight studies the direction of effect was consistent and was associated with inferior findings in the intervention group. The heterogeneity may be attributable to differences in the starting dose of gonadotropins
In three studies CC plus gonadotropins was associated with retrieval of fewer oocytes than gonadotropin‐only regimens in agonist protocols, with the mean difference ranging from 0.75 to 2.10 oocytes. The difference was statistically significant in two of these studies. The fourth study found no clear evidence of a difference between the groups, and the direction of effect was inconsistent with the other three studies.
The study comparing CC plus gonadotropins versus a gonadotropin‐only regimen in an antagonist protocol found no clear evidence of a difference between the groups (MD ‐0.59, 95% CI ‐1.58 to 0.40; participants = 54; studies = 1). Findings were mixed in the studies comparing letrozole plus gonadotropins versus gonadotropin only in an agonist protocol: one study reported retrieval of significantly fewer oocytes in the intervention group, while the other two studies found no clear evidence of a difference between the groups. Analysis 2.6
Sensitivity analysis whether by removing the studies with inadequate randomization or by using a random‐effects model for analysis showed persistent evidence of a decrease in the number of oocytes retrieved with the CC or Ltz protocol compared to GnRH protocol.
Subgroup analysis according to the types of protocol compared did not suggest a difference between the subgroups: test for subgroup differences: Chi2 = 5.78, df = 2 (P = 0.06), I2 = 65.4%.
2.8 Multiple pregnancy rate
Only one trial reported multiple pregnancy rate. There was no clear evidence of a difference between the groups (RR 0.53, 95% CI 0.05 to 5.75, 1 RCT, n = 304) (Analysis 2.7).
2.9 Miscarriage rate
Three trials reported miscarriage rate. There was no clear evidence of a difference between the groups (RR 0.97, 95% CI 0.45 to 2.12, 3 RCTs, n = 818, I2 = 2%) (Analysis 2.8).
2.10 Ectopic pregnancy
No trials reported on this outcome.
2.11 Foetal abnormalities
Only one trial reported the rate of foetal abnormalities (Ragni 2012). There were no reported cases of foetal abnormalities in either group.
Other analyses
We examined publication bias in this systematic review by constructing a funnel plot. There was a paucity of trials reporting live‐birth data. We considered a funnel plot for the clinical pregnancy data, using this as a surrogate endpoint. We observed symmetric distribution of studies around the vertical line, indicating no publication bias (Figure 6).
Discussion
Summary of main results
The main finding of this updated systematic review was that it is unclear whether the use of clomiphene citrate (CC) or letrozole (Ltz) with gonadotropins, with or without GnRH antagonist, in controlled ovarian stimulation in IVF leads to a difference in live‐birth rates, ongoing pregnancy rates, or clinical pregnancy rates when compared to the use of gonadotropins with GnRH protocols in either the general population of women undergoing IVF( summary of findings Table for the main comparison) or in women who are poor responders (summary of findings Table 2). The use of CC or Ltz led to a significant increase in cycle cancellation rate (low‐quality evidence) as well as a reduction in the incidence of OHSS (in a general IVF population) (low‐quality evidence), the number of gonadotropins ampoules used (moderate‐quality evidence) and number of oocytes retrieved (moderate‐quality evidence) (summary of findings Table for the main comparison) (summary of findings Table 2). In most included studies, it was not possible to determine whether cycle cancellation was due to premature luteinising hormone surge, poor follicular development, or other reasons.
Although our results showed that there may be fewer oocytes retrieved with the use of CC or Ltz protocols in both the general IVF population and poor responders, these data must be interpreted with caution as there were no differences in pregnancy or live‐birth rates, which are more relevant outcomes. Some studies may have failed to count zero entries for participants with cancelled cycles, which may have affected the overall estimate of difference, particularly if cancellation was more common in the CC or Ltz arms.
Overall completeness and applicability of evidence
We performed a sample size calculation, which found that for a study to detect a 5% difference in live birth with 80% power and 0.05 significance level, when the live‐birth rate in the control group is 20%, an individual trial would need to randomise over 2000 women (STATA 10.1 software)(STATA). This means that if there is truly no difference between standard gonadotropins and CC protocols, then more than 2000 patients are required to be 80% sure that the limits of a two‐sided 90% confidence interval will exclude a difference between standard and new treatments of more than 5%. Unfortunately, the total number of participants in studies included in this meta‐analysis was insufficient to identify this minimal effective difference. We therefore acknowledge that a type 2 (beta) statistical error cannot be excluded.
Most of the studies included in the meta‐analysis suffered from an inadequate description of allocation concealment. This limits the level of confidence associated with this meta‐analysis. None of the trials addressed the potential value of any surplus embryos that could have been frozen for later use. Most of the included trials did not assess cumulative live birth after pooling results from fresh and cryo‐thawed cycles. One included trial reported comparable cumulative live‐birth rates following CC and GnRH antagonist protocol in poor responders (Fujimoto 2014). Comparative non‐randomised studies have shown inconsistent results (Demoulin 1991; Fugger 1991; Van der Elst 1996). There are no data on the acceptability of CC‐ or Ltz‐included protocols. The adverse effects of these protocols have been poorly reported. Data on foetal abnormalities following the use of CC or Ltz protocols are also lacking.
The primary outcome of this review was live‐birth rate per woman. The lack of adequately powered trials and possible clinical heterogeneity among the included trials suggest that the evidence is insufficient to effectively draw conclusions on the value of CC or Ltz alone or in combination with gonadotropins, with or without GnRH antagonist, compared to conventionally used gonadotropins and GnRH agonist protocols in the general IVF population. In the poor responder group, the different criteria used to define inclusion limits the overall applicability of evidence even within this population.
Heterogeneity
We observed the presence of variations in criteria among individual trials in terms of the definition of pregnancy, the types and doses of gonadotropins, GnRH agonist used, age, method of monitoring follicular response, type of intervention (IVF or ICSI), luteal support, starting doses of gonadotropins, causes of cycle cancellation, and type of GnRH protocols (agonist and antagonist). In addition, there was variation in inclusion for poor responders among the included studies. The literature suggests no difference in pregnancy rates between a long intramuscular depot and different preparations of subcutaneous short‐acting GnRH agonists (Albuquerque 2013; Wong 2001). Meanwhile, urinary human menopausal gonadotropin has not been demonstrated to be superior to recombinant follicle‐stimulating hormone in terms of live‐birth rate after IVF treatment (van Wely 2011). The long luteal GnRH agonist has been observed to have better results than short protocol (Siristatidis 2015). Clinical heterogeneity among studies was also due to variations in the trials' protocols as well as the inclusion and exclusion criteria for recruited patients.
We found high statistical heterogeneity for some of the outcomes studied in this review. The statistically significant increase in cycle cancellation rate (I2 = 61% to 64%) whenever CC or Ltz was used, and the statistically significant reductions in number of gonadotropins ampoules used (I2 = 96% to 97%) and suggestion of fewer oocytes retrieved (I2 = 83% to 92%) should therefore be interpreted with caution. Differences in the starting doses of gonadotropins may affect the total number of gonadotropins ampoules used as well as the number of oocytes. Meanwhile, differences in causes for cycle cancellation like poor follicular development or premature luteinising hormone surge may be a strong contributor to this observed statistical heterogeneity for the mentioned outcomes.
Quality of the evidence
Most studies included in the original review had suboptimal methodology. We included 27 trials in the current update, 13 of which were from the original review. We included 22 studies in the meta‐analysis. There was insufficient information for some outcomes, and only six trials reported live‐birth rate per woman or couple. The method of randomisation was unclear in some trials. Most studies had small sample sizes. Most studies lacked blinding. A funnel plot for the outcome of clinical pregnancy in the general IVF population showed no evidence of publication bias (Figure 6).
Some of the studies comparing CC with gonadotropins versus gonadotropins in GnRH protocol in a general population of women undergoing IVF and ICSI were very old. Only one relevant study has been published within the last 15 years (Weigert 2002). Hence no recent data have been published for this comparison, although new studies comparing Ltz plus gonadotropins versus gonadotropins only in GnRH protocols have been included (Elnashar 2016; Galal 2012; Mukherjee 2012). Most of the new trials included in this update evaluated CC or Ltz in poor responders, but only two trials reported live birth (Lee 2012; Ragni 2012).
In the general IVF population, the overall quality of evidence was low for live birth, OHSS, and cancellation rate and moderate for clinical pregnancy, gonadotropins requirement, and mean oocytes retrieved. The main limitations were risk of bias (due to unclear allocation concealment) and imprecision associated with low frequency of events. In the poor responder group, the overall quality of evidence was low for live birth, clinical pregnancy, and cancellation rate and moderate for gonadotropins requirement and numbers of oocytes retrieved. The evidence was limited by serious imprecision and risk of bias. We noted a high level of statistical heterogeneity for the outcomes of cancellation rate, gonadotropins dose, and oocytes retrieved, which was due to the use of different protocols and cancellation policies in the trials. We did not downgrade the level of evidence for inconsistency for gonadotropins usage and oocytes retrieved since the statistical heterogeneity referred to the magnitude of difference rather than direction of evidence.
Potential biases in the review process
We aimed to identify all eligible studies for this update. Whenever possible, we contacted study authors for additional information for potential inclusion in the review. However, for many conference abstracts, we had difficulty contacting authors and getting necessary information and data.
Agreements and disagreements with other studies or reviews
A recent systematic review evaluated the role of CC and Ltz during ovarian stimulation in women undergoing IVF (Bechtejew 2017). The review included 23 studies, and separate pooled results were available for women with expected poor response and women without risk of poor response. The live‐birth rate (RR 0.90, 95% CI 0.6 to 1.2) and clinical pregnancy rate (RR 1.02, 95% CI 0.8 to 1.4) did not differ significantly between the groups in poor responders, and mean consumption of gonadotropins was significantly lower following CC (MD ‐18, 95% CI ‐21 to ‐15) and Ltz (MD ‐35, 95% CI ‐47 to ‐23) protocol in the same population. In women who were not at risk of poor response, the live‐birth rate (RR 0.90, 95% CI 0.7 to 1.1) and clinical pregnancy rate (RR 1.00, 95% CI 0.9 to 1.2) did not differ significantly between the two groups. There was a significant difference in OHSS rate (Peto OR 0.20, 95% CI 0.1 to 0.3) and gonadotropins consumption following CC protocol. The findings of Bechtejew 2017 are in agreement with the current update for all important outcomes for a general IVF population and poor responders.
Another systematic review evaluated CC protocol versus standard GnRH protocol in poor responders and included three randomised trials and one quasi‐randomised trial (Song 2016). The pooled results did not show any significant difference in live birth (OR 0.71, 95% CI 0.22 to 2.29) and clinical pregnancy (OR 1.11, 95% CI 0.80 to 1.55) rates between the two groups. These findings are in agreement with the findings of the current review.

Study flow diagram.

Risk of bias graph: review authors' judgements about each risk of bias item presented as percentages across all included studies.
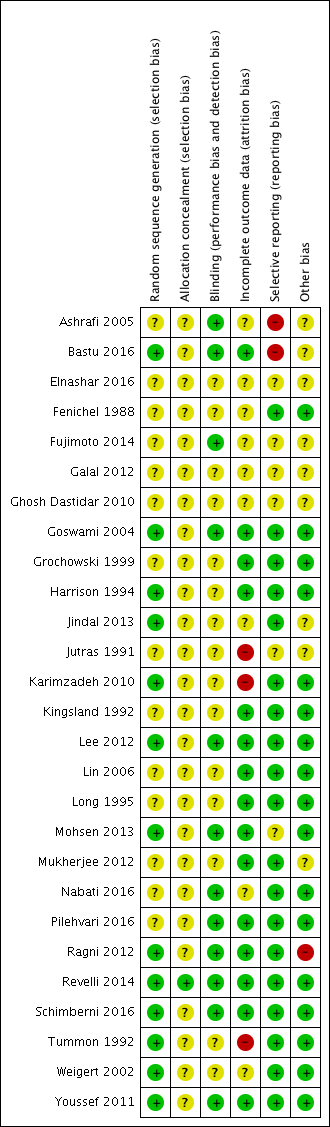
Risk of bias summary: review authors' judgements about each risk of bias item for each included study.

Forest plot of comparison: 1 Clomiphene citrate or letrozole with or without gonadotropins in conjunction with or without midcycle antagonist versus gonadotropins (with GnRH agonists or midcycle antagonist) in IVF and ICSI cycles in general population, outcome: 1.1 Live birth.

Forest plot of comparison: 1 Clomiphene citrate or letrozole with or without gonadotropins in conjunction with or without midcycle antagonist versus gonadotropins (with GnRH agonists or midcycle antagonist) in IVF and ICSI cycles in general population, outcome: 1.2 Ovarian hyperstimulation syndrome.

Funnel plot of comparison: 1 Clomiphene citrate or letrozole with gonadotropins in conjunction with or without midcycle antagonist versus gonadotropins with GnRH protocols in IVF and ICSI cycles in general population, outcome: 1.4 Clinical pregnancy rate.
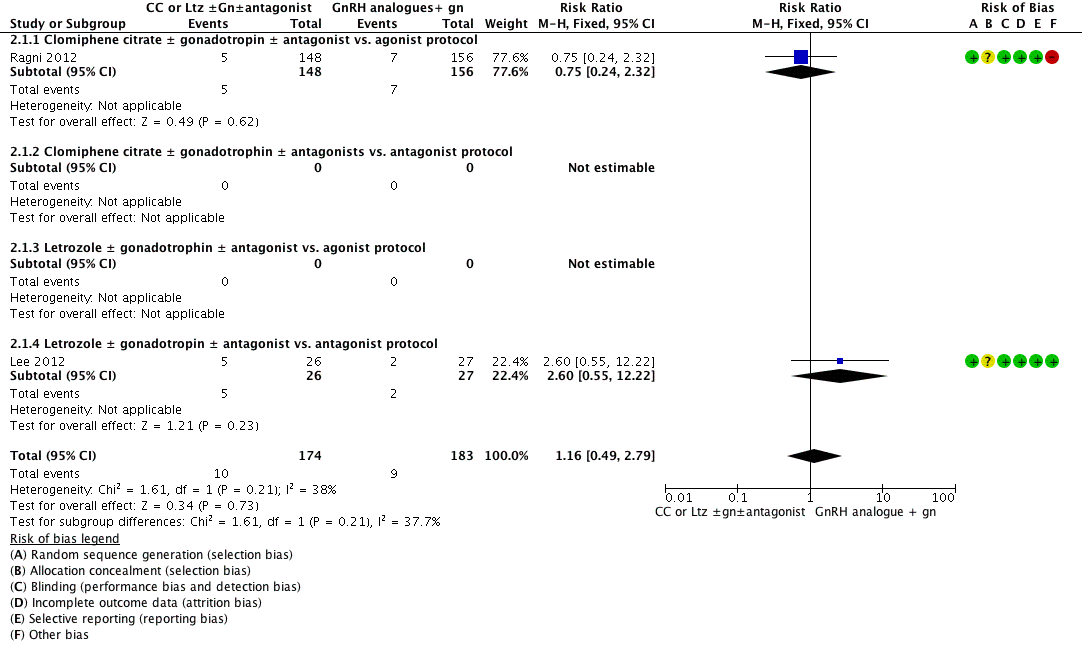
Forest plot of comparison: 2 Clomiphene citrate or letrozole with or without gonadotropins in conjunction with or without midcycle antagonist versus gonadotropins (with GnRH agonist or midcycle antagonist) in IVF and ICSI cycles in poor responders, outcome: 2.1 Live birth.

Comparison 1 Clomiphene citrate or letrozole with or without gonadotropins in conjunction with or without midcycle antagonist versus gonadotropins (with GnRH agonists or midcycle antagonist) in IVF and ICSI cycles in general population, Outcome 1 Live birth.

Comparison 1 Clomiphene citrate or letrozole with or without gonadotropins in conjunction with or without midcycle antagonist versus gonadotropins (with GnRH agonists or midcycle antagonist) in IVF and ICSI cycles in general population, Outcome 2 Ovarian hyperstimulation syndrome.
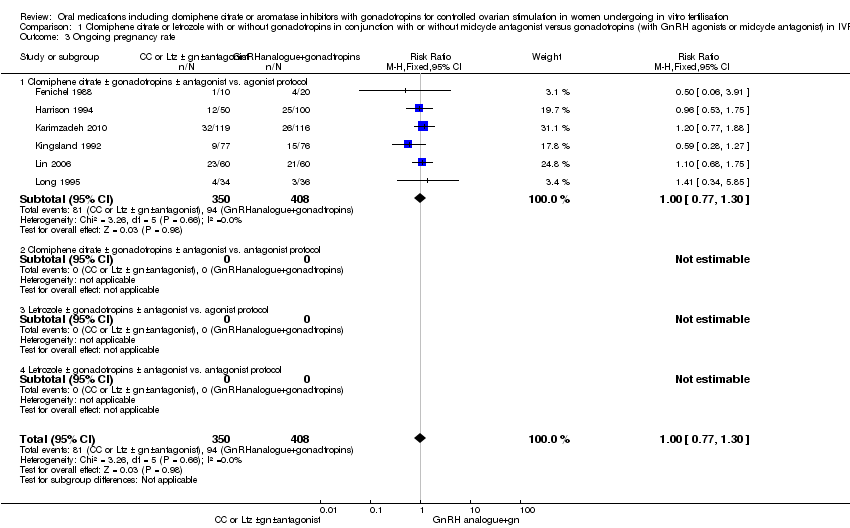
Comparison 1 Clomiphene citrate or letrozole with or without gonadotropins in conjunction with or without midcycle antagonist versus gonadotropins (with GnRH agonists or midcycle antagonist) in IVF and ICSI cycles in general population, Outcome 3 Ongoing pregnancy rate.

Comparison 1 Clomiphene citrate or letrozole with or without gonadotropins in conjunction with or without midcycle antagonist versus gonadotropins (with GnRH agonists or midcycle antagonist) in IVF and ICSI cycles in general population, Outcome 4 Clinical pregnancy rate.

Comparison 1 Clomiphene citrate or letrozole with or without gonadotropins in conjunction with or without midcycle antagonist versus gonadotropins (with GnRH agonists or midcycle antagonist) in IVF and ICSI cycles in general population, Outcome 5 Cancellation rate.

Comparison 1 Clomiphene citrate or letrozole with or without gonadotropins in conjunction with or without midcycle antagonist versus gonadotropins (with GnRH agonists or midcycle antagonist) in IVF and ICSI cycles in general population, Outcome 6 Mean number of ampoules used.
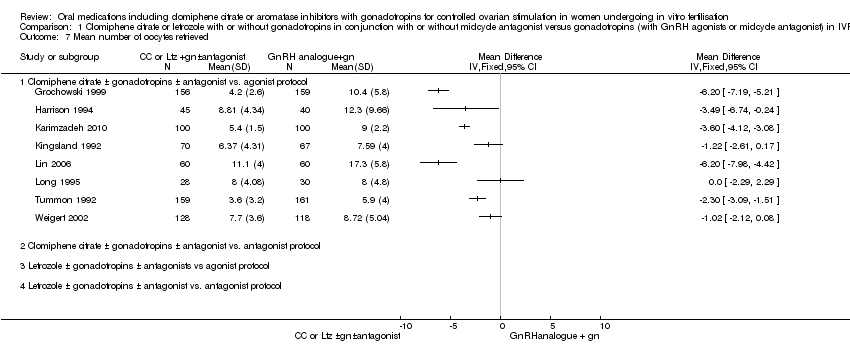
Comparison 1 Clomiphene citrate or letrozole with or without gonadotropins in conjunction with or without midcycle antagonist versus gonadotropins (with GnRH agonists or midcycle antagonist) in IVF and ICSI cycles in general population, Outcome 7 Mean number of oocytes retrieved.

Comparison 1 Clomiphene citrate or letrozole with or without gonadotropins in conjunction with or without midcycle antagonist versus gonadotropins (with GnRH agonists or midcycle antagonist) in IVF and ICSI cycles in general population, Outcome 8 Multiple pregnancy rate.

Comparison 1 Clomiphene citrate or letrozole with or without gonadotropins in conjunction with or without midcycle antagonist versus gonadotropins (with GnRH agonists or midcycle antagonist) in IVF and ICSI cycles in general population, Outcome 9 Rate of miscarriage.

Comparison 1 Clomiphene citrate or letrozole with or without gonadotropins in conjunction with or without midcycle antagonist versus gonadotropins (with GnRH agonists or midcycle antagonist) in IVF and ICSI cycles in general population, Outcome 10 Rate of ectopic pregnancy.

Comparison 1 Clomiphene citrate or letrozole with or without gonadotropins in conjunction with or without midcycle antagonist versus gonadotropins (with GnRH agonists or midcycle antagonist) in IVF and ICSI cycles in general population, Outcome 11 Rate of foetal abnormalities.

Comparison 2 Clomiphene citrate or letrozole with or without gonadotropins in conjunction with or without midcycle antagonist versus gonadotropins (with GnRH agonist or midcycle antagonist) in IVF and ICSI cycles in poor responders, Outcome 1 Live birth.
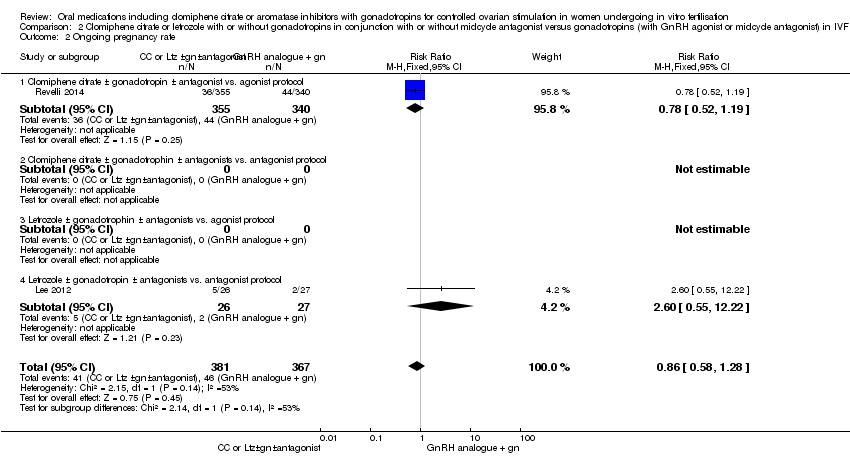
Comparison 2 Clomiphene citrate or letrozole with or without gonadotropins in conjunction with or without midcycle antagonist versus gonadotropins (with GnRH agonist or midcycle antagonist) in IVF and ICSI cycles in poor responders, Outcome 2 Ongoing pregnancy rate.

Comparison 2 Clomiphene citrate or letrozole with or without gonadotropins in conjunction with or without midcycle antagonist versus gonadotropins (with GnRH agonist or midcycle antagonist) in IVF and ICSI cycles in poor responders, Outcome 3 Clinical pregnancy rate.

Comparison 2 Clomiphene citrate or letrozole with or without gonadotropins in conjunction with or without midcycle antagonist versus gonadotropins (with GnRH agonist or midcycle antagonist) in IVF and ICSI cycles in poor responders, Outcome 4 Cancellation rate.

Comparison 2 Clomiphene citrate or letrozole with or without gonadotropins in conjunction with or without midcycle antagonist versus gonadotropins (with GnRH agonist or midcycle antagonist) in IVF and ICSI cycles in poor responders, Outcome 5 Mean number of ampoules used.

Comparison 2 Clomiphene citrate or letrozole with or without gonadotropins in conjunction with or without midcycle antagonist versus gonadotropins (with GnRH agonist or midcycle antagonist) in IVF and ICSI cycles in poor responders, Outcome 6 Mean number of oocytes retrieved..

Comparison 2 Clomiphene citrate or letrozole with or without gonadotropins in conjunction with or without midcycle antagonist versus gonadotropins (with GnRH agonist or midcycle antagonist) in IVF and ICSI cycles in poor responders, Outcome 7 Multiple pregnancy rate.

Comparison 2 Clomiphene citrate or letrozole with or without gonadotropins in conjunction with or without midcycle antagonist versus gonadotropins (with GnRH agonist or midcycle antagonist) in IVF and ICSI cycles in poor responders, Outcome 8 Rate of miscarriage.
| Clomiphene citrate or letrozole with or without gonadotropins (with or without midcycle antagonist) compared to gonadotropins (with GnRH agonists or midcycle antagonist) in IVF and ICSI cycles in general population for controlled ovarian stimulation | ||||||
| Patient or population: Women undergoing controlled ovarian stimulation in IVF and ICSI cycles (general population) | ||||||
| Outcomes | Anticipated absolute effects* (95% CI) | Relative effect | № of participants | Quality of the evidence | Comments | |
| Risk with gonadotropins (with GnRH agonists or midcycle antagonist) | Risk with clomiphene citrate or letrozole with or without gonadotropins (with or without midcycle antagonist) | |||||
| Live birth per woman | 235 per 1000 | 216 per 1000 | RR 0.92 | 493 | ⊕⊕⊝⊝ | |
| Ovarian hyperstimulation syndrome per woman | 63 per 1000 | 14 per 1000 | Peto OR 0.21 | 1067 | ⊕⊕⊝⊝ | |
| Clinical pregnancy rate per woman | 248 per 1000 | 248 per 1000 | RR 1.00 | 1998 | ⊕⊕⊕⊝ | |
| Cancellation rate per woman | 80 per 1000 | 150 per 1000 | RR 1.87 | 1784 | ⊕⊕⊝⊝ | |
| Mean number of gonadotropin ampoules used per woman | The mean number of ampoules used in the control group ranged from 18 to 50. | In all studies CC plus gonadotropins was associated with use of fewer ampoules. The mean difference ranged from 5.6 to 24.6 ampoules | ‐ | 1098 | ⊕⊕⊕⊝ | |
| Mean number of oocytes retrieved per woman | The mean number of oocytes retrieved in the control group ranged from 5 to 17. | In seven studies CC plus gonadotropins was associated with retrieval of fewer oocytes, with the mean difference ranging from 1.02 to 6.20 oocytes. The difference was statistically significant in five of these studies. The eighth study found no evidence of a difference between the groups | ‐ | 1481 | ⊕⊕⊕⊝ | |
| *The risk in the intervention group (and its 95% confidence interval) is based on the mean risk in the comparison group and the relative effect of the intervention (and its 95% CI). | ||||||
| GRADE Working Group grades of evidence | ||||||
| 1Downgraded one level (serious risk of bias). All included studies had unclear risk of bias for allocation concealment. | ||||||
| Clomiphene citrate or letrozole with or without gonadotropins (with or without midcycle antagonist) compared to gonadotropins (with GnRH agonist or midcycle antagonist) in IVF and ICSI cycles in poor responders for controlled ovarian stimulation | ||||||
| Patient or population: Women undergoing controlled ovarian stimulation in IVF and ICSI cycles (poor responders) | ||||||
| Outcomes | Anticipated absolute effects* (95% CI) | Relative effect | № of participants | Quality of the evidence | Comments | |
| Risk with gonadotropins (with GnRH agonist or midcycle antagonist) | Risk with clomiphene citrate or letrozole with or without gonadotropins (with or without midcycle antagonist) | |||||
| Live birth per woman | 49 per 1000 | 57 per 1000 | RR 1.16 | 357 | ⊕⊕⊝⊝ | |
| Clinical pregnancy rate per woman | 128 per 1000 | 109 per 1000 | RR 0.85 | 1462 | ⊕⊕⊝⊝ | |
| Cancellation rate per woman | 145 per 1000 | 212 per 1000 | RR 1.46 | 1601 | ⊕⊕⊝⊝ | |
| Mean number of gonadotropin ampoules used per woman | The mean number of ampoules used in the control group ranged from 39 to 71. | There were fewer ampoules used in the intervention groups (CC plus gonadotropins: MD ‐23.98, 95% CI ‐27.41 to ‐20.56; participants = 87; studies = 2); letrozole plus gonadotropins: MD ‐46.24, 95% CI ‐50.93 to ‐41.55; participants = 49; studies = 1). | ‐ | 136 | ⊕⊕⊕⊝ | |
| Mean number of oocytes retrieved per woman | The mean number oocytes retrieved in the control group ranged from 2 to 5. | In three of four studies CC plus gonadotropins versus gonadotropins in an agonist protocol was associated with retrieval of fewer oocytes, with the mean difference ranging from 0.75 to 2.10 oocytes. The difference was statistically significant in two of these studies. One study found no evidence of difference between CC plus gonadotropin versus gonadotropin in an antagonist protocol. Of three studies comparing letrozole plus gonadotrophins, one study reported significantly lower oocyte retrieval while the other two studies found no clear evidence of a difference. | ‐ | 1203 | ⊕⊕⊕⊝ | |
| *The risk in the intervention group (and its 95% confidence interval) is based on the mean risk in the comparison group and the relative effect of the intervention (and its 95% CI). | ||||||
| GRADE Working Group grades of evidence | ||||||
| 1Downgraded one level (serious risk of bias). Many of the included studies had unclear risk of bias for allocation concealment. | ||||||
| Study ID | Downregulation used | Type of FSH used | Starting dose of FSH | Dose of clomiphene citrateor letrozole | Cycle monitoring | Luteal support | Timing of hCG |
| Buserelin | hMG | 150 to 225 IU/day | 100 mg CC | Ultrasound | Progesterone | Leading follicle 17 mm | |
| Antagonist (cetrorelix subcutaneous) | hMG and recombinant FSH | hMG and recombinant FSH but in different doses: Group 1: 225 IU hMG + 225 IU rFSH Group 2: 150 IU hMG + 150 IU rFSH Group 3: 5mg Ltz + 150 IU rFSH | 5 mg Ltz | Ultrasound | Progesterone | Leading follicle > 17 mm | |
| Antagonist (ganirelix (Orgalutran) subcutaneous) for the Ltz group and triptorelin subcutaneous in the agonist control group | FSH | 75 IU for the Ltz group versus 150 to 225 IU for the control FSH/agonist group | 10 mg Ltz | Not mentioned | Not mentioned | Not mentioned | |
| Triptorelin intramuscular | hMG | hMG 125 to 300 IU/day | 200 mg CC | Ultrasound and oestradiol | hCG | Leading follicle 17 mm | |
| Ganirelix | hMG | Not mentioned | 100 mg CC | Not mentioned | Not mentioned | Not mentioned | |
| Not mentioned | hMG | 150 to 225 IU | 10 mg Ltz | Not mentioned | Not mentioned | Not mentioned | |
| Not mentioned | Recombinant FSH | 100 to 150 IU in the CC + gonadotropins group; 200 to 225 IU in the gonadotropins + GnRH agonist group) | Not mentioned | Not mentioned | Not mentioned | Not mentioned | |
| Triptorelin intramuscular depot | hMG | 150 to 225 IU/day | 100 mg CC | Ultrasound and oestradiol | Progesterone | Leading follicle 18 mm | |
| Triptorelin intramuscular and buserelin intranasal | hMG | 150 IU/day | 100 mg CC | Ultrasound and oestradiol | Progesterone | Leading follicle 17 mm | |
| Antagonist (cetrorelix subcutaneous) for the Ltz or CC group and GnRH agonist for the control group, type not mentioned | Not mentioned | Not mentioned | Not mentioned | Not mentioned | Not mentioned | Not mentioned | |
| Leuprorelin | hMG | 150 IU/day | 50 mg CC | Ultrasound and oestradiol | Not mentioned | Leading follicle 15 mm | |
| Buserelin | Recombinant FSH | 150 to 225 IU/day | 100 mg CC | Ultrasound | Progesterone | Leading follicle 18 mm | |
| Buserelin nasal spray | hMG | According to age (225 IU for women < 35 years and 300 IU for women > 35 years) | 100 mg CC | Ultrasound and oestradiol | hCG | Leading follicle 17 mm | |
| Antagonist (cetrorelix subcutaneous) | hMG | 225 IU | 2.5 mg Ltz | Ultrasound and oestradiol | Progesterone | Leading follicle 18 mm | |
| Antagonist (cetrorelix subcutaneous) | hMG | 150 to 300 IU/day | 100 mg CC | Ultrasound, serum oestradiol, LH, and progesterone | Progesterone | Leading follicle 18 mm | |
| Leuprorelin (Lupron) | hMG | 150 IU/day | 50 mg CC | Ultrasound and oestradiol | None | Leading follicle 15 mm | |
| Antagonist (cetrorelix subcutaneous) for the Ltz group and agonist (leuprorelin) for the conventional agonist group | hMG | 150 IU for the Ltz group versus 300 IU for the control hMG/agonist group | 2.5 mg Ltz | Ultrasound and oestradiol | Progesterone | 18 mm | |
| Antagonist (ganirelix (Orgalutran) subcutaneous) | Recombinant FSH | 75 IU for the Ltz group versus 150 to 225 IU for the control FSH/antagonist group | 5 mg Ltz | Ultrasound and oestradiol | Progesterone | 18 mm | |
| The type of antagonist used was not mentioned in the study while the agonist used in the control group was buserelin | Recombinant FSH | 300 IU for the Ltz group versus 450 IU for the control FSH/agonist group | 5 mg Ltz | Ultrasound | Progesterone | 17 mm | |
| Antagonist (cetrorelix subcutaneous) | hMG | 150 IU for the CC group versus 300 IU for the control hMG/antagonist group | 100 mg CC | Ultrasound | Progesterone | 17 to 18 mm | |
| Buserelin | Recombinant FSH | 450 IU | 150 mg CC | Ultrasound and oestradiol | Progesterone | 18 to 20 mm | |
| Antagonist (cetrorelix or ganirelix (Orgalutran) subcutaneous); agonist was leuprorelin | hMG | 150 IU for the CC group versus 300 to 450 IU for the control hMG/antagonist group | 100 mg CC | Ultrasound and oestradiol | Progesterone | 18 to 20 mm | |
| Antagonist (cetrorelix subcutaneous) | Recombinant FSH | 450 IU for both groups | 100 mg CC | Ultrasound and oestradiol | Progesterone | 18 mm | |
| Leuprorelin subcutaneous | hMG | According to body weight (less than 52 kg would start with 75 IU/day, 52 to 75 kg would start with 112.5 IU/day, and 150 IU/day for women who weighed more than 75 kg) | 100 mg CC | Ultrasound and oestradiol | Progesterone | Leading follicle 16 mm | |
| Buserelin | Recombinant FSH | 150 IU/day | 100 mg | Ultrasound | Progesterone | Leading follicle 18 mm | |
| Buserelin | hMG | 225 to 300 IU/day | 100 mg | Ultrasound | Progesterone | Not mentioned | |
| CC: clomiphene citrate | |||||||
| Outcome or subgroup title | No. of studies | No. of participants | Statistical method | Effect size |
| 1 Live birth Show forest plot | 4 | 493 | Risk Ratio (M‐H, Fixed, 95% CI) | 0.92 [0.66, 1.27] |
| 1.1 Clomiphene citrate ± gonadotropins ± antagonist vs. agonist protocol. | 4 | 493 | Risk Ratio (M‐H, Fixed, 95% CI) | 0.92 [0.66, 1.27] |
| 1.2 Clomiphene citrate ± gonadotropins ± antagonist vs. antagonist protocol | 0 | 0 | Risk Ratio (M‐H, Fixed, 95% CI) | 0.0 [0.0, 0.0] |
| 1.3 Letrozole ± gonadotropins ± antagonist vs. agonist protocol | 0 | 0 | Risk Ratio (M‐H, Fixed, 95% CI) | 0.0 [0.0, 0.0] |
| 1.4 Letrozole ± gonadotropins ± antagonist vs. antagonist protocol | 0 | 0 | Risk Ratio (M‐H, Fixed, 95% CI) | 0.0 [0.0, 0.0] |
| 2 Ovarian hyperstimulation syndrome Show forest plot | 5 | 1067 | Peto Odds Ratio (Peto, Fixed, 95% CI) | 0.21 [0.11, 0.41] |
| 2.1 Clomiphene citrate ± gonadotropins ± antagonist vs. agonist protocol | 4 | 973 | Peto Odds Ratio (Peto, Fixed, 95% CI) | 0.23 [0.11, 0.47] |
| 2.2 Clomiphene citrate ± gonadotropins ± antagonist vs. antagonist protocol | 0 | 0 | Peto Odds Ratio (Peto, Fixed, 95% CI) | 0.0 [0.0, 0.0] |
| 2.3 Letrozole ± gonadotropins ± antagonist vs. agonist protocol | 0 | 0 | Peto Odds Ratio (Peto, Fixed, 95% CI) | 0.0 [0.0, 0.0] |
| 2.4 Letrozole ± gonadotropins ± antagonist vs. antagonist protocol | 1 | 94 | Peto Odds Ratio (Peto, Fixed, 95% CI) | 0.14 [0.03, 0.68] |
| 3 Ongoing pregnancy rate Show forest plot | 6 | 758 | Risk Ratio (M‐H, Fixed, 95% CI) | 1.00 [0.77, 1.30] |
| 3.1 Clomiphene citrate ± gonadotropins ± antagonist vs. agonist protocol | 6 | 758 | Risk Ratio (M‐H, Fixed, 95% CI) | 1.00 [0.77, 1.30] |
| 3.2 Clomiphene citrate ± gonadotropins ± antagonist vs. antagonist protocol | 0 | 0 | Risk Ratio (M‐H, Fixed, 95% CI) | 0.0 [0.0, 0.0] |
| 3.3 Letrozole ± gonadotropins ± antagonist vs. agonist protocol | 0 | 0 | Risk Ratio (M‐H, Fixed, 95% CI) | 0.0 [0.0, 0.0] |
| 3.4 Letrozole ± gonadotropins ± antagonist vs. antagonist protocol | 0 | 0 | Risk Ratio (M‐H, Fixed, 95% CI) | 0.0 [0.0, 0.0] |
| 4 Clinical pregnancy rate Show forest plot | 12 | 1998 | Risk Ratio (M‐H, Fixed, 95% CI) | 1.00 [0.86, 1.16] |
| 4.1 Clomiphene citrate ± gonadotropins ± antagonist vs. agonist protocol | 9 | 1784 | Risk Ratio (M‐H, Fixed, 95% CI) | 1.04 [0.88, 1.23] |
| 4.2 Clomiphene citrate± gonadotropins ± antagonist vs. antagonist protocol | 0 | 0 | Risk Ratio (M‐H, Fixed, 95% CI) | 0.0 [0.0, 0.0] |
| 4.3 Letrozole ± gonadotropins ± antagonist vs. agonist protocol | 1 | 80 | Risk Ratio (M‐H, Fixed, 95% CI) | 0.29 [0.12, 0.72] |
| 4.4 Letrozole ± gonadotropins ± antagonist vs. antagonist protocol | 2 | 134 | Risk Ratio (M‐H, Fixed, 95% CI) | 1.17 [0.71, 1.94] |
| 5 Cancellation rate Show forest plot | 9 | 1784 | Risk Ratio (M‐H, Fixed, 95% CI) | 1.87 [1.43, 2.45] |
| 5.1 Clomiphene citrate ± gonadotropins ± antagonist vs. agonist protocol | 9 | 1784 | Risk Ratio (M‐H, Fixed, 95% CI) | 1.87 [1.43, 2.45] |
| 5.2 Clomiphene citrate ± gonadotropins ± antagonist vs. antagonist protocol | 0 | 0 | Risk Ratio (M‐H, Fixed, 95% CI) | 0.0 [0.0, 0.0] |
| 5.3 Letrozole ± gonadotropins ± antagonist vs. agonist protocol | 0 | 0 | Risk Ratio (M‐H, Fixed, 95% CI) | 0.0 [0.0, 0.0] |
| 5.4 Letrozole ± gonadotropins ± antagonist vs. antagonist protocol | 0 | 0 | Risk Ratio (M‐H, Fixed, 95% CI) | 0.0 [0.0, 0.0] |
| 6 Mean number of ampoules used Show forest plot | 6 | Mean Difference (IV, Fixed, 95% CI) | Totals not selected | |
| 6.1 Clomiphene citrate ± gonadotropins ± antagonist vs. agonist protocol | 6 | Mean Difference (IV, Fixed, 95% CI) | 0.0 [0.0, 0.0] | |
| 6.2 Clomiphene citrate ± gonadotropins ± antagonist vs. antagonist protocol | 0 | Mean Difference (IV, Fixed, 95% CI) | 0.0 [0.0, 0.0] | |
| 6.3 Letrozole ± gonadotropins ± antagonist vs. agonist protocol | 0 | Mean Difference (IV, Fixed, 95% CI) | 0.0 [0.0, 0.0] | |
| 6.4 Letrozole ± gonadotropins ± antagonists vs. antagonist protocol | 0 | Mean Difference (IV, Fixed, 95% CI) | 0.0 [0.0, 0.0] | |
| 7 Mean number of oocytes retrieved Show forest plot | 8 | Mean Difference (IV, Fixed, 95% CI) | Totals not selected | |
| 7.1 Clomiphene citrate ± gonadotropins ± antagonist vs. agonist protocol | 8 | Mean Difference (IV, Fixed, 95% CI) | 0.0 [0.0, 0.0] | |
| 7.2 Clomiphene citrate ± gonadotropins ± antagonist vs. antagonist protocol | 0 | Mean Difference (IV, Fixed, 95% CI) | 0.0 [0.0, 0.0] | |
| 7.3 Letrozole ± gonadotropins ± antagonists vs agonist protocol | 0 | Mean Difference (IV, Fixed, 95% CI) | 0.0 [0.0, 0.0] | |
| 7.4 Letrozole ± gonadotropins ± antagonist vs. antagonist protocol | 0 | Mean Difference (IV, Fixed, 95% CI) | 0.0 [0.0, 0.0] | |
| 8 Multiple pregnancy rate Show forest plot | 5 | 791 | Risk Ratio (M‐H, Fixed, 95% CI) | 0.74 [0.39, 1.43] |
| 8.1 Clomiphene citrate ± gonadotropins ± antagonist vs. agonist protocol | 4 | 697 | Risk Ratio (M‐H, Fixed, 95% CI) | 0.79 [0.40, 1.57] |
| 8.2 Clomiphene citrate ± gonadotropins ± antagonist vs. antagonist protocol | 0 | 0 | Risk Ratio (M‐H, Fixed, 95% CI) | 0.0 [0.0, 0.0] |
| 8.3 Letrozole ± gonadotropins ± antagonist vs. agonist protocol | 0 | 0 | Risk Ratio (M‐H, Fixed, 95% CI) | 0.0 [0.0, 0.0] |
| 8.4 Letrozole ± gonadotropins ± antagonist vs. antagonist protocol | 1 | 94 | Risk Ratio (M‐H, Fixed, 95% CI) | 0.41 [0.04, 3.82] |
| 9 Rate of miscarriage Show forest plot | 7 | 1116 | Risk Ratio (M‐H, Fixed, 95% CI) | 0.95 [0.61, 1.47] |
| 9.1 Clomiphene citrate ± gonadotropins ± antagonists vs. agonist protocol | 6 | 1022 | Risk Ratio (M‐H, Fixed, 95% CI) | 1.03 [0.61, 1.75] |
| 9.2 Clomiphene citrate ± gonadotropins ± antagonists vs. antagonist protocol | 0 | 0 | Risk Ratio (M‐H, Fixed, 95% CI) | 0.0 [0.0, 0.0] |
| 9.3 Letrozole ± gonadotropins ± antagonist vs. agonist protocol | 0 | 0 | Risk Ratio (M‐H, Fixed, 95% CI) | 0.0 [0.0, 0.0] |
| 9.4 Letrozole ± gonadotropins ± antagonists vs. antagonists protocol | 1 | 94 | Risk Ratio (M‐H, Fixed, 95% CI) | 0.76 [0.35, 1.66] |
| 10 Rate of ectopic pregnancy Show forest plot | 2 | 223 | Peto Odds Ratio (Peto, Fixed, 95% CI) | 7.56 [0.47, 120.94] |
| 10.1 Clomiphene citrate ± gonadotropins ± antagonist vs. agonist protocol | 2 | 223 | Peto Odds Ratio (Peto, Fixed, 95% CI) | 7.56 [0.47, 120.94] |
| 10.2 Clomiphene citrate ± gonadotrophins ± antagonists vs. antagonist protocol | 0 | 0 | Peto Odds Ratio (Peto, Fixed, 95% CI) | 0.0 [0.0, 0.0] |
| 10.3 Letrozole ± gonadotropins ± antagonists vs. agonists protocol | 0 | 0 | Peto Odds Ratio (Peto, Fixed, 95% CI) | 0.0 [0.0, 0.0] |
| 10.4 Letrozole ± gonadotropins ± antagonists vs. antagonist protocol | 0 | 0 | Peto Odds Ratio (Peto, Fixed, 95% CI) | 0.0 [0.0, 0.0] |
| 11 Rate of foetal abnormalities Show forest plot | 1 | 74 | Peto Odds Ratio (Peto, Fixed, 95% CI) | 0.0 [0.0, 0.0] |
| 11.1 Clomiphene citrate ± gonadotropins ± antagonists vs. GnRHagonists or antagonist protocol | 1 | 74 | Peto Odds Ratio (Peto, Fixed, 95% CI) | 0.0 [0.0, 0.0] |
| 11.2 Letrozole ± gonadotropins ± antagonists vs. GnRH agonist or antagonist protocol | 0 | 0 | Peto Odds Ratio (Peto, Fixed, 95% CI) | 0.0 [0.0, 0.0] |
| Outcome or subgroup title | No. of studies | No. of participants | Statistical method | Effect size |
| 1 Live birth Show forest plot | 2 | 357 | Risk Ratio (M‐H, Fixed, 95% CI) | 1.16 [0.49, 2.79] |
| 1.1 Clomiphene citrate ± gonadotropin ± antagonist vs. agonist protocol | 1 | 304 | Risk Ratio (M‐H, Fixed, 95% CI) | 0.75 [0.24, 2.32] |
| 1.2 Clomiphene citrate ± gonadotrophin ± antagonists vs. antagonist protocol | 0 | 0 | Risk Ratio (M‐H, Fixed, 95% CI) | 0.0 [0.0, 0.0] |
| 1.3 Letrozole ± gonadotrophin ± antagonist vs. agonist protocol | 0 | 0 | Risk Ratio (M‐H, Fixed, 95% CI) | 0.0 [0.0, 0.0] |
| 1.4 Letrozole ± gonadotropin ± antagonist vs. antagonist protocol | 1 | 53 | Risk Ratio (M‐H, Fixed, 95% CI) | 2.60 [0.55, 12.22] |
| 2 Ongoing pregnancy rate Show forest plot | 2 | 748 | Risk Ratio (M‐H, Fixed, 95% CI) | 0.86 [0.58, 1.28] |
| 2.1 Clomiphene citrate ± gonadotropin ± antagonist vs. agonist protocol | 1 | 695 | Risk Ratio (M‐H, Fixed, 95% CI) | 0.78 [0.52, 1.19] |
| 2.2 Clomiphene citrate ± gonadotrophin ± antagonists vs. antagonist protocol | 0 | 0 | Risk Ratio (M‐H, Fixed, 95% CI) | 0.0 [0.0, 0.0] |
| 2.3 Letrozole ± gonadotrophin ± antagonists vs. agonist protocol | 0 | 0 | Risk Ratio (M‐H, Fixed, 95% CI) | 0.0 [0.0, 0.0] |
| 2.4 Letrozole ± gonadotropin ± antagonists vs. antagonist protocol | 1 | 53 | Risk Ratio (M‐H, Fixed, 95% CI) | 2.60 [0.55, 12.22] |
| 3 Clinical pregnancy rate Show forest plot | 8 | 1462 | Risk Ratio (M‐H, Fixed, 95% CI) | 0.85 [0.64, 1.12] |
| 3.1 Clomiphene citrate ± gonadotropins ± antagonist vs. agonist protocol | 3 | 1069 | Risk Ratio (M‐H, Fixed, 95% CI) | 0.91 [0.66, 1.27] |
| 3.2 Clomiphene citrate ± gonadotrophin ± antagonists vs. antagonists protocol | 1 | 77 | Risk Ratio (M‐H, Fixed, 95% CI) | 0.83 [0.05, 12.84] |
| 3.3 Letrozole ± gonadotropin ± antagonists vs. agonists protocol | 3 | 221 | Risk Ratio (M‐H, Fixed, 95% CI) | 0.57 [0.29, 1.13] |
| 3.4 Letrozole ± gonadotropin ± antagonists vs. antagonists protocol | 1 | 95 | Risk Ratio (M‐H, Fixed, 95% CI) | 1.04 [0.38, 2.86] |
| 4 Cancellation rate Show forest plot | 10 | 1601 | Risk Ratio (M‐H, Fixed, 95% CI) | 1.46 [1.18, 1.81] |
| 4.1 Clomiphene citrate ± gonadotropin ± antagonist vs. agonist protocol | 4 | 1155 | Risk Ratio (M‐H, Fixed, 95% CI) | 1.59 [1.20, 2.10] |
| 4.2 Clomiphene citrate ± gonadotropin ± antagonists vs. antagonists protocol | 1 | 77 | Risk Ratio (M‐H, Fixed, 95% CI) | 0.78 [0.39, 1.53] |
| 4.3 Letrozole ± gonadotropin ± antagonist vs. agonists protocol | 3 | 221 | Risk Ratio (M‐H, Fixed, 95% CI) | 1.86 [1.10, 3.13] |
| 4.4 Letrozole ± gonadotropin ± antagonists vs. antagonists protocol | 2 | 148 | Risk Ratio (M‐H, Fixed, 95% CI) | 1.17 [0.67, 2.01] |
| 5 Mean number of ampoules used Show forest plot | 3 | Mean Difference (IV, Fixed, 95% CI) | Subtotals only | |
| 5.1 Clomiphene citrate ± gonadotropin ± antagonists vs. agonist protocol | 2 | 87 | Mean Difference (IV, Fixed, 95% CI) | ‐23.98 [‐27.41, ‐20.56] |
| 5.2 Clomiphene citrate ± gonadotrophin ± antagonist vs. antagonist protocol | 0 | 0 | Mean Difference (IV, Fixed, 95% CI) | 0.0 [0.0, 0.0] |
| 5.3 Letrozole ± gonadotropin ± antagonist vs. agonist protocol | 1 | 49 | Mean Difference (IV, Fixed, 95% CI) | ‐46.24 [‐50.93, ‐41.55] |
| 5.4 Letrozole ± gonadotrophin ± antagonist vs. antagonist protocol | 0 | 0 | Mean Difference (IV, Fixed, 95% CI) | 0.0 [0.0, 0.0] |
| 6 Mean number of oocytes retrieved. Show forest plot | 8 | Mean Difference (IV, Fixed, 95% CI) | Totals not selected | |
| 6.1 Clomiphene citrate ± gonadotropin ± antagonists vs. agonist protocol | 4 | Mean Difference (IV, Fixed, 95% CI) | 0.0 [0.0, 0.0] | |
| 6.2 Clomiphene citrate ± gonadotropin ± antagonist vs. antagonist protocol | 1 | Mean Difference (IV, Fixed, 95% CI) | 0.0 [0.0, 0.0] | |
| 6.3 Letrozole ± gonadotropin ± antagonists vs. agonist protocol | 3 | Mean Difference (IV, Fixed, 95% CI) | 0.0 [0.0, 0.0] | |
| 6.4 Letrozole ± gonadotropin ± antagonists vs. antagonist protocol | 0 | Mean Difference (IV, Fixed, 95% CI) | 0.0 [0.0, 0.0] | |
| 7 Multiple pregnancy rate Show forest plot | 1 | 304 | Risk Ratio (M‐H, Fixed, 95% CI) | 0.53 [0.05, 5.75] |
| 7.1 Clomiphene citrate ± gonadotropin ± antagonist vs. agonist protocol | 1 | 304 | Risk Ratio (M‐H, Fixed, 95% CI) | 0.53 [0.05, 5.75] |
| 7.2 Clomiphene citrate ± gonadotrophin ± antagonist vs. antagonist protocol | 0 | 0 | Risk Ratio (M‐H, Fixed, 95% CI) | 0.0 [0.0, 0.0] |
| 7.3 Letrozole ± gonadotrophin ± antagonist vs. agonist protocol | 0 | 0 | Risk Ratio (M‐H, Fixed, 95% CI) | 0.0 [0.0, 0.0] |
| 7.4 Letrozole ± gonadotrophin ± antagonist vs. antagonist protocol | 0 | 0 | Risk Ratio (M‐H, Fixed, 95% CI) | 0.0 [0.0, 0.0] |
| 8 Rate of miscarriage Show forest plot | 3 | 818 | Risk Ratio (M‐H, Fixed, 95% CI) | 0.97 [0.45, 2.12] |
| 8.1 Clomiphene citrate ± gonadotropin ± antagonists vs. agonist protocol | 2 | 765 | Risk Ratio (M‐H, Fixed, 95% CI) | 1.28 [0.55, 3.01] |
| 8.2 Clomiphene citrate ± gonadotrophin ± antagonist vs. antagonist protocol | 0 | 0 | Risk Ratio (M‐H, Fixed, 95% CI) | 0.0 [0.0, 0.0] |
| 8.3 Letrozole ± gonadotrophin ± antagonist vs. agonist protocol | 0 | 0 | Risk Ratio (M‐H, Fixed, 95% CI) | 0.0 [0.0, 0.0] |
| 8.4 Letrozole ± gonadotropin ± antagonists vs. antagonist protocol | 1 | 53 | Risk Ratio (M‐H, Fixed, 95% CI) | 0.15 [0.01, 2.73] |