Administración intrauterina de la gonadotrofina coriónica humana (hCG) para pacientes subfértiles sometidas a reproducción asistida
Información
- DOI:
- https://doi.org/10.1002/14651858.CD011537.pub2Copiar DOI

- Base de datos:
-
- Cochrane Database of Systematic Reviews
- Versión publicada:
-
- 19 mayo 2016see what's new
- Tipo:
-
- Intervention
- Etapa:
-
- Review
- Grupo Editorial Cochrane:
-
Grupo Cochrane de Ginecología y fertilidad
- Copyright:
-
- Copyright © 2016 The Cochrane Collaboration. Published by John Wiley & Sons, Ltd.
Cifras del artículo
Altmetric:
Citado por:
Autores
Contributions of authors
LC and NT performed the literature search, assessed the studies for eligibility and extracted the data.
LC performed the analyses and drafted the review.
NT, AC and NRF provided feedback and edited the review.
All authors agree with the final version of the review.
Sources of support
Internal sources
-
None, Other.
External sources
-
None, Other.
Declarations of interest
None of the authors have any conflicts of interest to disclose.
Acknowledgements
We thank Helen Nagels (Managing Editor), Marian Showell (Trials Search Co‐ordinator), and the editorial board of the Cochrane Gynaecology and Fertility Group for their invaluable assistance in developing this review.
Version history
| Published | Title | Stage | Authors | Version |
| 2018 Oct 20 | Intrauterine administration of human chorionic gonadotropin (hCG) for subfertile women undergoing assisted reproduction | Review | Laurentiu Craciunas, Nikolaos Tsampras, Nick Raine‐Fenning, Arri Coomarasamy | |
| 2016 May 19 | Intrauterine administration of human chorionic gonadotropin (hCG) for subfertile women undergoing assisted reproduction | Review | Laurentiu Craciunas, Nikolaos Tsampras, Arri Coomarasamy, Nick Raine‐Fenning | |
| 2015 Feb 14 | Intrauterine administration of human chorionic gonadotropin (hCG) for subfertile women undergoing assisted reproduction | Protocol | Laurentiu Craciunas, Nikolaos Tsampras, Arri Coomarasamy, Nick Raine‐Fenning | |
Differences between protocol and review
Slight narrowing of the Cochrane Gynaecology and Fertility Group Specialised Register search strategy.
We performed a subgroup analysis based on IC‐hCG dose to address the heterogeneity.
For outcomes with event rates below 1%, we used the Peto one‐step odds ratio (OR) method to calculate the combined outcome with 95% confidence interval.
If a study included multiple treatment arms receiving different doses of hCG, we split the control group proportionally with the experimental groups in order to avoid analysing control participants in duplicate.
Keywords
MeSH
Medical Subject Headings (MeSH) Keywords
- Abortion, Spontaneous [epidemiology, etiology];
- Chorionic Gonadotropin [*administration & dosage];
- Embryo Implantation [drug effects];
- *Embryo Transfer [adverse effects, statistics & numerical data];
- Infertility, Female [*drug therapy];
- Live Birth [epidemiology];
- Pregnancy Rate;
- Reproductive Control Agents [*administration & dosage];
- Uterus;
Medical Subject Headings Check Words
Adult; Female; Humans; Pregnancy;
PICO

Study flow diagram.
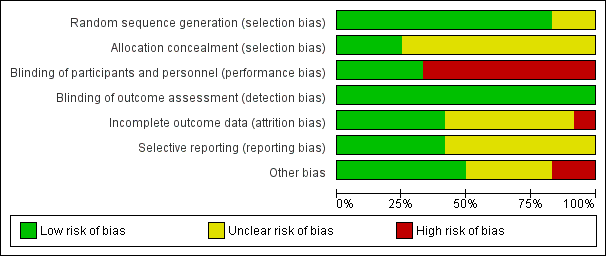
Risk of bias graph: review authors' judgements about each risk of bias item presented as percentages across all included studies.

Risk of bias summary: review authors' judgements about each risk of bias item for each included study.

Forest plot of comparison: 1 Intrauterine human chorionic gonadotropin (hCG) versus no hCG, outcome: 1.1 Live birth.
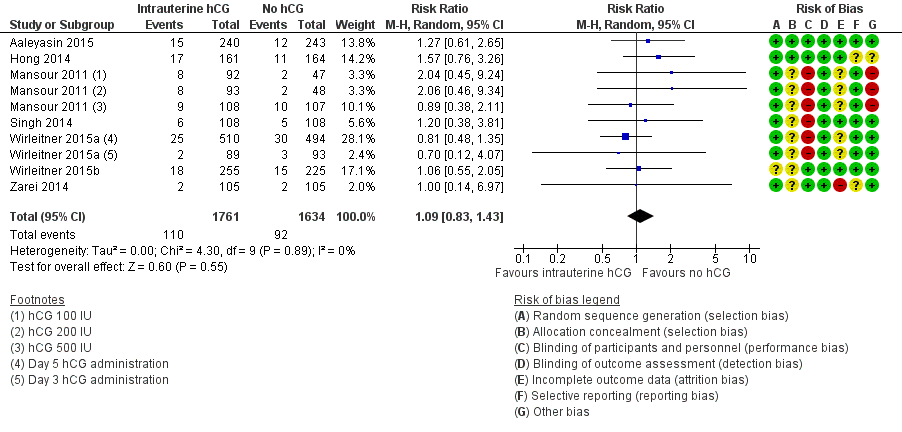
Forest plot of comparison: 1 Intrauterine human chorionic gonadotropin (hCG) versus no hCG, outcome: 1.2 Miscarriage.

Forest plot of comparison: 1 Intrauterine human chorionic gonadotropin (hCG) versus no hCG, outcome: 1.4 Clinical pregnancy.
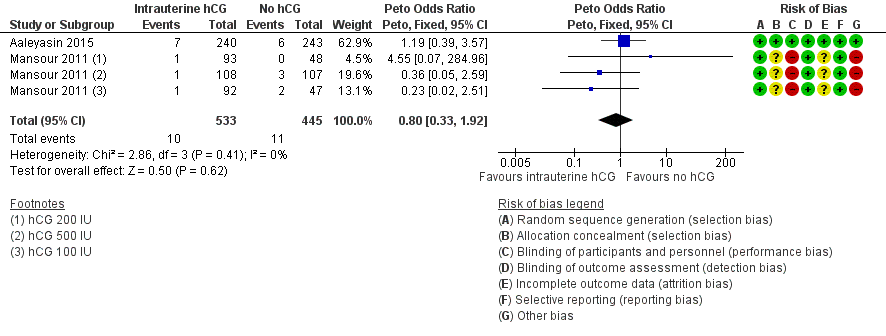
Forest plot of comparison: 1 Intrauterine human chorionic gonadotropin (hCG) versus no hCG, outcome: 1.5 Complications: intrauterine death.
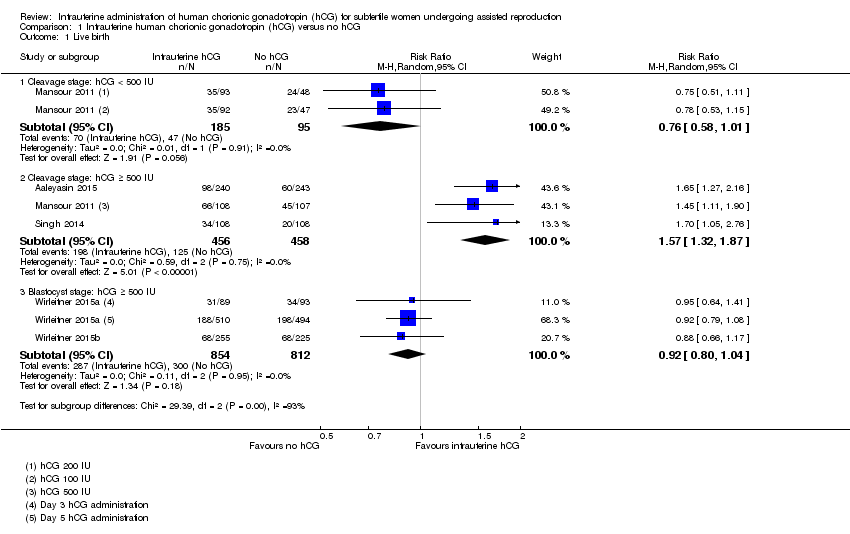
Comparison 1 Intrauterine human chorionic gonadotropin (hCG) versus no hCG, Outcome 1 Live birth.
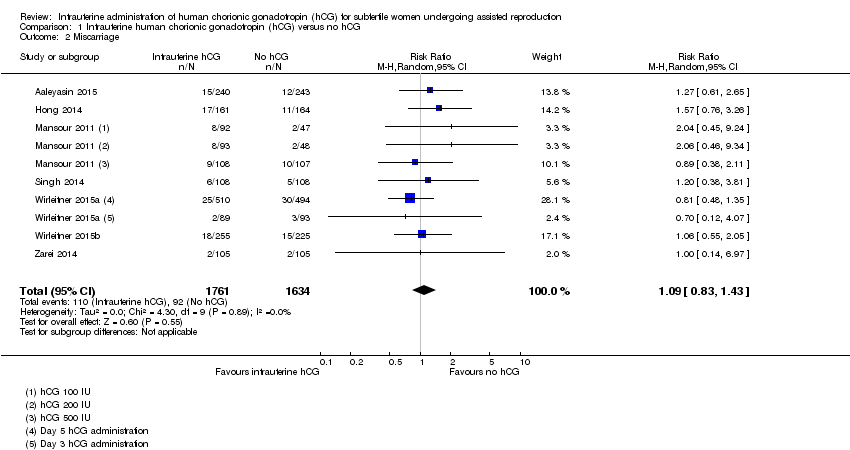
Comparison 1 Intrauterine human chorionic gonadotropin (hCG) versus no hCG, Outcome 2 Miscarriage.
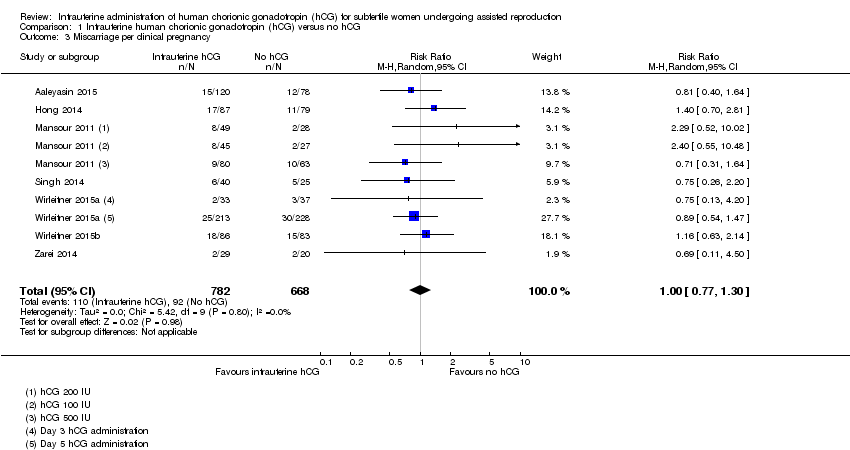
Comparison 1 Intrauterine human chorionic gonadotropin (hCG) versus no hCG, Outcome 3 Miscarriage per clinical pregnancy.

Comparison 1 Intrauterine human chorionic gonadotropin (hCG) versus no hCG, Outcome 4 Clinical pregnancy.

Comparison 1 Intrauterine human chorionic gonadotropin (hCG) versus no hCG, Outcome 5 Complications: intrauterine death.
| Intrauterine administration of hCG for women undergoing assisted reproduction | |||||
| Population: women undergoing assisted reproduction | |||||
| Outcomes | Illustrative comparative risks* (95% CI) | Relative effect | No of participants | Quality of the evidence | |
| Assumed risk | Corresponding risk | ||||
| Control | Intrauterine administration of hCG | ||||
| Live birth ‐ cleavage stage: hCG < 500 IU | 495 per 1000 | 376 per 1000 | RR 0.76 | 280 | ⊕⊝⊝⊝ |
| Live birth ‐ cleavage stage: hCG ≥ 500 IU | 247 per 1000 | 388 per 1000 | RR 1.57 | 914 | ⊕⊕⊕⊝ |
| Live birth ‐ blastocyst stage: hCG ≥ 500 IU | 366 per 1000 | 337 per 1000 | RR 0.92 | 1666 | ⊕⊕⊕⊝ |
| Pregnancy ‐ cleavage stage: hCG < 500 IU | 579 per 1000 | 509 per 1000 (405 to 637) | RR 0.88 (0.70 to 1.10) | 280 | ⊕⊝⊝⊝ |
| Pregnancy ‐ cleavage stage: hCG ≥ 500 IU | 321 per 1000 | 453 per 1000 (401 to 507) | RR 1.41 (1.25 to 1.58) | 1414 (7 studies) | ⊕⊕⊕⊝ |
| Pregnancy ‐ blastocyst stage: hCG ≥ 500 IU | 430 per 1000 | 408 per 1000 (370 to 455) | RR 0.95 (0.86 to 1.06) | 1991 (3 studies) | ⊕⊕⊕⊝ |
| Miscarriage Follow‐up: mean 40 weeks | 48 per 1000 | 52 per 1000 (40 to 68) | RR 1.09 (0.83 to 1.43) | 3395 (7 studies) | ⊕⊝⊝⊝ |
| Other complications | Other complications reported in the included studies were ectopic pregnancy (3 studies, n = 915, 3 events overall), heterotopic pregnancy (1 study, n = 495, 1 event), intrauterine death (2 studies, n = 978, 21 events) and triplets (1 study, n = 48, 3 events). There were too few events to allow any conclusions to be drawn | ⊕⊝⊝⊝ | |||
| *The basis for the assumed risk is the median control group risk across studies. The corresponding risk (and its 95% confidence interval) is based on the assumed risk in the comparison group and the relative effect of the intervention (and its 95% CI). | |||||
| GRADE Working Group grades of evidence | |||||
| 1 Downgraded two levels due to very serious risk of bias: lack of blinding of participants and personnel, no clear description of allocation concealment and premature termination of the study following interim analysis. | |||||
| Outcome or subgroup title | No. of studies | No. of participants | Statistical method | Effect size |
| 1 Live birth Show forest plot | 5 | Risk Ratio (M‐H, Random, 95% CI) | Subtotals only | |
| 1.1 Cleavage stage: hCG < 500 IU | 1 | 280 | Risk Ratio (M‐H, Random, 95% CI) | 0.76 [0.58, 1.01] |
| 1.2 Cleavage stage: hCG ≥ 500 IU | 3 | 914 | Risk Ratio (M‐H, Random, 95% CI) | 1.57 [1.32, 1.87] |
| 1.3 Blastocyst stage: hCG ≥ 500 IU | 2 | 1666 | Risk Ratio (M‐H, Random, 95% CI) | 0.92 [0.80, 1.04] |
| 2 Miscarriage Show forest plot | 7 | 3395 | Risk Ratio (M‐H, Random, 95% CI) | 1.09 [0.83, 1.43] |
| 3 Miscarriage per clinical pregnancy Show forest plot | 7 | 1450 | Risk Ratio (M‐H, Random, 95% CI) | 1.00 [0.77, 1.30] |
| 4 Clinical pregnancy Show forest plot | 10 | Risk Ratio (M‐H, Random, 95% CI) | Subtotals only | |
| 4.1 Cleavage stage: hCG < 500 IU | 1 | 280 | Risk Ratio (M‐H, Random, 95% CI) | 0.88 [0.70, 1.10] |
| 4.2 Cleavage stage: hCG ≥ 500 IU | 7 | 1414 | Risk Ratio (M‐H, Random, 95% CI) | 1.41 [1.25, 1.58] |
| 4.3 Blastocyst stage: hCG ≥ 500 IU | 3 | 1991 | Risk Ratio (M‐H, Random, 95% CI) | 0.95 [0.86, 1.06] |
| 5 Complications: intrauterine death Show forest plot | 2 | 978 | Peto Odds Ratio (Peto, Fixed, 95% CI) | 0.80 [0.33, 1.92] |