Cirugía asistida por robot en ginecología
Información
- DOI:
- https://doi.org/10.1002/14651858.CD011422Copiar DOI

- Base de datos:
-
- Cochrane Database of Systematic Reviews
- Versión publicada:
-
- 10 diciembre 2014see what's new
- Tipo:
-
- Intervention
- Etapa:
-
- Review
- Grupo Editorial Cochrane:
-
Grupo Cochrane de Cáncer ginecológico, neurooncología y otros cánceres
- Copyright:
-
- Copyright © 2016 The Cochrane Collaboration. Published by John Wiley & Sons, Ltd.
Cifras del artículo
Altmetric:
Citado por:
Autores
Contributions of authors
For the update, TL selected studies, extracted and entered data and prepared the first draft of the review. DL selected studies, extracted data, checked data entry and contributed to the text. HL contributed to the text of the review, including interpretation of findings. All review authors approved the final version. For contributions of authors to the original reviews, see Liu 2012 and Lu 2012.
Sources of support
Internal sources
-
Department of Obstetrics & Gynaecology, West China Second University Hospital, Sichuan University, China, Other.
External sources
-
No sources of support supplied
Declarations of interest
The review authors have reported no known conflicts of interest.
Acknowledgements
We are grateful for the contributions of Drs Zhihong Liu, Dan Liu and Xiaoyang Zhou to the original review. We also thank Jo Morrison for providing clinical and editorial advice, Jane Hayes for designing the search strategy and Gail Quinn and Clare Jess for making contributions to the editorial process.
The National Institute for Health Research (NIHR) is the largest single funding body of the Cochrane Gynaecological Cancer Group. The views and opinions expressed herein are those of the review authors and do not necessarily reflect those of the NIHR, the National Health Service (NHS) or the Department of Health.
Version history
| Published | Title | Stage | Authors | Version |
| 2019 Apr 15 | Robot‐assisted surgery in gynaecology | Review | Theresa A Lawrie, Hongqian Liu, DongHao Lu, Therese Dowswell, Huan Song, Lei Wang, Gang Shi | |
| 2014 Dec 10 | Robot‐assisted surgery in gynaecology | Review | Hongqian Liu, Theresa A Lawrie, DongHao Lu, Huan Song, Lei Wang, Gang Shi | |
Differences between protocol and review
This updated review provides a combined update of two originally separate reviews of robot‐assisted surgery for benign and malignant gynaecological disease (Liu 2012 and Lu 2012). The original reviews were conducted by the same review author team, and the methodology of these reviews was similar. The Trial Search Co‐ordinator for the Cochrane Gynaecological Cancer Group, Jane Hayes, designed a new combined search strategy to capture all eligible records for the updated combined review. Differences between the methods of the original reviews and the combined review include the following changes to the updated review.
-
Primary outcomes are intraoperative and postoperative complications, with QoL and survival outcomes moved to secondary outcomes.
-
Outcomes related to surgeons' performance and workload assessment were added.
-
Risk ratios instead of odds ratios were calculated for meta‐analyses of dichotomous data.
-
Data have been subgrouped according to type of procedure.
Keywords
MeSH
Medical Subject Headings (MeSH) Keywords
Medical Subject Headings Check Words
Female; Humans;
PICO

Study flow diagram for updated searches (30 June 2014).

Risk of bias summary: review authors' judgements about each risk of bias item for each included study.

Intraoperative and postoperative complications, with Martinez‐Maestro 2014 included.


Comparison 1 Robot‐assisted surgery versus conventional laparoscopic surgery, Outcome 1 Intraoperative and postoperative complications.

Comparison 1 Robot‐assisted surgery versus conventional laparoscopic surgery, Outcome 2 Intraoperative complications.

Comparison 1 Robot‐assisted surgery versus conventional laparoscopic surgery, Outcome 3 Sensitivity analysis: intraoperative complications.

Comparison 1 Robot‐assisted surgery versus conventional laparoscopic surgery, Outcome 4 Complications: intraoperative injury.

Comparison 1 Robot‐assisted surgery versus conventional laparoscopic surgery, Outcome 5 Postoperative complications.

Comparison 1 Robot‐assisted surgery versus conventional laparoscopic surgery, Outcome 6 Sensitivity analysis: postoperative complications.

Comparison 1 Robot‐assisted surgery versus conventional laparoscopic surgery, Outcome 7 Complications: bleeding.

Comparison 1 Robot‐assisted surgery versus conventional laparoscopic surgery, Outcome 8 Complications: infection.

Comparison 1 Robot‐assisted surgery versus conventional laparoscopic surgery, Outcome 9 Total operating time.
![Comparison 1 Robot‐assisted surgery versus conventional laparoscopic surgery, Outcome 10 Operating room time [min].](/es/cdsr/doi/10.1002/14651858.CD011422/media/CDSR/CD011422/rel0001/CD011422/image_n/nCD011422-CMP-001-10.png)
Comparison 1 Robot‐assisted surgery versus conventional laparoscopic surgery, Outcome 10 Operating room time [min].

Comparison 1 Robot‐assisted surgery versus conventional laparoscopic surgery, Outcome 11 Overall hospital stay.
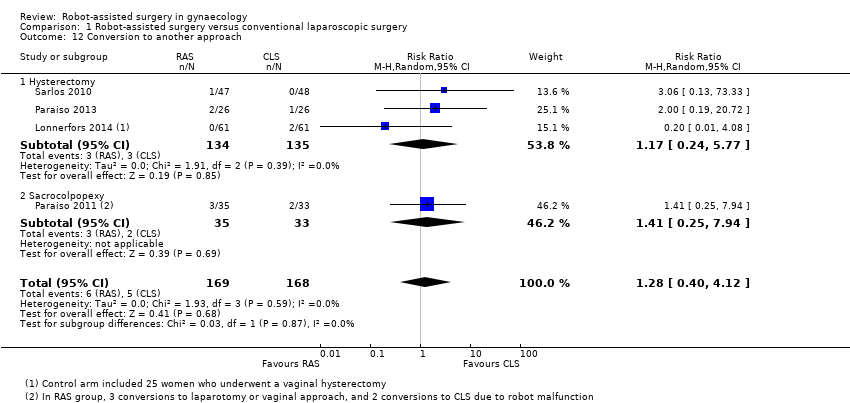
Comparison 1 Robot‐assisted surgery versus conventional laparoscopic surgery, Outcome 12 Conversion to another approach.

Comparison 1 Robot‐assisted surgery versus conventional laparoscopic surgery, Outcome 13 Blood transfusions.

Comparison 1 Robot‐assisted surgery versus conventional laparoscopic surgery, Outcome 14 Estimated blood loss.

Comparison 1 Robot‐assisted surgery versus conventional laparoscopic surgery, Outcome 15 Pain at 1 to 2 weeks.

Comparison 1 Robot‐assisted surgery versus conventional laparoscopic surgery, Outcome 16 Quality of life (6 weeks).

Comparison 1 Robot‐assisted surgery versus conventional laparoscopic surgery, Outcome 17 Quality of life (6 months).

Comparison 1 Robot‐assisted surgery versus conventional laparoscopic surgery, Outcome 18 Reintervention.

Comparison 1 Robot‐assisted surgery versus conventional laparoscopic surgery, Outcome 19 Readmission.

Comparison 1 Robot‐assisted surgery versus conventional laparoscopic surgery, Outcome 20 Overall cost.
| Robot‐assisted surgery (RAS) compared with conventional laparoscopic surgery (CLS) for gynaecological disease | ||||||
| Patient or population: women with benign gynaecological disease requiring surgery Settings: hospital Intervention: RAS Comparison: CLS | ||||||
| Outcomes | Illustrative comparative risksa (95% CI) | Relative effect | Number of participants | Quality of the evidence | Comments | |
| Assumed risk | Corresponding risk | |||||
| CLS | RAS | |||||
| Intraoperative and postoperative complications | All procedures (subgroups were similar) | RR 0.95 (0.46 to 1.99) | 513 (6) | ⊕⊕⊝⊝ | Downgraded because of inconsistency (I2 = 74%) and imprecision. Early studies favoured CLS, whereas later studies favoured RAS but had other limitations | |
| 19 per 100 | 18 per 100 (9 to 38) | |||||
| Intraoperative complications only | All procedures (subgroups were similar) | RR 1.71 (0.83 to 3.52) | 337 (4) | ⊕⊕⊝⊝ | Downgraded because of imprecision and study limitations (2 early studies contributed 16/17 adverse events in the RAS arm). Sensitivity analyses suggest that effect estimate is likely to change | |
| 6 per 100 | 10 per 100 | |||||
| Postoperative complications only | Hysterectomy | RR 0.62 (0.30 to 1.29) RR 3.54 (1.31 to 9.56) | 315 (3) 68 (1) | ⊕⊕⊝⊝ ⊕⊝⊝⊝ | Downgraded because of imprecision and study limitations. Early studies tend to favour CLS, whereas later studies favour RAS but had other limitations Only 1 small, early study reported data, which included urinary tract infections | |
| 16 per 100 | 10 per 100 | |||||
| Sacrocolpopexy | ||||||
| 12 per 100 | 42 per 100 | |||||
| Intraoperative injury | All procedures (subgroups were similar) | RR 1.23 (0.44 to 3.46) | 415 (5) | ⊕⊕⊕⊝ | Downgraded because of imprecision | |
| 3 per 100 | 4 per 100 (1 to 10) | |||||
| Total operating time (minutes) | Mean total operating time ranged across control groups from | Mean total operating time in the intervention groups ranged from | MD 41.71 (17.08 to 66.33) | 294 (4) | ⊕⊕⊕⊝ | Downgraded because of inconsistency (I2 = 82%). 2 studies that could not be included in the meta‐analysis reported no significant differences in median operating times |
| Overall hospital stay (days) | Hysterectomy | MD ‐0.30 (‐0.54 to ‐0.06) | 217 | ⊕⊕⊝⊝ | Downgraded because of risk of bias concerns and imprecision (effect estimate ranged from 1 to 13 hours shorter hospital stay in RAS group) | |
| Mean hospital stay ranged across control groups from 1.4 to 3.6 days | Mean hospital stay in the intervention groups was | |||||
| Sacrocolpopexy | MD 0.37 (‐0.16 to 0.90) | 68 (1) | ⊕⊕⊝⊝ | Downgraded because of study limitations and sparse data | ||
| Mean hospital stay in the control group was 1.42 days | Mean hospital stay in the intervention group was 1.79 days | |||||
| Conversion to another approach | All procedures (subgroups were similar) | RR 1.29 (0.40 to 4.16) | 338 | ⊕⊕⊕⊝ | Downgraded because of imprecision | |
| 3 per 100 | 4 per 100 | |||||
| aThe basis for the assumed risk for dichotomous data is the mean control group risk across studies. The corresponding risk (and its 95% confidence interval) is based on the assumed risk in the comparison group and the relative effect of the intervention (and its 95% CI). | ||||||
| GRADE Working Group grades of evidence. | ||||||
| Study ID | Malignant (M)/Benign (B) disease | Participants (N) | Number enrolled by June 2014a | Comparison | Procedure | Main outcomes | Primary completion datea |
| Harkins 2013b NCT01581905 | B: menorrhagia, dysfunctional uterine bleeding, fibroids, endometriosis | 400 (closed at 113) | Completed | RAS versus CLS | Hysterectomy | Operating time, EBL, complications, LOS | March 2013 |
| NCT01556204 | B: endometriosis | 74 | ‐ | RAS versus CLS | Surgery for endometriosis | Operating time, pain | December 2013 |
| NCT01247779 | M: cervical, uterine and ovarian cancers | 374 | 320 | RAS versus CLS | Surgical staging procedures | Complications, lymph node yield, surgeons' ergonomy, QoL | June 2015 |
| NCT01526655 | M: endometrial cancer | 50 | 30 | RAS versus open surgery | Hysterectomy, BSO and lavage | QoL, biomarkers, adverse events | December 2015 |
| NCT01847703 | M: endometrial cancer | 100 | 45 | RAS versus open surgery | Hysterectomy, BSO and LA | Lymph node yield, complications | April 2016 |
| NCT00614211 | M: cervical cancer | 740 | 340 | RAS or CLS versus open surgery | Radical hysterectomy | DFS, complications, QoL, OS | July 2018 |
| For further details, see Characteristics of ongoing studies. aUpdated according to contact investigator correspondence when possible. bSame as Green 2013. This study has been completed but not yet reported in full. Data on 98 women were presented in 2013 and have been included in this review. Abbreviations: CLS = conventional laparoscopic surgery; DFS = disease‐free survival; EBL = estimated blood loss; LOS = length of stay; OS = overall survival; QoL = quality of life; RAS = robot‐assisted surgery. | |||||||
| Outcome or subgroup title | No. of studies | No. of participants | Statistical method | Effect size |
| 1 Intraoperative and postoperative complications Show forest plot | 6 | 513 | Risk Ratio (M‐H, Random, 95% CI) | 0.95 [0.46, 1.99] |
| 1.1 Hysterectomy | 4 | 367 | Risk Ratio (M‐H, Random, 95% CI) | 0.76 [0.31, 1.88] |
| 1.2 Sacrocolpopexy | 2 | 146 | Risk Ratio (M‐H, Random, 95% CI) | 1.33 [0.26, 6.72] |
| 2 Intraoperative complications Show forest plot | 4 | 337 | Risk Ratio (M‐H, Random, 95% CI) | 1.71 [0.83, 3.52] |
| 2.1 Hysterectomy | 3 | 269 | Risk Ratio (M‐H, Random, 95% CI) | 1.67 [0.75, 3.73] |
| 2.2 Sacrocolpopexy | 1 | 68 | Risk Ratio (M‐H, Random, 95% CI) | 1.89 [0.37, 9.62] |
| 3 Sensitivity analysis: intraoperative complications Show forest plot | 3 | 215 | Risk Ratio (M‐H, Random, 95% CI) | 1.78 [0.84, 3.75] |
| 3.1 Hysterectomy | 2 | 147 | Risk Ratio (M‐H, Random, 95% CI) | 1.75 [0.76, 4.06] |
| 3.2 Sacrocolpopexy | 1 | 68 | Risk Ratio (M‐H, Random, 95% CI) | 1.89 [0.37, 9.62] |
| 4 Complications: intraoperative injury Show forest plot | 5 | 415 | Risk Ratio (M‐H, Random, 95% CI) | 1.23 [0.44, 3.46] |
| 4.1 Hysterectomy | 3 | 269 | Risk Ratio (M‐H, Random, 95% CI) | 1.62 [0.20, 12.91] |
| 4.2 Sacrocolpopexy | 2 | 146 | Risk Ratio (M‐H, Random, 95% CI) | 1.13 [0.34, 3.70] |
| 5 Postoperative complications Show forest plot | 4 | Risk Ratio (M‐H, Random, 95% CI) | Subtotals only | |
| 5.1 Hysterectomy | 3 | 315 | Risk Ratio (M‐H, Random, 95% CI) | 0.62 [0.30, 1.29] |
| 5.2 Sacrocolpopexy | 1 | 68 | Risk Ratio (M‐H, Random, 95% CI) | 3.54 [1.31, 9.56] |
| 6 Sensitivity analysis: postoperative complications Show forest plot | 3 | Risk Ratio (M‐H, Random, 95% CI) | Subtotals only | |
| 6.1 Hysterectomy | 2 | 217 | Risk Ratio (M‐H, Random, 95% CI) | 0.63 [0.18, 2.28] |
| 6.2 Sacrocolpopexy | 1 | 68 | Risk Ratio (M‐H, Random, 95% CI) | 3.54 [1.31, 9.56] |
| 7 Complications: bleeding Show forest plot | 4 | Risk Ratio (M‐H, Random, 95% CI) | Subtotals only | |
| 7.1 Hysterectomy | 4 | 367 | Risk Ratio (M‐H, Random, 95% CI) | 0.41 [0.10, 1.66] |
| 8 Complications: infection Show forest plot | 5 | 435 | Risk Ratio (M‐H, Random, 95% CI) | 1.18 [0.42, 3.36] |
| 8.1 Hysterectomy | 4 | 367 | Risk Ratio (M‐H, Random, 95% CI) | 0.62 [0.13, 2.88] |
| 8.2 Sacrocolpopexy | 1 | 68 | Risk Ratio (M‐H, Random, 95% CI) | 1.89 [0.63, 5.68] |
| 9 Total operating time Show forest plot | 4 | 294 | Mean Difference (IV, Random, 95% CI) | 41.71 [17.08, 66.33] |
| 9.1 Hysterectomy | 2 | 148 | Mean Difference (IV, Random, 95% CI) | 41.18 [‐6.17, 88.53] |
| 9.2 Sacrocolpopexy | 2 | 146 | Mean Difference (IV, Random, 95% CI) | 44.99 [4.23, 85.76] |
| 10 Operating room time [min] Show forest plot | 4 | 294 | Mean Difference (IV, Random, 95% CI) | 42.51 [20.96, 64.06] |
| 10.1 Hysterectomy | 2 | 148 | Mean Difference (IV, Random, 95% CI) | 44.35 [5.22, 83.47] |
| 10.2 Sacrocolpopexy | 2 | 146 | Mean Difference (IV, Random, 95% CI) | 43.24 [0.12, 86.35] |
| 11 Overall hospital stay Show forest plot | 3 | Mean Difference (IV, Random, 95% CI) | Subtotals only | |
| 11.1 Hysterectomy | 2 | 217 | Mean Difference (IV, Random, 95% CI) | ‐0.30 [‐0.54, ‐0.06] |
| 11.2 Sacrocolpopexy | 1 | 68 | Mean Difference (IV, Random, 95% CI) | 0.37 [‐0.16, 0.90] |
| 12 Conversion to another approach Show forest plot | 4 | 337 | Risk Ratio (M‐H, Random, 95% CI) | 1.28 [0.40, 4.12] |
| 12.1 Hysterectomy | 3 | 269 | Risk Ratio (M‐H, Random, 95% CI) | 1.17 [0.24, 5.77] |
| 12.2 Sacrocolpopexy | 1 | 68 | Risk Ratio (M‐H, Random, 95% CI) | 1.41 [0.25, 7.94] |
| 13 Blood transfusions Show forest plot | 3 | Risk Ratio (M‐H, Random, 95% CI) | Subtotals only | |
| 13.1 Hysterectomy | 3 | 272 | Risk Ratio (M‐H, Random, 95% CI) | 1.23 [0.24, 6.21] |
| 14 Estimated blood loss Show forest plot | 2 | 173 | Mean Difference (IV, Random, 95% CI) | 3.54 [‐20.12, 27.21] |
| 14.1 Hysterectomy | 1 | 95 | Mean Difference (IV, Random, 95% CI) | 7.0 [‐18.26, 32.26] |
| 14.2 Sacrocolpopexy | 1 | 78 | Mean Difference (IV, Random, 95% CI) | ‐21.30 [‐89.02, 46.42] |
| 15 Pain at 1 to 2 weeks Show forest plot | 2 | 114 | Std. Mean Difference (IV, Random, 95% CI) | 0.22 [‐0.26, 0.70] |
| 15.1 Hysterectomy | 1 | 36 | Std. Mean Difference (IV, Random, 95% CI) | ‐0.09 [‐0.74, 0.56] |
| 15.2 Sacrocolpopexy | 1 | 78 | Std. Mean Difference (IV, Random, 95% CI) | 0.41 [‐0.03, 0.86] |
| 16 Quality of life (6 weeks) Show forest plot | 1 | Mean Difference (IV, Random, 95% CI) | Totals not selected | |
| 16.1 Sacrocolpopexy | 1 | Mean Difference (IV, Random, 95% CI) | 0.0 [0.0, 0.0] | |
| 17 Quality of life (6 months) Show forest plot | 1 | Mean Difference (IV, Random, 95% CI) | Totals not selected | |
| 17.1 Hysterectomy | 1 | Mean Difference (IV, Random, 95% CI) | 0.0 [0.0, 0.0] | |
| 18 Reintervention Show forest plot | 3 | 295 | Risk Ratio (M‐H, Random, 95% CI) | 0.35 [0.08, 1.54] |
| 18.1 Hysterectomy | 1 | 122 | Risk Ratio (M‐H, Random, 95% CI) | 0.25 [0.03, 2.17] |
| 18.2 Sacrocolpopexy | 2 | 173 | Risk Ratio (M‐H, Random, 95% CI) | 0.47 [0.06, 3.59] |
| 19 Readmission Show forest plot | 2 | Risk Ratio (M‐H, Random, 95% CI) | Subtotals only | |
| 19.1 Hysterectomy | 2 | 220 | Risk Ratio (M‐H, Random, 95% CI) | 0.46 [0.14, 1.48] |
| 20 Overall cost Show forest plot | 3 | Mean Difference (IV, Random, 95% CI) | Totals not selected | |
| 20.1 Hysterectomy | 1 | Mean Difference (IV, Random, 95% CI) | 0.0 [0.0, 0.0] | |
| 20.2 Sacrocolpopexy | 2 | Mean Difference (IV, Random, 95% CI) | 0.0 [0.0, 0.0] | |