Scolaris Content Display Scolaris Content Display

Study flow diagram for updated searches (30 June 2014).
Figuras y tablas -
Figure 1

Study flow diagram for updated searches (30 June 2014).

Risk of bias summary: review authors' judgements about each risk of bias item for each included study.
Figuras y tablas -
Figure 2

Risk of bias summary: review authors' judgements about each risk of bias item for each included study.

Intraoperative and postoperative complications, with Martinez‐Maestro 2014 included.
Figuras y tablas -
Figure 3

Intraoperative and postoperative complications, with Martinez‐Maestro 2014 included.

Total operating time, with Martinez‐Maestro 2014 included.
Figuras y tablas -
Figure 4

Total operating time, with Martinez‐Maestro 2014 included.

Comparison 1 Robot‐assisted surgery versus conventional laparoscopic surgery, Outcome 1 Intraoperative and postoperative complications.
Figuras y tablas -
Analysis 1.1

Comparison 1 Robot‐assisted surgery versus conventional laparoscopic surgery, Outcome 1 Intraoperative and postoperative complications.

Comparison 1 Robot‐assisted surgery versus conventional laparoscopic surgery, Outcome 2 Intraoperative complications.
Figuras y tablas -
Analysis 1.2

Comparison 1 Robot‐assisted surgery versus conventional laparoscopic surgery, Outcome 2 Intraoperative complications.

Comparison 1 Robot‐assisted surgery versus conventional laparoscopic surgery, Outcome 3 Sensitivity analysis: intraoperative complications.
Figuras y tablas -
Analysis 1.3

Comparison 1 Robot‐assisted surgery versus conventional laparoscopic surgery, Outcome 3 Sensitivity analysis: intraoperative complications.

Comparison 1 Robot‐assisted surgery versus conventional laparoscopic surgery, Outcome 4 Complications: intraoperative injury.
Figuras y tablas -
Analysis 1.4

Comparison 1 Robot‐assisted surgery versus conventional laparoscopic surgery, Outcome 4 Complications: intraoperative injury.

Comparison 1 Robot‐assisted surgery versus conventional laparoscopic surgery, Outcome 5 Postoperative complications.
Figuras y tablas -
Analysis 1.5

Comparison 1 Robot‐assisted surgery versus conventional laparoscopic surgery, Outcome 5 Postoperative complications.

Comparison 1 Robot‐assisted surgery versus conventional laparoscopic surgery, Outcome 6 Sensitivity analysis: postoperative complications.
Figuras y tablas -
Analysis 1.6

Comparison 1 Robot‐assisted surgery versus conventional laparoscopic surgery, Outcome 6 Sensitivity analysis: postoperative complications.

Comparison 1 Robot‐assisted surgery versus conventional laparoscopic surgery, Outcome 7 Complications: bleeding.
Figuras y tablas -
Analysis 1.7

Comparison 1 Robot‐assisted surgery versus conventional laparoscopic surgery, Outcome 7 Complications: bleeding.

Comparison 1 Robot‐assisted surgery versus conventional laparoscopic surgery, Outcome 8 Complications: infection.
Figuras y tablas -
Analysis 1.8

Comparison 1 Robot‐assisted surgery versus conventional laparoscopic surgery, Outcome 8 Complications: infection.

Comparison 1 Robot‐assisted surgery versus conventional laparoscopic surgery, Outcome 9 Total operating time.
Figuras y tablas -
Analysis 1.9

Comparison 1 Robot‐assisted surgery versus conventional laparoscopic surgery, Outcome 9 Total operating time.

Comparison 1 Robot‐assisted surgery versus conventional laparoscopic surgery, Outcome 10 Operating room time [min].
Figuras y tablas -
Analysis 1.10

Comparison 1 Robot‐assisted surgery versus conventional laparoscopic surgery, Outcome 10 Operating room time [min].

Comparison 1 Robot‐assisted surgery versus conventional laparoscopic surgery, Outcome 11 Overall hospital stay.
Figuras y tablas -
Analysis 1.11

Comparison 1 Robot‐assisted surgery versus conventional laparoscopic surgery, Outcome 11 Overall hospital stay.

Comparison 1 Robot‐assisted surgery versus conventional laparoscopic surgery, Outcome 12 Conversion to another approach.
Figuras y tablas -
Analysis 1.12

Comparison 1 Robot‐assisted surgery versus conventional laparoscopic surgery, Outcome 12 Conversion to another approach.

Comparison 1 Robot‐assisted surgery versus conventional laparoscopic surgery, Outcome 13 Blood transfusions.
Figuras y tablas -
Analysis 1.13

Comparison 1 Robot‐assisted surgery versus conventional laparoscopic surgery, Outcome 13 Blood transfusions.

Comparison 1 Robot‐assisted surgery versus conventional laparoscopic surgery, Outcome 14 Estimated blood loss.
Figuras y tablas -
Analysis 1.14

Comparison 1 Robot‐assisted surgery versus conventional laparoscopic surgery, Outcome 14 Estimated blood loss.

Comparison 1 Robot‐assisted surgery versus conventional laparoscopic surgery, Outcome 15 Pain at 1 to 2 weeks.
Figuras y tablas -
Analysis 1.15

Comparison 1 Robot‐assisted surgery versus conventional laparoscopic surgery, Outcome 15 Pain at 1 to 2 weeks.

Comparison 1 Robot‐assisted surgery versus conventional laparoscopic surgery, Outcome 16 Quality of life (6 weeks).
Figuras y tablas -
Analysis 1.16

Comparison 1 Robot‐assisted surgery versus conventional laparoscopic surgery, Outcome 16 Quality of life (6 weeks).

Comparison 1 Robot‐assisted surgery versus conventional laparoscopic surgery, Outcome 17 Quality of life (6 months).
Figuras y tablas -
Analysis 1.17

Comparison 1 Robot‐assisted surgery versus conventional laparoscopic surgery, Outcome 17 Quality of life (6 months).

Comparison 1 Robot‐assisted surgery versus conventional laparoscopic surgery, Outcome 18 Reintervention.
Figuras y tablas -
Analysis 1.18

Comparison 1 Robot‐assisted surgery versus conventional laparoscopic surgery, Outcome 18 Reintervention.

Comparison 1 Robot‐assisted surgery versus conventional laparoscopic surgery, Outcome 19 Readmission.
Figuras y tablas -
Analysis 1.19

Comparison 1 Robot‐assisted surgery versus conventional laparoscopic surgery, Outcome 19 Readmission.

Comparison 1 Robot‐assisted surgery versus conventional laparoscopic surgery, Outcome 20 Overall cost.
Figuras y tablas -
Analysis 1.20

Comparison 1 Robot‐assisted surgery versus conventional laparoscopic surgery, Outcome 20 Overall cost.

Robot‐assisted surgery (RAS) compared with conventional laparoscopic surgery (CLS) for gynaecological disease

Patient or population: women with benign gynaecological disease requiring surgery

Settings: hospital

Intervention: RAS

Comparison: CLS

Outcomes

Illustrative comparative risksa (95% CI)

Relative effect
(95% CI)

Number of participants
(studies)

Quality of the evidence
(GRADE)

Comments

Assumed risk

Corresponding risk

CLS

RAS

Intraoperative and postoperative complications

All procedures (subgroups were similar)

RR 0.95 (0.46 to 1.99)

513 (6)

⊕⊕⊝⊝
Low

Downgraded because of inconsistency (I2 = 74%) and imprecision. Early studies favoured CLS, whereas later studies favoured RAS but had other limitations

19 per 100

18 per 100

(9 to 38)

Intraoperative complications only

All procedures (subgroups were similar)

RR 1.71 (0.83 to 3.52)

337 (4)

⊕⊕⊝⊝
Low

Downgraded because of imprecision and study limitations (2 early studies contributed 16/17 adverse events in the RAS arm). Sensitivity analyses suggest that effect estimate is likely to change

6 per 100

10 per 100
(5 to 21)

Postoperative complications only

Hysterectomy

RR 0.62 (0.30 to 1.29)

RR 3.54 (1.31 to 9.56)

315 (3)

68 (1)

⊕⊕⊝⊝
Low

⊕⊝⊝⊝
Very low

Downgraded because of imprecision and study limitations. Early studies tend to favour CLS, whereas later studies favour RAS but had other limitations

Only 1 small, early study reported data, which included urinary tract infections

16 per 100

10 per 100
(5 to 21)

Sacrocolpopexy

12 per 100

42 per 100
(16 to 100)

Intraoperative injury

All procedures (subgroups were similar)

RR 1.23 (0.44 to 3.46)

415 (5)

⊕⊕⊕⊝
Moderate

Downgraded because of imprecision

3 per 100

4 per 100

(1 to 10)

Total operating time (minutes)

Mean total operating time ranged across control groups from
75 to 178 minutes

Mean total operating time in the intervention groups ranged from
96 to 265 minutes (21 to 87 minutes longer)

MD 41.71 (17.08 to 66.33)

294 (4)

⊕⊕⊕⊝
Moderate

Downgraded because of inconsistency (I2 = 82%). 2 studies that could not be included in the meta‐analysis reported no significant differences in median operating times

Overall hospital stay (days)

Hysterectomy

MD ‐0.30 (‐0.54 to ‐0.06)

217
(2)

⊕⊕⊝⊝
Low

Downgraded because of risk of bias concerns and imprecision (effect estimate ranged from 1 to 13 hours shorter hospital stay in RAS group)

Mean hospital stay ranged across control groups from 1.4 to 3.6 days

Mean hospital stay in the intervention groups was
1.1 to 3.3 days (0.3 days lower)

Sacrocolpopexy

MD 0.37 (‐0.16 to 0.90)

68 (1)

⊕⊕⊝⊝
Low

Downgraded because of study limitations and sparse data

Mean hospital stay in the control group was 1.42 days

Mean hospital stay in the intervention group was 1.79 days

Conversion to another approach

All procedures (subgroups were similar)

RR 1.29 (0.40 to 4.16)

338
(4)

⊕⊕⊕⊝
Moderate

Downgraded because of imprecision

3 per 100

4 per 100
(1 to 12)

aThe basis for the assumed risk for dichotomous data is the mean control group risk across studies. The corresponding risk (and its 95% confidence interval) is based on the assumed risk in the comparison group and the relative effect of the intervention (and its 95% CI).
CI: Confidence interval; CLS: Conventional laparoscopic surgery; MD: Mean difference; RR: Risk ratio; RAS: Robot‐assisted surgery.

GRADE Working Group grades of evidence.
High quality: Further research is very unlikely to change our confidence in the estimate of effect.
Moderate quality: Further research is likely to have an important impact on our confidence in the estimate of effect and may change the estimate.
Low quality: Further research is very likely to have an important impact on our confidence in the estimate of effect and is likely to change the estimate.
Very low quality: We are very uncertain about the estimate.

Figuras y tablas -
Table 1. Summary of ongoing trials

Study ID

Malignant (M)/Benign (B)

disease

Participants (N)

Number enrolled

by June 2014a

Comparison

Procedure

Main outcomes

Primary

completion datea

Harkins 2013b

NCT01581905

B: menorrhagia, dysfunctional

uterine bleeding,

fibroids, endometriosis

400 (closed at 113)

Completed

RAS versus CLS

Hysterectomy

Operating time, EBL, complications, LOS

March 2013

LAROSE 2012

NCT01556204

B: endometriosis

74

RAS versus CLS

Surgery for endometriosis

Operating time,

pain

December 2013

Narducci 2010

NCT01247779

M: cervical, uterine and

ovarian cancers

374

320

RAS versus CLS

Surgical staging

procedures

Complications, lymph

node yield, surgeons'

ergonomy, QoL

June 2015

Kjolhede 2012

NCT01526655

M: endometrial cancer

50

30

RAS versus open surgery

Hysterectomy, BSO and

lavage

QoL, biomarkers,

adverse events

December 2015

RASHEC 2013

NCT01847703

M: endometrial cancer

100

45

RAS versus open surgery

Hysterectomy, BSO and LA

Lymph node yield,

complications

April 2016

Obermair 2008

NCT00614211

M: cervical cancer

740

340

RAS or CLS versus open

surgery

Radical hysterectomy

DFS, complications,

QoL, OS

July 2018

For further details, see Characteristics of ongoing studies.

aUpdated according to contact investigator correspondence when possible.

bSame as Green 2013. This study has been completed but not yet reported in full. Data on 98 women were presented in 2013 and have been included in this review.

Abbreviations: CLS = conventional laparoscopic surgery; DFS = disease‐free survival; EBL = estimated blood loss; LOS = length of stay; OS = overall survival; QoL = quality of life; RAS = robot‐assisted surgery.

Figuras y tablas -
Table 1. Summary of ongoing trials
Comparison 1. Robot‐assisted surgery versus conventional laparoscopic surgery

Outcome or subgroup title

No. of studies

No. of participants

Statistical method

Effect size

1 Intraoperative and postoperative complications Show forest plot

6

513

Risk Ratio (M‐H, Random, 95% CI)

0.95 [0.46, 1.99]

1.1 Hysterectomy

4

367

Risk Ratio (M‐H, Random, 95% CI)

0.76 [0.31, 1.88]

1.2 Sacrocolpopexy

2

146

Risk Ratio (M‐H, Random, 95% CI)

1.33 [0.26, 6.72]

2 Intraoperative complications Show forest plot

4

337

Risk Ratio (M‐H, Random, 95% CI)

1.71 [0.83, 3.52]

2.1 Hysterectomy

3

269

Risk Ratio (M‐H, Random, 95% CI)

1.67 [0.75, 3.73]

2.2 Sacrocolpopexy

1

68

Risk Ratio (M‐H, Random, 95% CI)

1.89 [0.37, 9.62]

3 Sensitivity analysis: intraoperative complications Show forest plot

3

215

Risk Ratio (M‐H, Random, 95% CI)

1.78 [0.84, 3.75]

3.1 Hysterectomy

2

147

Risk Ratio (M‐H, Random, 95% CI)

1.75 [0.76, 4.06]

3.2 Sacrocolpopexy

1

68

Risk Ratio (M‐H, Random, 95% CI)

1.89 [0.37, 9.62]

4 Complications: intraoperative injury Show forest plot

5

415

Risk Ratio (M‐H, Random, 95% CI)

1.23 [0.44, 3.46]

4.1 Hysterectomy

3

269

Risk Ratio (M‐H, Random, 95% CI)

1.62 [0.20, 12.91]

4.2 Sacrocolpopexy

2

146

Risk Ratio (M‐H, Random, 95% CI)

1.13 [0.34, 3.70]

5 Postoperative complications Show forest plot

4

Risk Ratio (M‐H, Random, 95% CI)

Subtotals only

5.1 Hysterectomy

3

315

Risk Ratio (M‐H, Random, 95% CI)

0.62 [0.30, 1.29]

5.2 Sacrocolpopexy

1

68

Risk Ratio (M‐H, Random, 95% CI)

3.54 [1.31, 9.56]

6 Sensitivity analysis: postoperative complications Show forest plot

3

Risk Ratio (M‐H, Random, 95% CI)

Subtotals only

6.1 Hysterectomy

2

217

Risk Ratio (M‐H, Random, 95% CI)

0.63 [0.18, 2.28]

6.2 Sacrocolpopexy

1

68

Risk Ratio (M‐H, Random, 95% CI)

3.54 [1.31, 9.56]

7 Complications: bleeding Show forest plot

4

Risk Ratio (M‐H, Random, 95% CI)

Subtotals only

7.1 Hysterectomy

4

367

Risk Ratio (M‐H, Random, 95% CI)

0.41 [0.10, 1.66]

8 Complications: infection Show forest plot

5

435

Risk Ratio (M‐H, Random, 95% CI)

1.18 [0.42, 3.36]

8.1 Hysterectomy

4

367

Risk Ratio (M‐H, Random, 95% CI)

0.62 [0.13, 2.88]

8.2 Sacrocolpopexy

1

68

Risk Ratio (M‐H, Random, 95% CI)

1.89 [0.63, 5.68]

9 Total operating time Show forest plot

4

294

Mean Difference (IV, Random, 95% CI)

41.71 [17.08, 66.33]

9.1 Hysterectomy

2

148

Mean Difference (IV, Random, 95% CI)

41.18 [‐6.17, 88.53]

9.2 Sacrocolpopexy

2

146

Mean Difference (IV, Random, 95% CI)

44.99 [4.23, 85.76]

10 Operating room time [min] Show forest plot

4

294

Mean Difference (IV, Random, 95% CI)

42.51 [20.96, 64.06]

10.1 Hysterectomy

2

148

Mean Difference (IV, Random, 95% CI)

44.35 [5.22, 83.47]

10.2 Sacrocolpopexy

2

146

Mean Difference (IV, Random, 95% CI)

43.24 [0.12, 86.35]

11 Overall hospital stay Show forest plot

3

Mean Difference (IV, Random, 95% CI)

Subtotals only

11.1 Hysterectomy

2

217

Mean Difference (IV, Random, 95% CI)

‐0.30 [‐0.54, ‐0.06]

11.2 Sacrocolpopexy

1

68

Mean Difference (IV, Random, 95% CI)

0.37 [‐0.16, 0.90]

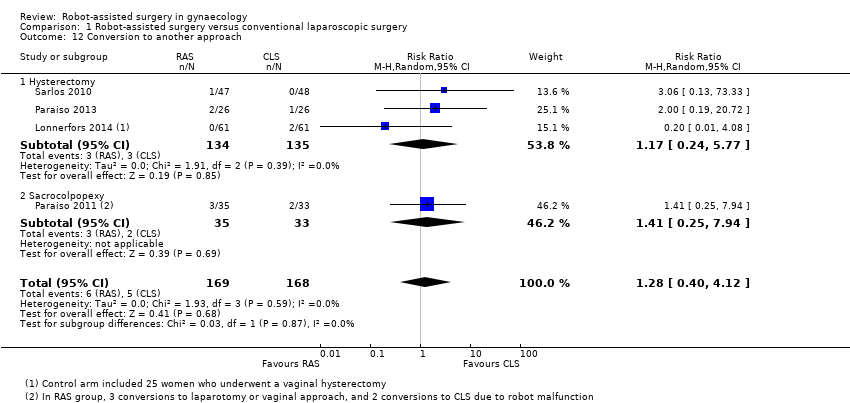
12 Conversion to another approach Show forest plot

4

337

Risk Ratio (M‐H, Random, 95% CI)

1.28 [0.40, 4.12]

12.1 Hysterectomy

3

269

Risk Ratio (M‐H, Random, 95% CI)

1.17 [0.24, 5.77]

12.2 Sacrocolpopexy

1

68

Risk Ratio (M‐H, Random, 95% CI)

1.41 [0.25, 7.94]

13 Blood transfusions Show forest plot

3

Risk Ratio (M‐H, Random, 95% CI)

Subtotals only

13.1 Hysterectomy

3

272

Risk Ratio (M‐H, Random, 95% CI)

1.23 [0.24, 6.21]

14 Estimated blood loss Show forest plot

2

173

Mean Difference (IV, Random, 95% CI)

3.54 [‐20.12, 27.21]

14.1 Hysterectomy

1

95

Mean Difference (IV, Random, 95% CI)

7.0 [‐18.26, 32.26]

14.2 Sacrocolpopexy

1

78

Mean Difference (IV, Random, 95% CI)

‐21.30 [‐89.02, 46.42]

15 Pain at 1 to 2 weeks Show forest plot

2

114

Std. Mean Difference (IV, Random, 95% CI)

0.22 [‐0.26, 0.70]

15.1 Hysterectomy

1

36

Std. Mean Difference (IV, Random, 95% CI)

‐0.09 [‐0.74, 0.56]

15.2 Sacrocolpopexy

1

78

Std. Mean Difference (IV, Random, 95% CI)

0.41 [‐0.03, 0.86]

16 Quality of life (6 weeks) Show forest plot

1

Mean Difference (IV, Random, 95% CI)

Totals not selected

16.1 Sacrocolpopexy

1

Mean Difference (IV, Random, 95% CI)

0.0 [0.0, 0.0]

17 Quality of life (6 months) Show forest plot

1

Mean Difference (IV, Random, 95% CI)

Totals not selected

17.1 Hysterectomy

1

Mean Difference (IV, Random, 95% CI)

0.0 [0.0, 0.0]

18 Reintervention Show forest plot

3

295

Risk Ratio (M‐H, Random, 95% CI)

0.35 [0.08, 1.54]

18.1 Hysterectomy

1

122

Risk Ratio (M‐H, Random, 95% CI)

0.25 [0.03, 2.17]

18.2 Sacrocolpopexy

2

173

Risk Ratio (M‐H, Random, 95% CI)

0.47 [0.06, 3.59]

19 Readmission Show forest plot

2

Risk Ratio (M‐H, Random, 95% CI)

Subtotals only

19.1 Hysterectomy

2

220

Risk Ratio (M‐H, Random, 95% CI)

0.46 [0.14, 1.48]

20 Overall cost Show forest plot

3

Mean Difference (IV, Random, 95% CI)

Totals not selected

20.1 Hysterectomy

1

Mean Difference (IV, Random, 95% CI)

0.0 [0.0, 0.0]

20.2 Sacrocolpopexy

2

Mean Difference (IV, Random, 95% CI)

0.0 [0.0, 0.0]

Figuras y tablas -
Comparison 1. Robot‐assisted surgery versus conventional laparoscopic surgery