Cirugía asistida por robot en ginecología
Resumen
Antecedentes
Esta es una revisión actualizada fusionada de dos revisiones en origen separadas: una sobre la cirugía asistida por robot (CAR) para la enfermedad ginecológica benigna y la otra sobre la CAR para el cáncer ginecológico. La CAR es una innovación relativamente nueva en la cirugía laparoscópica que le permite al cirujano realizar la operación desde una consola computarizada situada lejos de la mesa quirúrgica. En la actualidad la CAR se utiliza ampliamente en los Estados Unidos para la histerectomía y ha mostrado ser factible en otros procedimientos ginecológicos. Sin embargo, la efectividad clínica y la seguridad de la CAR en comparación con la cirugía laparoscópica convencional (CLC) no se han establecido claramente y requieren revisión independiente.
Objetivos
Evaluar la efectividad y la seguridad de la CAR en el tratamiento de las pacientes con enfermedad ginecológica benigna y maligna.
Métodos de búsqueda
Para esta actualización se hicieron búsquedas en el Registro Cochrane Central de Ensayos Controlados (Cochrane Central Register of Controlled Trials, CENTRAL), MEDLINE vía Ovid y en EMBASE vía Ovid, el 8 de enero de 2018. Se buscó en www.ClinicalTrials.gov el 16 de enero de 2018.
Criterios de selección
Ensayos controlados aleatorizados (ECA) que compararon CAR con CLC o cirugía abierta en pacientes que requerían cirugía por enfermedades ginecológicas.
Obtención y análisis de los datos
Dos autores de la revisión de forma independiente evaluaron los estudios para su inclusión y el riesgo de sesgo, y extrajeron los datos de los estudio y los introdujeron en una hoja de cálculo de Excel. Se examinaron diferentes intervenciones en comparaciones separadas y para datos de histerectomía subagrupados según el tipo de enfermedad (no maligna versus maligna). Cuando más de un estudio aportó datos, estos se agruparon mediante los métodos de efectos aleatorizados en RevMan 5.3.
Resultados principales
Se incluyeron 12 ECA con 1016 mujeres. Los estudios estaban en riesgo general de sesgo alto y se disminuyó la calidad de la evidencia principalmente por dudas sobre el riesgo de sesgo de los estudios que aportaron datos y por la imprecisión de las estimaciones del efecto. Las intervenciones realizadas fueron la histerectomía (ocho estudios) y la sacrocolpopexia (tres estudios). Además, un ensayo examinó el tratamiento quirúrgico para la endometriosis, que incluyó resección o histerectomía. Entre las mujeres a las que se les realizó intervenciones de histerectomía, dos estudios incluyeron enfermedades malignas (cáncer de endometrio) y el resto enfermedades no malignas.
• CAR versus CLC (histerectomía)
La evidencia de certeza baja sugiere que podría haber poca o ninguna diferencia en ninguna de las tasas de complicaciones entre la CAR y la CLC (cociente de riesgos (CR) 0,92, intervalo de Confianza (IC) del 95%: 0,54 a 1,59; participantes = 585; estudios = 6, I² = 51%), tasas de complicaciones intraoperatorias (CR 1,05, IC del 95%: 0,31 a 3,56; participantes = 487; estudios = 5; I² = 28%), complicaciones posoperatorias (CR 0,82; IC del 95%: 0,42 a 1,59; participantes = 533; estudios = 5, I2 = 51%) y transfusiones de sangre (CR 2,49; IC del 95%: 0,75 a 8,23; participantes = 346; estudios = 4, I2 = 0%). No hubo diferencias estadísticas entre los subgrupos de enfermedades malignas y no malignas con respecto a las tasas de complicaciones. No se informaron los resultados de supervivencia para las mujeres con enfermedad maligna.
La duración total de la operación fue mayor de media en el grupo de la CAR que en el grupo de la CLC (diferencia de medias (DM) 41,18 minutos, IC del 95%: ‐6,17 a 88,53; participantes = 148; estudios = 2; I² = 80%; evidencia de certeza muy baja) y la duración media de la estancia hospitalaria fue ligeramente menor con la CAR que con la CLC (DM ‐0,30 días; IC del 95%: ‐0,53 a ‐0,07; participantes = 192; estudios = 2; I² = 0%; evidencia de certeza muy baja).
• CAR versus CLC (sacrocolpopexia)
La evidencia de certeza muy baja sugiere que existe poca o ninguna diferencia en las tasas de cualquier complicación entre las mujeres a las que se les realiza una sacrocolpopexia mediante CAR y a las que se les realiza mediante CLC (cociente de riesgos (CR) 0,95, IC del 95%: 0,21 a 4,24; participantes = 186; estudios = 3, I² = 78%) y en las tasas de complicaciones intraoperatorias (CR 0,82, IC del 95%: 0,09 a 7,59; participantes = 108; estudios = 2; I² = 47%). La evidencia de certeza baja de complicaciones postoperatorias sugiere que podrían ser más elevadas con la CAR (CR 3,54, IC del 95%: 1,31 a 9,56; estudios = 1; participantes = 68). Los investigadores no informaron las transfusiones de sangre ni las muertes durante los 30 días posteriores.
La evidencia de certeza baja sugiere que la CAR podría estar asociada a un aumento de la duración de la operación (DM 40,53 min, IC del 95%: 12,06 a 68,99; participantes = 186; estudios = 3; I² = 73%). La evidencia de certeza muy baja sugiere poca o ninguna diferencia entre las dos técnicas en cuanto a duración de la estancia hospitalaria (DM 0,26 días, IC del 95%: ‐0,15 a 0,67; participantes = 108; estudios = 2; I² = 0%).
• CAR versus cirugía abdominal abierta (histerectomía)
Dos estudios de 20 y 96 participantes con enfermedad no maligna y enfermedad maligna, respectivamente, compararon el SRA con la cirugía abierta. Para la mayoría de los resultados, sólo un estudio aportó datos, y la mayoría de la evidencia se consideró de muy baja certeza. La evidencia de baja certeza del estudio entre mujeres con cáncer endometrial sugiere que el rendimiento de los ganglios linfáticos puede ser menor con el SRA (DM ‐8,00; IC del 95%: ‐14,97 a ‐1).03), el tiempo de operación puede ser mayor (233 minutos (rango 166 a 320 minutos) en comparación con 187 minutos (rango 109 a 300), las estancias hospitalarias pueden ser más cortas (media de 2 días[1 a 5] versus 5 días[4 a 9]; P<0,001) y los costos generales pueden ser menores (DM ‐1568,00 dólares EE.UU.; IC del 95%: ‐3100,75 a ‐35,25) que la cirugía abierta. No se informaron resultados de supervivencia.
CAR versus CLC para la endometriosis
Un único estudio con datos de 73 mujeres se incluyó en esta comparación; a las mujeres con endometriosis se les realizaron intervenciones que fueron de resección endometrial relativamente menor a histerectomía. Muchas de las mujeres incluidas en el estudio habían recibido previamente cirugía para su enfermedad. Para la mayoría de resultados, las tasas de eventos fueron bajas y el tamaño muestral no fue suficiente para detectar posibles diferencias entre los grupos.
Conclusiones de los autores
La evidencia sobre la efectividad y la seguridad de la CAR en comparación con la CLC para la enfermedad benigna (histerectomía y sacrocolpopexia) es de baja certeza pero sugiere que las tasas de complicaciones quirúrgicas podrían ser comparables. La evidencia sobre la efectividad y la seguridad de la CAR en comparación con la CLC o la cirugía abierta para la enfermedad maligna se desconoce más concretamente porque faltan datos de supervivencia. Debido a que la CAR es una tecnología cara que depende de la habilidad y experiencia del cirujano, la evaluación de su efectividad y de su seguridad de manera independientemente presentará dificultades.
PICO
Resumen en términos sencillos
Uso de tecnología computarizada o robótica para ayudar a los cirujanos a realizar la cirugía ginecológica
Esta es una revisión actualizada originalmente cubierta por dos revisiones Cochrane separadas sobre cirugía asistida por robot para la enfermedad ginecológica benigna y maligna.
La pregunta
La cirugía laparoscópica (mínimamente invasiva) se utiliza ampliamente en ginecología. La cirugía asistida por robot (CAR) es un tipo relativamente nuevo de cirugía laparoscópica que le permite al cirujano realizar la operación desde una consola computarizada situada lejos del paciente mediante brazos mecánicos de mando a distancia adheridos a la mesa quirúrgica. Actualmente la CAR se utiliza en varios países para la cirugía ginecológica, en particular para la histerectomía (extracción del útero / matriz), y se ha informado que es útil para la miomectomía (extracción de los fibromas uterinos), la reanastomosis tubárica (unir los dos extremos de la trompa de Falopio para restaurar la fertilidad), la sacrocolpopexia (diseñada para reparar el prolapso de la cúpula vaginal, cuando la parte superior de la vagina se desliza hacia abajo) y otros procedimientos para enfermedades benignas (no cancerosas). También se ha utilizado en el tratamiento de las pacientes con cánceres ginecológicos, especialmente del endometrio (recubrimiento de la matriz) y los cánceres cervicouterinos. Sin embargo, no se han establecido claramente los efectos beneficiosos y los riesgos de la CAR versus los enfoques quirúrgicos estándar.
Cómo se realizó la revisión
Los estudios se identificaron mediante búsquedas en bases de datos y se les escribió a los investigadores de ensayos registrados. Dos autores de la revisión de forma independiente evaluaron los estudios y recopilaron los datos de cada estudio. Sólo se incluyeron ensayos controlados con asignación al azar. Los datos de los estudios individuales similares se agruparon en los análisis y se examinaron los distintos tipos de operaciones por separado (histerectomía, sacrocolpopexia o cirugía de endometriosis).
Hallazgos
Se incluyeron 12 estudios con 1016 mujeres que requerían cirugía por enfermedades ginecológicas. Los estudios presentaron un riesgo general de sesgo moderado a alto. Las operaciones realizadas fueron la histerectomía (ocho estudios) y la sacrocolpopexia (tres estudios). Además, un ensayo examinó el tratamiento quirúrgico para la endometriosis, que incluyó resección o histerectomía. No se sabe si la CAR o la cirugía laparoscópica convencional (CLC) tienen menores tasas generales de complicación porque la evidencia obtenida fue de calidad baja. El tiempo de operación varió considerablemente entre los estudios que informaron este parámetros, por lo que es difícil interpretar los resultados y, aunque la evidencia sugirió estancias hospitalarias ligeramente más cortas con la CAR (un tercio de día), se consideró que la evidencia era muy incierta y que los estudios tenían un alto riesgo de sesgo.
Para las intervenciones de sacrocolpopexia, la evidencia general no muestra diferencias claras en las tasas de ninguna complicación con la CAR en comparación con la CLC, pero la evidencia fue de certeza baja. Solo un estudio informó complicaciones postoperatorias, que fueron más elevadas en el grupo de CAR (evidencia de certeza baja). La CAR se asoció con un aumento medio de la duración de la operación de 40,53 minutos en el grupo de CAR (evidencia de certeza baja), pero es probable que estos resultados no sean fiables, ya que hubo mucha variación entre los estudios. Se halló evidencia de certeza muy baja de que hubo poca o ninguna diferencia entre la CAR y la CLC en cuanto a duración de la estancia hospitalaria para esta intervención.
Dos estudios pequeños analizaron la histerectomía mediante SRA versus cirugía abdominal abierta; sin embargo, la mayoría de los resultados se evaluaron como demasiado inciertos para establecer conclusiones. De manera similar, un estudio con datos de 73 mujeres analizó la CAR frente a la CLC para la cirugía para la endometriosis; a las mujeres con endometriosis se les realizaron intervenciones que fueron de resección endometrial relativamente menor a histerectomía. Muchas de las mujeres incluidas en el estudio habían recibido previamente cirugía para su enfermedad y el tamaño muestral fue insuficiente para mostrar posibles diferencias entre las técnicas quirúrgicas.
Conclusiones
Las tasas de complicaciones (durante y después de la cirugía) para la CAR podrían ser similares a las de la CLC; sin embargo, la evidencia es por lo general de calidad/certeza baja. Se sabe menos acerca de la evidencia sobre su uso para la cirugía ginecológica del cáncer porque no se hallaron evidencia comparativa sobre la recidiva del cáncer ni la supervivencia tras la cirugía para el cáncer. Debido a que la CAR depende de la habilidad y experiencia del cirujano y a que es una tecnología cara, la evaluación de su efectividad y de su seguridad de manera independientemente presentará dificultades.
Authors' conclusions
Summary of findings
| Robot‐assisted surgery compared with conventional laparoscopic surgery for hysterectomy | ||||||
| Patient or population: women undergoing hysterectomy | ||||||
| Outcomes | Anticipated absolute effects* (95% CI) | Relative effect | No. of participants | Certainty of the evidence | Comments | |
| Risk with conventional laparoscopic surgery (hysterectomy) | Risk with robot‐assisted surgery | |||||
| Intraoperative and postoperative complications | 164 per 1000 | 151 per 1000 | RR 0.92 | 585 | ⊕⊕⊝⊝ | No significant differences between subgroups (women treated for malignant vs non‐malignant disease) |
| Intraoperative complications | 52 per 1000 | 56 per 1000 | RR 1.05 | 487 | ⊕⊕⊝⊝ | Number of participants reported to experience these complications was relatively small. Difference between non‐malignant and malignant disease subgroups was not statistically significant (P = 0.08) |
| Postoperative complications | 140 per 1000 | 115 per 1000 | RR 0.82 | 533 | ⊕⊕⊝⊝ | No significant differences between subgroups (women treated for malignant vs non‐malignant disease) |
| Total operating time | Mean total operating time across included studies ranged from 75 to 102.7 minutes | MD 41.18 higher | ‐ | 148 | ⊕⊝⊝⊝ | Studies involved women with non‐malignant disease only |
| Overall hospital stay | Mean stay across included studies ranged from 1.4 to 3.6 days | MD 0.3 lower | ‐ | 192 | ⊕⊝⊝⊝ | Studies involved women with non‐malignant disease only |
| Blood transfusions | 20 per 1000 | 50 per 1000 | RR 2.49 | 346 | ⊕⊕⊝⊝ | No significant differences between subgroups (women treated for malignant vs non‐malignant disease) |
| *The risk in the intervention group (and its 95% confidence interval) is based on the assumed risk in the comparison group and the relative effect of the intervention (and its 95% CI). | ||||||
| GRADE Working Group grades of evidence. | ||||||
| aStudies contributing data had serious design limitations. | ||||||
| Robot‐assisted surgery compared with conventional laparoscopic surgery for sacrocolpopexy | ||||||
| Patient or population: gynaecology | ||||||
| Outcomes | Anticipated absolute effects* (95% CI) | Relative effect | No. of participants | Certainty of the evidence | Comments | |
| Risk with conventional laparoscopic surgery (sacrocolpopexy) | Risk with robot‐assisted surgery | |||||
| Intraoperative and postoperative complications | 200 per 1000 | 190 per 1000 | RR 0.95 | 186 | ⊕⊝⊝⊝ | |
| Intraoperative complications | 77 per 1000 | 63 per 1000 | RR 0.82 | 108 | ⊕⊝⊝⊝ | |
| Postoperative complications | 121 per 1000 | 429 per 1000 | RR 3.54 | 68 | ⊕⊕⊝⊝ | |
| Total operating time | Mean total operating time across studies ranged from 178.4 to 199 minutes | MD 40.53 higher | ‐ | 186 | ⊕⊕⊝⊝ | |
| Overall hospital stay | Mean overall hospital stay across included studies ranged from 1.4 to 3.8 days | MD 0.26 higher | ‐ | 108 | ⊕⊝⊝⊝ | |
| Blood transfusions | Not estimable | |||||
| *The risk in the intervention group (and its 95% confidence interval) is based on the assumed risk in the comparison group and the relative effect of the intervention (and its 95% CI). | ||||||
| GRADE Working Group grades of evidence. | ||||||
| aStudies contributing data had design limitations. | ||||||
Background
This is an updated review of two originally separate Cochrane reviews concerning the use of robot‐assisted surgery for benign gynaecological disease ‐ in Liu 2012 ‐ and for gynaecological cancer ‐ in Lu 2012.
Description of the condition
Common benign gynaecological conditions include uterine fibroids, endometriosis (endometrial tissue found outside the uterus), benign ovarian tumours, pelvic organ prolapse, and vesicovaginal fistula (a passage between the bladder and the vagina), among others. Surgery for such conditions may involve removal of the affected part or structure (e.g. hysterectomy (removal of the uterus), myomectomy (removal of fibroids), ovarian cystectomy (removal of ovarian cysts)), endometriosis surgery or surgical repair (e.g. sacrocolpopexy (designed to repair vaginal prolapse, where the uppermost part of the vagina slips downwards), fistula repair, or tubal re‐anastomosis (joining two ends of one fallopian tube to restore fertility)). Hysterectomy is the most commonly performed major gynaecological operation; one in five women in the United Kingdom and one in three women in the USA are likely to undergo the procedure during their lifetime (Hyst 2013). Hysterectomy and most other surgical procedures for benign gynaecological conditions can be performed effectively via a laparoscopic approach.
Malignant gynaecological conditions may affect the uterus, ovaries, fallopian tubes, cervix, vagina, and vulva and may account for 10% to 15% of cancers among women, with differing incidence and prognosis depending on geographical location (Jemal 2011). Worldwide, cervical, endometrial, and ovarian cancers are the fourth, fifth, and eighth most common cancers, respectively, among women up to the age of 65 years (Jemal 2011). However, in developed countries, endometrial cancer is the most common gynaecological cancer, followed by ovarian cancer, whereas cervical cancer is the most common gynaecological cancer in developing countries (Jemal 2011). A high proportion of endometrial and cervical cancers are detected at an early stage in developed countries, where the primary approach to management of these conditions is surgical. For early endometrial cancer, surgery involves hysterectomy and bilateral salpingo‐oophorectomy (BSO) with or without lymphadenectomy; surgery for early cervical cancer involves a radical hysterectomy (removal of the uterus, cervix, upper vagina, and parametria). Ovarian cancer frequently is detected only at an advanced stage and typically requires more extensive surgery, including hysterectomy, BSO, pelvic and para‐aortic lymphadenectomy, omentectomy, appendectomy, and abdominal exploration. Staging procedures are usually conducted via laparotomy; however, minimally invasive approaches are being used increasingly, particularly for early‐stage endometrial and cervical cancers. A 2012 Cochrane review of laparoscopy for endometrial cancer found that laparoscopy was associated with reduced operative morbidity and hospital stay, and with survival similar to that of laparotomy (Galaal 2018). However, the role of laparoscopy in early cervical and ovarian cancer surgery has not been established (Kucukmetin 2013; Lawrie 2013).
Description of the intervention
Robot‐assisted surgery (RAS), also known as robotic surgery, robot‐assisted laparoscopic surgery, or computer‐assisted surgery, is a recent innovation in the field of minimally invasive surgery. Although not yet widely available in most countries, in the past decade the use of robotic surgical systems for all kinds of gynaecological and non‐gynaecological surgery has increased. One of the first applications of RAS was AESOP (Automated Endoscopic System for Optical Positioning; Computer Motion, Goleta, CA, USA) ‐ a voice‐activated endoscope (Mettler 1998). Another predecessor of the current system was the ZEUS Robotic Surgical System (ZRSS) (Computer Motion). ZEUS consisted of three remote‐controlled robotic arms attached to the surgical table, along with a robotic console, which housed the instrument controls. This differed from earlier models in that it allowed the surgeon to step away from the operating table. Early studies reported successful application of ZEUS for tubal re‐anastomosis (Falcone 2000). In 2003, Computer Motion merged with its rival company Intuitive Surgical, and these earlier systems were discontinued. The merged company instead developed the da Vinci® Surgical System, which became commercially available for gynaecological surgery in 2005.
The da Vinci® Surgical System (Intuitive Surgical, Sunnyvale, CA, USA) consists of three components: a surgeon‐operated console with stereoscopic viewer and hand and foot controls, three‐dimensional (3D) stereoscopic imaging through an endoscope, and a patient side cart with three or four robotic arms with swivelling instruments, which are reported to be more dexterous than the human hand (Holloway 2009a). This system is currently the only commercially available robotic surgical platform that has received US Food and Drug Administration (FDA) approval for performing gynaecological procedures. According to the manufacturer's website (www.intuitivesurgical.com), more than 1.5 million operations have been performed and more than 2000 da Vinci® units have been sold worldwide (da Vinci 2014). In addition, the company's US market share for hysterectomies performed for benign conditions was apparently 27% in 2011 (da Vinci 2014).
How the intervention might work
Minimally invasive surgery is a surgical approach that minimises surgical incisions to reduce trauma to the body. Laparoscopic surgery is a type of minimally invasive surgery whereby the surgeon makes small incisions in the abdominal wall, through which fine instruments are then inserted. Such instruments include a laparoscope (a camera with magnification), which allows structures within the abdomen and the pelvis to be visualised. In conventional laparoscopic surgery (CLS), the laparoscope and other instruments are held and physically directed by the surgeon or a surgical assistant; this requires a high degree of dexterous skill and training (Ramsey 2012). The main disadvantage of any laparoscopic system compared with laparotomy is the lack of tactile perception (haptic feedback), although the importance of tactile perception in most gynaecological procedures is currently unknown (Moy 2010). Laparoscopic surgery is increasingly preferred to laparotomy (open abdominal surgery) for several gynaecological procedures. For benign ovarian tumours, laparoscopic surgery is associated with fewer perioperative complications, less postoperative pain, and a shorter hospital stay compared with laparotomy (Medeiros 2009). A review of laparoscopic surgery for early endometrial cancer reported similar advantages, with no differences in survival (Galaal 2018).
Robot‐assisted surgery (RAS) represents a technological advance in CLS in that the laparoscope and the surgical instruments are part of a mechanical system that the surgeon operates from a separate console. Advocates of RAS claim that the system is more comfortable for the surgeon and offers additional technical advantages compared with CLS, including 3D vision, minimisation of the effects of hand tremors, greater freedom of motion, greater precision in dissection, easier suturing and knot tying, and a shorter learning process (Cho 2009). Compared with CLS, these advantages have the potential to translate into reduced perioperative complications, as well as less blood loss and postoperative pain, shorter hospital stay, and increased survival in malignant disease. However, several disadvantages are known, including the high cost of equipment and disposable instruments, complete lack of haptic feedback, and the need to train both surgeons and nurses. Furthermore, some aspects of RAS, for example, the number of port incisions required, might increase risks associated with the procedure compared with the conventional approach.
Role of RAS in benign gynaecological disease
Since the late 1990s, RAS has been used in gynaecological surgery, and a proliferation of reports have described its applications. For benign disease, the most commonly performed robot‐assisted gynaecological operation is hysterectomy. Various aspects of robot‐assisted laparoscopic hysterectomy are reported to be performed more easily than CLS, such as securing the uterine vessels and cardinal ligaments, performing an accurate colpotomy, and oversewing the vaginal cuff (Dimitri 2010; Lenihan 2008; Nezhat 2006; Reynolds 2006). Other reports of robot‐assisted procedures include myomectomy (Advincula 2004; Advincula 2007; Cela 2013; Gocmen 2013; Nezhat 2009), tubal re‐anastomosis to restore fertility (Degueldre 2000; Dharia 2008; Rodgers 2007), sacrocolpopexy and repair of vesicovaginal fistulas (Hemal 2008; Melamud 2005; Schimpf 2007; Sundaram 2006), and complex endometriosis surgery (Cadiere 2001; Nezhat 2006; Sener 2006). Preliminary studies of RAS for these procedures have indicated that they can feasibly be performed with RAS.
Role of RAS in gynaecological cancers
Surgical staging operations for gynaecological malignancies are lengthy procedures, which can lead to surgeon fatigue and muscular complaints that may limit the surgeon's performance (Verheijen 2012). For endometrial cancer, an increasing number of non‐randomised studies describe excellent results with RAS, including good lymph node yield, low blood loss, comparable operative time, low complication and conversion rates, and short hospital stays (Bell 2008; Cardenas‐Goicoechea 2010; Coronado 2012; DeNardis 2008; Field 2007; Gehrig 2008; Holloway 2009b; Lambaudie 2008; Reynisson 2013; Reynolds 2005; Seamon 2009a; Shafer 2008; Veljovich 2008). Few studies have evaluated survival following RAS staging; however, a retrospective review of 499 women who underwent RAS endometrial cancer staging suggests that recurrence‐free and overall survival rates are not adversely affected (Kilgore 2013).
For cervical cancer, various studies of robot‐assisted laparoscopic radical hysterectomy have reported reduced blood loss, shorter hospital stay, and lesser analgesia requirements compared with CLS (Boggess 2008a; Fanning 2008; Kim 2008; Lowe 2009; Maggioni 2009; Magrina 2008; Nezhat 2008; Persson 2009; Soliman 2013). Furthermore, case reports suggest that robot‐assisted trachelectomy may offer a good option for women seeking to preserve fertility, because it allows excellent visualisation of the vasculature and parametrial tissues (connective tissue and fat adjacent to the uterus), which must be isolated during the procedure (Diaz 2008; Geisler 2008; Persson 2008; Plante 2008).
Reports of RAS for ovarian cancer are uncommon because of the difficulty involved in extensive exploration of the abdomen with RAS (and CLS). However, limited evidence suggests that selected early cases may be suitable (Finger 2014; Madhuri 2012; Verheijen 2012). Vergote 2008 reported on a series of five patients undergoing retroperitoneal node assessment using RAS with excellent results, including brief hospital stays and minimal blood loss. All procedures were completed within less than one hour console time, and the study authors concluded that robotic retroperitoneal para‐aortic sampling is a feasible procedure that warrants further evaluation.
Why it is important to do this review
Robot‐assisted surgery (RAS) is a newer technology that may confer advantages (or disadvantages) compared with the conventional surgical approaches used in gynaecology. As with any new healthcare technology, RAS requires rigorous evaluation. RAS is controversial because of the significant commercial interests involved, and because the technology is expensive, reports tend to be generated by proponents of the approach. In the USA, according to Schiavone 2012, marketing of RAS by hospitals for gynaecology is widespread, with potential limitations and costs rarely presented to women, and with most websites claiming reduced pain, shorter recovery time, and less blood loss with RAS. Yet individual studies and reviews to date have provided insufficient evidence on the clinical effectiveness of RAS compared with CLS. In addition, considerable risk of bias has been noted in a review of mainly non‐randomised studies of RAS versus other approaches for hysterectomy (O'Neill 2013).
The high cost of robotic systems may be mitigated if significant clinical benefits over CLS can be independently proven. It has been suggested that costs may also be mitigated by indirect benefits for the surgeon (ergonomics, healthcare costs) (Nieboer 2014).
Our original reviews of RAS in benign and malignant gynaecological disease yielded few high‐quality studies and little evidence to support claims of equivalence and/or superiority over conventional, less expensive approaches (Liu 2012; Lu 2012). Only two small RCTs (both for benign disease) contributed data, and no robust conclusions could be drawn. Over the past few years, the results of several RCTs have been published, potentially providing evidence of the clinical effectiveness of RAS compared with CLS. We have updated this review to aid decision‐making by women, clinicians, and other stakeholders.
Objectives
To assess the effectiveness and safety of RAS in the treatment of women with benign and malignant gynaecological disease.
Methods
Criteria for considering studies for this review
Types of studies
We included randomised controlled trials (RCTs) only.
Types of participants
Women requiring surgery for benign or malignant gynaecological disease at any age.
Types of interventions
-
Robot‐assisted surgery (RAS) versus conventional laparoscopic surgery (CLS).
-
RAS versus open surgery.
-
Comparison of different types of robot assistants.
Types of outcome measures
Primary outcomes
-
Intraoperative complications including injury to the bladder, ureters, bowel, blood vessels, and nerves
-
Postoperative complications including vascular (e.g. haemorrhage, deep vein thrombosis), wound (e.g. infection, dehiscence (wound breakdown)), gastrointestinal (e.g. bowel obstruction due to fibrous adhesions, paralytic ileus due to paralysis of intestinal muscles), incisional hernia (swelling caused by tissue poking through a surgical scar of a previous operation), neurological, respiratory (e.g. pneumonia, embolism (blood clot in a lung blood vessel)), and urinary complications (e.g. acute urinary retention)
Secondary outcomes
For all procedures
-
Early and late mortality (early mortality defined as death within 30 days; late mortality defined as death within three months)
-
Total operating time (from skin incision to closure)
-
Instrument setup time
-
Overall and postoperative duration of hospital stay
-
Estimated blood loss
-
Blood transfusion
-
Rate of conversion to open surgery (for RAS vs CLS)
-
Quality of life (QoL) as assessed using validated scales (e.g. Quality of Life Questionnaire‐Core 30 (QLQ‐C30) ‐ developed to assess the quality of life of people with cancer; Functional Assessment of Cancer Therapy ‐ Ovarian (FACT‐O))
-
Postoperative pain as assessed using visual analogue or other validated scales
-
Total cost (including equipment costs, theatre costs, and cost of hospital stay)
-
Surgeon's performance and workload as assessed by investigators (e.g. using NASA Task Load Index (NASA‐TLX))
Additionally, for cancer surgery
-
Disease‐free survival
-
Overall survival
-
Numbers of lymph nodes harvested: total, pelvic, and para‐aortic lymph nodes
Search methods for identification of studies
Electronic searches
For this review update, we searched the following databases (8 January 2018).
-
Cochrane Central Register of Controlled Trials (CENTRAL; 2017, Issue 12).
-
MEDLINE via Ovid (June 2014 to December week 4 2018).
-
Embase via Ovid (June 2014 to 2018 week 2).
Search strategies can be found in Appendix 1, Appendix 2, and Appendix 3. We identified all potentially eligible articles on PubMed, and we performed searches for related articles using the 'Related articles' feature.
Original searches
We conducted the original searches (14 July 2010) for the review of 'Robotics and malignant disease' as follows (Lu 2012).
-
Cochrane Gynaecological Cancer Review Group Trials Register.
-
CENTRAL (2010, Issue 3).
-
MEDLINE (from 1950 to June week 5 2010).
-
Embase (from 1974 to week 27 2010).
Similarly, we performed the original searches from inception to 21 November 2011, for the review of 'Robotics and benign disease.' In addition, we searched the Cochrane Menstrual Disorders and Subfertility Group (MDSG) Trials Register, the Chinese Biomedical Literature Database (CBM), and Chinese Medical Current Contents (CMCC). Search strategies for the original reviews can be found as appendices to the respective original reviews (Liu 2012; Lu 2012).
Searching other resources
Grey literature
We searched metaRegister, Physicians Data Query, www.controlled‐trials.com/rct, www.clinicaltrials.gov, and www.cancer.gov/clinicaltrials for ongoing trials. We contacted the main investigators of identified ongoing trials for further information.
Handsearching
We handsearched the reference lists of all relevant trials obtained by the search to look for further trials.
Correspondence
We contacted the authors of relevant trials to ask if they knew of further published and unpublished data.
Language restrictions
We sought papers in all languages and carried out translations if necessary.
Data collection and analysis
Selection of studies
For the update, we downloaded all titles and abstracts retrieved by electronic searching to the reference management database Endnote. After de‐duplication, two review authors (DongHao Lu (DL) and Theresa Lawrie (TL)) independently examined the remaining references. We excluded studies that clearly did not meet the inclusion criteria and obtained copies of the full text of potentially relevant references. Two review authors (DL,TL), who resolved disagreements by discussion and if necessary involved a third review author (Hongqian Liu (HL)), assessed studies independently for eligibility. We documented reasons for exclusion.
Data extraction and management
We designed a data extraction form for the combined review and piloted it using two of the eligible studies (Paraiso 2013; Sarlos 2010). Thereafter, two review authors (DL, TL) independently extracted data from eligible studies. When studies had multiple publications, we used the main trial report as the reference and supplemented these data by referring to the secondary papers. When previously included data had been included from unpublished studies (e.g. conference abstracts) that had been subsequently published, we extracted data from the published full texts for this updated review. When necessary, we sought additional information on methodology and data from trial investigators. We resolved differences of opinion by reaching consensus or by obtaining the assistance of a third review author (HL).
When possible, we extracted the following data from each study.
-
Study details: design; setting; country; accrual dates; sample size; inclusion and exclusion criteria; funding source.
-
Participants: diagnosis/indication for procedure (e.g. benign conditions, including fibroids, abnormal bleeding, endometriosis, fertility surgery, vaginal prolapse; malignant disease, including endometrial, cervical, and ovarian cancers); mean age; mean body mass index (BMI); previous abdominal surgery; performance status. Additionally, for cancer studies: disease stage/grade.
-
Interventions: types of interventions compared; numbers randomly assigned and numbers analysed in each group; surgeon experience.
-
Outcomes: for all studies: deaths within 30 days and within three months; postoperative complications; intraoperative complications; types of complications (including bleeding, infection, intraoperative injury, bowel obstruction, other); late complications (including urinary and faecal incontinence, dyspareunia, hernia, other); re‐intervention; re‐admission; total operating time (skin‐to‐skin); operating room time; length of hospital stay; estimated blood loss; blood transfusions; quality of life (QoL) score at four to six weeks and six months postoperatively; activity score at six weeks postoperatively; pain scores (at two weeks or as defined by investigators); total estimated cost (including equipment costs, theatre costs, and costs of hospital stay). For cancer studies: overall survival; disease‐free survival; lymph node yield; duration of response.
Assessment of risk of bias in included studies
We assessed risk of bias in included RCTs using the 'Risk of bias' tool of the Cochrane Collaboration and the criteria specified in Chapter 8 of the Cochrane Handbook for Systematic Reviews of Interventions (Higgins 2011). We assessed the following.
-
Sequence generation (low risk if true random sequence generation was described).
-
Allocation concealment (low risk if sealed, opaque, numbered envelopes or central allocation after registration).
-
Blinding (restricted to blinding of outcome assessors).
-
Incomplete outcome data (considered low risk if > 80% of those randomly assigned were assessed).
-
Selective reporting of outcomes (low risk if prespecified outcomes were reported).
-
Trial funding (low risk if funding was obtained from non‐profit organisations (e.g. government body)).
-
Other possible sources of bias (e.g. a potential source of bias related to the specific study design used, trial stopped early because of some data‐dependent process, extreme baseline imbalance).
Two review authors (DL, TL) applied the 'Risk of bias' tool independently and resolved differences by discussion. We presented the results in 'Risk of bias' tables along with the characteristics of each study, and in a 'Risk of bias' summary graph. We interpreted results of meta‐analyses in the light of findings with respect to risk of bias.
Measures of treatment effect
For dichotomous outcomes (e.g. complications), we extracted the number of women in each group who experienced the outcome of interest (e.g. women who developed the complication) and the number of women assessed at endpoint, to estimate a risk ratio (RR) with 95% confidence interval (CI).
For continuous outcomes (e.g. QoL measures), we extracted the final value and the standard deviation of the outcome of interest and the number of women assessed at endpoint in each treatment arm, at the end of follow‐up, to estimate the mean difference (MD) with 95% CI. In the case of outcomes with continuous data from different scales, we used the standardised mean difference (SMD) with 95% CI.
Time‐to‐event data were not available for this review. For time‐to‐event outcomes (e.g. disease‐free survival), we would have extracted hazard ratios (HRs) and 95% CIs. If these were not presented, we would have attempted to extract the data required to estimate them using Parmar's methods (Parmar 1998) (e.g. number of events in each arm with log‐rank P value comparing relevant outcomes in each arm, relevant data from Kaplan‐Meier survival curves). If it was not possible to estimate the HR, we would have extracted the number of participants in each treatment arm who experienced the outcome of interest and the number of participants assessed to estimate an RR (i.e. dichotomous data). When possible, we extracted data according to intention‐to‐treat analysis, by which we analysed participants in the groups to which they were assigned.
Unit of analysis issues
The unit of analysis was per woman randomly assigned. We included no cross‐over trials and no cluster‐randomised trials.
Dealing with missing data
For included studies, we noted levels of attrition. We did not impute data for any outcomes. If necessary, we contacted the investigators of the primary studies to request missing data, including missing participants due to dropouts and missing statistics. The denominator for each outcome in each trial was the number randomly assigned minus the number of participants whose outcomes were known to be missing. If the numbers randomly assigned and the numbers analysed were inconsistent, we calculated the percentage lost to follow‐up and reported this under Characteristics of included studies.
Assessment of heterogeneity
We checked included studies to determine whether participants, interventions, and outcomes were similar enough to be pooled in a meta‐analysis. We carried out tests for heterogeneity using the Chi² test, with significance set at P value less than 0.1. We explored statistical heterogeneity by visually inspecting forest plots. We used the I² statistic to estimate the total variation across studies that was due to heterogeneity: less than 25% was considered as mild, 25% to 50% as moderate, and greater than 50% as substantial heterogeneity (Higgins 2011). If the primary outcome measures had substantial heterogeneity (I² > 50%), we explored possible sources of heterogeneity by performing sensitivity and subgroup analyses as described below.
Assessment of reporting biases
We assessed within‐study reporting bias by seeking published protocols and comparing outcomes between the protocol and the final published study. This was not possible for all studies. We planned to prepare funnel plots corresponding to meta‐analysis of the primary outcomes to assess the potential for small‐study effects and publication bias if we included 10 or more studies in an analysis. We also planned to assess funnel plot asymmetry visually, and if asymmetry was suggested by visual assessment, we would perform exploratory analyses to investigate this. However, studies were insufficient for evaluation of this type of bias.
Data synthesis
We combined data from included studies using random‐effects (RE) methods with inverse variance weighting for all meta‐analyses (DerSimonian 1986). We chose RE methods because of the clinical heterogeneity of the participants and the different procedures performed (sacrocolpopexy and hysterectomy). We used the Mantel Haenszel method to pool dichotomous data and the inverse variance method for continuous outcomes. For trials with multiple treatment groups, we planned to divide the 'shared' comparison group by the number of treatment groups and the number of comparisons between treatment groups, and to treat the split comparison groups as independent comparisons.
We created 'Summary of findings’ tables in RevMan 5.3 (RevMan 2014), using the GRADE (Grades of Recommendation, Assessment, Development and Evaluation) approach (GRADE 2008). For assessments of the overall quality of evidence for each outcome that included pooled data from RCTs only, we downgraded the evidence from 'high quality' by one level for serious (or by two for very serious) study limitations (risk of bias), indirectness of evidence, serious inconsistency, imprecision of effect estimates, or potential publication bias. We included the following outcomes in the 'Summary of findings' table.
-
Intraoperative and postoperative complications (combined and separate).
-
Total operating time.
-
Length of hospital stay.
-
Blood transfusion.
Subgroup analysis and investigation of heterogeneity
We performed subgroup analyses according to type of surgical procedure (e.g. hysterectomy, sacrocolpopexy) for all outcomes. In addition, we explored potential sources of heterogeneity according to surgeons' experience (30 or fewer robotic procedures or more than 30 robotic procedures performed). We assessed subgroup differences by performing interaction tests available within RevMan (RevMan 2014). We reported the results of subgroup analyses by quoting the Chi² statistic and the P value, as well as the interaction test I² value.
Sensitivity analysis
We conducted sensitivity analyses for the primary outcomes to determine whether the conclusions were robust to arbitrary decisions made regarding eligibility of trials and analysis. These analyses included consideration of whether conclusions would have differed if:
-
eligibility was restricted to studies without high risk of bias for the outcome concerned; or
-
a fixed‐effect model had been adopted.
Results
Description of studies
Results of the search
Searches conducted for the two original reviews contributed the following studies to a combined review.
-
Liu 2012 (benign gynaecological disease) included Sarlos 2010 (conference abstract only) and Paraiso 2011, and excluded three studies (not RCTs). These previously included studies comprised six citations (five conference abstracts and one full published report).
-
Lu 2012 (malignant gynaecological disease) included no studies and excluded 27 studies (not RCTs).
For further details of these searches, please consult the original reviews (Liu 2012; Lu 2012).
2014 update
For the 2014 update of this review, we included four additional studies associated with nine records (Anger 2014; Green 2013; Lonnerfors 2014; Paraiso 2013), and we excluded six records (Campos 2013; Desille‐Gbaguidi 2013; Gocmen 2013; Martinez‐Maestro 2014; McNanley 2012; Palmer 2013) (Figure 1). An additional record that was identified was a later publication (full report) of a previously included study, which had been included based on a conference abstract alone (Sarlos 2010).
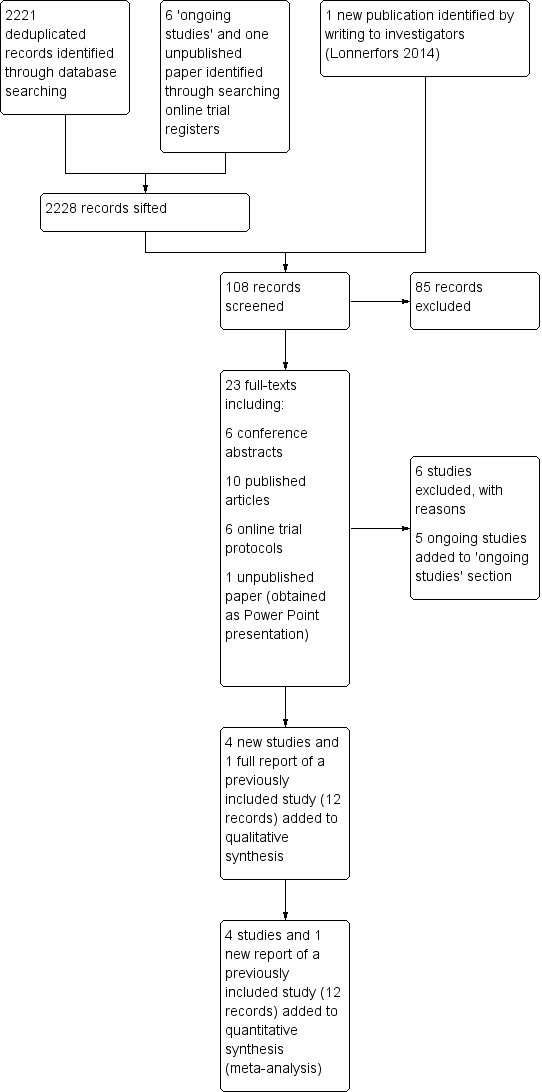
Study flow diagram for updated searches (30 June 2014).
One included study was a conference abstract of a study initially identified as an 'ongoing study' (see study and protocol citation linked to Green 2013). We requested unpublished data from these investigators and received limited data in the form of a Microsoft PowerPoint presentation. We were informed by the investigators that they had difficulty getting the paper published because of 'too many cross‐overs in the stats'; however, we understand that they plan to make further attempts to get the study published. (See Green 2013 in Characteristics of included studies for additional details.)
2018 update
For this latest update, we searched the Cochrane Gynaecological Cancer Review Group Trials Register, the Cochrane Central Register of Controlled Trials (CENTRAL), MEDLINE, and Embase databases on 8 January 2018, and we searched www.ClinicalTrials.gov on 16 January 2018. The combined updated searches yielded 1343 records; we identified one additional record through an online clinical trial registry (Lauszus 2017), and we identified another by following up on an ongoing study (Ramirez 2018). After full text screening of the 41 potentially eligible records identified, we included 12 records associated with six new studies (Costantini 2017; Deimling 2017; LAROSE 2017; Maenpaa 2016; RASHEC 2013; Wijk 2016), and we excluded 25 with reasons (Figure 2). We identified one new ongoing study (Lauszus 2017), and we found six records that were associated with previously included studies.
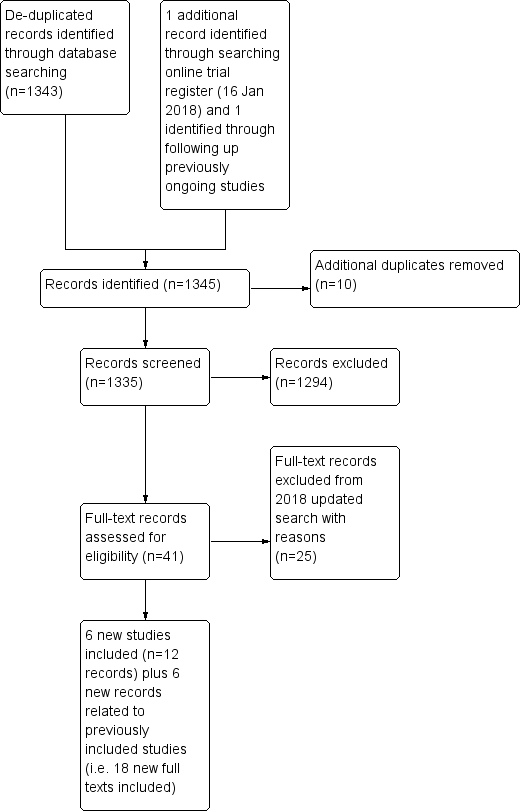
Study flow diagram for updated search (8 January 2018).
Since the last update, three ongoing studies have been completed (LAROSE 2017; Ramirez 2018; RASHEC 2013), and although the other two should have been completed by now, it does not appear that they have been reported yet (Kjolhede 2012; Narducci 2010).
Therefore, in total, this review now reports on 12 included studies (associated with 34 individual records); 61 excluded studies, with reasons; and three ongoing studies.
Included studies
This 2018 update includes 12 studies (six new and six previously included studies) (Anger 2014; Costantini 2017; Deimling 2017; Green 2013; LAROSE 2017; Lonnerfors 2014; Maenpaa 2016; Paraiso 2011; Paraiso 2013; RASHEC 2013; Sarlos 2010; Wijk 2016). All included studies were conducted from 2007 onwards and evaluated RAS versus conventional laparoscopic or open surgery for benign or malignant gynaecological disease. Two of the new included studies were ongoing at the time of the last update (LAROSE 2017; RASHEC 2013).
Study design
All included studies were RCTs. Nine were single‐centre studies (Costantini 2017; Deimling 2017; Green 2013; Lonnerfors 2014; Maenpaa 2016; Paraiso 2011; RASHEC 2013; Sarlos 2010; Wijk 2016); two were conducted at two centres each (Anger 2014; Paraiso 2013), and the LAROSE 2017 study recruited women at three centres. Studies were conducted in the USA (Anger 2014; Deimling 2017; Green 2013; LAROSE 2017; Paraiso 2011; Paraiso 2013), Switzerland (Sarlos 2010), Sweden (Lonnerfors 2014; RASHEC 2013; Wijk 2016), Finland (Maenpaa 2016), and Italy (Costantini 2017).
Participants
Included studies contributed a total of 1016 participants as follows: Anger 2014 (66 women); Costantini 2017 (40 women) ; Deimling 2017 (144 women); Green 2013 (98 women); LAROSE 2017 (74 women); Lonnerfors 2014 (122 women); Maenpaa 2016 (101 women); Paraiso 2011 (78 women); Paraiso 2013 (53 women); RASHEC 2013 (120 women); Sarlos 2010 (100 women); and Wijk 2016 (20 women). Women participating in studies of RAS for hysterectomy were on average in their mid‐40s (Deimling 2017; Green 2013; Lonnerfors 2014; Paraiso 2013; Sarlos 2010), although women undergoing hysterectomy for malignant disease in the RASHEC 2013 and Maenpaa 2016 trials were on average more than 60 years of age. In the studies of RAS for sacrocolpopexy (Anger 2014; Costantini 2017; Paraiso 2011), women were on average about 60 years old. Women undergoing endometrial resection for endometriosis were on average 34 years of age, but the study also included many older women (standard deviation (SD) 34.5 years) (Lonnerfors 2014). Wijk 2016 compared robot‐assisted laparoscopic hysterectomy versus traditional open abdominal hysterectomy (women were on average 52 years of age). Participant body mass indexes (BMIs) were not significantly different between study arms for any of these studies, and reported means and medians ranged between 24 and 32 kg/m².
Indications for hysterectomy were stated as benign gynaecological conditions (mainly uterine fibroids or abnormal bleeding) requiring hysterectomy in most studies; however, Maenpaa 2016 included women with low‐grade endometrial cancer, and the RASHEC 2013 trial recruited women with high‐risk endometrial cancer. Wijk 2016 included women with both benign and malignant gynaecological disease. Two studies stated that they excluded women for whom a vaginal hysterectomy was indicated (Green 2013; Sarlos 2010). In the studies of RAS for sacrocolpopexy, the indication for surgery was symptomatic pelvic organ prolapse. LAROSE 2017 recruited women with endometriosis for endometrial resection (some women had extensive surgery including hysterectomy). Ninety per cent of women in Paraiso 2011 and 42% of women in Anger 2014 had previously undergone a hysterectomy. No significant baseline differences between study arms were described in any of the studies reporting previous abdominal surgery (Lonnerfors 2014; Paraiso 2013; Sarlos 2010), or caesarean section (Green 2013; Lonnerfors 2014). Many of the women in both arms of the LAROSE 2017 study had previous surgery to treat endometriosis. .
Interventions
Two included studies compared RAS versus open surgery (RASHEC 2013: Wijk 2016). Other included trials compared RAS versus CLS. Lonnerfors 2014 compared RAS versus other minimally invasive surgery to include CLS or vaginal hysterectomy. Procedures performed were hysterectomy (Deimling 2017; Green 2013; Lonnerfors 2014; Maenpaa 2016; Paraiso 2013; RASHEC 2013; Sarlos 2010; Wijk 2016), as well as sacrocolpopexy (Anger 2014; Costantini 2017; Paraiso 2011). In addition, one trial examined surgical treatment for endometriosis, which included resection or hysterectomy (LAROSE 2017). In Anger 2014, 58% of women underwent a concomitant hysterectomy, and we noted no statistically significant differences between study arms in the numbers of women undergoing these additional procedures. In Paraiso 2013, concomitant procedures, including culdoplasty, adhesiolysis, and excision of endometriosis, were performed with similar frequency between study arms, with four and three women in the RAS and CLS arms, respectively, undergoing more than one concomitant procedure.
In two studies, surgeons had performed a minimum of 10 relevant RAS procedures (Anger 2014; Paraiso 2011), and in three studies, surgeons had performed 20 or more relevant RAS procedures (Lonnerfors 2014; Paraiso 2013; Sarlos 2010). Costantini 2017, Deimling 2017, Maenpaa 2016, and Wijk 2016 describe those performing surgery as 'experienced surgeons'. In the LAROSE 2017 trial of five surgeons undertaking procedures, only 3 carried out both procedures. RASHEC 2013 reported that five surgeons carried out conventional surgery and only one performed RAS. Green 2013 did not describe the experience of the surgeons.
Outcomes
The most common primary outcomes among these studies were cost in Anger 2014 and Lonnerfors 2014, and operating time in Green 2013,Paraiso 2011,Paraiso 2013, and Sarlos 2010. Most studies included complications and length of hospital stay as secondary outcomes (Costantini 2017; Green 2013; Lonnerfors 2014; Maenpaa 2016; Paraiso 2011; RASHEC 2013; Sarlos 2010). Other stated secondary outcomes included blood loss (Anger 2014; Costantini 2017; Green 2013; LAROSE 2017; Lonnerfors 2014; Sarlos 2010), QoL (Anger 2014; Paraiso 2011; Paraiso 2013; Sarlos 2010; Wijk 2016 ), postoperative pain (Anger 2014; Green 2013; Paraiso 2011; Paraiso 2013), conversion rates (Lonnerfors 2014; Paraiso 2011; Paraiso 2013; Sarlos 2010), and re‐intervention (Anger 2014; Lonnerfors 2014; Sarlos 2010).
Excluded studies
Thirty non‐randomised studies were excluded from the original reviews. For the 2014 updated review, six additional studies were excluded for the following reasons.
-
Quasi‐RCT (Martinez‐Maestro 2014).
-
Not an RCT (Desille‐Gbaguidi 2013; Gocmen 2013).
-
Inappropriate intervention/comparison (Campos 2013; McNanley 2012; Palmer 2013).
For the 2018 update, we excluded 25 studies for the following reasons.
-
Quasi‐RCT (Somashekhar 2014).
-
Inappropriate intervention/comparison (Chen 2015; Diaz‐Feijoo 2016; Landeen 2016; Ramirez 2018; Tsafrir 2017).
-
Not an RCT (all other exclusions).
Please see the Characteristics of excluded studies section for additional details.
Risk of bias in included studies
Overall, we considered one study to be at high risk of bias (Green 2013), and we considered the other studies to be at moderate risk of bias. Risks of bias are summarised in Figure 3 and are detailed below.
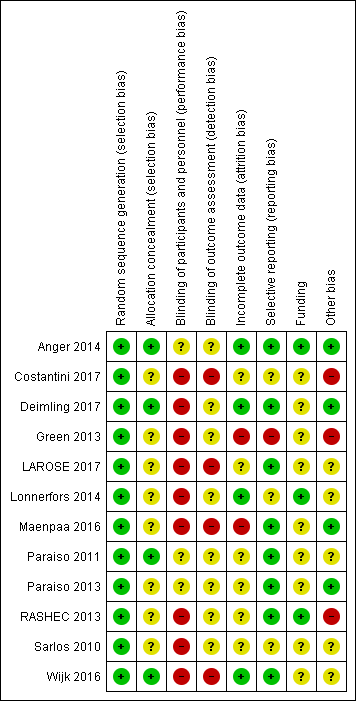
Risk of bias summary: review authors' judgements about each risk of bias item for each included study.
Allocation
All studies were RCTs, and the method of sequence generation assessed was low risk in all of them. RCTs that did not describe allocation concealment clearly we assessed as having some risk of selection bias (Costantini 2017; Green 2013; LAROSE 2017; Lonnerfors 2014; Maenpaa 2016; RASHEC 2013; Sarlos 2010). We considered these studies to be at unclear risk of bias for this item.
Blinding
All of the included studies were at some risk of performance bias, as staff performing surgery would be aware of allocations and this may have had an effect on outcomes. As we described above, two studies were at particular risk of performance bias (LAROSE 2017; RASHEC 2013), as not all surgeons involved in these studies performed both procedures. Three studies described that they attempted to blind participants and assessors to group allocation (Anger 2014; Paraiso 2011; Paraiso 2013). However, it is not clear in any of the included studies who had assessed outcomes such as extent of blood loss and length of hospital stay, which normally are determined by the surgeon who performed the procedure, and therefore they are at potentially high risk of bias.
Incomplete outcome data
Four studies reported no or minimal loss to follow‐up (Anger 2014; Deimling 2017; Lonnerfors 2014; Wijk 2016) (low risk of bias). In Paraiso 2011, five women were withdrawn from each study arm after randomisation (unclear risk of bias). In Paraiso 2013, nine women withdrew after randomisation (five in the CLS group and four in the RAS group), one woman allocated for CLS underwent RAS in error (protocol deviation), and one woman in the CLS group was withdrawn as the result of missing data (unclear risk of bias). Quality of life outcomes in Paraiso 2013 and Sarlos 2010 were subject to attrition greater than 20%, so data for this outcome were considered to be at high risk of bias.
In Green 2013, of 113 women initially randomly assigned, 10 women were withdrawn because procedures were cancelled for medical or personal reasons (eight in the CLS group and two in the RAS group), and five women who had undergone alternative procedures were excluded (three in the CLS group and two in the RAS group). This left 98 participants (48 in the CLS group and 50 in the RAS group), representing attrition of 13% of the sample. In addition, 11 protocol deviations were reported. We considered this study to be at high risk of attrition bias.
We assessed Costantini 2017,LAROSE 2017, and RASHEC 2013 as having unclear risk of bias for this domain.
Selective reporting
Most included studies reported expected and/or pre‐specified outcomes. We considered Green 2013 to be at high risk of reporting bias because of high attrition and protocol deviations with subsequent reporting of data per protocol. In Paraiso 2013, most expected outcomes were reported; however, no details of complications were provided despite the fact that three women required blood transfusions (unclear risk). In Lonnerfors 2014, outcomes were reported for RAS versus minimally invasive surgery (CLS and vaginal hysterectomy) together and separately. However, as separate baseline data were not reported, it is not possible to determine whether there were differences in the baseline characteristics of control group women undergoing CLS or vaginal hysterectomy (unclear risk).
Other potential sources of bias
Two studies were early adopters of RAS (Paraiso 2011; Sarlos 2010). Enrolment for these two studies occurred between 2007 and 2011, and, arguably, data from these studies may have been subject to bias caused by the learning curve, although surgeons in the latter study had performed a minimum of 30 RAS procedures before commencing the trial. Nevertheless, to assess this possibility and to avoid potential bias from early studies in the review findings, we performed sensitivity analyses for most outcomes by excluding these early studies.
In the Paraiso 2011 study report, it is unclear whether participants experienced more than one intraoperative and/or postoperative complication, and it is not possible to determine the direction of any bias as a result. This study also included relatively minor complications (e.g. urinary tract infection), unlike the other studies; this might have contributed heterogeneity to the 'complications' analyses but not bias necessarily. Although we included these data from the analyses, we performed sensitivity analysis by excluding this study.
Lonnerfors 2014 compared RAS with CLS or vaginal hysterectomy, and the comparison intervention was based on the surgeon's choice. As participants were not randomly assigned to CLS and vaginal hysterectomy separately, these separate reported data were potentially subject to significant bias (e.g. a higher percentage of women who underwent CLS had a concomitant procedure (75% CLS, 59% RAS, and 19% vaginal hysterectomy procedures) that would have influenced procedure time, complication rates, length of hospital stay (LOS) and the costs of separate CLS data). Therefore, we extracted combined data, not separate data, from this study. The direction and magnitude of bias resulting from inclusion of these data in this review are unclear.
In Costantini 2017, the mean length of follow‐up was different in the two arms of the trial; it is not clear whether women were recruited for different types of surgery at the same time.
In RASHEC 2013, the fact that a single surgeon carried out all RAS procedures while five surgeons carried out the conventional procedure means that data may be at high risk of bias.
Authors of all studies reported no potential conflicts of interest. Although most study reports declared the main study sponsor to be the institution at which the study was undertaken, it was unclear whether study institutions had received financial support from the system manufacturers, directly or indirectly. Therefore, from a funding perspective, we considered most studies to be at potentially high or unclear risk of bias.
As a result of the small number of included studies, we were unable to meaningfully evaluate publication bias as planned; however, one included study with significant protocol deviations remains unpublished (Green 2013).
Effects of interventions
See: Summary of findings for the main comparison Robot‐assisted surgery compared with conventional laparoscopic surgery for hysterectomy; Summary of findings 2 Robot‐assisted surgery compared with conventional laparoscopic surgery for sacrocolpopexy
1. RAS versus CLS (hysterectomy)
Intraoperative and postoperative complications
No clear differences in complication rates were reported between RAS and CLS arms (risk ratio (RR) 0.92, 95% confidence interval (CI) 0.54 to 1.59; participants = 585; studies = 6; I² = 51%; low‐certainty evidence; Analysis 1.1). We downgraded this evidence to 'low' because of study design limitations in studies contributing data and imprecision in the effect estimate. We examined studies including women with non‐malignant versus malignant disease separately; we found no clear evidence of differences in effect in these two subgroups (test for subgroup differences: Chi² = 1.92, df = 1 (P = 0.17), I² = 48.0%).
Intraoperative complications only
No clear differences in intraoperative complication rates were found between RAS and CLS arms for women undergoing hysterectomy (RR 1.05, 95% CI 0.31 to 3.56; participants = 487; studies = 5; I2 = 28%; low‐certainty evidence; Analysis 1.2). Tests for subgroup differences suggest that the treatment effect may be different in women with malignant versus non‐malignant disease (P = 0.08; I2 = 68.4%). We downgraded this evidence to 'low' as a result of imprecision and study limitations (risk of bias concerns).
Intraoperative injury
For the specific complication 'intraoperative injury', we noted no clear differences between RAS and CLS arms, with low event rates in both arms (RR 1.62, 95% CI 0.20 to 12.91; participants = 269; studies = 3; I² = 0%; low‐certainty evidence; Analysis 1.3). Studies recruiting women with non‐malignant disease only reported these outcomes.
Postoperative complications only
With regard to postoperative complications for hysterectomy procedures, researchers found no clear differences between RAS and CLS arms (RR 0.82, 95% CI 0.42 to 1.59; participants = 533; studies = 5; I2 = 51%); low‐certainty evidence; Analysis 1.4). We downgraded this evidence to 'low' as the result of imprecision and study limitations.
Bleeding complications
For the specific outcome 'bleeding complications' (e.g. vaginal haematoma), researchers found no clear differences between RAS and CLS arms (RR 0.41, 95% CI 0.10 to 1.66; participants = 367; studies = 4; I2 = 17%); low‐certainty evidence; Analysis 1.5). The point estimate in favour of RAS was heavily influenced by a single study (Lonnerfors 2014), in which 2 of 61 women in the RAS arm developed vaginal haematoma compared with 11 of 61 women in the CLS arm.
Infection complications
Overall, we noted no significant differences between RAS and CLS arms with regard to average wound infection rates (RR 0.62, 95% CI 0.13 to 2.88; participants = 367; studies = 4; I² = 2%; low‐certainty evidence; Analysis 1.6).
Death within 30 days
No studies reported this outcome.
Operating time
Mean total operating time was longer on average in the RAS arm than in the CLS arm, although the difference between groups did not reach statistical significance. We noted high statistical heterogeneity for this outcome, with average operating times varying considerably in the two studies contributing data to this outcome (mean difference (MD) 41.18 minutes, 95% CI ‐6.17 to 88.53; participants = 148; studies = 2; I² = 80%; very low‐certainty evidence; Analysis 1.7). We downgraded evidence for study design limitations, heterogeneity, and imprecision.
Two studies reported this outcome as median (range). Median total operating times reported for the RAS arm versus minimally invasive arms in Lonnerfors 2014 were 76 minutes (43 to 210) versus 86 minutes (29 to 223), respectively (P = 0.54). Likewise, for Green 2013, median total operating times were 90 minutes (74 to 104) and 88 minutes (75 to 105), respectively (P = 0.69). These individual study data, which shed a favourable light on RAS, were at high risk of bias for the reasons previously mentioned (see Risk of bias in included studies).
Results for mean operating room time were similar to those for mean total operating time, although the difference (favouring RAS) reached statistical significance (MD 44.35, 95% CI 5.22 to 83.47; participants = 148; studies = 2; I² = 59%). This result is based on findings from two studies with design limitations and moderately high heterogeneity and relates to women with non‐malignant disease undergoing hysterectomy (Analysis 1.8).
Length of hospital stay
Mean length of hospital stay in days differed slightly between RAS and CLS (MD ‐0.30 days, 95% CI ‐0.53 to ‐0.07; participants = 192; studies = 2; I² = 0%; very low‐certainty evidence). However, data for this outcome were derived from two relatively small trials, and length of stay varied considerably in these two studies (mean stay in CLS groups was 3.6 days in Sarlos 2010 vs 1.4 days in the later Lonnerfors 2014 study; Analysis 1.9). Therefore results are difficult to interpret.
Conversion to another approach
We noted no significant differences between RAS and CLS approaches with regard to rate of conversion (RR 1.17, 95% CI 0.24 to 5.77; participants = 269; studies = 3; I² = 0%; low‐certainty evidence; Analysis 1.10).
Blood transfusions and blood loss
Four studies reported blood transfusions and noted no statistically significant differences between RAS and CLS arms (RR 2.49, 95% CI 0.75 to 8.23; participants = 346; studies = 4; I2 = 0%; low‐certainty evidence; Analysis 1.12), There was no clear difference in effect between subgroups of women with non‐malignant versus malignant disease (Tests for subgroup differences: Chi² = 0.02, df = 1 (P = 0.88), I² = 0%).
Pain
Two studies reported postoperative pain at different time points within the first two weeks (Green 2013; Paraiso 2013). However, only one study provided usable data (means) for meta‐analysis (Paraiso 2013).
Paraiso 2013 reported pain scores during normal activities at two weeks post hysterectomy, with no significant differences between study arms (MD ‐2.00, 95% CI ‐16.08 to 12.08; participants = 36; Analysis 1.13).
Green 2013 (a high risk of bias study) reported median postoperative pain scores and found no significant differences between RAS and CLS arms following hysterectomy (P = 0.73).
Quality of life
One study reported quality of life at four to six weeks (Sarlos 2010), and another study at six months (Paraiso 2013). None of the studies reporting these data described significant differences in QoL, except for Sarlos 2010. This study initially found a greater change in QoL at six weeks compared with before the operation in the RAS group (MD 8.00, 95% CI 3.12 to 12.88; participants = 95), but this self‐reported outcome was subject to significant risk of bias. At six months, a different study found no significant differences between groups (MD 5.00, 95% CI ‐3.01 to 13.01; participants = 38).
Re‐intervention/re‐admission
We noted no significant difference between RAS and CLS with regard to the number of cases requiring re‐intervention (RR 0.25, 95% CI 0.03 to 2.17; participants = 122; studies = 1; Analysis 1.16) or re‐admission (RR 0.46, 95% CI 0.14 to 1.48; participants = 220; studies = 2; I2 = 0%; Analysis 1.17). These data were sparse and were at risk of bias (i.e. very low‐ to low‐certainty evidence).
Cost
One study reported overall costs (including equipment setup and maintenance and theatre and hospital admission costs) (Lonnerfors 2014; ) Analysis 1.18), which were higher for RAS than for CLS.
Lymph node yield
No data were found for this outcome.
2. RAS versus CLS (sacrocolpopexy)
Intraoperative and postoperative complications
Three studies reported this outcome; overall researchers found no clear differences in rates of complications between women undergoing sacrocolpopexy by RAS or CLS (RR 0.95, 95% CI 0.21 to 4.24; participants = 186; studies = 3; I² = 78%; very low‐certainty evidence). We noted high statistical heterogeneity for this outcome and downgraded results for study design limitations and imprecision.
Intraoperative complications
Researchers reported no clear differences between groups for intraoperative complications (RR 0.82, 95% CI 0.09 to 7.59; participants = 108; studies = 2; I² = 47%; very low‐certainty evidence; Analysis 2.2) or intraoperative injuries (RR 0.87, 95% CI 0.28 to 2.70; participants = 186; studies = 3; I² = 4%; low‐certainty evidence; Analysis 2.3).
Postoperative complications
One study reported more early postoperative complications in the RAS group; however data were not simple to interpret because it is not clear whether women suffered more than one complication (RR 3.54, 95% CI 1.31 to 9.56; participants = 68; very low‐certainty evidence; Analysis 2.4). Infection appeared more frequent in the RAS group; data on postoperative complications were sparse and showed no significant differences between groups (RR 1.89, 95% CI 0.63 to 5.68; participants = 68; studies = 1).
Death up to 30 days
Authors of the included trials did not report this outcome.
Total operating time
RAS was associated with increased operating time, although we noted high heterogeneity for this outcome; on average, operating time was 40.53 minutes longer in the RAS group (MD 40.53 minutes, 95% CI 12.06 to 68.99; participants = 186; studies = 3; I² = 73%; low‐certainty evidence; Analysis 2.7). Findings for total operating room time were similar, and again we observed high heterogeneity between studies (MD 43.24, 95% CI 0.12 to 86.35; participants = 146; studies = 2; I² = 84%; Analysis 2.8).
Length of hospital stay
Two studies reported length of hospital stay for women undergoing RAS versus CLS for sacrocolpopexy. Very low‐certainty evidence suggested little or no difference between the two techniques in terms of duration of stay (MD 0.26 days, 95% CI ‐0.15 to 0.67; participants = 108; studies = 2; I² = 0%; Analysis 2.9).
Conversion to another approach
Only one study reported conversion to another surgical approach; in the RLS group, 3 of 35 converted to another method, and in the CLS group, 2 of 35 converted. Numbers were too small to permit meaningful conclusions (RR 1.41, 95% CI 0.25 to 7.94).
Blood loss and blood transfusion
Trial authors did not report the number of women undergoing blood transfusion. Two studies reported estimated mean blood loss, which appeared to be slightly reduced in the RAS group, although mean blood loss in both arms was not consistent in the two studies contributing data (MD ‐15.17, 95% CI ‐26.43 to ‐3.91; participants = 118; studies = 2; I² = 0%).
Pain
Anger 2014 reported mean pain scores one week postoperatively. Differences in pain scores favoured the CLS arm but were not statistically significant (MD 0.90, 95% CI ‐0.06 to 1.86; participants = 78; very low‐certainty evidence; Analysis 1.13). Although it did not contribute data to the meta‐analysis, another sacrocolpopexy study reported that the RAS group had significantly greater pain at rest and with activity during weeks 3 to 5 and required longer use of non‐steroidal anti‐inflammatory drugs (NSAIDs) (median 20 days vs 11 days; P < .005) (Paraiso 2011). This low‐quality evidence suggests that, when performed for sacrocolpopexy, RAS may be associated with greater postoperative pain than is noted with CLS.
Quality of life
Anger 2014 reported QoL scores at six weeks; mean scores were almost identical in the two arms (MD ‐0.01, 95% CI ‐0.06 to 0.04; participants = 78).
Paraiso 2011 also measured QoL at 12 months; however, data were insufficient for meta‐analysis.
Re‐intervention and re‐admission to hospital
Authors of included studies did not report hospital re‐admission. Two studies reported the numbers of women requiring re‐intervention after the initial surgery. The number of women requiring further surgery was too small to allow meaningful analysis (RR 0.47, 95% CI 0.06 to 3.59; participants = 173; studies = 2; very low‐certainty evidence; Analysis 2.16).
Cost
Two studies reported costs of the two surgical approaches; we noted very high heterogeneity between these studies and did not combine the results. Conventional surgery appeared to be associated with lower costs when compared with RAS (seeAnalysis 2.18).
Non‐prespecified outcomes
One study reported longer‐term complications (sexual dysfunction and urinary tract infection); few women experienced these complications, we noted no clear differences between surgical approaches for either outcome (RR 0.90, 95% CI 0.06 to 13.48; RR 0.18, 95% CI 0.01 to 3.56; participants = 40; studies = 1, respectively).
3. RAS versus open abdominal surgery (hysterectomy)
Only two studies evaluated this comparison, one among 20 women with non‐malignant disease (Wijk 2016), and the other among 120 women with high‐risk endometrial cancer (RASHEC 2013). For most outcomes, only one of these studies contributed data and evidence from RASHEC 2013 was downgraded by two levels for risk of bias (see Risk of bias in included studies). Evidence for the following outcomes suggesting that there may be little or no difference between the two approaches was rated very low certainty:
-
Intraoperative and postoperative complications: Analysis 3.1.
-
Intraoperative complications: Analysis 3.2.
-
Postoperative complications: Analysis 3.3.
-
Death within 30 days: RASHEC 2013 reported that no deaths occurred in either arm within 30 days; Analysis 3.4.
-
Bleeding complications: Analysis 3.5
-
Infection complications: Analysis 3.6
-
Blood loss and blood transfusion: Analysis 3.7.
-
Re‐admission: Analysis 3.9.
Quality of life
One study (Wijk 2016) reported that, at 4 weeks post‐operation, more women in the open abdominal surgery group than in the RAS group reported some restriction in activities of daily living (RR 0.25, 95% CI 0.07 to 0.90; participants = 20; studies = 1; very low certainty evidence, Analysis 3.8).
Costs
RASHEC 2013 reported cost data from Sweden, which suggest that the average cost of RAS may be about USD 1568 less than open surgery (MD ‐1568.00 US dollars, 95% CI ‐3100.75 to ‐35.25; participants = 96; studies = 1; low certainty evidence, Analysis 3.10).
Total operating time
In RASHEC 2013 this was reported as mean (range) and the mean operating time was 233 minutes in the RAS group (range 166 to 320 minutes) compared with 187 minutes in the CLS group (range 109 to 300) (P > 0.001) (low‐certainty evidence).
Hospital stay
RASHEC 2013 reported this outcome as medians (range) and median hospital stay was 2 days (1‐5 days) in the RAS group and 5 days (4 to 9 days) in the open surgery group ; i.e findings suggest that hospital stays may be shorter with RAS than with open abdominal surgery (low certainty evidence) These data are difficult to interpret because a single surgeon carried out all RAS procedures but five (possibly less experienced) surgeons carried out the open surgical procedures.
Lymph node yield
Evidence from RASHEC 2013 suggest that para‐aortic and pelvic lymph node yields may be lower with RAS than with open abdominal surgery (mean yield 42 in the RAS group vs 50 in the CLS group) (MD ‐8.00, 95% CI ‐14.97 to ‐1.03; participants = 96, studies = 1; low‐certainty evidence).
4. RAS versus CLS for endometriosis
A single study that provided data for 73 women is included in this comparison; women with endometriosis underwent procedures ranging from relatively minor endometrial resection through hysterectomy; many of the women included in this study had undergone previous surgery for their condition. For most outcomes, event rates were low and the sample size was insufficient to show potential differences between groups (resulting in very low‐certainty to low‐certainty evidence).
Intraoperative complications
Researchers found no clear differences between surgical techniques for intraoperative complications (RR 0.36, 95% CI 0.04 to 3.32; participants = 73), which included urethral complications and bowel injury; they reported four events overall.
Postoperative complications
Researchers reported no significant differences in postoperative complications between groups; however results are difficult to interpret because it is not clear from the published results whether an individual woman may have had more than one complication (RR 0.78, 95% CI 0.40 to 1.51; participants = 73). For postoperative infection, it appeared that women undergoing RAS were at lower risk of infection (6/35 vs 12/38 women for the CLS group); although the 95% CI for this outcome was wide, differences between groups did not reach statistical significance (RR 0.54, 95% CI 0.23 to 1.29). Trial authors did not report overall length of hospital stay.
Total operating time
Researchers identified little or no difference in mean operating time between the two surgical approaches (MD 5.00 minutes, 95% CI ‐20.71 to 30.71; participants = 73). Results for total operating room time were similar (MD 5.90, 95% CI ‐22.31 to 34.11).
Conversion to another approach
Only one woman (in the CLS group) required conversion to another approach (RR 0.36, 95% CI 0.02 to 8.58; participants = 73).
Hospital re‐admission
Event rates were low for this outcome, and researchers provided no clear evidence of any differences in the number of women needing re‐admission to hospital (RR 0.72, 95% CI 0.13 to 4.08).
Blood loss
Trial authors did not report the number of women requiring blood transfusion. The mean estimated blood loss for women undergoing surgery via different approaches was not significantly different (MD 57.10, 95% CI ‐20.08 to 134.28; participants = 73). These data are very difficult to interpret because the standard deviations (SDs) were very high in both arms of the trial; this study included women with a broad range of severity of disease who were undergoing surgery, with some women undergoing extensive surgery.
Quality of life
Researchers reported unadjusted QoL scores at six weeks and at six months. It appears that QoL scores were higher in the CLS group at six weeks post surgery; however these results are difficult to interpret because baselines scores were also higher in the CLS group than in the RAS group (MD ‐2.30, 95% CI ‐3.79 to ‐0.81; participants = 73). Scores at six months were very similar in both arms of the trial, and no significant differences were evident between groups (MD 1.30, 95% CI ‐0.58 to 3.18; participants = 73).
Pain
Trial authors reported pain scores at six months and noted no clear differences between groups (MD 3.30, 95% CI ‐8.31 to 14.91; participants = 73).
Discussion
Summary of main results
This is the second update of this review. We included 12 randomised controlled trials (RCTs) involving 1016 women. Studies were at moderate to high overall risk of bias, and we downgraded evidence mainly due to concerns about risk of bias among studies contributing data and imprecision of effect estimates. Procedures performed were hysterectomy (eight studies) and sacrocolpopexy (three studies). Two studies of hysterectomy involved women with endometrial cancer. In addition, one trial examined surgical treatment for endometriosis, which included resection or hysterectomy.
For the comparison RAS versus CLS for hysterectomy, researchers found no clear differences in complication rates between robot‐assisted surgery (RAS) and conventional laparoscopy surgery (CLS) arms (low‐certainty evidence). We examined separately studies including women with non‐malignant versus malignant disease and found no clear evidence of a difference in effect between subgroups, with only one study contributing data to the malignant disease subgroup of this comparison.
Review authors noted no clear differences in intraoperative complication rates between RAS and CLS arms (low‐certainty evidence). Testing for subgroup differences suggests that the treatment effect may be different for women with malignant versus non‐malignant disease; however, the difference between RAS and CLS was not significant in either group. For postoperative complications, we noted no statistically significant differences between RAS and CLS arms (low‐certainty evidence).
Pooled data from two studies suggest that mean total operating time was longer on average in the RAS arm than in the CLS arm, although the difference between groups did not reach statistical significance. We noted high statistical heterogeneity for this outcome, with average operating times varying considerably in the two studies contributing data (very low‐certainty evidence). Three studies reported this outcome as median values (range), but their results were not consistent. Mean length of hospital stay in days differed slightly between RAS and CLS arms (very low‐certainty evidence). However, data for this outcome were derived from two relatively small trials, for which length of stay varied considerably (mean stay in CLS groups 3.6 days in one study vs 1.4 days in a later study). Four studies reported blood transfusions and revealed no statistically significant differences between RAS and CLS arms (low‐certainty evidence).
For the comparison RAS versus CLS for sacrocolpopexy, three studies reported intraoperative and postoperative complications. Overall researchers found no clear difference in rates of these complications between women undergoing sacrocolpopexy by RAS or CLS (very low‐certainty evidence), and no clear differences in intraoperative complications between these groups (very low‐certainty evidence). In one study, early postoperative complications were higher in the RAS group; however, these data are difficult to interpret because it is not clear whether women suffered more than one complication (very low‐certainty evidence). None of the included studies reported death up to 30 days.
RAS was associated with increased operating time, although heterogeneity for this outcome was high; on average, operating time was 40.53 minutes longer in the RAS group (low‐certainty evidence). Two studies reported length of stay for women undergoing RAS versus CLS for sacrocolpopexy. Very low‐certainty evidence suggests there was little or no difference between the two techniques in terms of duration of stay. Researchers did not report the number of women undergoing blood transfusion.
Only two studies evaluated RAS against open surgery, one among 20 women with non‐malignant disease and the other among 96 women with high‐risk endometrial cancer. For most outcomes, only one of these studies contributed data and the evidence was mostly of a very low certainty. Low‐certainty evidence from the study among women with endometrial cancer suggests that lymph node yields may be lower with RAS, operating time may be longer, hospital stays may be shorter, and overall costs may be less than open surgery; survival outcomes were not reported.
For RAS versus CLS for endometriosis, a single study with 73 women contributed data. Women in this study underwent procedures ranging from relatively minor endometriosis resection through hysterectomy, and many women had undergone previous surgery for their condition. For most outcomes, event rates were low, and the sample size was insufficient to show potential differences between groups.
Neither of the studies conducted among women with endometrial cancer reported survival outcomes.
Comprehensive economic analysis was beyond the scope of this review; this aspect of RAS requires further independent evaluation.
Overall completeness and applicability of evidence
Evidence related to non‐malignant gynaecological disease is incomplete overall, and available evidence is applicable only to hysterectomy and sacrocolpopexy procedures. In addition, we are not sure whether review findings apply to all women requiring these procedures or selected groups of women, as inclusion and exclusion criteria varied across the studies.
For malignant disease, we found little evidence on the effectiveness and safety of RAS compared with CLS or open surgery for endometrial cancer. Neither of the two included studies reported disease‐free and overall survival outcomes. In one study, one surgeon performed all the RAS procedures and five different surgeons performed all the comparison procedures, so it was not possible to distinguish the effects of RAS from the effects of the surgeon/s on the outcomes reported and these findings may not be applicable to other surgeons and settings.
Increased postoperative pain with RAS for sacrocolpopexy procedures, as observed in Paraiso 2011 and Anger 2014, which may have been due to the extra port (RAS required five ports), larger size or different locations of trocars, longer operating time, or robotic rather than manual manipulation of trocars throughout a longer procedure, requires further investigation.
Quality of the evidence
Much uncertainty remains regarding the estimate of several important effects of RAS versus CLS, and we most commonly assessed the certainty of review findings as low or very low. The main reasons for downgrading the certainty of evidence for these outcomes were inconsistency and imprecision of results across the small number of included studies, which, in general, could not be attributed to differences in the types of procedures undertaken. Given the limited data for the different procedures included, the average effect of one study could have had a large potential effect on the size and direction of the overall effect estimate. We therefore expect that further research will have an important impact on review findings and will likely change the estimate of effects for intraoperative and postoperative complications, among others.
Potential biases in the review process
We conducted a rigorous process to identify all relevant studies; we therefore consider this review to be comprehensive in identifying all eligible studies. After a thorough discussion of the merits and implications for risk of bias, we excluded one quasi‐RCT conducted in women requiring hysterectomy (Martinez‐Maestro 2014). Women in this study were allocated to RAS or CLS "according to the position on the hospital waiting list and the availability of the robot on the day of surgery"; investigators reported that "neither the researchers nor the surgeons had the possibility to interfere with the allocation". Slight imbalances in age (slightly older participants in the CLS group) and in uterine weight (slightly smaller in the RAS group) might have been due to chance.
The original reviews included only two studies between them: Sarlos 2010 and Paraiso 2011. It has been suggested that studies conducted by early robot adopters may be subject to bias (Lonnerfors 2014). Surgeons in the two early studies had performed a minimum of 10 and 30 RAS procedures, respectively. Sarlos 2010 reported the need to undock the robot in six women to cut the uterus into piecemeal sizes for removal. The other included studies did not describe this procedure, and it is not clear how, if at all, similar problems were overcome by other researchers. We did not pre specify technical issues as an outcome; however, we presume these would have an impact on procedure time.
Extracted data for intraoperative and postoperative complications were investigator‐defined. We used these data as reported, without censoring for minor complications (e.g. urinary tract infection). This may have accounted for some of the heterogeneity observed among the included studies.
To our knowledge, two studies identified as ongoing in the 2014 version of this review have not yet published results (Kjolhede 2012; Narducci 2010). We were unable to obtain a status report from contact authors, and further investigation of this potential source of reporting bias was not possible.
Agreements and disagreements with other studies or reviews
The learning curve for RAS in gynaecology has been addressed in several studies, which show that it may vary according to the type of procedure involved. Learning curve analyses for benign disease suggest that competency (for which operating time is frequently a surrogate marker) is gained upon completion of approximately 20 procedures (Bell 2009), whereas for radical hysterectomy in women with cervical cancer, proficiency might be achieved after 28 procedures have been performed (Yim 2013).
Several studies have suggested that the learning curve for RAS is shorter than for CLS, and therefore gynaecological surgeons who are inexperienced in CLS should consider performing RAS (Green 2013). Findings of a shorter operating time with RAS versus CLS in a quasi‐RCT with surgeons relatively inexperienced in both approaches might support this suggestion (Martinez‐Maestro 2014). However, a report from a setting in the USA where RAS accounted for almost 23% of all hysterectomies in 2011 stated that resident doctor involvement in RAS was less with the robotic approach than with any other route (Jeppson 2014). Thus the impact of this technology on surgical training of young doctors appears considerably uncertain.
A large RCT of minimally invasive versus abdominal radical hysterectomy for early cervical cancer has reported results showing that minimally invasive surgery was associated with higher rates of death and recurrence when compared with open surgery (Ramirez 2018). Unfortunately, this study did not fit our review criteria, as only 15.6% of minimally invasive procedures in the experimental arm of the study were robot‐assisted, the others were done by laparoscopy, and allocation to RAS or laparoscopy was not randomised (see Characteristics of excluded studies). This trial closed for this reason before the full sample size had been accrued (631/740 participants had been accrued). However, its overall findings suggest that minimally invasive techniques might not be equally effective for malignant disease, which generally involves more extensive surgery and greater surgical experience. Further research is needed to test the robustness of this single study and to understand the extent to which biological or surgical factors might affect outcomes for cervical cancer surgery.
An economic evaluation of RAS in gynaecology was beyond the scope of this review. However, a recent economic evaluation of RAS for hysterectomy concluded that without longer‐term or functional outcome data, the additional expense of RAS may not be justified in a budget‐constrained health system (Teljeur 2014). In the light of our findings, current evidence related to the clinical effectiveness of RAS across a range of gynaecological procedures remains of low certainty or unproven. Once effectiveness is proved, additional indirect factors such as the surgeon's well‐being, particularly with respect to physically demanding laparoscopic and open surgery for gynaecological cancers, may become important cost considerations. However, without more robust evidence on clinical effectiveness and safety, it will not be possible to accurately assess the cost‐effectiveness of RAS in gynaecology.

Study flow diagram for updated searches (30 June 2014).

Study flow diagram for updated search (8 January 2018).

Risk of bias summary: review authors' judgements about each risk of bias item for each included study.

Comparison 1 Robot‐assisted surgery versus conventional laparoscopic surgery (hysterectomy), Outcome 1 Intraoperative and postoperative complications.

Comparison 1 Robot‐assisted surgery versus conventional laparoscopic surgery (hysterectomy), Outcome 2 Intraoperative complications.

Comparison 1 Robot‐assisted surgery versus conventional laparoscopic surgery (hysterectomy), Outcome 3 Complications: intraoperative injury.

Comparison 1 Robot‐assisted surgery versus conventional laparoscopic surgery (hysterectomy), Outcome 4 Postoperative complications.

Comparison 1 Robot‐assisted surgery versus conventional laparoscopic surgery (hysterectomy), Outcome 5 Complications: bleeding.

Comparison 1 Robot‐assisted surgery versus conventional laparoscopic surgery (hysterectomy), Outcome 6 Complications: infection.

Comparison 1 Robot‐assisted surgery versus conventional laparoscopic surgery (hysterectomy), Outcome 7 Total operating time.
![Comparison 1 Robot‐assisted surgery versus conventional laparoscopic surgery (hysterectomy), Outcome 8 Operating room time [min].](/es/cdsr/doi/10.1002/14651858.CD011422.pub2/media/CDSR/CD011422/image_n/nCD011422-CMP-001-08.png)
Comparison 1 Robot‐assisted surgery versus conventional laparoscopic surgery (hysterectomy), Outcome 8 Operating room time [min].

Comparison 1 Robot‐assisted surgery versus conventional laparoscopic surgery (hysterectomy), Outcome 9 Overall hospital stay.

Comparison 1 Robot‐assisted surgery versus conventional laparoscopic surgery (hysterectomy), Outcome 10 Conversion to another approach.

Comparison 1 Robot‐assisted surgery versus conventional laparoscopic surgery (hysterectomy), Outcome 11 Blood transfusions.

Comparison 1 Robot‐assisted surgery versus conventional laparoscopic surgery (hysterectomy), Outcome 12 Estimated blood loss.

Comparison 1 Robot‐assisted surgery versus conventional laparoscopic surgery (hysterectomy), Outcome 13 Pain at 1 to 2 weeks.

Comparison 1 Robot‐assisted surgery versus conventional laparoscopic surgery (hysterectomy), Outcome 14 Quality of life (6 weeks).

Comparison 1 Robot‐assisted surgery versus conventional laparoscopic surgery (hysterectomy), Outcome 15 Quality of life (6 months).

Comparison 1 Robot‐assisted surgery versus conventional laparoscopic surgery (hysterectomy), Outcome 16 Re‐intervention.

Comparison 1 Robot‐assisted surgery versus conventional laparoscopic surgery (hysterectomy), Outcome 17 Re‐admission.

Comparison 1 Robot‐assisted surgery versus conventional laparoscopic surgery (hysterectomy), Outcome 18 Overall cost.

Comparison 2 Robot‐assisted surgery versus conventional laparoscopic surgery (sacrocolpopexy)), Outcome 1 Intraoperative and postoperative complications.

Comparison 2 Robot‐assisted surgery versus conventional laparoscopic surgery (sacrocolpopexy)), Outcome 2 Intraoperative complications.

Comparison 2 Robot‐assisted surgery versus conventional laparoscopic surgery (sacrocolpopexy)), Outcome 3 Complications: intraoperative injury.

Comparison 2 Robot‐assisted surgery versus conventional laparoscopic surgery (sacrocolpopexy)), Outcome 4 Postoperative complications.

Comparison 2 Robot‐assisted surgery versus conventional laparoscopic surgery (sacrocolpopexy)), Outcome 6 Complications: infection.

Comparison 2 Robot‐assisted surgery versus conventional laparoscopic surgery (sacrocolpopexy)), Outcome 7 Total operating time.
![Comparison 2 Robot‐assisted surgery versus conventional laparoscopic surgery (sacrocolpopexy)), Outcome 8 Operating room time [min].](/es/cdsr/doi/10.1002/14651858.CD011422.pub2/media/CDSR/CD011422/image_n/nCD011422-CMP-002-08.png)
Comparison 2 Robot‐assisted surgery versus conventional laparoscopic surgery (sacrocolpopexy)), Outcome 8 Operating room time [min].

Comparison 2 Robot‐assisted surgery versus conventional laparoscopic surgery (sacrocolpopexy)), Outcome 9 Overall hospital stay.

Comparison 2 Robot‐assisted surgery versus conventional laparoscopic surgery (sacrocolpopexy)), Outcome 10 Conversion to another approach.
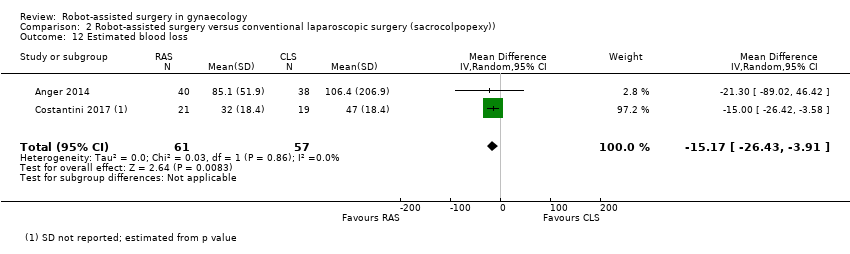
Comparison 2 Robot‐assisted surgery versus conventional laparoscopic surgery (sacrocolpopexy)), Outcome 12 Estimated blood loss.

Comparison 2 Robot‐assisted surgery versus conventional laparoscopic surgery (sacrocolpopexy)), Outcome 13 Pain at 1 to 2 weeks.

Comparison 2 Robot‐assisted surgery versus conventional laparoscopic surgery (sacrocolpopexy)), Outcome 14 Quality of life (6 weeks).

Comparison 2 Robot‐assisted surgery versus conventional laparoscopic surgery (sacrocolpopexy)), Outcome 16 Re‐intervention.

Comparison 2 Robot‐assisted surgery versus conventional laparoscopic surgery (sacrocolpopexy)), Outcome 18 Overall cost.

Comparison 2 Robot‐assisted surgery versus conventional laparoscopic surgery (sacrocolpopexy)), Outcome 19 Complications: urinary incontinence.

Comparison 2 Robot‐assisted surgery versus conventional laparoscopic surgery (sacrocolpopexy)), Outcome 20 Complications: sexual dysfunction.

Comparison 3 Robot‐assisted laparoscopic surgery versus open abdominal surgery (hysterectomy), Outcome 1 Intraoperative and postoperative complications.

Comparison 3 Robot‐assisted laparoscopic surgery versus open abdominal surgery (hysterectomy), Outcome 2 Intraoperative complications.

Comparison 3 Robot‐assisted laparoscopic surgery versus open abdominal surgery (hysterectomy), Outcome 3 Postoperative complications.

Comparison 3 Robot‐assisted laparoscopic surgery versus open abdominal surgery (hysterectomy), Outcome 4 Death within 30 days.

Comparison 3 Robot‐assisted laparoscopic surgery versus open abdominal surgery (hysterectomy), Outcome 5 Complications: bleeding.

Comparison 3 Robot‐assisted laparoscopic surgery versus open abdominal surgery (hysterectomy), Outcome 6 Complications: infection.

Comparison 3 Robot‐assisted laparoscopic surgery versus open abdominal surgery (hysterectomy), Outcome 7 Blood transfusions.

Comparison 3 Robot‐assisted laparoscopic surgery versus open abdominal surgery (hysterectomy), Outcome 8 Quality of life (4 weeks).
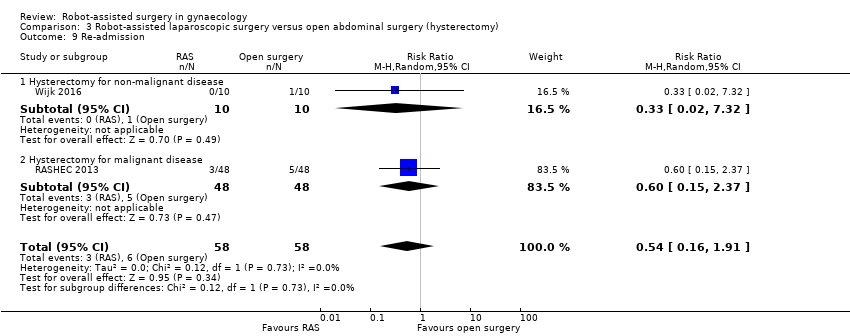
Comparison 3 Robot‐assisted laparoscopic surgery versus open abdominal surgery (hysterectomy), Outcome 9 Re‐admission.

Comparison 3 Robot‐assisted laparoscopic surgery versus open abdominal surgery (hysterectomy), Outcome 10 Overall cost.

Comparison 3 Robot‐assisted laparoscopic surgery versus open abdominal surgery (hysterectomy), Outcome 11 Lymph node yield.

Comparison 4 Robot‐assisted surgery for endometriosis versus conventional laparoscopic surgery, Outcome 1 Intraoperative complications.

Comparison 4 Robot‐assisted surgery for endometriosis versus conventional laparoscopic surgery, Outcome 2 Postoperative complications.

Comparison 4 Robot‐assisted surgery for endometriosis versus conventional laparoscopic surgery, Outcome 3 Complications: infection.

Comparison 4 Robot‐assisted surgery for endometriosis versus conventional laparoscopic surgery, Outcome 4 Total operating time.
![Comparison 4 Robot‐assisted surgery for endometriosis versus conventional laparoscopic surgery, Outcome 5 Operating room time [min].](/es/cdsr/doi/10.1002/14651858.CD011422.pub2/media/CDSR/CD011422/image_n/nCD011422-CMP-004-05.png)
Comparison 4 Robot‐assisted surgery for endometriosis versus conventional laparoscopic surgery, Outcome 5 Operating room time [min].

Comparison 4 Robot‐assisted surgery for endometriosis versus conventional laparoscopic surgery, Outcome 6 Conversion to another approach.

Comparison 4 Robot‐assisted surgery for endometriosis versus conventional laparoscopic surgery, Outcome 7 Estimated blood loss.
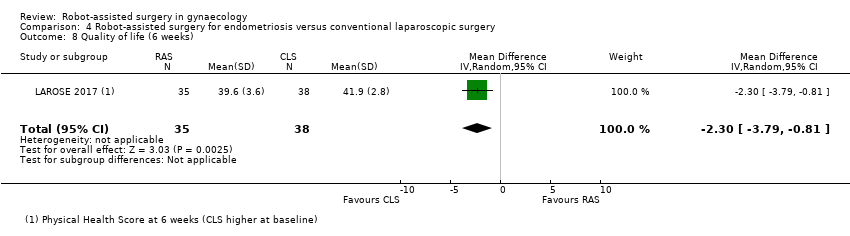
Comparison 4 Robot‐assisted surgery for endometriosis versus conventional laparoscopic surgery, Outcome 8 Quality of life (6 weeks).

Comparison 4 Robot‐assisted surgery for endometriosis versus conventional laparoscopic surgery, Outcome 9 Quality of life (6 months).

Comparison 4 Robot‐assisted surgery for endometriosis versus conventional laparoscopic surgery, Outcome 10 Re‐admission.

Comparison 4 Robot‐assisted surgery for endometriosis versus conventional laparoscopic surgery, Outcome 11 Pain at 6 months.
| Robot‐assisted surgery compared with conventional laparoscopic surgery for hysterectomy | ||||||
| Patient or population: women undergoing hysterectomy | ||||||
| Outcomes | Anticipated absolute effects* (95% CI) | Relative effect | No. of participants | Certainty of the evidence | Comments | |
| Risk with conventional laparoscopic surgery (hysterectomy) | Risk with robot‐assisted surgery | |||||
| Intraoperative and postoperative complications | 164 per 1000 | 151 per 1000 | RR 0.92 | 585 | ⊕⊕⊝⊝ | No significant differences between subgroups (women treated for malignant vs non‐malignant disease) |
| Intraoperative complications | 52 per 1000 | 56 per 1000 | RR 1.05 | 487 | ⊕⊕⊝⊝ | Number of participants reported to experience these complications was relatively small. Difference between non‐malignant and malignant disease subgroups was not statistically significant (P = 0.08) |
| Postoperative complications | 140 per 1000 | 115 per 1000 | RR 0.82 | 533 | ⊕⊕⊝⊝ | No significant differences between subgroups (women treated for malignant vs non‐malignant disease) |
| Total operating time | Mean total operating time across included studies ranged from 75 to 102.7 minutes | MD 41.18 higher | ‐ | 148 | ⊕⊝⊝⊝ | Studies involved women with non‐malignant disease only |
| Overall hospital stay | Mean stay across included studies ranged from 1.4 to 3.6 days | MD 0.3 lower | ‐ | 192 | ⊕⊝⊝⊝ | Studies involved women with non‐malignant disease only |
| Blood transfusions | 20 per 1000 | 50 per 1000 | RR 2.49 | 346 | ⊕⊕⊝⊝ | No significant differences between subgroups (women treated for malignant vs non‐malignant disease) |
| *The risk in the intervention group (and its 95% confidence interval) is based on the assumed risk in the comparison group and the relative effect of the intervention (and its 95% CI). | ||||||
| GRADE Working Group grades of evidence. | ||||||
| aStudies contributing data had serious design limitations. | ||||||
| Robot‐assisted surgery compared with conventional laparoscopic surgery for sacrocolpopexy | ||||||
| Patient or population: gynaecology | ||||||
| Outcomes | Anticipated absolute effects* (95% CI) | Relative effect | No. of participants | Certainty of the evidence | Comments | |
| Risk with conventional laparoscopic surgery (sacrocolpopexy) | Risk with robot‐assisted surgery | |||||
| Intraoperative and postoperative complications | 200 per 1000 | 190 per 1000 | RR 0.95 | 186 | ⊕⊝⊝⊝ | |
| Intraoperative complications | 77 per 1000 | 63 per 1000 | RR 0.82 | 108 | ⊕⊝⊝⊝ | |
| Postoperative complications | 121 per 1000 | 429 per 1000 | RR 3.54 | 68 | ⊕⊕⊝⊝ | |
| Total operating time | Mean total operating time across studies ranged from 178.4 to 199 minutes | MD 40.53 higher | ‐ | 186 | ⊕⊕⊝⊝ | |
| Overall hospital stay | Mean overall hospital stay across included studies ranged from 1.4 to 3.8 days | MD 0.26 higher | ‐ | 108 | ⊕⊝⊝⊝ | |
| Blood transfusions | Not estimable | |||||
| *The risk in the intervention group (and its 95% confidence interval) is based on the assumed risk in the comparison group and the relative effect of the intervention (and its 95% CI). | ||||||
| GRADE Working Group grades of evidence. | ||||||
| aStudies contributing data had design limitations. | ||||||
| Outcome or subgroup title | No. of studies | No. of participants | Statistical method | Effect size |
| 1 Intraoperative and postoperative complications Show forest plot | 6 | 585 | Risk Ratio (M‐H, Random, 95% CI) | 0.92 [0.54, 1.59] |
| 1.1 Hysterectomy for non‐malignant disease | 5 | 486 | Risk Ratio (M‐H, Random, 95% CI) | 0.76 [0.38, 1.53] |
| 1.2 Hysterectomy for malignant disease | 1 | 99 | Risk Ratio (M‐H, Random, 95% CI) | 1.47 [0.79, 2.72] |
| 2 Intraoperative complications Show forest plot | 5 | 487 | Risk Ratio (M‐H, Random, 95% CI) | 1.05 [0.31, 3.56] |
| 2.1 Hysterectomy for non‐malignant disease | 4 | 388 | Risk Ratio (M‐H, Random, 95% CI) | 1.66 [0.76, 3.61] |
| 2.2 Hysterectomy for malignant disease | 1 | 99 | Risk Ratio (M‐H, Random, 95% CI) | 0.11 [0.01, 1.97] |
| 3 Complications: intraoperative injury Show forest plot | 3 | 269 | Risk Ratio (M‐H, Random, 95% CI) | 1.62 [0.20, 12.91] |
| 3.1 Hysterectomy for non‐malignant disease | 3 | 269 | Risk Ratio (M‐H, Random, 95% CI) | 1.62 [0.20, 12.91] |
| 4 Postoperative complications Show forest plot | 5 | 533 | Risk Ratio (M‐H, Random, 95% CI) | 0.82 [0.42, 1.59] |
| 4.1 Hysterectomy for non‐malignant disease | 4 | 434 | Risk Ratio (M‐H, Random, 95% CI) | 0.61 [0.34, 1.09] |
| 4.2 Hysterectomy for malignant disease | 1 | 99 | Risk Ratio (M‐H, Random, 95% CI) | 1.76 [0.91, 3.43] |
| 5 Complications: bleeding Show forest plot | 4 | 367 | Risk Ratio (M‐H, Random, 95% CI) | 0.41 [0.10, 1.66] |
| 5.1 Hysterectomy for non‐malignant disease | 4 | 367 | Risk Ratio (M‐H, Random, 95% CI) | 0.41 [0.10, 1.66] |
| 6 Complications: infection Show forest plot | 4 | 367 | Risk Ratio (M‐H, Random, 95% CI) | 0.62 [0.13, 2.88] |
| 6.1 Hysterectomy for non‐malignant disease | 4 | 367 | Risk Ratio (M‐H, Random, 95% CI) | 0.62 [0.13, 2.88] |
| 7 Total operating time Show forest plot | 2 | 148 | Mean Difference (IV, Random, 95% CI) | 41.18 [‐6.17, 88.53] |
| 7.1 Hysterectomy for non‐malignant disease | 2 | 148 | Mean Difference (IV, Random, 95% CI) | 41.18 [‐6.17, 88.53] |
| 8 Operating room time [min] Show forest plot | 2 | 148 | Mean Difference (IV, Random, 95% CI) | 44.35 [5.22, 83.47] |
| 8.1 Hysterectomy for non‐malignant disease | 2 | 148 | Mean Difference (IV, Random, 95% CI) | 44.35 [5.22, 83.47] |
| 9 Overall hospital stay Show forest plot | 2 | 192 | Mean Difference (IV, Random, 95% CI) | ‐0.30 [‐0.53, ‐0.07] |
| 9.1 Hysterectomy for non‐malignant disease | 2 | 192 | Mean Difference (IV, Random, 95% CI) | ‐0.30 [‐0.53, ‐0.07] |
| 10 Conversion to another approach Show forest plot | 3 | 269 | Risk Ratio (M‐H, Random, 95% CI) | 1.17 [0.24, 5.77] |
| 11 Blood transfusions Show forest plot | 4 | 346 | Risk Ratio (M‐H, Random, 95% CI) | 2.49 [0.75, 8.23] |
| 11.1 Hysterectomy for non‐malignant disease | 3 | 247 | Risk Ratio (M‐H, Random, 95% CI) | 1.94 [0.30, 12.76] |
| 11.2 Hysterectomy for malignant disease | 1 | 99 | Risk Ratio (M‐H, Random, 95% CI) | 2.94 [0.62, 13.87] |
| 12 Estimated blood loss Show forest plot | 1 | 95 | Mean Difference (IV, Random, 95% CI) | 7.0 [‐18.26, 32.26] |
| 12.1 Hysterectomy for non‐malignant disease | 1 | 95 | Mean Difference (IV, Random, 95% CI) | 7.0 [‐18.26, 32.26] |
| 13 Pain at 1 to 2 weeks Show forest plot | 1 | 36 | Mean Difference (IV, Random, 95% CI) | ‐2.0 [‐16.08, 12.08] |
| 13.1 Hysterectomy for non‐malignant disease | 1 | 36 | Mean Difference (IV, Random, 95% CI) | ‐2.0 [‐16.08, 12.08] |
| 14 Quality of life (6 weeks) Show forest plot | 1 | 95 | Mean Difference (IV, Random, 95% CI) | 8.0 [3.12, 12.88] |
| 14.2 Hysterectomy for non‐malignant disease | 1 | 95 | Mean Difference (IV, Random, 95% CI) | 8.0 [3.12, 12.88] |
| 15 Quality of life (6 months) Show forest plot | 1 | 38 | Mean Difference (IV, Random, 95% CI) | 5.0 [‐3.01, 13.01] |
| 15.1 Hysterectomy for non‐malignant disease | 1 | 38 | Mean Difference (IV, Random, 95% CI) | 5.0 [‐3.01, 13.01] |
| 16 Re‐intervention Show forest plot | 1 | 122 | Risk Ratio (M‐H, Random, 95% CI) | 0.25 [0.03, 2.17] |
| 16.1 Hysterectomy for non‐malignant disease | 1 | 122 | Risk Ratio (M‐H, Random, 95% CI) | 0.25 [0.03, 2.17] |
| 17 Re‐admission Show forest plot | 2 | 220 | Risk Ratio (M‐H, Random, 95% CI) | 0.46 [0.14, 1.48] |
| 17.1 Hysterectomy for non‐malignant disease | 2 | 220 | Risk Ratio (M‐H, Random, 95% CI) | 0.46 [0.14, 1.48] |
| 18 Overall cost Show forest plot | 1 | Mean Difference (IV, Random, 95% CI) | Subtotals only | |
| 18.1 Hysterectomy for non‐malignant disease | 1 | 97 | Mean Difference (IV, Random, 95% CI) | 1564.0 [1079.57, 2048.43] |
| 18.2 Hysterectomy for malignant disease | 0 | 0 | Mean Difference (IV, Random, 95% CI) | 0.0 [0.0, 0.0] |
| Outcome or subgroup title | No. of studies | No. of participants | Statistical method | Effect size |
| 1 Intraoperative and postoperative complications Show forest plot | 3 | 186 | Risk Ratio (M‐H, Random, 95% CI) | 0.95 [0.21, 4.24] |
| 2 Intraoperative complications Show forest plot | 2 | 108 | Risk Ratio (M‐H, Random, 95% CI) | 0.82 [0.09, 7.59] |
| 3 Complications: intraoperative injury Show forest plot | 3 | 186 | Risk Ratio (M‐H, Random, 95% CI) | 0.87 [0.28, 2.70] |
| 4 Postoperative complications Show forest plot | 1 | 68 | Risk Ratio (M‐H, Random, 95% CI) | 3.54 [1.31, 9.56] |
| 5 Complications: bleeding | 0 | Risk Ratio (M‐H, Random, 95% CI) | Subtotals only | |
| 6 Complications: infection Show forest plot | 1 | 68 | Risk Ratio (M‐H, Random, 95% CI) | 1.89 [0.63, 5.68] |
| 7 Total operating time Show forest plot | 3 | 186 | Mean Difference (IV, Random, 95% CI) | 40.53 [12.06, 68.99] |
| 8 Operating room time [min] Show forest plot | 2 | 146 | Mean Difference (IV, Random, 95% CI) | 43.24 [0.12, 86.35] |
| 9 Overall hospital stay Show forest plot | 2 | 108 | Mean Difference (IV, Random, 95% CI) | 0.26 [‐0.15, 0.67] |
| 10 Conversion to another approach Show forest plot | 1 | 68 | Risk Ratio (M‐H, Random, 95% CI) | 1.41 [0.25, 7.94] |
| 11 Blood transfusions | 0 | Risk Ratio (M‐H, Random, 95% CI) | Subtotals only | |
| 12 Estimated blood loss Show forest plot | 2 | 118 | Mean Difference (IV, Random, 95% CI) | ‐15.17 [‐26.43, ‐3.91] |
| 13 Pain at 1 to 2 weeks Show forest plot | 1 | 78 | Mean Difference (IV, Random, 95% CI) | 0.90 [‐0.06, 1.86] |
| 14 Quality of life (6 weeks) Show forest plot | 1 | 78 | Mean Difference (IV, Random, 95% CI) | ‐0.01 [‐0.06, 0.04] |
| 15 Quality of life (6 months) | 0 | Mean Difference (IV, Random, 95% CI) | Totals not selected | |
| 16 Re‐intervention Show forest plot | 2 | 173 | Risk Ratio (M‐H, Random, 95% CI) | 0.47 [0.06, 3.59] |
| 17 Re‐admission | 0 | Risk Ratio (M‐H, Random, 95% CI) | Subtotals only | |
| 18 Overall cost Show forest plot | 2 | Mean Difference (IV, Random, 95% CI) | Subtotals only | |
| 19 Complications: urinary incontinence Show forest plot | 1 | 40 | Risk Ratio (M‐H, Random, 95% CI) | 0.18 [0.01, 3.56] |
| 20 Complications: sexual dysfunction Show forest plot | 1 | 40 | Risk Ratio (M‐H, Random, 95% CI) | 0.90 [0.06, 13.48] |
| Outcome or subgroup title | No. of studies | No. of participants | Statistical method | Effect size |
| 1 Intraoperative and postoperative complications Show forest plot | 1 | 20 | Risk Ratio (M‐H, Random, 95% CI) | 0.33 [0.02, 7.32] |
| 1.1 Hysterectomy for non‐malignant disease | 1 | 20 | Risk Ratio (M‐H, Random, 95% CI) | 0.33 [0.02, 7.32] |
| 2 Intraoperative complications Show forest plot | 1 | 96 | Risk Ratio (M‐H, Random, 95% CI) | 0.25 [0.03, 2.16] |
| 2.1 Hysterectomy for non‐malignant disease | 0 | 0 | Risk Ratio (M‐H, Random, 95% CI) | 0.0 [0.0, 0.0] |
| 2.2 Hysterectomy for malignant disease | 1 | 96 | Risk Ratio (M‐H, Random, 95% CI) | 0.25 [0.03, 2.16] |
| 3 Postoperative complications Show forest plot | 2 | 116 | Risk Ratio (M‐H, Random, 95% CI) | 0.67 [0.35, 1.27] |
| 3.1 Hysterectomy for non‐malignant disease | 1 | 20 | Risk Ratio (M‐H, Random, 95% CI) | 0.33 [0.02, 7.32] |
| 3.2 Hysterectomy for malignant disease | 1 | 96 | Risk Ratio (M‐H, Random, 95% CI) | 0.69 [0.36, 1.32] |
| 4 Death within 30 days Show forest plot | 1 | 96 | Risk Ratio (M‐H, Random, 95% CI) | 0.0 [0.0, 0.0] |
| 4.1 Hysterectomy for malignant disease | 1 | 96 | Risk Ratio (M‐H, Random, 95% CI) | 0.0 [0.0, 0.0] |
| 5 Complications: bleeding Show forest plot | 1 | Risk Ratio (M‐H, Random, 95% CI) | Subtotals only | |
| 5.1 Hysterectomy for malignant disease | 1 | 96 | Risk Ratio (M‐H, Random, 95% CI) | 0.33 [0.01, 7.98] |
| 6 Complications: infection Show forest plot | 1 | 20 | Risk Ratio (M‐H, Random, 95% CI) | 0.33 [0.02, 7.32] |
| 6.1 Hysterectomy for non‐malignant disease | 1 | 20 | Risk Ratio (M‐H, Random, 95% CI) | 0.33 [0.02, 7.32] |
| 7 Blood transfusions Show forest plot | 1 | Risk Ratio (M‐H, Random, 95% CI) | Subtotals only | |
| 7.1 Hysterectomy for malignant disease | 1 | 96 | Risk Ratio (M‐H, Random, 95% CI) | 0.33 [0.01, 7.98] |
| 8 Quality of life (4 weeks) Show forest plot | 1 | 20 | Risk Ratio (M‐H, Random, 95% CI) | 0.25 [0.07, 0.90] |
| 8.1 Hysterectomy for non‐malignant disease | 1 | 20 | Risk Ratio (M‐H, Random, 95% CI) | 0.25 [0.07, 0.90] |
| 9 Re‐admission Show forest plot | 2 | 116 | Risk Ratio (M‐H, Random, 95% CI) | 0.54 [0.16, 1.91] |
| 9.1 Hysterectomy for non‐malignant disease | 1 | 20 | Risk Ratio (M‐H, Random, 95% CI) | 0.33 [0.02, 7.32] |
| 9.2 Hysterectomy for malignant disease | 1 | 96 | Risk Ratio (M‐H, Random, 95% CI) | 0.6 [0.15, 2.37] |
| 10 Overall cost Show forest plot | 1 | 96 | Mean Difference (IV, Random, 95% CI) | ‐1568.0 [‐3100.75, ‐35.25] |
| 10.1 Hysterectomy for malignant disease | 1 | 96 | Mean Difference (IV, Random, 95% CI) | ‐1568.0 [‐3100.75, ‐35.25] |
| 11 Lymph node yield Show forest plot | 1 | 96 | Mean Difference (IV, Random, 95% CI) | ‐8.0 [‐14.97, ‐1.03] |
| 11.1 Hysterectomy for malignant disease | 1 | 96 | Mean Difference (IV, Random, 95% CI) | ‐8.0 [‐14.97, ‐1.03] |
| Outcome or subgroup title | No. of studies | No. of participants | Statistical method | Effect size |
| 1 Intraoperative complications Show forest plot | 1 | 73 | Risk Ratio (M‐H, Random, 95% CI) | 0.36 [0.04, 3.32] |
| 2 Postoperative complications Show forest plot | 1 | 73 | Risk Ratio (M‐H, Random, 95% CI) | 0.78 [0.40, 1.51] |
| 3 Complications: infection Show forest plot | 1 | 73 | Risk Ratio (M‐H, Random, 95% CI) | 0.54 [0.23, 1.29] |
| 4 Total operating time Show forest plot | 1 | 73 | Mean Difference (IV, Random, 95% CI) | 5.0 [‐20.71, 30.71] |
| 5 Operating room time [min] Show forest plot | 1 | 73 | Mean Difference (IV, Random, 95% CI) | 5.90 [‐22.31, 34.11] |
| 6 Conversion to another approach Show forest plot | 1 | 73 | Risk Ratio (M‐H, Random, 95% CI) | 0.36 [0.02, 8.58] |
| 7 Estimated blood loss Show forest plot | 1 | 73 | Mean Difference (IV, Random, 95% CI) | 57.10 [‐20.08, 134.28] |
| 8 Quality of life (6 weeks) Show forest plot | 1 | 73 | Mean Difference (IV, Random, 95% CI) | ‐2.30 [‐3.79, ‐0.81] |
| 9 Quality of life (6 months) Show forest plot | 1 | 73 | Mean Difference (IV, Random, 95% CI) | 1.30 [‐0.58, 3.18] |
| 10 Re‐admission Show forest plot | 1 | 73 | Risk Ratio (M‐H, Random, 95% CI) | 0.72 [0.13, 4.08] |
| 11 Pain at 6 months Show forest plot | 1 | 73 | Mean Difference (IV, Fixed, 95% CI) | 3.30 [‐8.31, 14.91] |