Bolo obligatorio automatizado versus infusión basal para el mantenimiento de la analgesia epidural durante el trabajo de parto
Información
- DOI:
- https://doi.org/10.1002/14651858.CD011344.pub2Copiar DOI

- Base de datos:
-
- Cochrane Database of Systematic Reviews
- Versión publicada:
-
- 17 mayo 2018see what's new
- Tipo:
-
- Intervention
- Etapa:
-
- Review
- Grupo Editorial Cochrane:
-
Grupo Cochrane de Anestesia
- Copyright:
-
- Copyright © 2018 The Cochrane Collaboration. Published by John Wiley & Sons, Ltd.
Cifras del artículo
Altmetric:
Citado por:
Autores
Contributions of authors
Conceiving the review: Ban Leong Sng (SBL), Fahad Javaid Siddiqui (FJS), Pryseley N Assam (PNA), Alex T Sia (AS), Edwin SY Chan (EC), Wan Ling Leong (LWL), Ting Ting Oh (OTT), Yanzhi Zeng (ZYZ), Nurun Nisa Amatullah de Souza (NNAdS), Nian‐Lin R Han (NLRH).
Co‐ordinating the review: SBL, FJS, ZYZ, NNAdS.
Undertaking manual searches: FJS, PNA.
Screening search results: SBL, FJS, PNA, ZYZ, NNAdS.
Organizing retrieval of papers: SBL, LWL, OTT.
Screening retrieved papers against inclusion criteria: SBL, LWL, OTT.
Appraising quality of papers: SBL, LWL, OTT.
Abstracting data from papers: SBL, LWL, OTT.
Writing to authors of papers for additional information: SBL, LWL, OTT.
Providing additional data about papers: SBL, LWL, OTT.
Obtaining and screening data on unpublished studies: SBL, LWL, OTT.
Data management for the review: SBL, FJS, PNA, AS, EC, LWL, OTT, ZYZ, NNAdS, NLRH.
Entering data into Review Manager 5 (RevMan 5): SBL, FJS, PNA, OTT, ZYZ, NNAdS, NLRH.
RevMan 5 statistical data: SBL, FJS, PNA, EC, ZYZ, NNAdS, NLRH.
Other statistical analysis not using RevMan: SBL, FJS, PNA, EC, NNAdS, NLRH.
Interpretation of data: SBL, FJS, PNA, AS, EC, LWL, OTT, ZYZ, NNAdS, NLRH.
Statistical inferences: SBL, FJS, PNA, EC, NNAdS.
Writing the review: SBL, FJS, PNA, AS, EC, LWL, OTT, ZYZ, NNAdS, NLRH.
Securing funding for the review: SBL.
Performing previous work that was the foundation of the present study: SBL, AS.
Guarantor for the review (one author): SBL.
Person responsible for reading and checking review before submission: SBL.
Sources of support
Internal sources
-
KK Women's and Children's Hospital, Singapore.
Research time utilised
External sources
-
Duke‐NUS Graduate Medical School, Singapore.
Research time utilised
-
Singapore Clinical Research Institute, Singapore.
Research time utilised
Declarations of interest
Ban Leong Sng: none known.
Yanzhi Zeng: none known.
Fahad Javaid Siddiqui: none known.
Pryseley N Assam: none known.
Edwin SY Chan: none known.
Wan Ling Leong: none known.
Ting Ting Oh: none known.
Alex T Sia is an author of six of the studies that are included in this review: Chua 2004; Leo 2010; Lim 2005; Lim 2010; Sia 2007; Sia 2013. The variable frequency automated mandatory bolus technique described in Sia 2013 prompted the filing of a patent for the technique.
Nurun Nisa Amatullah de Souza: none known.
Nian‐Lin R Han: none known.
Acknowledgements
We would like to thank Rodrigo Cavallazzi (content editor), Jing Xie (statistical editor), Stephen Halpern, Argyro Fassoulaki, Sui Cheung Yu (peer reviewers) and Wendy Free (consumer referee) for their help and editorial advice during the preparation of this systematic review.
We thank Dr Cynthia Wong for providing and analysing the data for Wong 2006, Dr Giorgio Capogna for providing and analysing the data for Capogna 2011, and Dr Leopoldo Ferrer for providing and analysing the data for Ferrer 2017.
We would also like to thank Rodrigo Cavallazzi (content editor), Cathal Walsh (statistical editor), Sui Cheung Yu, Stephen Halpern and Giorgio Capogna (peer‐referees) for their help and editorial advice during the preparation of the protocol for the systematic review (Sng 2014).
Version history
| Published | Title | Stage | Authors | Version |
| 2023 Jun 05 | Automated mandatory bolus versus basal infusion for maintenance of epidural analgesia in labour | Review | Hon Sen Tan, Yanzhi Zeng, Yueyue Qi, Rehena Sultana, Chin Wen Tan, Alex T Sia, Ban Leong Sng, Fahad J Siddiqui | |
| 2018 May 17 | Automated mandatory bolus versus basal infusion for maintenance of epidural analgesia in labour | Review | Ban Leong Sng, Yanzhi Zeng, Nurun Nisa A de Souza, Wan Ling Leong, Ting Ting Oh, Fahad Javaid Siddiqui, Pryseley N Assam, Nian‐Lin R Han, Edwin SY Chan, Alex T Sia | |
| 2014 Oct 16 | Automated mandatory bolus versus basal infusion for maintenance of epidural analgesia in labour | Protocol | Ban Leong Sng, Yanzhi Zeng, Wan Ling Leong, Ting Ting Oh, Fahad Javaid Siddiqui, Pryseley N Assam, Edwin SY Chan, Alex T Sia | |
Differences between protocol and review
We made the following changes to the protocol (Sng 2014).
-
Nurun Nisa Amatullah de Souza and Nian‐Lin R Han joined the review team in 2016.
-
We did not search the metaRegister of Controlled Trials (mRCT). This was because the service was under review and was not accessible.
-
We have edited the wording of our Objectives section to conform with the Cochrane Handbook for Systematic Reviews of Interventions (Higgins 2011). The underlying aims remain the same.
-
We have edited the criteria for considering studies for this review, to be more concise and relevant. This has not, however, led to any study being included or excluded on this basis.
-
Under types of studies, we stated that we would exclude studies that did not use automated administration of bolus doses. This is to clarify that we would not include studies that involved clinician administration of bolus doses or automated administration of varying continuous infusions (non‐boluses).
-
Under types of participants, we have only included studies that recruited pregnant term women and excluded studies that recruited women with complicated pregnancies including preterm labour, multiple pregnancy, and malposition of the fetus.
-
Under types of interventions, we have added criteria that were previously written under the heading 'Type of participants'. This is because the information is more suited to this section. There has been no overall change to either the inclusion or exclusion criteria.
-
-
Under measures of treatment effects, we did not calculate the numbers needed to treat to benefit/harm as it was not indicated. We otherwise separated the data as dichotomous/categorical and continuous and presented them as planned.
-
Under 'Dealing with missing data', we chose to contact the authors for missing data. The other methods discussed in the protocol such as worst‐case scenario analysis and imputation were not possible due to lack of the raw data of the studies.
-
Under 'Summary of findings table', we did not construct separate tables for the two interventions but placed them under one unified table.
-
We did not perform subgroup analyses for nulliparous versus multiparous women as only one study, Wong 2006, included parous women, and examination of our results showed removing or including this study as a subgroup would not have affected any of the outcomes in a meaningful way.
-
We did not include subgroup analyses for the following outcomes, as after dividing the data by subgroups led to no meaningful difference between subgroups (low heterogeneity).
-
Risk of caesarean delivery.
-
Risk of instrumental delivery.
-
Maternal satisfaction.
-
-
We included subgroup analyses for the following outcomes where relevant when comparison between subgroups showed a meaningful difference.
-
Risk of breakthrough pain ‐ epidural technique: epidural alone versus combined spinal‐epidural technique.
-
Duration of labour ‐ PCEA: regimens that used PCEA versus those that did not.
-
Local anaesthetic consumption per hour ‐ PCEA: regimens that used PCEA versus those that did not.
-
-
We also did not include subgroups for data in which no subgroups were present.
-
Risk of breakthrough pain ‐ all studies used local anaesthetic plus opioids; there was no study that utilized local anaesthetic alone.
-
Maternal satisfaction ‐ all included studies utilized local anaesthetic with opioids; there was no study that utilized local anaesthetic alone. All included studies utilized CSE; there was no study that utilized epidural alone.
-
-
We changed the reporting of Apgar scores from ordinal (in the protocol) to continuous (in the review) based on how studies reported the outcome. In addition we reviewed the data qualitatively due to heterogeneity in reporting by the various studies. We therefore did not include it in the 'Summary of findings' table.
-
We ended up reporting maternal satisfaction qualitatively due to the ordinal nature of the data, so we did not include it in the 'Summary of findings' table.
-
We went on to perform subgroup analyses for outcomes that had considerable heterogeneity (i.e. I2 > 75%) because the analyses were pre‐planned; however, we interpreted the results of only the clinically meaningful subgroups in the 'Results' section.
-
We used the Mantel‐Haenszel risk ratio method for dichotomous outcomes and did not use the Peto method because the events were not rare, i.e. the highest study event rate is more than 10%. We did not pool the Apgar score and instead interpreted the outcome qualitatively because of the lack of data for this outcome. Where there was moderate to high heterogeneity, we used random‐effects estimates to interpret the results. Otherwise, we interpreted the fixed‐effect estimate.
We regarded heterogeneity as considerable if I2 was greater than 75%, substantial if I2 was between 50% and 90%, moderate if I2 was between 30% and 60%, and low if I2 was less than 40%.
Keywords
MeSH
Medical Subject Headings (MeSH) Keywords
Medical Subject Headings Check Words
Female; Humans; Pregnancy;
PICO
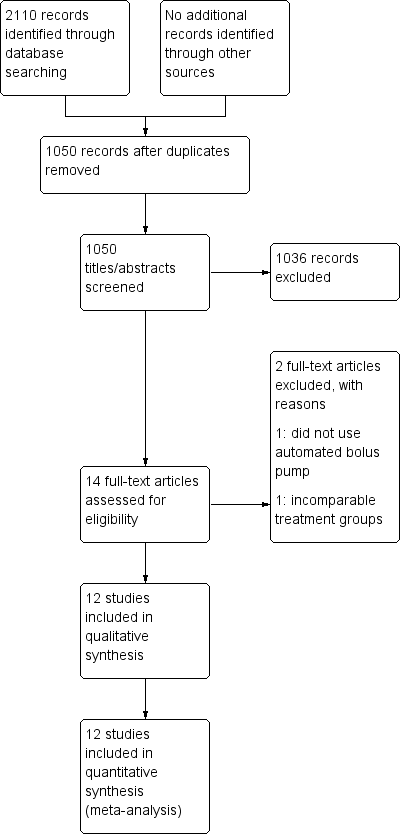
Study flow diagram.
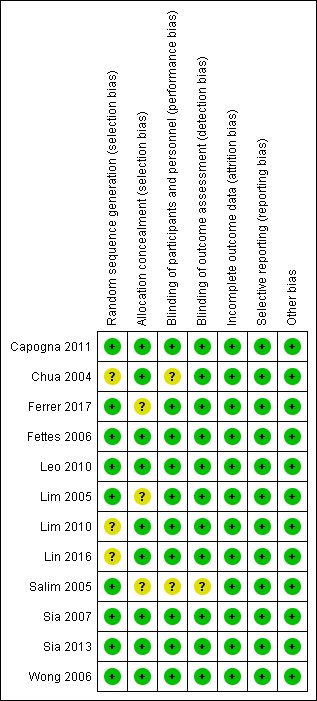
Risk of bias summary: review authors' judgements about each risk of bias item for each included study.

Risk of bias graph: review authors' judgements about each risk of bias item presented as percentages across all included studies.
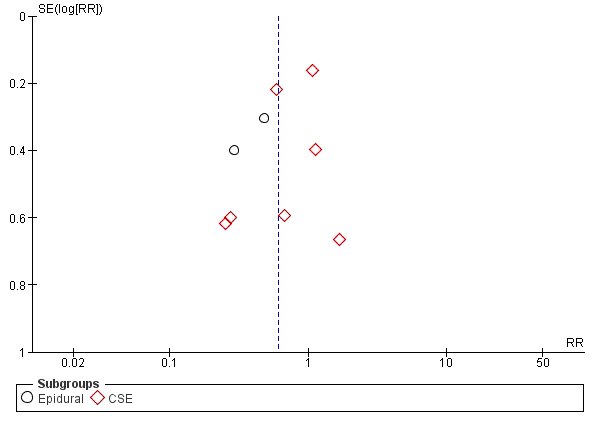
Funnel plot of comparison: 1 Automated mandatory bolus vs basal infusion, outcome: 1.2 Breakthrough pain (epidural vs CSE).
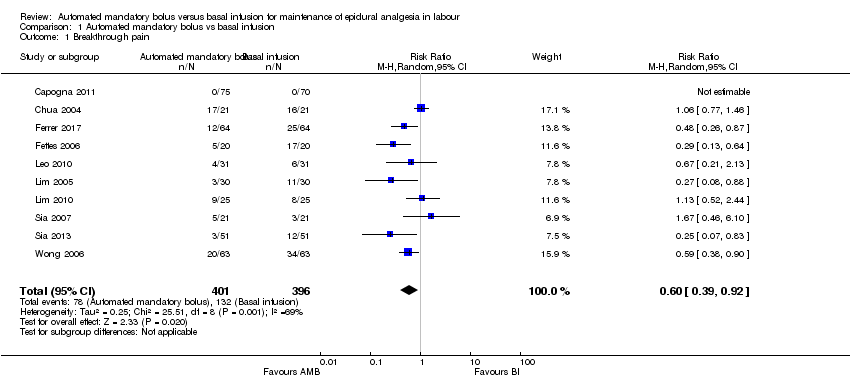
Comparison 1 Automated mandatory bolus vs basal infusion, Outcome 1 Breakthrough pain.

Comparison 1 Automated mandatory bolus vs basal infusion, Outcome 2 Breakthrough pain (epidural vs CSE).

Comparison 1 Automated mandatory bolus vs basal infusion, Outcome 3 Breakthrough pain (PCEA vs no PCEA).
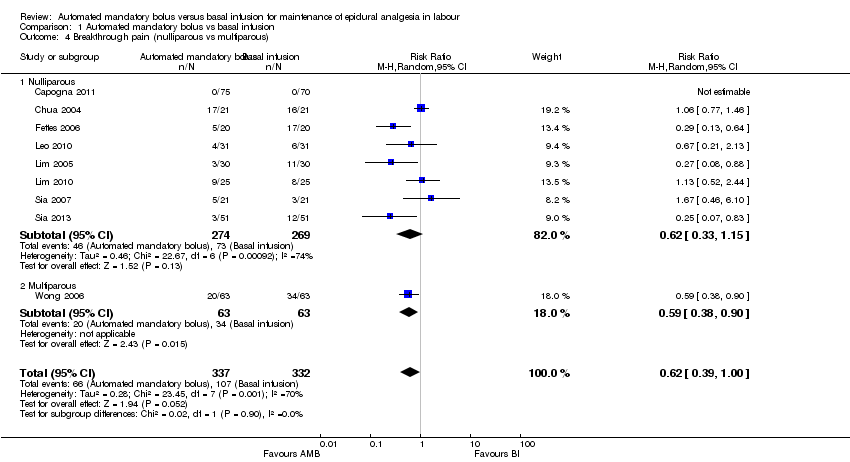
Comparison 1 Automated mandatory bolus vs basal infusion, Outcome 4 Breakthrough pain (nulliparous vs multiparous).
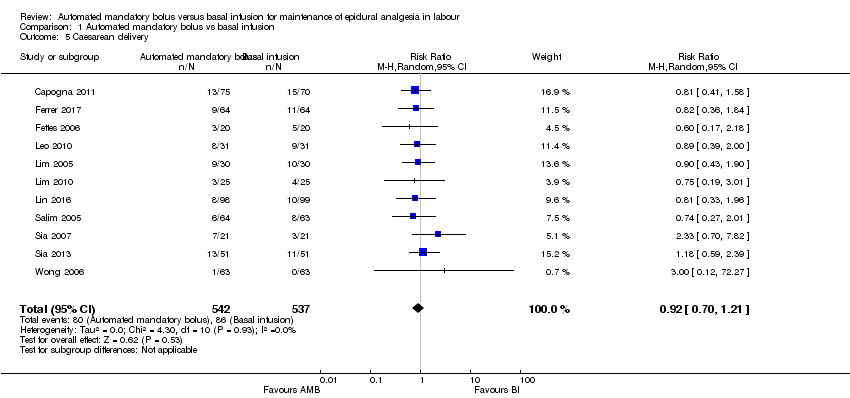
Comparison 1 Automated mandatory bolus vs basal infusion, Outcome 5 Caesarean delivery.

Comparison 1 Automated mandatory bolus vs basal infusion, Outcome 6 Caesarean delivery (LA + opioids vs LA alone).

Comparison 1 Automated mandatory bolus vs basal infusion, Outcome 7 Caesarean delivery (epidural vs CSE).

Comparison 1 Automated mandatory bolus vs basal infusion, Outcome 8 Caesarean delivery (PCEA vs no PCEA).

Comparison 1 Automated mandatory bolus vs basal infusion, Outcome 9 Caesarean delivery (nulliparous vs multiparous).
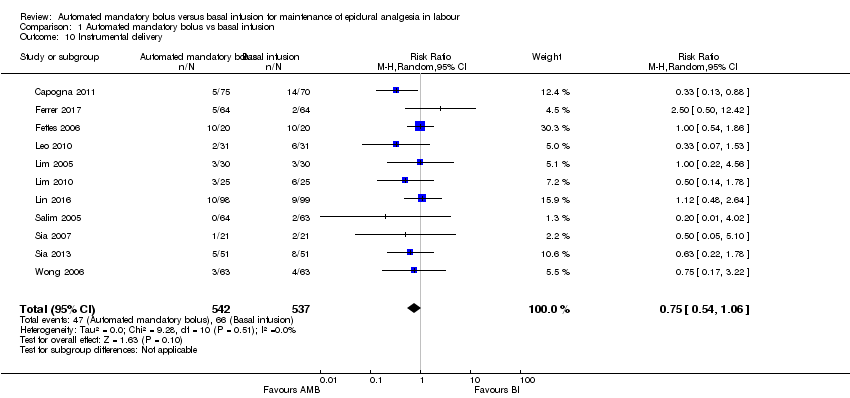
Comparison 1 Automated mandatory bolus vs basal infusion, Outcome 10 Instrumental delivery.

Comparison 1 Automated mandatory bolus vs basal infusion, Outcome 11 Instrumental delivery (LA + opioids vs LA alone).
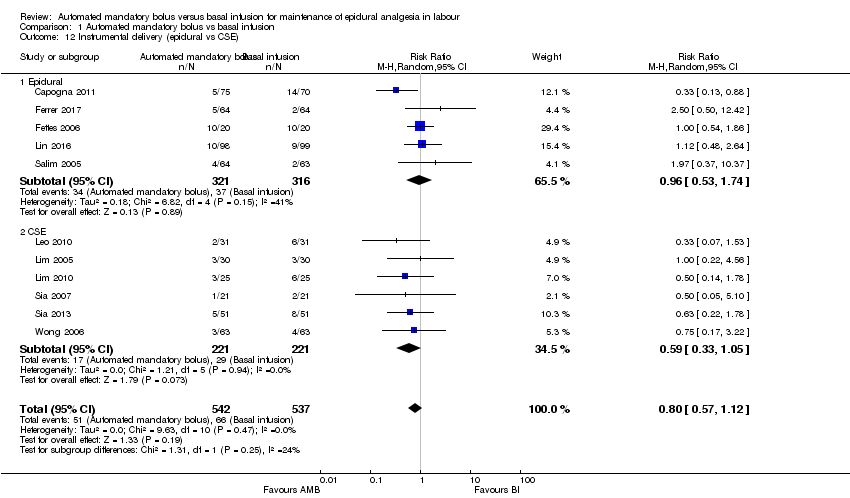
Comparison 1 Automated mandatory bolus vs basal infusion, Outcome 12 Instrumental delivery (epidural vs CSE).

Comparison 1 Automated mandatory bolus vs basal infusion, Outcome 13 Instrumental delivery (PCEA vs No PCEA).
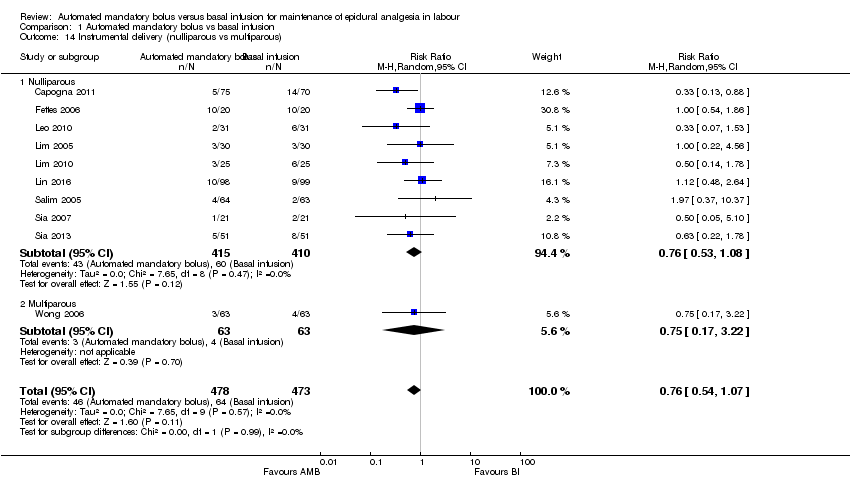
Comparison 1 Automated mandatory bolus vs basal infusion, Outcome 14 Instrumental delivery (nulliparous vs multiparous).

Comparison 1 Automated mandatory bolus vs basal infusion, Outcome 15 Duration of labour in minutes.

Comparison 1 Automated mandatory bolus vs basal infusion, Outcome 16 Duration of labour in minutes (LA + opioids vs LA alone).

Comparison 1 Automated mandatory bolus vs basal infusion, Outcome 17 Duration of labour in minutes (epidural vs CSE).
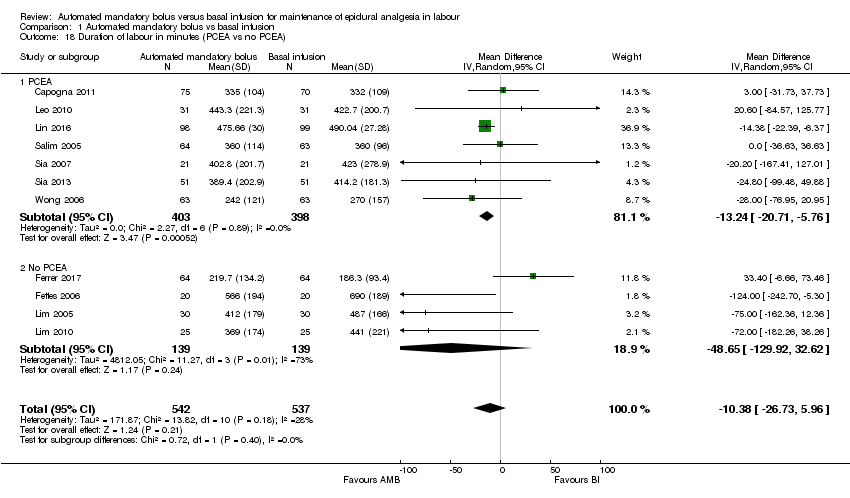
Comparison 1 Automated mandatory bolus vs basal infusion, Outcome 18 Duration of labour in minutes (PCEA vs no PCEA).
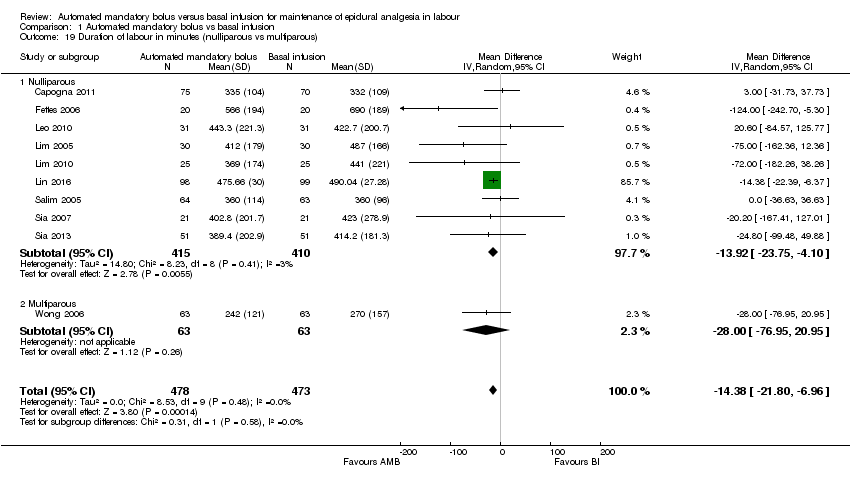
Comparison 1 Automated mandatory bolus vs basal infusion, Outcome 19 Duration of labour in minutes (nulliparous vs multiparous).

Comparison 1 Automated mandatory bolus vs basal infusion, Outcome 20 LA consumption per hour.
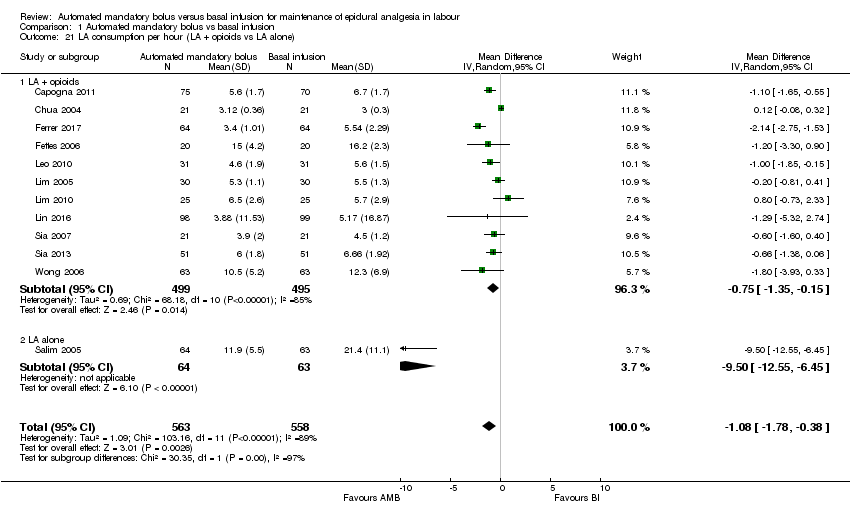
Comparison 1 Automated mandatory bolus vs basal infusion, Outcome 21 LA consumption per hour (LA + opioids vs LA alone).

Comparison 1 Automated mandatory bolus vs basal infusion, Outcome 22 LA consumption per hour (epidural vs CSE).

Comparison 1 Automated mandatory bolus vs basal infusion, Outcome 23 LA consumption per hour (PCEA vs no PCEA).

Comparison 1 Automated mandatory bolus vs basal infusion, Outcome 24 LA consumption per hour (nulliparous vs multiparous).
| Automated mandatory bolus versus basal infusion for maintenance of epidural analgesia in labour | |||||
| Patient or population: maintenance of epidural analgesia in labour | |||||
| Outcomes | Anticipated absolute effects* (95% CI) | Relative effect | № of participants | Certainty of the evidence | |
| Risk with basal infusion | Risk with automated mandatory bolus | ||||
| Breakthrough pain | Study population | RR 0.60 | 797 | ⊕⊕⊕⊝ | |
| 333 per 1000 | 200 per 1000 | ||||
| Caesarean delivery | Study population | RR 0.92 | 1079 | ⊕⊕⊝⊝ | |
| 160 per 1000 | 147 per 1000 | ||||
| Instrumental delivery | Study population | RR 0.75 | 1079 | ⊕⊕⊝⊝ | |
| 123 per 1000 | 92 per 1000 | ||||
| Duration of labour in min | The mean duration of labour in min ranged from 186.3 to 690.0 min | MD 10.38 min lower | — | 1079 | ⊕⊕⊕⊝ |
| LA consumption per hour | The mean LA consumption per hour ranged from 3 mg to 21.4 mg | MD 1.08 mg/h lower | — | 1121 | ⊕⊕⊕⊝ |
| *The risk in the intervention group (and its 95% confidence interval) is based on the assumed risk in the comparison group and the relative effect of the intervention (and its 95% CI). | |||||
| GRADE Working Group grades of evidence | |||||
| aDowngraded one level due to considerable statistical heterogeneity for this outcome, i.e. I2 = 69%. | |||||
| Outcome or subgroup title | No. of studies | No. of participants | Statistical method | Effect size |
| 1 Breakthrough pain Show forest plot | 10 | 797 | Risk Ratio (M‐H, Random, 95% CI) | 0.60 [0.39, 0.92] |
| 2 Breakthrough pain (epidural vs CSE) Show forest plot | 10 | 797 | Risk Ratio (M‐H, Random, 95% CI) | 0.60 [0.39, 0.92] |
| 2.1 Epidural | 3 | 313 | Risk Ratio (M‐H, Random, 95% CI) | 0.40 [0.25, 0.64] |
| 2.2 CSE | 7 | 484 | Risk Ratio (M‐H, Random, 95% CI) | 0.71 [0.44, 1.13] |
| 3 Breakthrough pain (PCEA vs no PCEA) Show forest plot | 10 | 797 | Risk Ratio (M‐H, Random, 95% CI) | 0.60 [0.39, 0.92] |
| 3.1 PCEA | 5 | 477 | Risk Ratio (M‐H, Random, 95% CI) | 0.61 [0.35, 1.07] |
| 3.2 No PCEA | 5 | 320 | Risk Ratio (M‐H, Random, 95% CI) | 0.58 [0.30, 1.12] |
| 4 Breakthrough pain (nulliparous vs multiparous) Show forest plot | 9 | 669 | Risk Ratio (M‐H, Random, 95% CI) | 0.62 [0.39, 1.00] |
| 4.1 Nulliparous | 8 | 543 | Risk Ratio (M‐H, Random, 95% CI) | 0.62 [0.33, 1.15] |
| 4.2 Multiparous | 1 | 126 | Risk Ratio (M‐H, Random, 95% CI) | 0.59 [0.38, 0.90] |
| 5 Caesarean delivery Show forest plot | 11 | 1079 | Risk Ratio (M‐H, Random, 95% CI) | 0.92 [0.70, 1.21] |
| 6 Caesarean delivery (LA + opioids vs LA alone) Show forest plot | 11 | 1079 | Risk Ratio (M‐H, Random, 95% CI) | 0.92 [0.70, 1.21] |
| 6.1 LA + opioids | 10 | 952 | Risk Ratio (M‐H, Random, 95% CI) | 0.93 [0.70, 1.24] |
| 6.2 LA alone | 1 | 127 | Risk Ratio (M‐H, Random, 95% CI) | 0.74 [0.27, 2.01] |
| 7 Caesarean delivery (epidural vs CSE) Show forest plot | 11 | 1079 | Risk Ratio (M‐H, Random, 95% CI) | 0.92 [0.70, 1.21] |
| 7.1 Epidural | 5 | 637 | Risk Ratio (M‐H, Random, 95% CI) | 0.78 [0.53, 1.15] |
| 7.2 CSE | 6 | 442 | Risk Ratio (M‐H, Random, 95% CI) | 1.08 [0.73, 1.59] |
| 8 Caesarean delivery (PCEA vs no PCEA) Show forest plot | 11 | 1079 | Risk Ratio (M‐H, Random, 95% CI) | 0.92 [0.70, 1.21] |
| 8.1 PCEA | 7 | 801 | Risk Ratio (M‐H, Random, 95% CI) | 0.98 [0.70, 1.37] |
| 8.2 No PCEA | 4 | 278 | Risk Ratio (M‐H, Random, 95% CI) | 0.81 [0.50, 1.30] |
| 9 Caesarean delivery (nulliparous vs multiparous) Show forest plot | 10 | 951 | Risk Ratio (M‐H, Random, 95% CI) | 0.93 [0.70, 1.25] |
| 9.1 Nulliparous | 9 | 825 | Risk Ratio (M‐H, Random, 95% CI) | 0.92 [0.69, 1.23] |
| 9.2 Multiparous | 1 | 126 | Risk Ratio (M‐H, Random, 95% CI) | 3.0 [0.12, 72.27] |
| 10 Instrumental delivery Show forest plot | 11 | 1079 | Risk Ratio (M‐H, Random, 95% CI) | 0.75 [0.54, 1.06] |
| 11 Instrumental delivery (LA + opioids vs LA alone) Show forest plot | 11 | 1079 | Risk Ratio (M‐H, Random, 95% CI) | 0.80 [0.57, 1.12] |
| 11.1 LA + opioids | 10 | 952 | Risk Ratio (M‐H, Random, 95% CI) | 0.77 [0.54, 1.08] |
| 11.2 LA alone | 1 | 127 | Risk Ratio (M‐H, Random, 95% CI) | 1.97 [0.37, 10.37] |
| 12 Instrumental delivery (epidural vs CSE) Show forest plot | 11 | 1079 | Risk Ratio (M‐H, Random, 95% CI) | 0.80 [0.57, 1.12] |
| 12.1 Epidural | 5 | 637 | Risk Ratio (M‐H, Random, 95% CI) | 0.96 [0.53, 1.74] |
| 12.2 CSE | 6 | 442 | Risk Ratio (M‐H, Random, 95% CI) | 0.59 [0.33, 1.05] |
| 13 Instrumental delivery (PCEA vs No PCEA) Show forest plot | 11 | 1079 | Risk Ratio (M‐H, Random, 95% CI) | 0.80 [0.57, 1.12] |
| 13.1 No PCEA | 4 | 278 | Risk Ratio (M‐H, Random, 95% CI) | 0.98 [0.60, 1.61] |
| 13.2 PCEA | 7 | 801 | Risk Ratio (M‐H, Random, 95% CI) | 0.67 [0.42, 1.05] |
| 14 Instrumental delivery (nulliparous vs multiparous) Show forest plot | 10 | 951 | Risk Ratio (M‐H, Random, 95% CI) | 0.76 [0.54, 1.07] |
| 14.1 Nulliparous | 9 | 825 | Risk Ratio (M‐H, Random, 95% CI) | 0.76 [0.53, 1.08] |
| 14.2 Multiparous | 1 | 126 | Risk Ratio (M‐H, Random, 95% CI) | 0.75 [0.17, 3.22] |
| 15 Duration of labour in minutes Show forest plot | 11 | 1079 | Mean Difference (IV, Random, 95% CI) | ‐10.38 [‐26.73, 5.96] |
| 16 Duration of labour in minutes (LA + opioids vs LA alone) Show forest plot | 11 | 1079 | Mean Difference (IV, Random, 95% CI) | ‐10.38 [‐26.73, 5.96] |
| 16.1 LA + opioids | 10 | 952 | Mean Difference (IV, Random, 95% CI) | ‐12.52 [‐31.87, 6.82] |
| 16.2 Duration of labor in minutes (LA alone) | 1 | 127 | Mean Difference (IV, Random, 95% CI) | 0.0 [‐36.63, 36.63] |
| 17 Duration of labour in minutes (epidural vs CSE) Show forest plot | 11 | 1079 | Mean Difference (IV, Random, 95% CI) | ‐10.38 [‐26.73, 5.96] |
| 17.1 Epidural | 5 | 637 | Mean Difference (IV, Random, 95% CI) | ‐3.04 [‐26.42, 20.34] |
| 17.2 CSE | 6 | 442 | Mean Difference (IV, Random, 95% CI) | ‐32.70 [‐65.20, ‐0.20] |
| 18 Duration of labour in minutes (PCEA vs no PCEA) Show forest plot | 11 | 1079 | Mean Difference (IV, Random, 95% CI) | ‐10.38 [‐26.73, 5.96] |
| 18.1 PCEA | 7 | 801 | Mean Difference (IV, Random, 95% CI) | ‐13.24 [‐20.71, ‐5.76] |
| 18.2 No PCEA | 4 | 278 | Mean Difference (IV, Random, 95% CI) | ‐48.65 [‐129.92, 32.62] |
| 19 Duration of labour in minutes (nulliparous vs multiparous) Show forest plot | 10 | 951 | Mean Difference (IV, Random, 95% CI) | ‐14.38 [‐21.80, ‐6.96] |
| 19.1 Nulliparous | 9 | 825 | Mean Difference (IV, Random, 95% CI) | ‐13.92 [‐23.75, ‐4.10] |
| 19.2 Multiparous | 1 | 126 | Mean Difference (IV, Random, 95% CI) | ‐28.0 [‐76.95, 20.95] |
| 20 LA consumption per hour Show forest plot | 12 | 1121 | Mean Difference (IV, Random, 95% CI) | ‐1.08 [‐1.78, ‐0.38] |
| 21 LA consumption per hour (LA + opioids vs LA alone) Show forest plot | 12 | 1121 | Mean Difference (IV, Random, 95% CI) | ‐1.08 [‐1.78, ‐0.38] |
| 21.1 LA + opioids | 11 | 994 | Mean Difference (IV, Random, 95% CI) | ‐0.75 [‐1.35, ‐0.15] |
| 21.2 LA alone | 1 | 127 | Mean Difference (IV, Random, 95% CI) | ‐9.50 [‐12.55, ‐6.45] |
| 22 LA consumption per hour (epidural vs CSE) Show forest plot | 12 | 1121 | Mean Difference (IV, Random, 95% CI) | ‐1.08 [‐1.78, ‐0.38] |
| 22.1 Epidural | 5 | 637 | Mean Difference (IV, Random, 95% CI) | ‐2.59 [‐4.13, ‐1.05] |
| 22.2 CSE | 7 | 484 | Mean Difference (IV, Random, 95% CI) | ‐0.35 [‐0.80, 0.11] |
| 23 LA consumption per hour (PCEA vs no PCEA) Show forest plot | 12 | 1121 | Mean Difference (IV, Random, 95% CI) | ‐1.08 [‐1.78, ‐0.38] |
| 23.1 PCEA | 7 | 801 | Mean Difference (IV, Random, 95% CI) | ‐1.59 [‐2.58, ‐0.60] |
| 23.2 No PCEA | 5 | 320 | Mean Difference (IV, Random, 95% CI) | ‐0.53 [‐1.58, 0.52] |
| 24 LA consumption per hour (nulliparous vs multiparous) Show forest plot | 11 | 993 | Mean Difference (IV, Random, 95% CI) | ‐0.89 [‐1.55, ‐0.23] |
| 24.1 Nulliparous | 10 | 867 | Mean Difference (IV, Random, 95% CI) | ‐0.83 [‐1.51, ‐0.15] |
| 24.2 Multiparous | 1 | 126 | Mean Difference (IV, Random, 95% CI) | ‐1.80 [‐3.93, 0.33] |