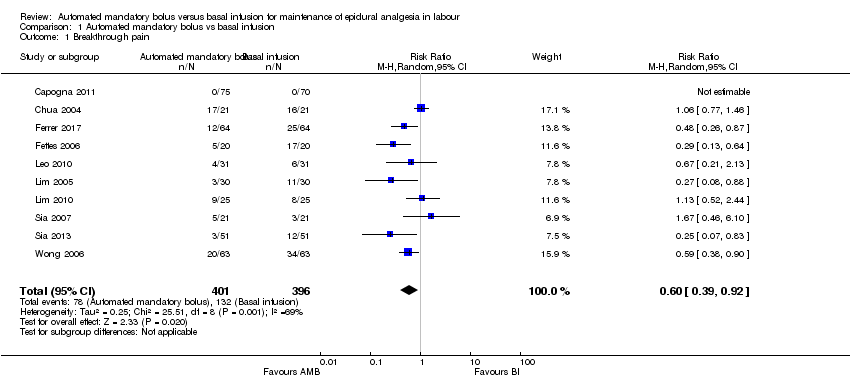
| 1 Breakthrough pain Show forest plot | 10 | 797 | Risk Ratio (M‐H, Random, 95% CI) | 0.60 [0.39, 0.92] |
|
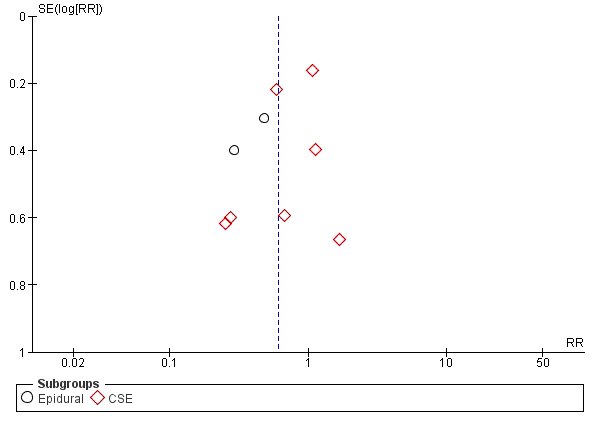
| 2 Breakthrough pain (epidural vs CSE) Show forest plot | 10 | 797 | Risk Ratio (M‐H, Random, 95% CI) | 0.60 [0.39, 0.92] |
|
| 2.1 Epidural | 3 | 313 | Risk Ratio (M‐H, Random, 95% CI) | 0.40 [0.25, 0.64] |
| 2.2 CSE | 7 | 484 | Risk Ratio (M‐H, Random, 95% CI) | 0.71 [0.44, 1.13] |
| 3 Breakthrough pain (PCEA vs no PCEA) Show forest plot | 10 | 797 | Risk Ratio (M‐H, Random, 95% CI) | 0.60 [0.39, 0.92] |
|
| 3.1 PCEA | 5 | 477 | Risk Ratio (M‐H, Random, 95% CI) | 0.61 [0.35, 1.07] |
| 3.2 No PCEA | 5 | 320 | Risk Ratio (M‐H, Random, 95% CI) | 0.58 [0.30, 1.12] |
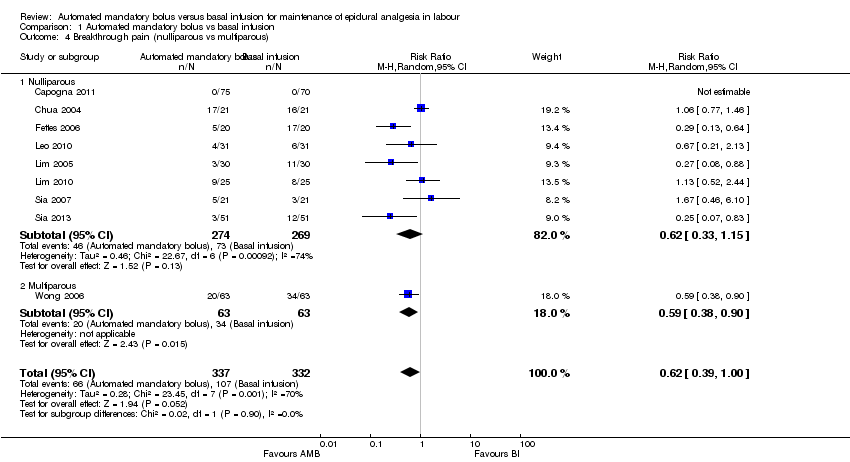
| 4 Breakthrough pain (nulliparous vs multiparous) Show forest plot | 9 | 669 | Risk Ratio (M‐H, Random, 95% CI) | 0.62 [0.39, 1.00] |
|
| 4.1 Nulliparous | 8 | 543 | Risk Ratio (M‐H, Random, 95% CI) | 0.62 [0.33, 1.15] |
| 4.2 Multiparous | 1 | 126 | Risk Ratio (M‐H, Random, 95% CI) | 0.59 [0.38, 0.90] |
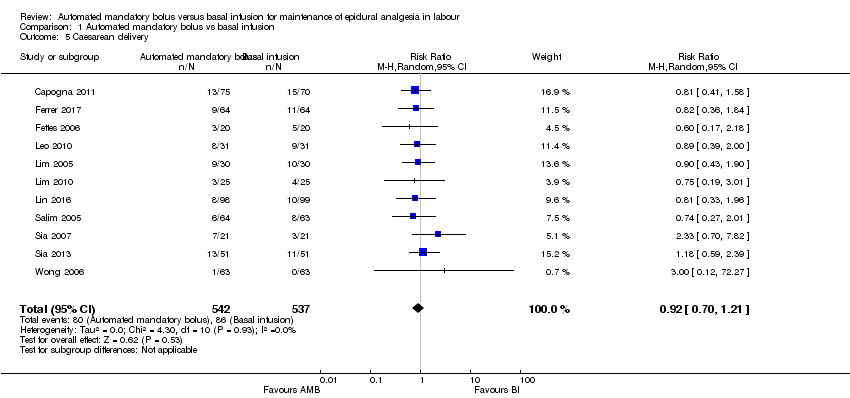
| 5 Caesarean delivery Show forest plot | 11 | 1079 | Risk Ratio (M‐H, Random, 95% CI) | 0.92 [0.70, 1.21] |
|
| 6 Caesarean delivery (LA + opioids vs LA alone) Show forest plot | 11 | 1079 | Risk Ratio (M‐H, Random, 95% CI) | 0.92 [0.70, 1.21] |
|
| 6.1 LA + opioids | 10 | 952 | Risk Ratio (M‐H, Random, 95% CI) | 0.93 [0.70, 1.24] |
| 6.2 LA alone | 1 | 127 | Risk Ratio (M‐H, Random, 95% CI) | 0.74 [0.27, 2.01] |
| 7 Caesarean delivery (epidural vs CSE) Show forest plot | 11 | 1079 | Risk Ratio (M‐H, Random, 95% CI) | 0.92 [0.70, 1.21] |
|
| 7.1 Epidural | 5 | 637 | Risk Ratio (M‐H, Random, 95% CI) | 0.78 [0.53, 1.15] |
| 7.2 CSE | 6 | 442 | Risk Ratio (M‐H, Random, 95% CI) | 1.08 [0.73, 1.59] |
| 8 Caesarean delivery (PCEA vs no PCEA) Show forest plot | 11 | 1079 | Risk Ratio (M‐H, Random, 95% CI) | 0.92 [0.70, 1.21] |
|
| 8.1 PCEA | 7 | 801 | Risk Ratio (M‐H, Random, 95% CI) | 0.98 [0.70, 1.37] |
| 8.2 No PCEA | 4 | 278 | Risk Ratio (M‐H, Random, 95% CI) | 0.81 [0.50, 1.30] |
| 9 Caesarean delivery (nulliparous vs multiparous) Show forest plot | 10 | 951 | Risk Ratio (M‐H, Random, 95% CI) | 0.93 [0.70, 1.25] |
|
| 9.1 Nulliparous | 9 | 825 | Risk Ratio (M‐H, Random, 95% CI) | 0.92 [0.69, 1.23] |
| 9.2 Multiparous | 1 | 126 | Risk Ratio (M‐H, Random, 95% CI) | 3.0 [0.12, 72.27] |
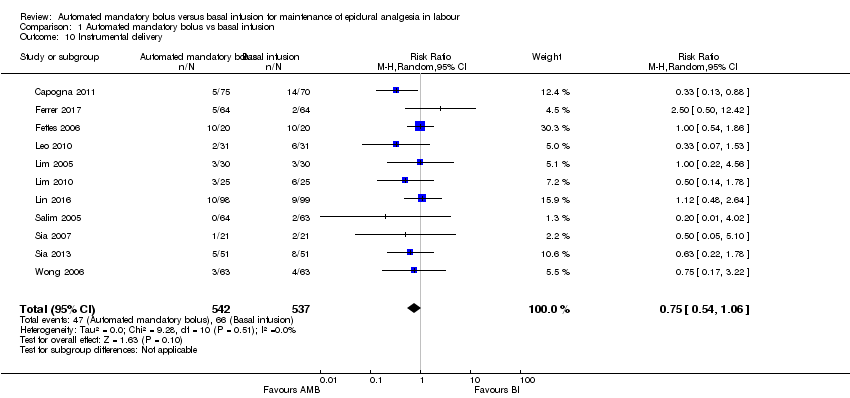
| 10 Instrumental delivery Show forest plot | 11 | 1079 | Risk Ratio (M‐H, Random, 95% CI) | 0.75 [0.54, 1.06] |
|
| 11 Instrumental delivery (LA + opioids vs LA alone) Show forest plot | 11 | 1079 | Risk Ratio (M‐H, Random, 95% CI) | 0.80 [0.57, 1.12] |
|
| 11.1 LA + opioids | 10 | 952 | Risk Ratio (M‐H, Random, 95% CI) | 0.77 [0.54, 1.08] |
| 11.2 LA alone | 1 | 127 | Risk Ratio (M‐H, Random, 95% CI) | 1.97 [0.37, 10.37] |
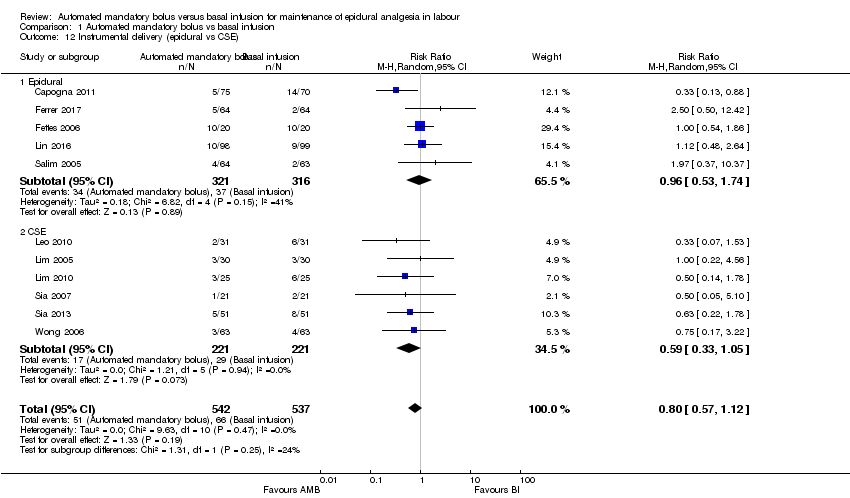
| 12 Instrumental delivery (epidural vs CSE) Show forest plot | 11 | 1079 | Risk Ratio (M‐H, Random, 95% CI) | 0.80 [0.57, 1.12] |
|
| 12.1 Epidural | 5 | 637 | Risk Ratio (M‐H, Random, 95% CI) | 0.96 [0.53, 1.74] |
| 12.2 CSE | 6 | 442 | Risk Ratio (M‐H, Random, 95% CI) | 0.59 [0.33, 1.05] |
| 13 Instrumental delivery (PCEA vs No PCEA) Show forest plot | 11 | 1079 | Risk Ratio (M‐H, Random, 95% CI) | 0.80 [0.57, 1.12] |
|
| 13.1 No PCEA | 4 | 278 | Risk Ratio (M‐H, Random, 95% CI) | 0.98 [0.60, 1.61] |
| 13.2 PCEA | 7 | 801 | Risk Ratio (M‐H, Random, 95% CI) | 0.67 [0.42, 1.05] |
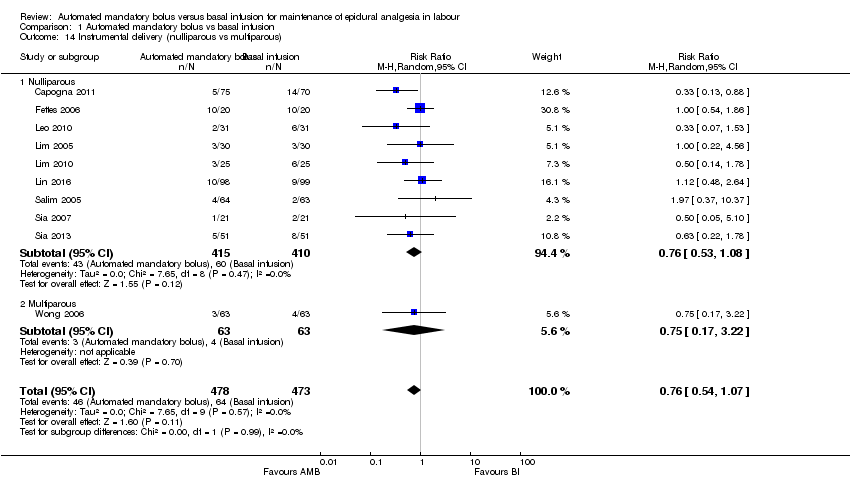
| 14 Instrumental delivery (nulliparous vs multiparous) Show forest plot | 10 | 951 | Risk Ratio (M‐H, Random, 95% CI) | 0.76 [0.54, 1.07] |
|
| 14.1 Nulliparous | 9 | 825 | Risk Ratio (M‐H, Random, 95% CI) | 0.76 [0.53, 1.08] |
| 14.2 Multiparous | 1 | 126 | Risk Ratio (M‐H, Random, 95% CI) | 0.75 [0.17, 3.22] |
| 15 Duration of labour in minutes Show forest plot | 11 | 1079 | Mean Difference (IV, Random, 95% CI) | ‐10.38 [‐26.73, 5.96] |
|
| 16 Duration of labour in minutes (LA + opioids vs LA alone) Show forest plot | 11 | 1079 | Mean Difference (IV, Random, 95% CI) | ‐10.38 [‐26.73, 5.96] |
|
| 16.1 LA + opioids | 10 | 952 | Mean Difference (IV, Random, 95% CI) | ‐12.52 [‐31.87, 6.82] |
| 16.2 Duration of labor in minutes (LA alone) | 1 | 127 | Mean Difference (IV, Random, 95% CI) | 0.0 [‐36.63, 36.63] |
| 17 Duration of labour in minutes (epidural vs CSE) Show forest plot | 11 | 1079 | Mean Difference (IV, Random, 95% CI) | ‐10.38 [‐26.73, 5.96] |
|
| 17.1 Epidural | 5 | 637 | Mean Difference (IV, Random, 95% CI) | ‐3.04 [‐26.42, 20.34] |
| 17.2 CSE | 6 | 442 | Mean Difference (IV, Random, 95% CI) | ‐32.70 [‐65.20, ‐0.20] |
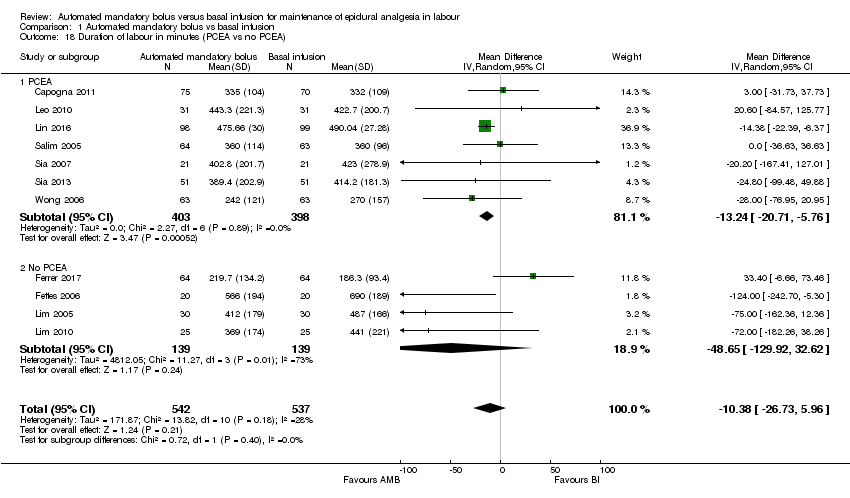
| 18 Duration of labour in minutes (PCEA vs no PCEA) Show forest plot | 11 | 1079 | Mean Difference (IV, Random, 95% CI) | ‐10.38 [‐26.73, 5.96] |
|
| 18.1 PCEA | 7 | 801 | Mean Difference (IV, Random, 95% CI) | ‐13.24 [‐20.71, ‐5.76] |
| 18.2 No PCEA | 4 | 278 | Mean Difference (IV, Random, 95% CI) | ‐48.65 [‐129.92, 32.62] |
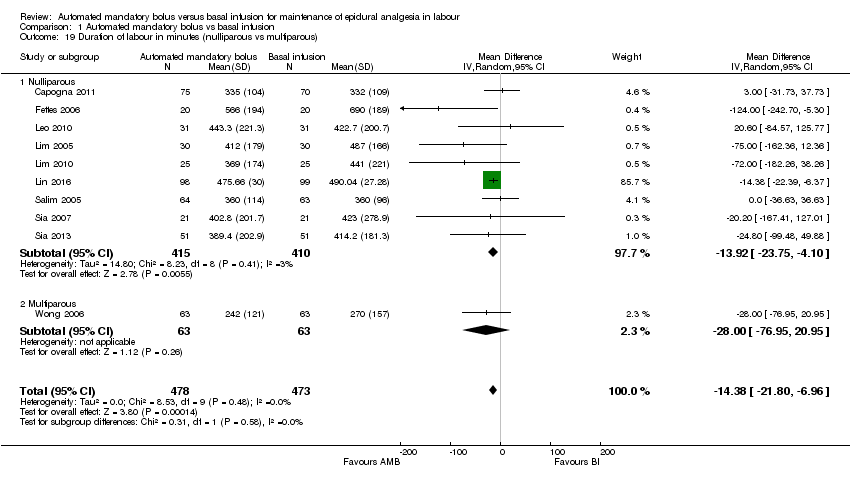
| 19 Duration of labour in minutes (nulliparous vs multiparous) Show forest plot | 10 | 951 | Mean Difference (IV, Random, 95% CI) | ‐14.38 [‐21.80, ‐6.96] |
|
| 19.1 Nulliparous | 9 | 825 | Mean Difference (IV, Random, 95% CI) | ‐13.92 [‐23.75, ‐4.10] |
| 19.2 Multiparous | 1 | 126 | Mean Difference (IV, Random, 95% CI) | ‐28.0 [‐76.95, 20.95] |
| 20 LA consumption per hour Show forest plot | 12 | 1121 | Mean Difference (IV, Random, 95% CI) | ‐1.08 [‐1.78, ‐0.38] |
|
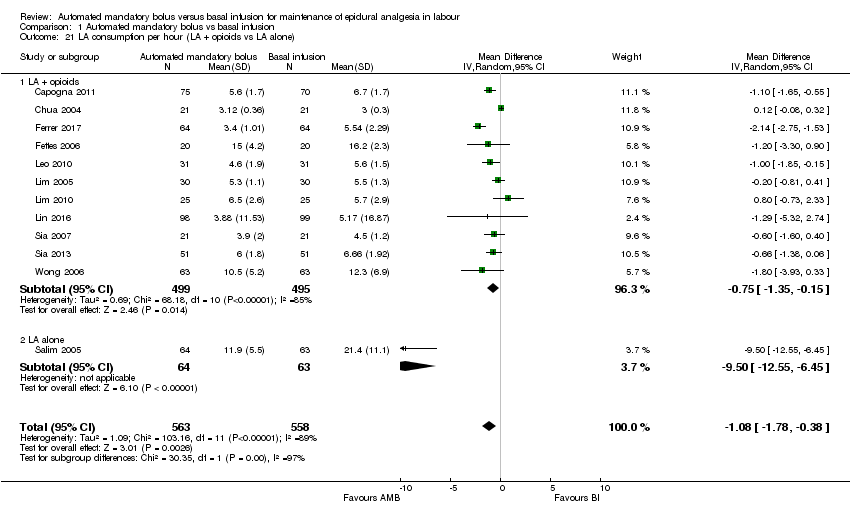
| 21 LA consumption per hour (LA + opioids vs LA alone) Show forest plot | 12 | 1121 | Mean Difference (IV, Random, 95% CI) | ‐1.08 [‐1.78, ‐0.38] |
|
| 21.1 LA + opioids | 11 | 994 | Mean Difference (IV, Random, 95% CI) | ‐0.75 [‐1.35, ‐0.15] |
| 21.2 LA alone | 1 | 127 | Mean Difference (IV, Random, 95% CI) | ‐9.50 [‐12.55, ‐6.45] |
| 22 LA consumption per hour (epidural vs CSE) Show forest plot | 12 | 1121 | Mean Difference (IV, Random, 95% CI) | ‐1.08 [‐1.78, ‐0.38] |
|
| 22.1 Epidural | 5 | 637 | Mean Difference (IV, Random, 95% CI) | ‐2.59 [‐4.13, ‐1.05] |
| 22.2 CSE | 7 | 484 | Mean Difference (IV, Random, 95% CI) | ‐0.35 [‐0.80, 0.11] |
| 23 LA consumption per hour (PCEA vs no PCEA) Show forest plot | 12 | 1121 | Mean Difference (IV, Random, 95% CI) | ‐1.08 [‐1.78, ‐0.38] |
|
| 23.1 PCEA | 7 | 801 | Mean Difference (IV, Random, 95% CI) | ‐1.59 [‐2.58, ‐0.60] |
| 23.2 No PCEA | 5 | 320 | Mean Difference (IV, Random, 95% CI) | ‐0.53 [‐1.58, 0.52] |
| 24 LA consumption per hour (nulliparous vs multiparous) Show forest plot | 11 | 993 | Mean Difference (IV, Random, 95% CI) | ‐0.89 [‐1.55, ‐0.23] |
|
| 24.1 Nulliparous | 10 | 867 | Mean Difference (IV, Random, 95% CI) | ‐0.83 [‐1.51, ‐0.15] |
| 24.2 Multiparous | 1 | 126 | Mean Difference (IV, Random, 95% CI) | ‐1.80 [‐3.93, 0.33] |