Bolo obligatorio automatizado versus infusión basal para el mantenimiento de la analgesia epidural durante el trabajo de parto
Appendices
Appendix 1. Search strategies
CENTRAL (the Cochrane Library) search strategy
#1 MeSH descriptor: [labour, Obstetric] explode all trees
#2 MeSH descriptor: [labour Pain] explode all trees
#3 MeSH descriptor: [Delivery, Obstetric] explode all trees
#4 MeSH descriptor: [Parturition] explode all trees
#5 (labo?r near (obstetric or pain* or vaginal)) or (labo?r or parturient* or child?birth or obstet* or deliver*):ti,ab
#6 #1 or #2 or #3 or #4 or #5
#7 MeSH descriptor: [Analgesia, Epidural] explode all trees
#8 MeSH descriptor: [Anesthesia, Epidural] explode all trees
#9 MeSH descriptor: [Infusions, Spinal] explode all trees
#10 MeSH descriptor: [Injections, Spinal] explode all trees
#11 epidural*:ti,ab or (spinal near (infusion* or injection*)):ti,ab or (pain near relief) or (bupivacaine or ropivacaine or mepivacaine or fentanyl or sufentanil)
#12 #7 or #8 or #9 or #10 or #11
#13 bolus* or AMB or basal infusion* or BCI or (intermittent or variable?frequency or patient?controlled):ti,ab
#14 #6 and #12 and #13
OVID MEDLINE search strategy
1 bolus*.mp. or AMB.ti,ab. or basal infusion*.mp. or BCI.ti,ab. or (intermittent or variable?frequency or patient?controlled).ti,ab.
2 exp Analgesia, Epidural/ or exp Anesthesia, Epidural/ or exp Infusions, Spinal/ or exp Injections, Spinal/ or epidural*.ti,ab. or (spinal adj3 (infusion* or injection*)).ti,ab. or (pain adj3 relief).mp. or (bupivacaine or ropivacaine or mepivacaine or fentanyl or sufentanil).mp.
3 exp labour, Obstetric/ or exp labour Pain/ or exp Delivery, Obstetric/ or Parturition/ or (labo?r adj3 (obstetric or pain* or vaginal)).mp. or (labo?r or parturient* or child?birth or obstet* or deliver*).ti,ab.
4 ((randomized controlled trial or controlled clinical trial).pt. or randomized.ab. or placebo.ab. or clinical trials as topic.sh. or randomly.ab. or trial.ti.) not (animals not (humans and animals)).sh.
5 1 and 2 and 3 and 4
OVID Embase search strategy
1 bolus*.mp. or AMB.ti,ab. or basal infusion*.mp. or BCI.ti,ab. or (intermittent or variable?frequency or patient?controlled).ti,ab.
2 exp epidural anesthesia/ or exp epidural anesthesia/ or exp intraspinal drug administration/ or epidural*.ti,ab. or (spinal adj3 (infusion* or injection*)).ti,ab. or (pain adj3 relief).mp. or (bupivacaine or ropivacaine or mepivacaine or fentanyl or sufentanil).mp.
3 exp labour/ or exp labour pain/ or exp delivery/ or birth/ or (labo?r adj3 (obstetric or pain* or vaginal)).mp. or (labo?r or parturient* or child?birth or obstet* or deliver*).ti,ab.
4 (randomized‐controlled‐trial/ or randomization/ or controlled‐study/ or multicenter‐study/ or phase‐3‐clinical‐trial/ or phase‐4‐clinical‐trial/ or double‐blind‐procedure/ or single‐blind‐procedure/ or (random* or cross?over* or multicenter* or factorial* or placebo* or volunteer*).mp. or ((singl* or doubl* or trebl* or tripl*) adj3 (blind* or mask*)).ti,ab. or (latin adj square).mp.) not (animals not (humans and animals)).sh.
5 1 and 2 and 3 and 4
WHO‐ICTRP
1 (basal infusion OR analgesia OR bolus) AND labor
ClinTrials.gov
1 labor [DISEASE] AND ( "basal infusion" OR bolus ) [TREATMENT] AND EXACT NOT "Male" [GENDER]
Appendix 2. Data collection form
Data collection form
| Review title or ID |
| Automated mandatory bolus versus basal infusion for maintenance of epidural analgesia in labour |
| Study ID(surname of first author and year first full report of study was published e.g. Smith 2001) |
| Report IDs of other reports of this study(e.g. duplicate publications, follow‐up studies) |
| Notes: |
1. General information
| Date form completed(dd/mm/yyyy) | |
| Name/ID of person extracting data | |
| Report title (title of paper/abstract/report that data are extracted from) | |
| Report ID (ID for this paper/abstract/report) | |
| Reference details | |
| Report author contact details | |
| Publication type (e.g. full report, abstract, letter) | |
| Study funding sources (including role of funders) | |
| Possible conflicts of interest (for study authors) | |
| Notes: | |
2. Study eligibility
| Study characteristics | Eligibility criteria (Insert eligibility criteria for each characteristic as defined in the protocol) | Yes | No | Unclear | Location in text (pg & ¶/fig/table) | |
| Type of study | Randomized controlled trial | |||||
| Controlled clinical trial (quasi‐randomized trial) | ||||||
| Participants | Healthy parturients requesting for epidural analgesia during labour | |||||
| Types of intervention | Automated mandatory bolus Basal infusion | |||||
| Types of outcome measures | 1. Risk of breakthrough pain with need for anaesthetic intervention (dichotomous) 2. Risk of caesarean delivery (dichotomous) 3. Risk of instrumental delivery (dichotomous) 4. Duration of labour (continuous) 5. Total dose of local anaesthetic per hour (continuous) 6. Maternal satisfaction (continuous) 7. Apgar scores (continuous) | |||||
| INCLUDE | EXCLUDE | |||||
| Reason for exclusion | ||||||
| Notes: | ||||||
DO NOT PROCEED IF STUDY EXCLUDED FROM REVIEW
3. Population and setting
| Description Include comparative information for each group (i.e. intervention and controls) if available | Location in text (pg & ¶/fig/table) | ||
| Population description (from which study participants are drawn) | |||
| Setting (including location and social context) | |||
| Inclusion criteria | |||
| Exclusion criteria | |||
| Method/s of recruitment of participants | |||
| Informed consent obtained | Yes No Unclear | ||
| Notes: | |||
4. Methods
| Descriptions as stated in report/paper | Location in text (pg & ¶/fig/table) | ||
| Aim of study | |||
| Design(e.g. parallel, cross‐over, cluster) | |||
| Unit of allocation (by individuals, cluster/groups or body parts) | |||
| Start date | |||
| End date | |||
| Total study duration | |||
| Ethical approval needed/obtained for study | Yes No Unclear | ||
| Notes: | |||
5. 'Risk of bias' assessment
See Chapter 8 of the Cochrane Handbook for Systematic Reviews of Interventions
| Domain | Risk of bias | Support for judgement | Location in text (pg & ¶/fig/table) | ||
| Low risk | High risk | Unclear | |||
| Random sequence generation (selection bias) | |||||
| Allocation concealment (selection bias) | |||||
| Blinding of participants and personnel (performance bias) | Outcome group: All/ | ||||
| (if required) | Outcome group: | ||||
| Blinding of outcome assessment (detection bias) | Outcome group: All/ | ||||
| (if required) | Outcome group: | ||||
| Incomplete outcome data (attrition bias) | |||||
| Selective outcome reporting? (reporting bias) | |||||
| Other bias | |||||
| Notes: | |||||
6. Participants
Provide overall data and, if available, comparative data for each intervention or comparison group.
| Description as stated in report/paper | Location in text (pg & ¶/fig/table) | |
| Total no. randomized (or total pop. at start of study for NRCTs) | ||
| Clusters (if applicable, no., type, no. people per cluster) | ||
| Baseline imbalances | ||
| Withdrawals and exclusions (if not provided below by outcome) | ||
| Age | ||
| Sex | ||
| Race/ethnicity | ||
| Severity of illness | ||
| Co‐morbidities | ||
| Other treatment received(additional to study intervention) | ||
| Other relevant sociodemographics | ||
| Subgroups measured | ||
| Subgroups reported | ||
| Notes: | ||
7. Intervention groups
Copy and paste table for each intervention and comparison group
Intervention Group 1
| Description as stated in report/paper | Location in text (pg & ¶/fig/table) | |
| Group name | ||
| No. randomized to group (specify whether no. people or clusters) | ||
| Theoretical basis(include key references) | ||
| Description(include sufficient detail for replication, e.g. content, dose, components) | ||
| Duration of treatment period | ||
| Timing(e.g. frequency, duration of each episode) | ||
| Delivery(e.g. mechanism, medium, intensity, fidelity) | ||
| Providers (e.g. no., profession, training, ethnicity etc. if relevant) | ||
| Co‐interventions | ||
| Economic variables | ||
| Resource requirements to replicate intervention (e.g. staff numbers, cold chain, equipment) | ||
| Notes: | ||
8. Outcomes
Copy and paste table for each outcome.
Outcome 1
| Description as stated in report/paper | Location in text (pg & ¶/fig/table) | ||
| Outcome name | |||
| Time points measured | |||
| Time points reported | |||
| Outcome definition(with diagnostic criteria if relevant) | |||
| Person measuring/reporting | |||
| Unit of measurement (if relevant) | |||
| Scales: upper and lower limits(indicate whether high or low score is good) | |||
| Is outcome/tool validated? | Yes No Unclear | ||
| Imputation of missing data | |||
| Assumed risk estimate (e.g. baseline or population risk noted in Background) | |||
| Power | |||
| Notes: | |||
9. Results
Copy and paste the appropriate table for each outcome, including additional tables for each time point and subgroup as required.
Dichotomous outcome
| Description as stated in report/paper | Location in text (pg & ¶/fig/table) | |||||
| Comparison | ||||||
| Outcome | ||||||
| Subgroup | ||||||
| Time point | ||||||
| Results | Intervention | Comparison | ||||
| No. events | No. participants | No. events | No. participants | |||
| No. missing participants and reasons | ||||||
| No. participants moved from other group and reasons | ||||||
| Any other results reported | ||||||
| Unit of analysis(by individuals, cluster/groups or body parts) | ||||||
| Statistical methods used and appropriateness of these methods(e.g. adjustment for correlation) | ||||||
| Reanalysis required?(specify) | Yes No Unclear | |||||
| Reanalysis possible? | Yes No Unclear | |||||
| Reanalysed results | ||||||
| Notes: | ||||||
Continuous outcome
| Description as stated in report/paper | Location in text (pg & ¶/fig/table) | |||||||||
| Comparison | ||||||||||
| Outcome | ||||||||||
| Subgroup | ||||||||||
| Time point | ||||||||||
| Post‐intervention or change from baseline? | ||||||||||
| Results | Intervention | Comparison | ||||||||
| Mean | SD (or other variance) | No. participants | Mean | SD (or other variance) | No. participants | |||||
| No. missing participants and reasons | ||||||||||
| No. participants moved from other group and reasons | ||||||||||
| Any other results reported | ||||||||||
| Unit of analysis (individuals, cluster/groups or body parts) | ||||||||||
| Statistical methods used and appropriateness of these methods(e.g. adjustment for correlation) | ||||||||||
| Reanalysis required?(specify) | Yes No Unclear | |||||||||
| Reanalysis possible? | Yes No Unclear | |||||||||
| Reanalysed results | ||||||||||
| Notes: | ||||||||||
Other outcome
| Description as stated in report/paper | Location in text (pg & ¶/fig/table) | |||||
| Comparison | ||||||
| Outcome | ||||||
| Subgroup | ||||||
| Time point | ||||||
| Results | Intervention result | SD (or other variance) | Control result | SD (or other variance) | ||
| Overall results | SE (or other variance) | |||||
| No. participants | Intervention | Control | ||||
| No. missing participants and reasons | ||||||
| No. participants moved from other group and reasons | ||||||
| Any other results reported | ||||||
| Unit of analysis(by individuals, cluster/groups or body parts) | ||||||
| Statistical methods used and appropriateness of these methods | ||||||
| Reanalysis required?(specify) | Yes No Unclear | |||||
| Reanalysis possible? | Yes No Unclear | |||||
| Reanalysed results | ||||||
| Notes: | ||||||
10. Applicability
| Have important populations been excluded from the study?(consider disadvantaged populations, and possible differences in the intervention effect) | Yes No Unclear | |
| Is the intervention likely to be aimed at disadvantaged groups?(e.g. lower socioeconomic groups) | Yes No Unclear | |
| Does the study directly address the review question? (any issues of partial or indirect applicability) | Yes No Unclear | |
| Notes: | ||
11. Other information
| Description as stated in report/paper | Location in text (pg & ¶/fig/table) | |
| Key conclusions of study authors | ||
| References to other relevant studies | ||
| Correspondence required for further study information(from whom, what and when) | ||
| Notes: | ||
Appendix 3. Cochrane 'Risk of bias' tool and criteria for judgment
1. Random sequence generation (checking for possible selection bias)
We described for each included study the method used to generate the allocation sequence in sufficient detail to allow an assessment of whether it should produce comparable groups.
We assessed the method as being at:
-
low risk of bias (any truly random process, e.g. random number table; computer random number generator);
-
high risk of bias (any non‐random process, e.g. odd or even date of birth; hospital or clinic record number);
-
unclear risk of bias.
2. Allocation concealment (checking for possible selection bias)
We described for each included study the method used to conceal allocation to interventions prior to assignment and will assess whether intervention allocation could have been foreseen in advance of, or during recruitment, or changed after assignment.
We assessed the methods as being at:
-
low risk of bias (e.g. telephone or central randomization; consecutively numbered sealed opaque envelopes);
-
high risk of bias (open random allocation; unsealed or non‐opaque envelopes, alternation; date of birth);
-
unclear risk of bias.
3. Blinding
3.1 Blinding of participants and personnel (checking for possible performance bias)
We described for each included study the methods used, if any, to blind study participants and personnel from knowledge of which intervention a participant received. We considered that studies were at low risk of bias if they were blinded, or if we judged that the lack of blinding would be unlikely to affect results. We assessed blinding separately for different outcomes or classes of outcomes.
We assessed the methods as being at:
-
low, high or unclear risk of bias for participants;
-
low, high or unclear risk of bias for personnel.
3.2 Blinding of outcome assessment (checking for possible detection bias)
We described for each included study the methods used, if any, to blind outcome assessors from knowledge of which intervention a participant received. We assessed blinding separately for different outcomes or classes of outcomes.
We assessed methods used to blind outcome assessment as being at:
-
low, high or unclear risk of bias.
4. Incomplete outcome data (checking for possible attrition bias due to the amount, nature and handling of incomplete outcome data)
We described for each included study, and for each outcome or class of outcomes, the completeness of data including attrition and exclusions from the analysis. We stated whether attrition and exclusions were reported and the numbers included in the analysis at each stage (compared with the total randomized participants), reasons for attrition or exclusion where reported, and whether missing data were balanced across groups or were related to outcomes. Where sufficient information is reported, or could be supplied by the trial authors, we re‐included missing data in the analyses which we undertook.
We assessed methods as being at:
-
low risk of bias (e.g. no missing outcome data; missing outcome data balanced across groups);
-
high risk of bias (e.g. numbers or reasons for missing data imbalanced across groups; 'as treated' analysis done with substantial departure of intervention received from that assigned at randomization);
-
unclear risk of bias.
5. Selective reporting (checking for reporting bias)
We described for each included study how we investigated the possibility of selective outcome reporting bias and what we found.
We assessed the methods as being at:
-
low risk of bias (where it is clear that all of the study's pre‐specified outcomes and all expected outcomes of interest to the review have been reported);
-
high risk of bias (where not all the study's pre‐specified outcomes have been reported; one or more reported primary outcomes were not pre‐specified; outcomes of interest are reported incompletely and so cannot be used; study fails to include results of a key outcome that would have been expected to have been reported);
-
unclear risk of bias.
6. Other bias (checking for bias due to problems not covered by 1 to 5 above)
We described for each included study any important concerns we had about other possible sources of bias.
7. Overall risk of bias
We made explicit judgements about whether studies are at high risk of bias, according to the criteria given in the Cochrane Handbook for Systematic Reviews of Interventions (Higgins 2011). With reference to items 1 to 6 above, we assessed the likely magnitude and direction of the bias and whether we considered it likely to impact on the findings. We planned to explore the impact of the level of bias through undertaking sensitivity analyses ‐ see Sensitivity analysis.
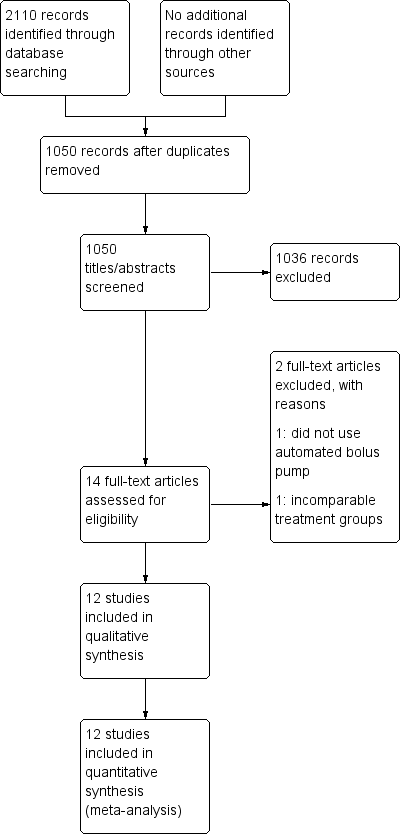
Study flow diagram.
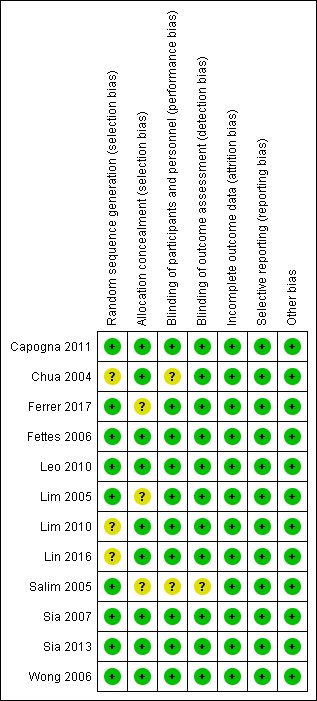
Risk of bias summary: review authors' judgements about each risk of bias item for each included study.

Risk of bias graph: review authors' judgements about each risk of bias item presented as percentages across all included studies.
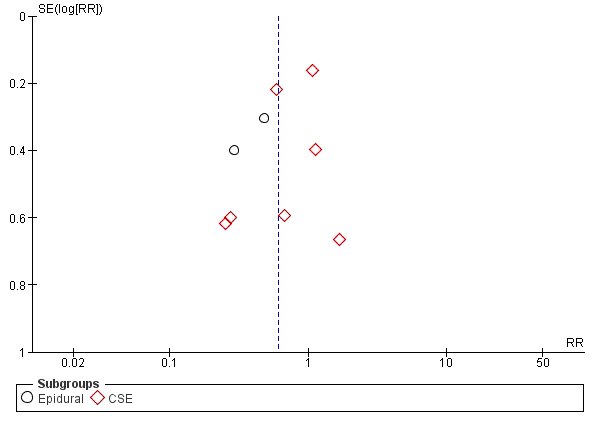
Funnel plot of comparison: 1 Automated mandatory bolus vs basal infusion, outcome: 1.2 Breakthrough pain (epidural vs CSE).
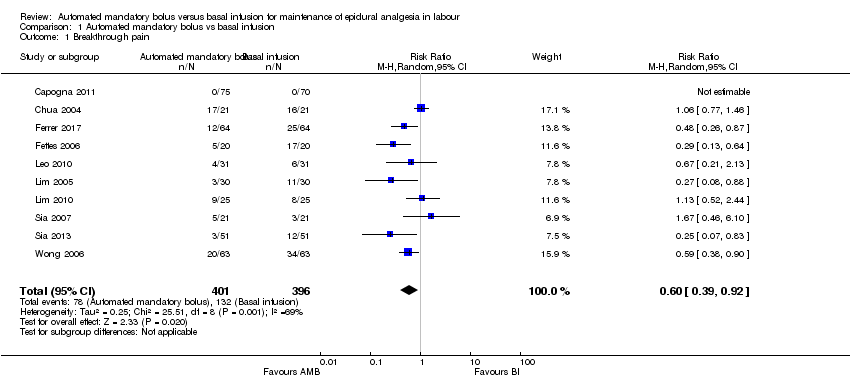
Comparison 1 Automated mandatory bolus vs basal infusion, Outcome 1 Breakthrough pain.

Comparison 1 Automated mandatory bolus vs basal infusion, Outcome 2 Breakthrough pain (epidural vs CSE).

Comparison 1 Automated mandatory bolus vs basal infusion, Outcome 3 Breakthrough pain (PCEA vs no PCEA).
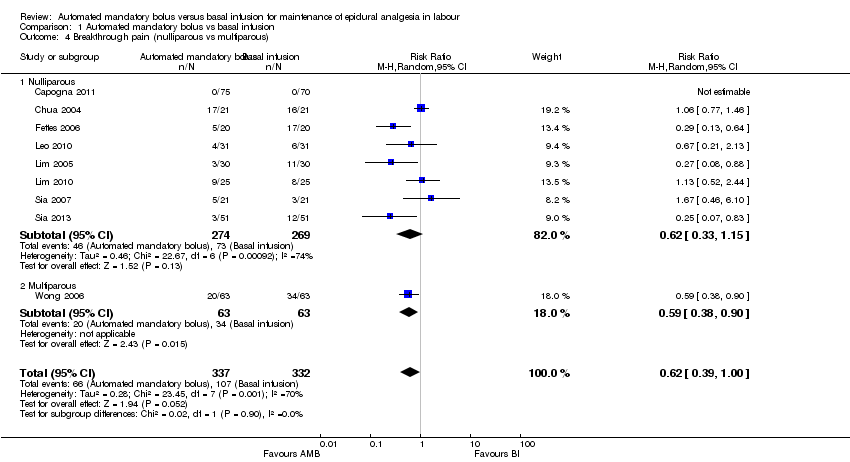
Comparison 1 Automated mandatory bolus vs basal infusion, Outcome 4 Breakthrough pain (nulliparous vs multiparous).
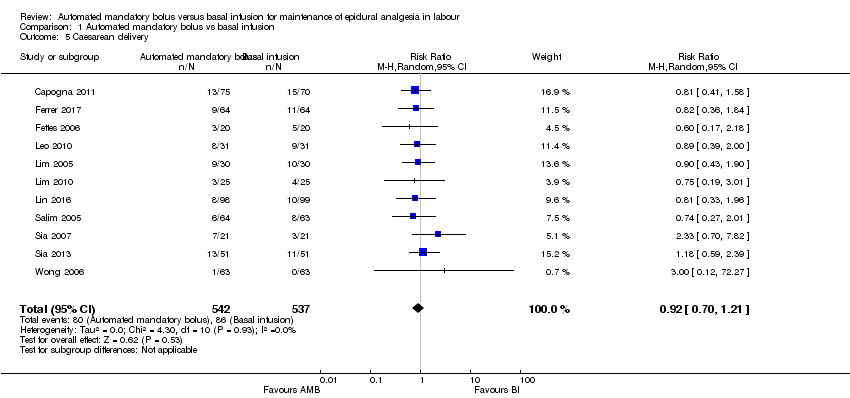
Comparison 1 Automated mandatory bolus vs basal infusion, Outcome 5 Caesarean delivery.

Comparison 1 Automated mandatory bolus vs basal infusion, Outcome 6 Caesarean delivery (LA + opioids vs LA alone).

Comparison 1 Automated mandatory bolus vs basal infusion, Outcome 7 Caesarean delivery (epidural vs CSE).

Comparison 1 Automated mandatory bolus vs basal infusion, Outcome 8 Caesarean delivery (PCEA vs no PCEA).

Comparison 1 Automated mandatory bolus vs basal infusion, Outcome 9 Caesarean delivery (nulliparous vs multiparous).
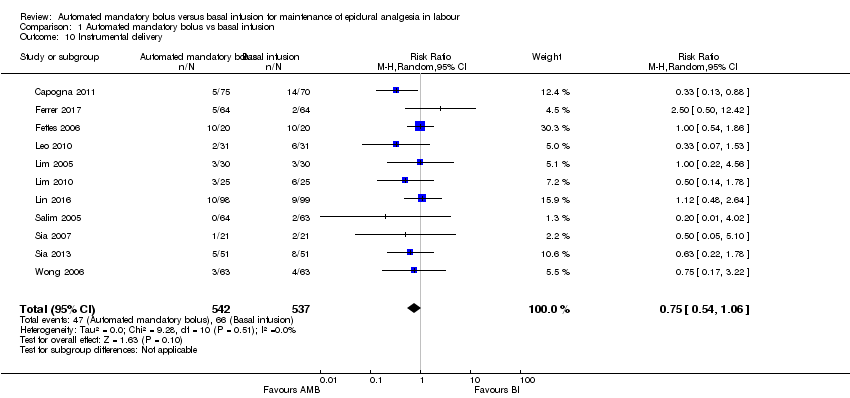
Comparison 1 Automated mandatory bolus vs basal infusion, Outcome 10 Instrumental delivery.

Comparison 1 Automated mandatory bolus vs basal infusion, Outcome 11 Instrumental delivery (LA + opioids vs LA alone).
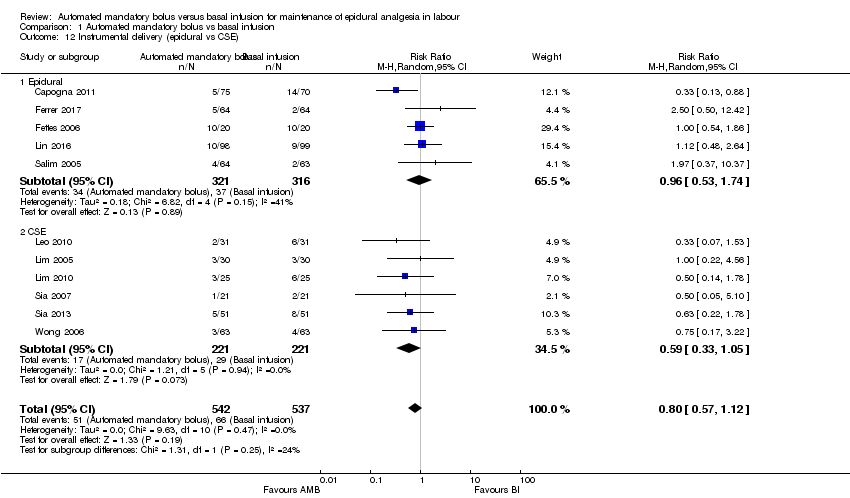
Comparison 1 Automated mandatory bolus vs basal infusion, Outcome 12 Instrumental delivery (epidural vs CSE).

Comparison 1 Automated mandatory bolus vs basal infusion, Outcome 13 Instrumental delivery (PCEA vs No PCEA).
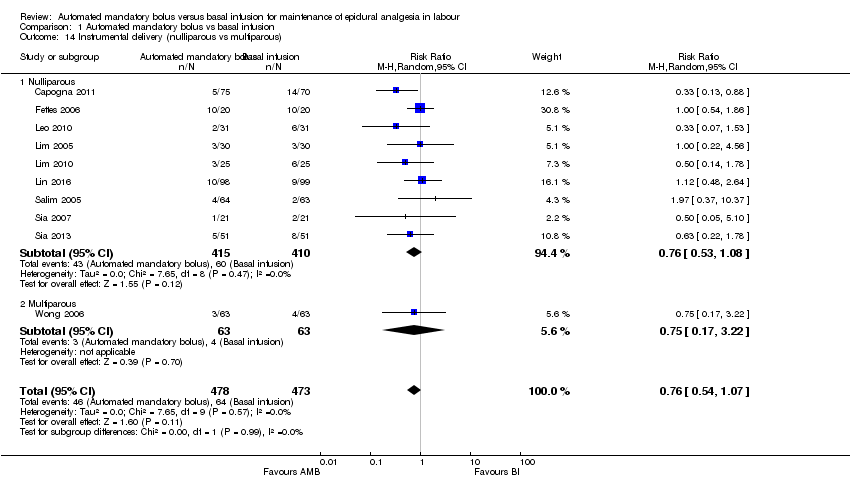
Comparison 1 Automated mandatory bolus vs basal infusion, Outcome 14 Instrumental delivery (nulliparous vs multiparous).

Comparison 1 Automated mandatory bolus vs basal infusion, Outcome 15 Duration of labour in minutes.

Comparison 1 Automated mandatory bolus vs basal infusion, Outcome 16 Duration of labour in minutes (LA + opioids vs LA alone).

Comparison 1 Automated mandatory bolus vs basal infusion, Outcome 17 Duration of labour in minutes (epidural vs CSE).
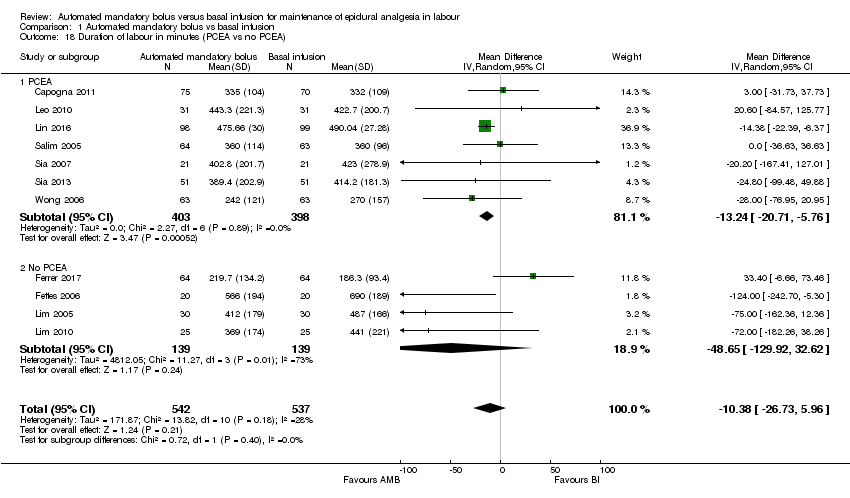
Comparison 1 Automated mandatory bolus vs basal infusion, Outcome 18 Duration of labour in minutes (PCEA vs no PCEA).
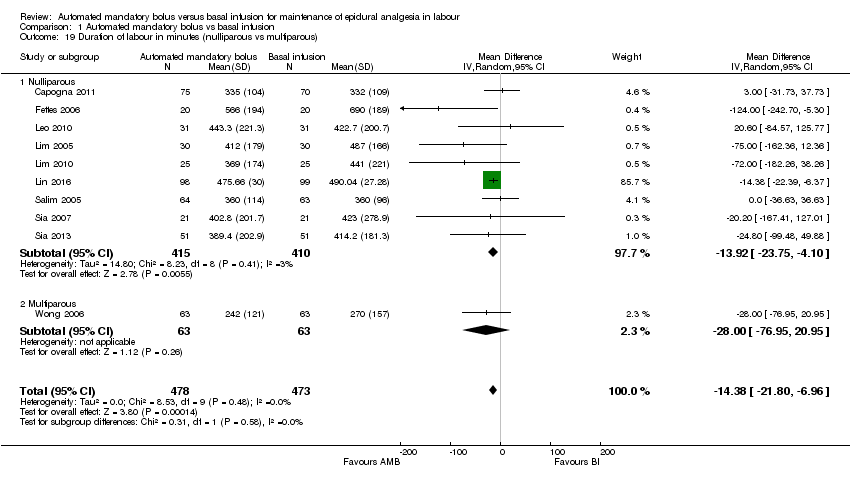
Comparison 1 Automated mandatory bolus vs basal infusion, Outcome 19 Duration of labour in minutes (nulliparous vs multiparous).

Comparison 1 Automated mandatory bolus vs basal infusion, Outcome 20 LA consumption per hour.
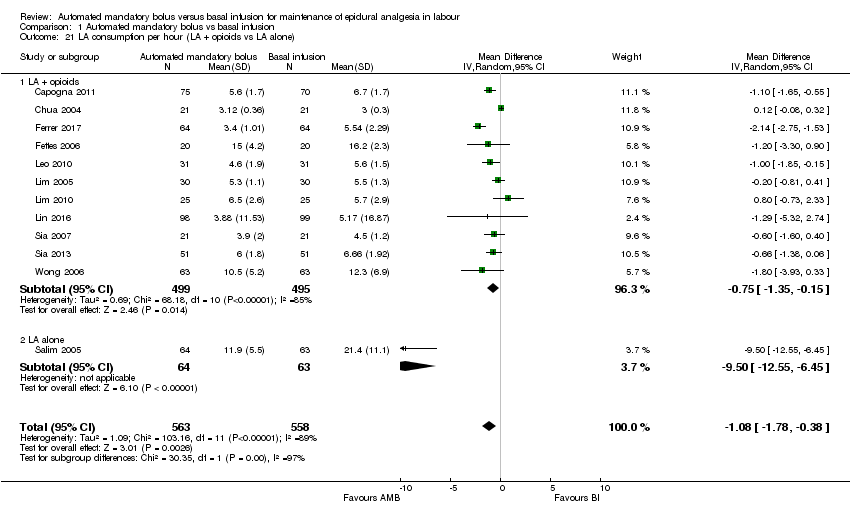
Comparison 1 Automated mandatory bolus vs basal infusion, Outcome 21 LA consumption per hour (LA + opioids vs LA alone).

Comparison 1 Automated mandatory bolus vs basal infusion, Outcome 22 LA consumption per hour (epidural vs CSE).

Comparison 1 Automated mandatory bolus vs basal infusion, Outcome 23 LA consumption per hour (PCEA vs no PCEA).

Comparison 1 Automated mandatory bolus vs basal infusion, Outcome 24 LA consumption per hour (nulliparous vs multiparous).
| Automated mandatory bolus versus basal infusion for maintenance of epidural analgesia in labour | |||||
| Patient or population: maintenance of epidural analgesia in labour | |||||
| Outcomes | Anticipated absolute effects* (95% CI) | Relative effect | № of participants | Certainty of the evidence | |
| Risk with basal infusion | Risk with automated mandatory bolus | ||||
| Breakthrough pain | Study population | RR 0.60 | 797 | ⊕⊕⊕⊝ | |
| 333 per 1000 | 200 per 1000 | ||||
| Caesarean delivery | Study population | RR 0.92 | 1079 | ⊕⊕⊝⊝ | |
| 160 per 1000 | 147 per 1000 | ||||
| Instrumental delivery | Study population | RR 0.75 | 1079 | ⊕⊕⊝⊝ | |
| 123 per 1000 | 92 per 1000 | ||||
| Duration of labour in min | The mean duration of labour in min ranged from 186.3 to 690.0 min | MD 10.38 min lower | — | 1079 | ⊕⊕⊕⊝ |
| LA consumption per hour | The mean LA consumption per hour ranged from 3 mg to 21.4 mg | MD 1.08 mg/h lower | — | 1121 | ⊕⊕⊕⊝ |
| *The risk in the intervention group (and its 95% confidence interval) is based on the assumed risk in the comparison group and the relative effect of the intervention (and its 95% CI). | |||||
| GRADE Working Group grades of evidence | |||||
| aDowngraded one level due to considerable statistical heterogeneity for this outcome, i.e. I2 = 69%. | |||||
| Outcome or subgroup title | No. of studies | No. of participants | Statistical method | Effect size |
| 1 Breakthrough pain Show forest plot | 10 | 797 | Risk Ratio (M‐H, Random, 95% CI) | 0.60 [0.39, 0.92] |
| 2 Breakthrough pain (epidural vs CSE) Show forest plot | 10 | 797 | Risk Ratio (M‐H, Random, 95% CI) | 0.60 [0.39, 0.92] |
| 2.1 Epidural | 3 | 313 | Risk Ratio (M‐H, Random, 95% CI) | 0.40 [0.25, 0.64] |
| 2.2 CSE | 7 | 484 | Risk Ratio (M‐H, Random, 95% CI) | 0.71 [0.44, 1.13] |
| 3 Breakthrough pain (PCEA vs no PCEA) Show forest plot | 10 | 797 | Risk Ratio (M‐H, Random, 95% CI) | 0.60 [0.39, 0.92] |
| 3.1 PCEA | 5 | 477 | Risk Ratio (M‐H, Random, 95% CI) | 0.61 [0.35, 1.07] |
| 3.2 No PCEA | 5 | 320 | Risk Ratio (M‐H, Random, 95% CI) | 0.58 [0.30, 1.12] |
| 4 Breakthrough pain (nulliparous vs multiparous) Show forest plot | 9 | 669 | Risk Ratio (M‐H, Random, 95% CI) | 0.62 [0.39, 1.00] |
| 4.1 Nulliparous | 8 | 543 | Risk Ratio (M‐H, Random, 95% CI) | 0.62 [0.33, 1.15] |
| 4.2 Multiparous | 1 | 126 | Risk Ratio (M‐H, Random, 95% CI) | 0.59 [0.38, 0.90] |
| 5 Caesarean delivery Show forest plot | 11 | 1079 | Risk Ratio (M‐H, Random, 95% CI) | 0.92 [0.70, 1.21] |
| 6 Caesarean delivery (LA + opioids vs LA alone) Show forest plot | 11 | 1079 | Risk Ratio (M‐H, Random, 95% CI) | 0.92 [0.70, 1.21] |
| 6.1 LA + opioids | 10 | 952 | Risk Ratio (M‐H, Random, 95% CI) | 0.93 [0.70, 1.24] |
| 6.2 LA alone | 1 | 127 | Risk Ratio (M‐H, Random, 95% CI) | 0.74 [0.27, 2.01] |
| 7 Caesarean delivery (epidural vs CSE) Show forest plot | 11 | 1079 | Risk Ratio (M‐H, Random, 95% CI) | 0.92 [0.70, 1.21] |
| 7.1 Epidural | 5 | 637 | Risk Ratio (M‐H, Random, 95% CI) | 0.78 [0.53, 1.15] |
| 7.2 CSE | 6 | 442 | Risk Ratio (M‐H, Random, 95% CI) | 1.08 [0.73, 1.59] |
| 8 Caesarean delivery (PCEA vs no PCEA) Show forest plot | 11 | 1079 | Risk Ratio (M‐H, Random, 95% CI) | 0.92 [0.70, 1.21] |
| 8.1 PCEA | 7 | 801 | Risk Ratio (M‐H, Random, 95% CI) | 0.98 [0.70, 1.37] |
| 8.2 No PCEA | 4 | 278 | Risk Ratio (M‐H, Random, 95% CI) | 0.81 [0.50, 1.30] |
| 9 Caesarean delivery (nulliparous vs multiparous) Show forest plot | 10 | 951 | Risk Ratio (M‐H, Random, 95% CI) | 0.93 [0.70, 1.25] |
| 9.1 Nulliparous | 9 | 825 | Risk Ratio (M‐H, Random, 95% CI) | 0.92 [0.69, 1.23] |
| 9.2 Multiparous | 1 | 126 | Risk Ratio (M‐H, Random, 95% CI) | 3.0 [0.12, 72.27] |
| 10 Instrumental delivery Show forest plot | 11 | 1079 | Risk Ratio (M‐H, Random, 95% CI) | 0.75 [0.54, 1.06] |
| 11 Instrumental delivery (LA + opioids vs LA alone) Show forest plot | 11 | 1079 | Risk Ratio (M‐H, Random, 95% CI) | 0.80 [0.57, 1.12] |
| 11.1 LA + opioids | 10 | 952 | Risk Ratio (M‐H, Random, 95% CI) | 0.77 [0.54, 1.08] |
| 11.2 LA alone | 1 | 127 | Risk Ratio (M‐H, Random, 95% CI) | 1.97 [0.37, 10.37] |
| 12 Instrumental delivery (epidural vs CSE) Show forest plot | 11 | 1079 | Risk Ratio (M‐H, Random, 95% CI) | 0.80 [0.57, 1.12] |
| 12.1 Epidural | 5 | 637 | Risk Ratio (M‐H, Random, 95% CI) | 0.96 [0.53, 1.74] |
| 12.2 CSE | 6 | 442 | Risk Ratio (M‐H, Random, 95% CI) | 0.59 [0.33, 1.05] |
| 13 Instrumental delivery (PCEA vs No PCEA) Show forest plot | 11 | 1079 | Risk Ratio (M‐H, Random, 95% CI) | 0.80 [0.57, 1.12] |
| 13.1 No PCEA | 4 | 278 | Risk Ratio (M‐H, Random, 95% CI) | 0.98 [0.60, 1.61] |
| 13.2 PCEA | 7 | 801 | Risk Ratio (M‐H, Random, 95% CI) | 0.67 [0.42, 1.05] |
| 14 Instrumental delivery (nulliparous vs multiparous) Show forest plot | 10 | 951 | Risk Ratio (M‐H, Random, 95% CI) | 0.76 [0.54, 1.07] |
| 14.1 Nulliparous | 9 | 825 | Risk Ratio (M‐H, Random, 95% CI) | 0.76 [0.53, 1.08] |
| 14.2 Multiparous | 1 | 126 | Risk Ratio (M‐H, Random, 95% CI) | 0.75 [0.17, 3.22] |
| 15 Duration of labour in minutes Show forest plot | 11 | 1079 | Mean Difference (IV, Random, 95% CI) | ‐10.38 [‐26.73, 5.96] |
| 16 Duration of labour in minutes (LA + opioids vs LA alone) Show forest plot | 11 | 1079 | Mean Difference (IV, Random, 95% CI) | ‐10.38 [‐26.73, 5.96] |
| 16.1 LA + opioids | 10 | 952 | Mean Difference (IV, Random, 95% CI) | ‐12.52 [‐31.87, 6.82] |
| 16.2 Duration of labor in minutes (LA alone) | 1 | 127 | Mean Difference (IV, Random, 95% CI) | 0.0 [‐36.63, 36.63] |
| 17 Duration of labour in minutes (epidural vs CSE) Show forest plot | 11 | 1079 | Mean Difference (IV, Random, 95% CI) | ‐10.38 [‐26.73, 5.96] |
| 17.1 Epidural | 5 | 637 | Mean Difference (IV, Random, 95% CI) | ‐3.04 [‐26.42, 20.34] |
| 17.2 CSE | 6 | 442 | Mean Difference (IV, Random, 95% CI) | ‐32.70 [‐65.20, ‐0.20] |
| 18 Duration of labour in minutes (PCEA vs no PCEA) Show forest plot | 11 | 1079 | Mean Difference (IV, Random, 95% CI) | ‐10.38 [‐26.73, 5.96] |
| 18.1 PCEA | 7 | 801 | Mean Difference (IV, Random, 95% CI) | ‐13.24 [‐20.71, ‐5.76] |
| 18.2 No PCEA | 4 | 278 | Mean Difference (IV, Random, 95% CI) | ‐48.65 [‐129.92, 32.62] |
| 19 Duration of labour in minutes (nulliparous vs multiparous) Show forest plot | 10 | 951 | Mean Difference (IV, Random, 95% CI) | ‐14.38 [‐21.80, ‐6.96] |
| 19.1 Nulliparous | 9 | 825 | Mean Difference (IV, Random, 95% CI) | ‐13.92 [‐23.75, ‐4.10] |
| 19.2 Multiparous | 1 | 126 | Mean Difference (IV, Random, 95% CI) | ‐28.0 [‐76.95, 20.95] |
| 20 LA consumption per hour Show forest plot | 12 | 1121 | Mean Difference (IV, Random, 95% CI) | ‐1.08 [‐1.78, ‐0.38] |
| 21 LA consumption per hour (LA + opioids vs LA alone) Show forest plot | 12 | 1121 | Mean Difference (IV, Random, 95% CI) | ‐1.08 [‐1.78, ‐0.38] |
| 21.1 LA + opioids | 11 | 994 | Mean Difference (IV, Random, 95% CI) | ‐0.75 [‐1.35, ‐0.15] |
| 21.2 LA alone | 1 | 127 | Mean Difference (IV, Random, 95% CI) | ‐9.50 [‐12.55, ‐6.45] |
| 22 LA consumption per hour (epidural vs CSE) Show forest plot | 12 | 1121 | Mean Difference (IV, Random, 95% CI) | ‐1.08 [‐1.78, ‐0.38] |
| 22.1 Epidural | 5 | 637 | Mean Difference (IV, Random, 95% CI) | ‐2.59 [‐4.13, ‐1.05] |
| 22.2 CSE | 7 | 484 | Mean Difference (IV, Random, 95% CI) | ‐0.35 [‐0.80, 0.11] |
| 23 LA consumption per hour (PCEA vs no PCEA) Show forest plot | 12 | 1121 | Mean Difference (IV, Random, 95% CI) | ‐1.08 [‐1.78, ‐0.38] |
| 23.1 PCEA | 7 | 801 | Mean Difference (IV, Random, 95% CI) | ‐1.59 [‐2.58, ‐0.60] |
| 23.2 No PCEA | 5 | 320 | Mean Difference (IV, Random, 95% CI) | ‐0.53 [‐1.58, 0.52] |
| 24 LA consumption per hour (nulliparous vs multiparous) Show forest plot | 11 | 993 | Mean Difference (IV, Random, 95% CI) | ‐0.89 [‐1.55, ‐0.23] |
| 24.1 Nulliparous | 10 | 867 | Mean Difference (IV, Random, 95% CI) | ‐0.83 [‐1.51, ‐0.15] |
| 24.2 Multiparous | 1 | 126 | Mean Difference (IV, Random, 95% CI) | ‐1.80 [‐3.93, 0.33] |