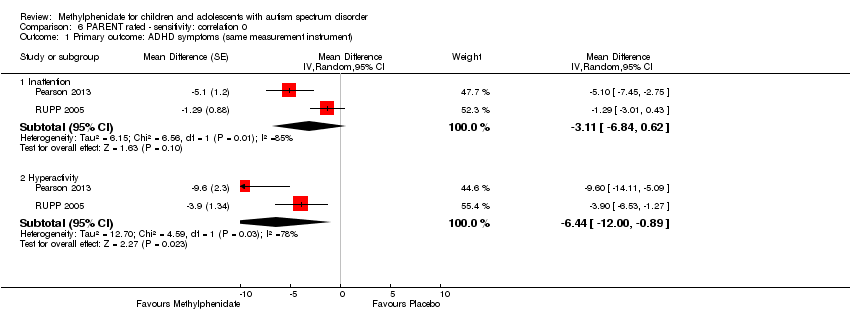
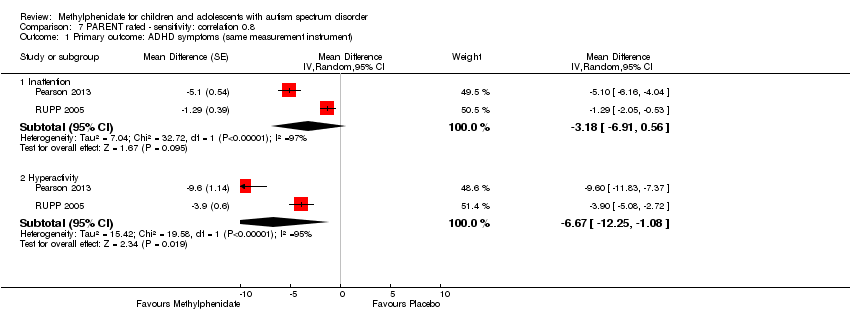
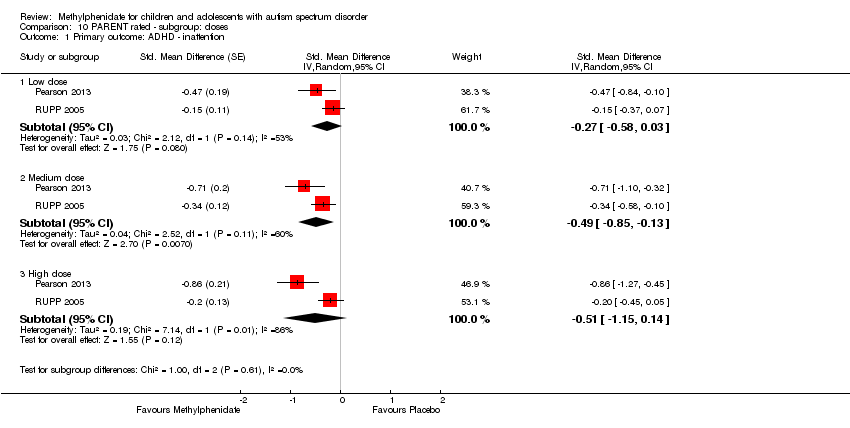
| 1 Primary outcome: ADHD ‐ inattention Show forest plot | 2 | | Std. Mean Difference (Random, 95% CI) | Subtotals only |
|
| 1.1 Low dose | 2 | | Std. Mean Difference (Random, 95% CI) | ‐0.28 [‐0.61, 0.05] |
| 1.2 Medium dose | 2 | | Std. Mean Difference (Random, 95% CI) | ‐0.46 [‐0.89, ‐0.04] |
| 1.3 High dose | 2 | | Std. Mean Difference (Random, 95% CI) | ‐0.38 [‐0.75, ‐0.02] |
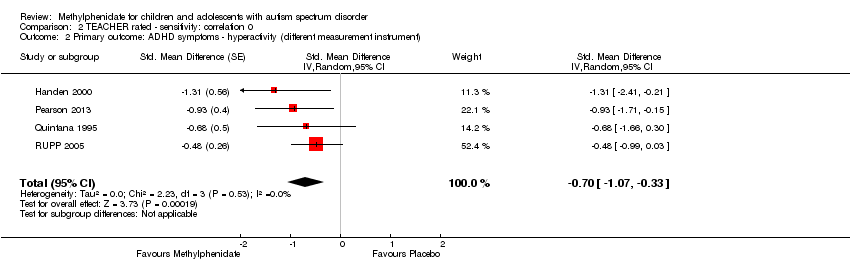
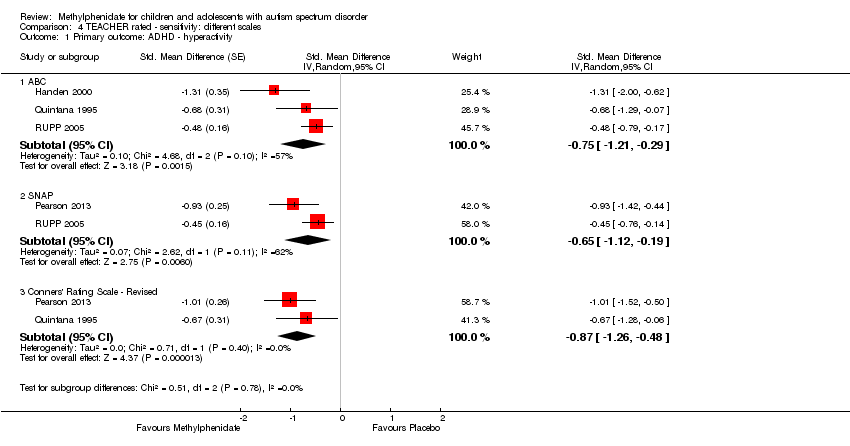
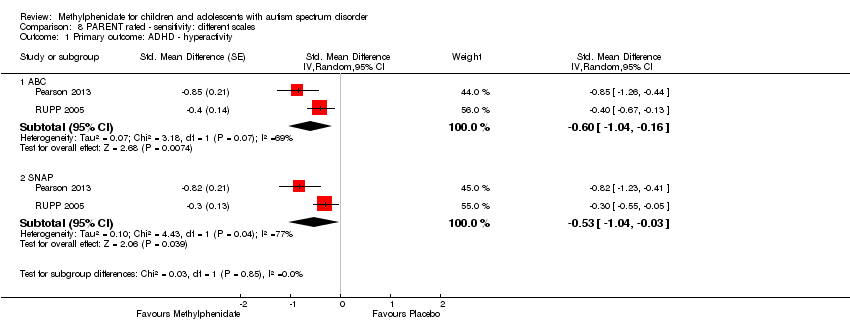
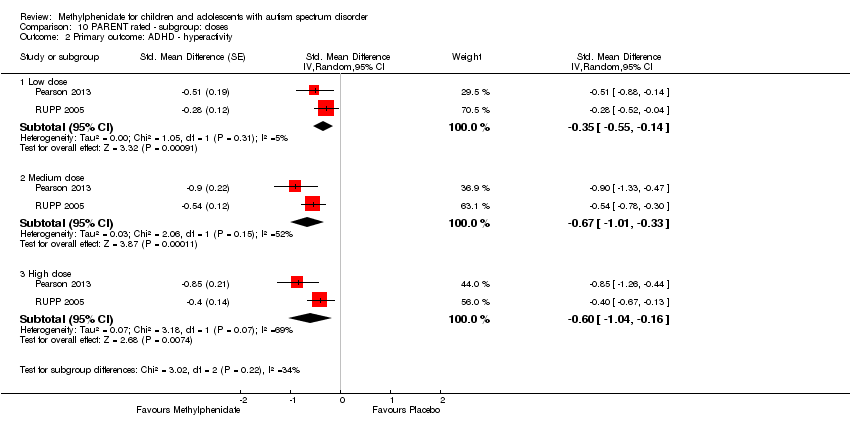
| 2 Primary outcome: ADHD ‐ hyperactivity Show forest plot | 4 | | Std. Mean Difference (Random, 95% CI) | Subtotals only |
|
| 2.1 Low dose | 2 | | Std. Mean Difference (Random, 95% CI) | ‐0.40 [‐0.77, ‐0.03] |
| 2.2 Medium dose | 3 | | Std. Mean Difference (Random, 95% CI) | ‐0.55 [‐1.00, ‐0.10] |
| 2.3 High dose | 4 | | Std. Mean Difference (Random, 95% CI) | ‐0.78 [‐1.13, ‐0.43] |
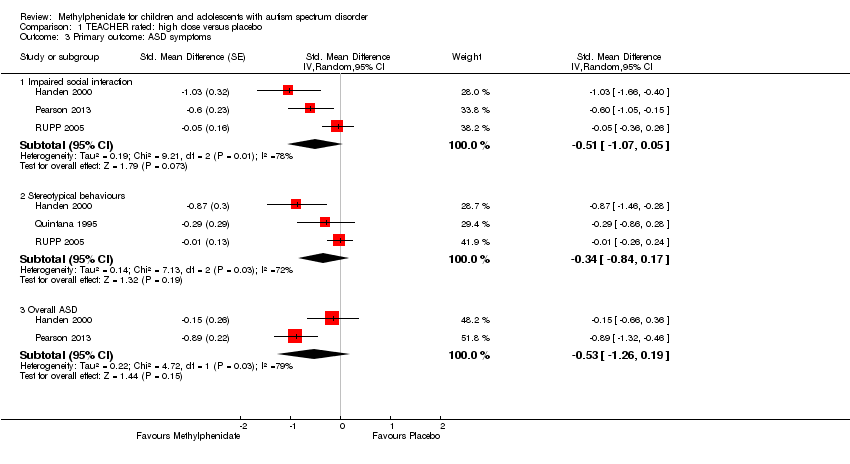
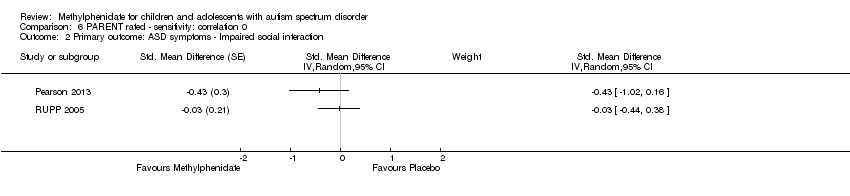
| 3 Primary outcome: ASD ‐ impaired social interaction Show forest plot | 3 | | Std. Mean Difference (Random, 95% CI) | Subtotals only |
|
| 3.1 Low dose | 2 | | Std. Mean Difference (Random, 95% CI) | ‐0.30 [‐0.59, ‐0.02] |
| 3.2 Medium dose | 3 | | Std. Mean Difference (Random, 95% CI) | ‐0.44 [‐0.94, 0.06] |
| 3.3 High dose | 3 | | Std. Mean Difference (Random, 95% CI) | ‐0.51 [‐1.07, 0.05] |
| 4 Primary outcome: ASD ‐ stereotypical behaviours Show forest plot | 3 | | Std. Mean Difference (Random, 95% CI) | Subtotals only |
|
| 4.1 Medium dose | 2 | | Std. Mean Difference (Random, 95% CI) | ‐0.23 [‐0.43, ‐0.03] |
| 4.2 High dose | 3 | | Std. Mean Difference (Random, 95% CI) | ‐0.34 [‐0.84, 0.17] |
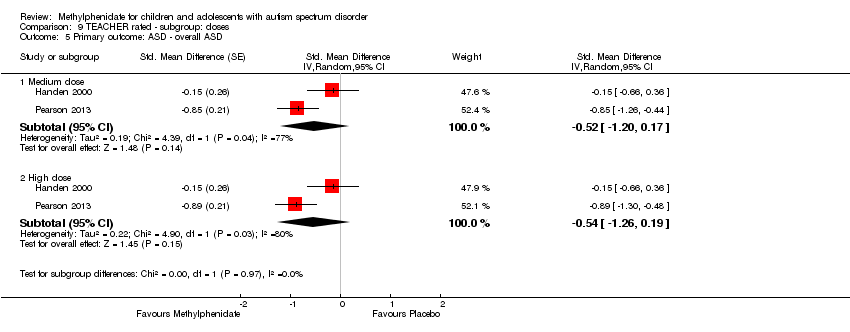
| 5 Primary outcome: ASD ‐ overall ASD Show forest plot | 2 | | Std. Mean Difference (Random, 95% CI) | Subtotals only |
|
| 5.1 Medium dose | 2 | | Std. Mean Difference (Random, 95% CI) | ‐0.52 [‐1.20, 0.17] |
| 5.2 High dose | 2 | | Std. Mean Difference (Random, 95% CI) | ‐0.54 [‐1.26, 0.19] |
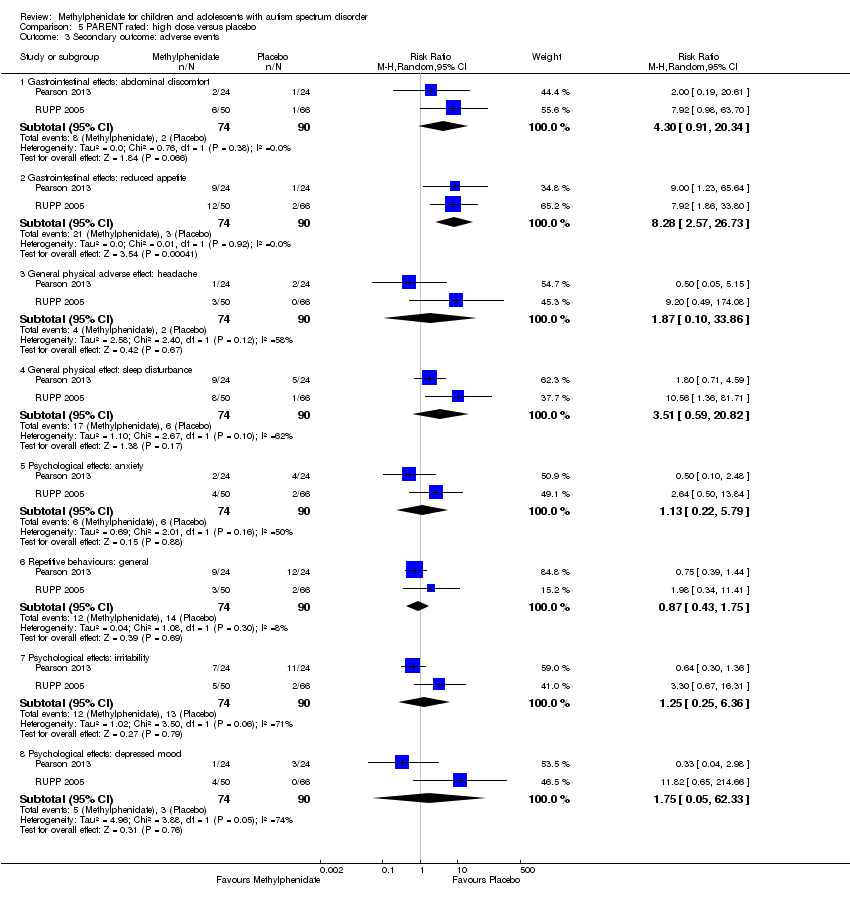
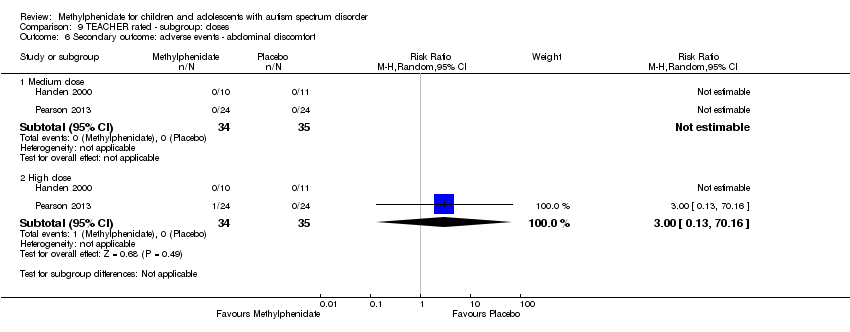
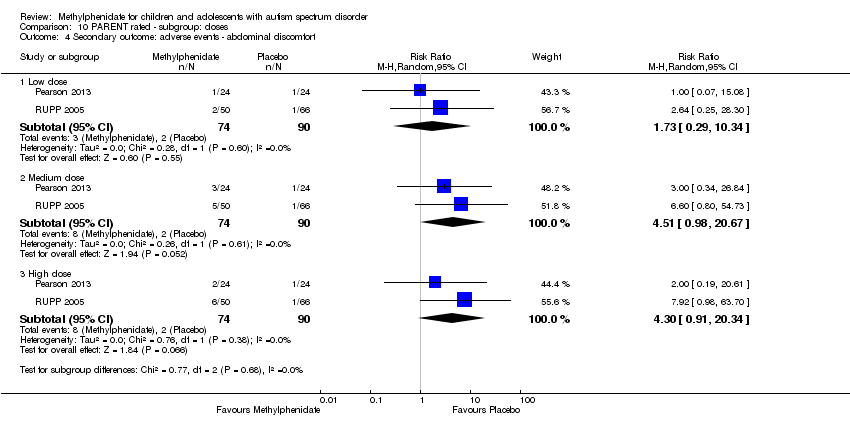
| 6 Secondary outcome: adverse events ‐ abdominal discomfort Show forest plot | 2 | | Risk Ratio (M‐H, Random, 95% CI) | Subtotals only |
|
| 6.1 Medium dose | 2 | 69 | Risk Ratio (M‐H, Random, 95% CI) | 0.0 [0.0, 0.0] |
| 6.2 High dose | 2 | 69 | Risk Ratio (M‐H, Random, 95% CI) | 3.00 [0.13, 70.16] |
| 7 Secondary outcome: adverse events ‐ reduced appetite Show forest plot | 2 | | Risk Ratio (M‐H, Random, 95% CI) | Subtotals only |
|
| 7.1 Medium dose | 2 | 69 | Risk Ratio (M‐H, Random, 95% CI) | 1.29 [0.75, 2.20] |
| 7.2 High dose | 2 | 69 | Risk Ratio (M‐H, Random, 95% CI) | 1.33 [0.43, 4.12] |
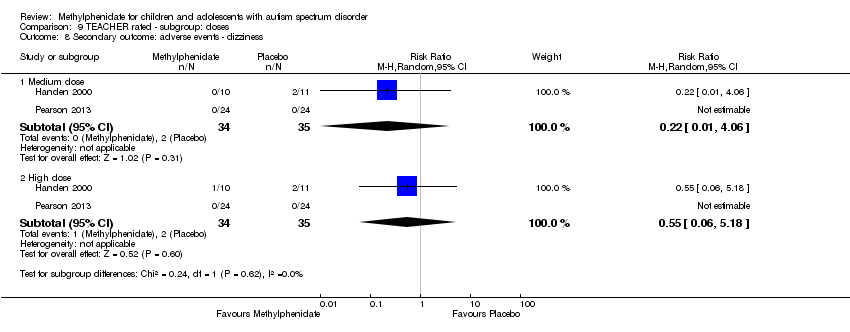
| 8 Secondary outcome: adverse events ‐ dizziness Show forest plot | 2 | | Risk Ratio (M‐H, Random, 95% CI) | Subtotals only |
|
| 8.1 Medium dose | 2 | 69 | Risk Ratio (M‐H, Random, 95% CI) | 0.22 [0.01, 4.06] |
| 8.2 High dose | 2 | 69 | Risk Ratio (M‐H, Random, 95% CI) | 0.55 [0.06, 5.18] |
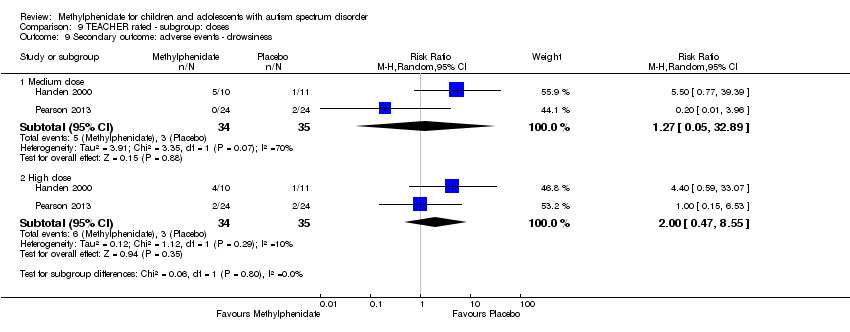
| 9 Secondary outcome: adverse events ‐ drowsiness Show forest plot | 2 | | Risk Ratio (M‐H, Random, 95% CI) | Subtotals only |
|
| 9.1 Medium dose | 2 | 69 | Risk Ratio (M‐H, Random, 95% CI) | 1.27 [0.05, 32.89] |
| 9.2 High dose | 2 | 69 | Risk Ratio (M‐H, Random, 95% CI) | 2.00 [0.47, 8.55] |
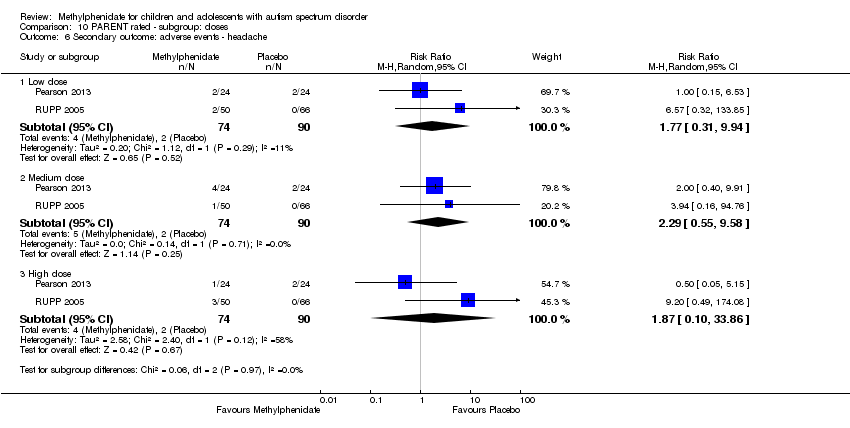
| 10 Secondary outcome: adverse events ‐ headache Show forest plot | 2 | | Risk Ratio (M‐H, Random, 95% CI) | Subtotals only |
|
| 10.1 Medium dose | 2 | 69 | Risk Ratio (M‐H, Random, 95% CI) | 0.0 [0.0, 0.0] |
| 10.2 High dose | 2 | 69 | Risk Ratio (M‐H, Random, 95% CI) | 3.00 [0.13, 70.16] |
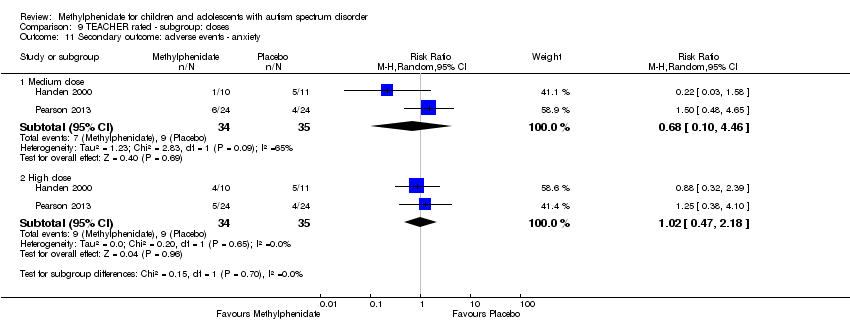
| 11 Secondary outcome: adverse events ‐ anxiety Show forest plot | 2 | | Risk Ratio (M‐H, Random, 95% CI) | Subtotals only |
|
| 11.1 Medium dose | 2 | 69 | Risk Ratio (M‐H, Random, 95% CI) | 0.68 [0.10, 4.46] |
| 11.2 High dose | 2 | 69 | Risk Ratio (M‐H, Random, 95% CI) | 1.02 [0.47, 2.18] |
| 12 Secondary outcome: adverse events ‐ depressed mood Show forest plot | 2 | | Risk Ratio (M‐H, Random, 95% CI) | Subtotals only |
|
| 12.1 Medium dose | 2 | 69 | Risk Ratio (M‐H, Random, 95% CI) | 1.01 [0.46, 2.26] |
| 12.2 High dose | 2 | 69 | Risk Ratio (M‐H, Random, 95% CI) | 1.19 [0.37, 3.79] |
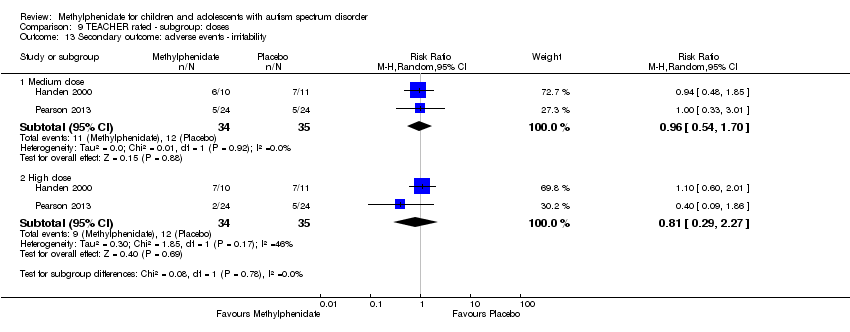
| 13 Secondary outcome: adverse events ‐ irritability Show forest plot | 2 | | Risk Ratio (M‐H, Random, 95% CI) | Subtotals only |
|
| 13.1 Medium dose | 2 | 69 | Risk Ratio (M‐H, Random, 95% CI) | 0.96 [0.54, 1.70] |
| 13.2 High dose | 2 | 69 | Risk Ratio (M‐H, Random, 95% CI) | 0.81 [0.29, 2.27] |
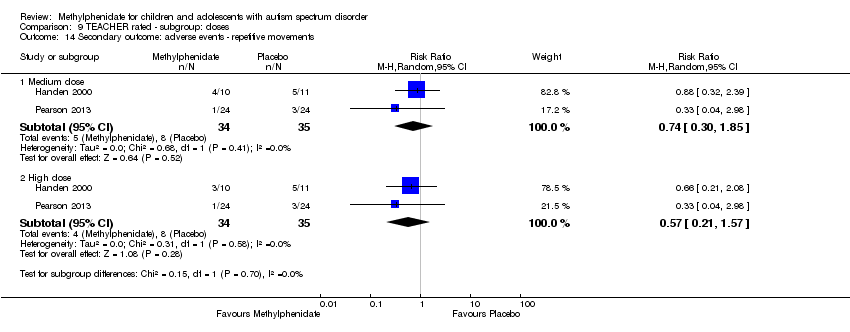
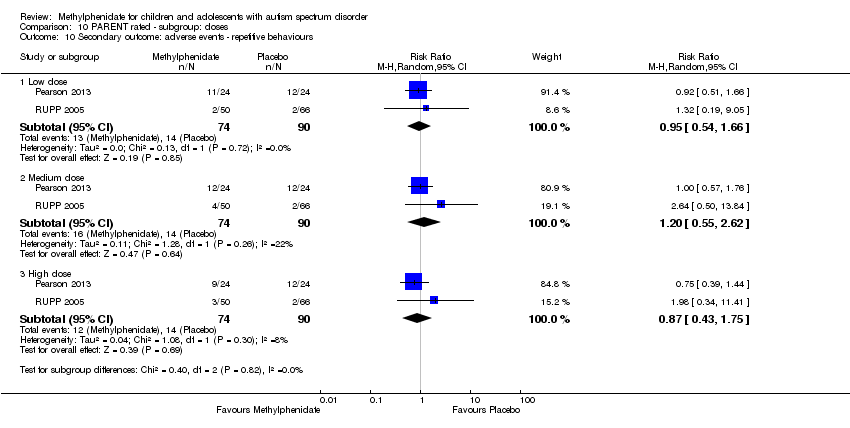
| 14 Secondary outcome: adverse events ‐ repetitive movements Show forest plot | 2 | | Risk Ratio (M‐H, Random, 95% CI) | Subtotals only |
|
| 14.1 Medium dose | 2 | 69 | Risk Ratio (M‐H, Random, 95% CI) | 0.74 [0.30, 1.85] |
| 14.2 High dose | 2 | 69 | Risk Ratio (M‐H, Random, 95% CI) | 0.57 [0.21, 1.57] |