Metilfenidato para niños y adolescentes con trastorno del espectro autista
Referencias
References to studies included in this review
References to studies excluded from this review
Additional references
References to other published versions of this review
Characteristics of studies
Characteristics of included studies [ordered by study ID]
Ir a:
| Methods | Design: double‐blind, randomised, placebo‐controlled, cross‐over design Duration of study: 3 weeks | |
| Participants | Location: USA Setting: recruitment from special education, psychiatric inpatient or psychiatric day treatment programmes Study start date: not specified (prior to 2000) Study end date: not specified Number recruited: not specified Number randomised: 13 children (10 boys, 3 girls) Number completed: 12 Number of dropouts/withdrawals: 1 Mean age: 7.4 years (SD 6.5; range 5.6 to 11.2) Ethnicity: African American (n = 7), white (n = 4), Latino (n = 2) ASD Diagnosis: autistic disorder (n = 9), PDD‐NOS (n = 4) ADHD diagnosis: a score of 15 points or more on the Hyperactivity Index of the Teacher Conners Rating Scale Other diagnosis: oppositional defiant disorder, tuberous sclerosis, mosaic Down's syndrome Cognitive function: ranged from severe/profound disability to average intelligence Stimulant use history: uncertain, likely to have included a "mix of kids with prior experience with stimulants" Handen 2016 (personal communication) and some with no prior experience Concurrent medication: none Inclusion criteria
Exclusion criteria: not specified | |
| Interventions | Intervention: 0.3 mg/kg and 0.6 mg/kg doses of MPH Comparison: placebo Administration: each MPH dose and the placebo dose was given 2 to 3 times a day for 7 consecutive days. Doses were given with breakfast and 4 hours later with lunch. 11 participants took a third MPH dose around 4:00 pm. The lower MPH dose always preceded the higher dose. This resulted in three possible drug orders:
| |
| Outcomes | Primary outcome measures (teacher rated)
Primary outcome measures (parent rated): parents rated similar questionnaires but data were incomplete and not reported Administration of outcome assessment: outcome measures were completed by the classroom teacher or programme staff at the end of the week for each MPH condition. Information is not available about the administration of questionnaires to parents. | |
| Aim of study | To determine the efficacy and safety issues of MPH use among children with autism and symptoms of ADHD | |
| Notes | Comment on design: the cross‐over trial design was appropriate for the clinical context, given that ASD is a relatively stable, chronic condition. No period or carry‐over effects would be anticipated for methylphenidate, even in the absence of a washout period, as the elimination half‐life for both the immediate‐ and extended‐release forms is 2 to 3 hours, and the average duration of action of (immediate‐release) methylphenidate is approximately 4 hours (Novartis 2014). Data collection was also focused at the end of each week of intervention, further reducing the risk of any carry‐over effect. Other comments: none | |
| Risk of bias | ||
| Bias | Authors' judgement | Support for judgement |
| Random sequence generation (selection bias) | Unclear risk | Quote: "Drug order was randomly assigned. However the lower MPH dose always preceded the higher dose." Comment: method of sequence generation not described |
| Allocation concealment (selection bias) | Unclear risk | Comment: method of allocation not reported |
| Blinding of participants and personnel (performance bias) | Unclear risk | Comment: all participants and parents were reported to be blinded to doses and/or placebo treatments. It is not reported whether participants had ever taken MPH previously and hence could have recognised the medication. The corresponding author indicated that some participants may have taken MPH previously. |
| Blinding of outcome assessment (detection bias) | Low risk | Quote: "Both parents and teachers were unaware of the fact that the lower MPH dose would precede the higher dose". Comment: all respondents (parents and teachers) were blinded to doses, placebo treatments or both. |
| Incomplete outcome data (attrition bias) | Unclear risk | Comment: 2 participants had 0.6 mg/kg dose discontinued after only 1 day. A 3rd participant was missing CARS data for placebo condition. For both of these conditions missing data were imputed using a maximum likelihood techniques as outlined in 'Inference and missing data'. A 4th participant was unable to complete the protocol for either MPH dose due to the presence of significant adverse side effects. Data (except for side effects data) for this participant were not included for analysis. |
| Selective reporting (reporting bias) | High risk | Quote: "Only questionnaires from teachers were used" |
| Other bias | Unclear risk | Comment: no information available on conflict of interest. The study was supported by a Research Foundation grant. |
| Methods | Design: double‐blind, placebo‐controlled, cross‐over trial Duration of study: 4 weeks | |
| Participants | Location: USA Setting: recruitment from special education classrooms, all children were living at home Study start date: not specified (prior to 2013) Study end date: not specified Number recruited: not specified Number randomised: 24 children (19 boys and 5 girls) Number completed: 24 Number of dropouts/withdrawals: 0 Mean age: 8.8 years (SD 1.7; range 7.1 to 12.7) years Ethnicity: white (n = 13), Hispanic (n = 5), African‐American (n = 4), Asian (n = 1), and multiple races (n = 1) ASD diagnosis: autistic disorder (n = 19), Asperger's disorder (n = 3), PDD‐NOS (n = 2) ADHD diagnosis: combined type (n = 19), predominantly inattentive type (n = 5). Mean Conners' Parent Rating Scale ‐ Revised ADHD Index T score = 76.1 (SD 6.7) and mean Conners' Teacher Rating Scale ‐ Revised ADHD Index T score = 67.2 (SD 8.7) Other diagnosis: oppositional defiant disorder (n = 5), obsessive compulsive disorder (n = 2), separation anxiety (n = 1) Cognitive function: mean full scale IQ 85.0 (SD 16.8) Stimulant‐use history: 13 children had previously taken stimulant medication. This was discontinued 1 week or more (mean = 63 days, range: 7–547 days) prior to entering the trial. Concurrent medication: 7 children continued long‐term medications (at a constant dose) during the trial: risperidone (n = 3), aripiprazole (n = 1), sertraline (n = 1), bupropion (n = 1), and trazodone (n = 1) Inclusion criteria:
Exclusion criteria
| |
| Interventions | Intervention: 1 week low‐dose MPH (0.21 mg/kg ER‐MPH morning and 0.14 mg/kg IR‐MPH afternoon), 1 week medium‐dose MPH (0.35 mg/kg ER‐MPH morning and 0.24 mg/kg IR‐MPH afternoon), and 1 week high‐dose MPH (0.48mg/kg ER‐MPH morning and 0.27 mg/kg IR‐MPH afternoon). No child received a dose greater than the equivalent of an IR‐MPH dose of 0.6 mg/kg, and no child's total daily dose exceeded the equivalent of an IR‐MPH twice‐daily dose of 50 mg Comparison: placebo Administration: 1 week of 2 days each of low, medium, and high MPH doses in ascending order to assess tolerability. All 24 children tolerated all 3 doses. 1 week each of the 4 MPH dosing regimens | |
| Outcomes | Primary outcome measure: Conners' Teacher Rating Scale ‐ Revised ‐ Short Form (CTRS‐R‐SF; 28 items) Secondary outcome measures
Administration of outcome assessment: Weekly at the end of each week of intervention/placebo | |
| Aim of study | Quote: "The purpose of this study was to examine the behavioral effects of four doses of psychostimulant medication, combining extended‐release methylphenidate (MPH) in the morning with immediate‐release MPH in the afternoon." Quote: "Our goals were to determine if: 1) ER‐MPH was associated with improvements in parent and teacher behavioral ratings, and 2) the MPH dose‐response curve was linear (i.e. higher MPH doses were associated with consistent improvements in behavioral functioning), or curvilinear (an initial behavioral improvement with MPH, followed by behavioral declines at higher doses)." | |
| Notes | Comment on design: the cross‐over trial design was appropriate for the clinical context, given that ASD is a relatively stable, chronic condition. No period or carry‐over effects would be anticipated for methylphenidate, even in the absence of a washout period, as the elimination half‐life for both the immediate‐ and extended‐release forms is 2‐3 hours (Novartis 2014). The average duration of action of (immediate‐release) methylphenidate is approximately 4 hours, and the extended release form used in Pearson has a duration of action of approximately 8 hours (Novartis 2014). Data collection was also focused at the end of each week of intervention, further reducing the risk of any carry‐over effect. Other comments
| |
| Risk of bias | ||
| Bias | Authors' judgement | Support for judgement |
| Random sequence generation (selection bias) | Unclear risk | Comment: the order of dosage administration was "counterbalanced across children" using diagram‐balanced Latin squares. This is not a randomising procedure and is more commonly used in larger studies. |
| Allocation concealment (selection bias) | Unclear risk | Comment: it is not clear how dosing sequences were allocated. |
| Blinding of participants and personnel (performance bias) | Unclear risk | Quote: "All study personnel with patient contact were blind with respect to dosages given during the drug trial". Comment: it is not stated whether parents were blinded. However, 13/24 participants had previously taken MPH so may have identified whether or not they were taking the active medication based on previous experience. The study physician and the study psychologist were also unblinded during the test‐dose week. |
| Blinding of outcome assessment (detection bias) | Unclear risk | Comment: 13/24 participants had previously taken MPH so parents and teachers are likely to have identified whether or not the children were taking the active medication based on previous experience. 2 blinded clinicians completed the Clinician Global Impression measures, after achieving reliability on training vignettes. |
| Incomplete outcome data (attrition bias) | Low risk | Comment: all 24 participants completed the trial but 5/24 children discontinued the afternoon IR‐MPH dose because of behavior concerns in late afternoon/evening. All 5 of these children experienced irritability, 2 experienced decreased sleep, and 2 showed increased stereotypical behaviours. Parent ratings were available for all 24 children, whereas teacher ratings were only available for 18 children (6 were assessed in summer when school was in recess). Outcomes are reported for all participants, with the above exceptions. |
| Selective reporting (reporting bias) | Low risk | Comment: comprehensive reporting of outcomes |
| Other bias | Unclear risk | Comment: The authors report having received financial support from a number of pharmaceutical companies (including manufacturers of pharmaceuticals for behavioural syndromes in children). The study was funded by grant MH072263 from the National Institute of Mental Health (NIMH). |
| Methods | Design: double‐blind, cross‐over study Duration of study: 6 weeks | |
| Participants | Location: New York, USA Setting: recruitment from psychiatric outpatient clinic Study start date: not specified, prior to 1995 Study end date: not specified Number recruited: not reported, and the attempt made to contact the corresponding author to clarify this was not successful Number randomised: 10 children (6 boys; 4 girls) Number completed: 10 Number of dropouts/withdrawals: 0 Mean age: 8.5 years (SD 1.3; range 7 to 11) Ethnicity: not specified ASD diagnosis: Baseline Childhood Autism Rating Scale scores between 30.0 and 59.5 ADHD diagnosis: not specified Other diagnosis: not specified, "wide range of baseline behaviours" reported Cognitive function: 7 children met criteria for mild intellectual impairment Stimulant‐use history: nil Concurrent medication: nil (all participants had previously been prescribed neuroleptic medication but this was ceased prior to study) Inclusion criteria
Exclusion criteria
| |
| Interventions | Intervention: MPH treatment appeared to consist of one week of MPH 10 mg twice daily followed by a second week of MPH 20 mg twice daily, although it may have consisted of either 2 weeks of MPH 10 mg twice daily, or two weeks of MPH 20 mg twice daily. Comparison: placebo Administration: cross‐over MPH versus placebo study completed in 6 weeks, with 2 weeks medication‐free baseline, 2 weeks placebo or MPH followed by cross‐over | |
| Outcomes | Primary and secondary outcomes were not specified Clinician instruments
Parent Instruments: Conners Abbreviated Parent Questionnaire (CAPQ; 10‐item) Administration of outcome assessment: participants were rated by clinicians in a 3‐hour simulated classroom situation and during free play at the day hospital, at the end of each week. Parent questionnaires were completed weekly based on at‐home behaviour for the week prior to the day hospital assessment | |
| Aim of study | To evaluate "MPH efficacy and side effects in the treatment of children with autistic disorder" | |
| Notes | Comment on design: the cross‐over trial design was appropriate for the clinical context, given that ASD is a relatively stable, chronic condition. No period or carry‐over effects would be anticipated for methylphenidate, even in the absence of a washout period, as the elimination half‐life for both the immediate‐ and extended‐release forms is 2‐3 hours and the average duration of action of (immediate‐release) methylphenidate is approximately 4 hours (Novartis 2014). Data collection was also focused at the end of each week of intervention, further reducing the risk of any carry‐over effect. Other comments
| |
| Risk of bias | ||
| Bias | Authors' judgement | Support for judgement |
| Random sequence generation (selection bias) | Unclear risk | Comment: not described |
| Allocation concealment (selection bias) | Unclear risk | Comment: not described but reported as "randomly assigned" |
| Blinding of participants and personnel (performance bias) | Unclear risk | Comment: nursing staff administering morning dose on day of observation may not have been blinded to drug and drug dose, although the "investigators, the children and the parents were blind to drug and drug dose". |
| Blinding of outcome assessment (detection bias) | Low risk | Comment: Clinicians, children and parents were reported to be "blind to drug and drug dose". None of the children had been on MPH before entry into the study, which minimises the risk of recognition of the effects of MPH. |
| Incomplete outcome data (attrition bias) | Low risk | Comment: unclear if all participants completed study, but table 2 reports n = 10 in the title of the table. |
| Selective reporting (reporting bias) | High risk | Comment: Outcomes for all mentioned instruments are reported in table 2 and in the text except the CARS. This is an autism scale that rates the severity of symptoms based on observation. It was listed as an outcome, and it is unclear why this was omitted in the reporting of the results. |
| Other bias | Unclear risk | Comment: no reporting of conflicts of interest or financial support |
| Methods | Design: randomised, double‐blind, placebo‐controlled, cross‐over trial, including a 1‐week test‐dose phase to check the tolerability of MPH at each dose; a 4‐week randomised‐order, placebo‐controlled, double‐blind cross‐over phase; and an 8‐week, open‐label continuation phase for responders, at best dose identified in cross‐over phase. Only the results from the 4‐week randomised cross‐over phase are included in our analysis. Duration of study: 4 weeks | |
| Participants | Location: USA Setting: 5 centers forming the Research Units on Pediatric Psychopharmacology Autism Network Study start date: 14 November 2001 Study end date: 5 September 2003 Number recruited: 72 (6 of these participants had intolerable adverse events with more than 1 methylphenidate dosage level during the test‐dose phase, and they exited the study prior to randomisation as per protocol) Number randomised: 66 (59 boys, 7 girls) Number completed: 58 Number of dropouts/withdrawals: 8. 1 participant who was randomised withdrew prior to cross‐over phase and 7 children withdrew during cross‐over phase due to intolerable adverse events. Mean age: 7.5 years (SD 2.2; range 5.0 to 13.7 years) Ethnicity: white (n = 48), African‐American (n = 9), Asian (n = 6), Latino (n = 3) ASD diagnosis: autistic disorder, Asperger's disorder, or PDD‐NOS‐ based on DSM‐IV. ADHD diagnosis: based on SNAP‐IV and Clinician Global Impression‐Severity Other diagnosis: not specified Cognitive function: Slosson IQ, mean 62.6 (SD 32.9), range 16‐135 Stimulant‐use history: excluded if adequate trial of MPH within past 2 years Concurrent medication: nil (ceased prior to baseline visit) Inclusion criteria
Exclusion criteria
| |
| Interventions | Test‐dose phase
Participants were excluded from the cross‐over study if they experienced a severe adverse event, or were rated 'much worse' or 'very much worse' on the CGI, at the low or medium dose. Participants were randomised to a modified cross‐over schedule (omitting high dose) if the adverse event or clinical worsening occurred only on the high dose (15 participants) Study phase Intervention: 3 different doses of MPH (low, medium, high) Comparison: placebo Administration: 4‐week cross‐over phase. Each participant received 1 week placebo and 1 week each of 3 different doses of MPH in random order (except high dose never followed placebo). 16 participants received the modified cross‐over schedule (medium dose administered twice*, no high dose). | |
| Outcomes | Primary outcome: teacher‐rated hyperactivity subscale (16 items) of Aberrant Behavior Checklist (ABC) (RUPP 2005) Secondary outcomes
Administration of outcome assessment: ratings were performed at the end of each week of treatment | |
| Aim of study | To determine the efficacy and safety of MPH in children with PDD and hyperactivity | |
| Notes | Comment on design: the cross‐over trial design was appropriate for the clinical context, given that ASD is a relatively stable, chronic condition. No period or carry‐over effects would be anticipated for methylphenidate, even in the absence of a washout period, as the elimination half‐life for both the immediate‐ and extended‐release forms is 2‐3 hours, and the average duration of action of (immediate‐release) methylphenidate is approximately 4 hours (Novartis 2014). Data collection was also focused at the end of each week of intervention, further reducing the risk of any carry‐over effect. Other comments: RUPP 2005 only reports means and SDs for teacher and parent rated hyperactivity subscale of ABC; very partial reporting of secondary outcomes (other ABC subscales), with a few effect sizes and P values only. The 2007 article reports means and SDs of a secondary analysis. The 2009 article reports mean and SD for social communication measures in their subset secondary analysis (only measured at some sites of the multicentre trial). *Data from both medium dose weeks were combined. **The Parent and Teacher SNAP‐IV and Clinician CYBOCC‐PDD outcomes were only mentioned and reported in the 2007 secondary analysis article | |
| Risk of bias | ||
| Bias | Authors' judgement | Support for judgement |
| Random sequence generation (selection bias) | Low risk | Comment: randomisation was balanced by site to avoid repeating the treatment order within the site. Randomisation lists were generated centrally and were held by an investigational pharmacist at each site. Authors do not describe the exact method of generating the list. |
| Allocation concealment (selection bias) | Unclear risk | Comment: no information on the role of the pharmacist. Clinicians, the patient, and the caregiver were blind to treatment assignment during cross‐over phase, but not during test‐dose week preceding the study. |
| Blinding of participants and personnel (performance bias) | Unclear risk | Comment: clinicians, the patient, and the caregiver were blind to treatment assignment during cross‐over phase, but not during test‐dose week preceding the study. No information on the success of blinding is reported. Participants had not had an adequate trial of MPH in past 2 years (exclusion criteria), but they had been exposed to the test dose. |
| Blinding of outcome assessment (detection bias) | Unclear risk | Comment: clinicians, the patient, and the caregiver were blind to treatment assignment during cross‐over phase, but not during test‐dose week preceding the study. No information on the success of blinding is reported. Participants had not had an adequate trial of MPH in past 2 years (exclusion criteria), but they had been exposed to the test dose. |
| Incomplete outcome data (attrition bias) | Unclear risk | Comment: Study dropouts and reasons for drop out are reported. Data for social communication outcomes are incomplete (only 33 out of total of 66 randomised children completed the trial for this outcome). |
| Selective reporting (reporting bias) | High risk | Comment: the main study publication (RUPP 2005) reports all mentioned outcome measures. The overall response outcome was only reported as a combined number, without results for the individual CGI‐I component of this composite outcome measure. The RUPP 2005 study also reports adverse events, but this is not mentioned as an outcome in the methods section of the paper. 2 additional publications (in 2007 and 2009) subsequently reported additional outcomes that were not mentioned in the original publication. Three secondary outcome measures were only mentioned and reported in the 2007 secondary analysis article. 1 outcome measure (social communication) was only mentioned and reported in the 2009 secondary analysis article on a subset of the original patient population. |
| Other bias | Unclear risk | Comment: study supported by funding from National Institutes of Mental Health (NIMH) and universities, USA. Several authors report affiliations with a number of pharmaceutical companies. |
ADHD: attention deficit hyperactivity disorder; ADI‐R: Autism Diagnostic Interview ‐ Revised; ASD: autism spectrum disorders; CARS: Childhood Autism Rating Scale; CGI: Clinical Global Impressions scale; CGI‐I: Clinical Global Impressions ‐ Improvement scale;DSM‐III‐R: Diagnostic and Statistical Manual of Mental Disorders, 3rd Edition, Revised;DSM‐IV: Diagnostic and Statistical Manual of Mental Disorders, Fourth Edition;ER: extended‐release; IQ: intelligence quotient; IR: immediate release; MPH: methylphenidate; PDD: pervasive developmental disorder; PDD‐NOS: pervasive developmental disorder ‐ not otherwise specified; RUPP: Research Units on Pediatric Psychopharmcology Autism Network; SD: standard deviation.
Characteristics of excluded studies [ordered by study ID]
Ir a:
| Study | Reason for exclusion |
| Not a RCT | |
| Not a RCT | |
| Participants did not meet criteria for ASD | |
| Not a RCT | |
| Not a RCT | |
| Not a RCT | |
| Not a RCT | |
| Not a RCT | |
| Participants did not meet criteria for ASD | |
| Participants did not meet criteria for ASD | |
| Not a RCT | |
| Participants did not meet age criterion for inclusion (too young) | |
| Not a RCT | |
| Not a RCT | |
| Not a RCT | |
| Not an original study | |
| Participants did not meet criteria for ASD | |
| Not a RCT | |
| Participants did not meet criteria for ASD | |
| Participants did not meet criteria for ASD | |
| Participants did not meet criteria for ASD |
ASD: autism spectrum disorder; RCT: randomised controlled trial.
Data and analyses
| Outcome or subgroup title | No. of studies | No. of participants | Statistical method | Effect size |
| 1 Primary outcome: ADHD symptoms ‐ inattention (same measurement instrument) Show forest plot | 2 | Mean Difference (Random, 95% CI) | ‐2.72 [‐5.37, ‐0.06] | |
| Analysis 1.1  Comparison 1 TEACHER rated: high dose versus placebo, Outcome 1 Primary outcome: ADHD symptoms ‐ inattention (same measurement instrument). | ||||
| 2 Primary outcome: ADHD symptoms ‐ hyperactivity (different measurement instrument) Show forest plot | 4 | Std. Mean Difference (Random, 95% CI) | ‐0.78 [‐1.13, ‐0.43] | |
| Analysis 1.2  Comparison 1 TEACHER rated: high dose versus placebo, Outcome 2 Primary outcome: ADHD symptoms ‐ hyperactivity (different measurement instrument). | ||||
| 3 Primary outcome: ASD symptoms Show forest plot | 4 | Std. Mean Difference (Random, 95% CI) | Subtotals only | |
| Analysis 1.3 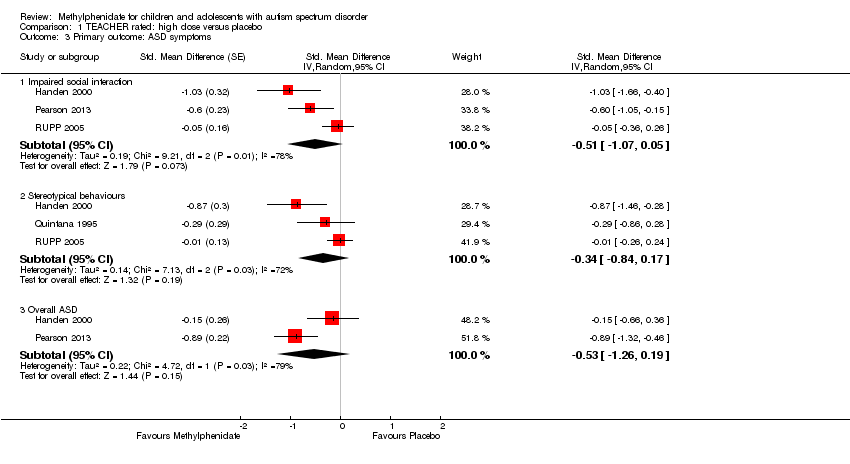 Comparison 1 TEACHER rated: high dose versus placebo, Outcome 3 Primary outcome: ASD symptoms. | ||||
| 3.1 Impaired social interaction | 3 | Std. Mean Difference (Random, 95% CI) | ‐0.51 [‐1.07, 0.05] | |
| 3.2 Stereotypical behaviours | 3 | Std. Mean Difference (Random, 95% CI) | ‐0.34 [‐0.84, 0.17] | |
| 3.3 Overall ASD | 2 | Std. Mean Difference (Random, 95% CI) | ‐0.53 [‐1.26, 0.19] | |
| 4 Secondary outcome: adverse events Show forest plot | 2 | Risk Ratio (M‐H, Random, 95% CI) | Subtotals only | |
| Analysis 1.4  Comparison 1 TEACHER rated: high dose versus placebo, Outcome 4 Secondary outcome: adverse events. | ||||
| 4.1 Gastrointestinal effects: abdominal discomfort | 2 | 69 | Risk Ratio (M‐H, Random, 95% CI) | 3.00 [0.13, 70.16] |
| 4.2 Gastrointestinal effects: reduced appetite | 2 | 69 | Risk Ratio (M‐H, Random, 95% CI) | 1.33 [0.43, 4.12] |
| 4.3 General physical adverse effect: dizziness | 2 | 69 | Risk Ratio (M‐H, Random, 95% CI) | 0.55 [0.06, 5.18] |
| 4.4 General physical adverse effect: drowsiness | 2 | 69 | Risk Ratio (M‐H, Random, 95% CI) | 2.00 [0.47, 8.55] |
| 4.5 General physical adverse effect: headache | 2 | 69 | Risk Ratio (M‐H, Random, 95% CI) | 3.00 [0.13, 70.16] |
| 4.6 Psychological effects: anxiety | 2 | 69 | Risk Ratio (M‐H, Random, 95% CI) | 1.02 [0.47, 2.18] |
| 4.7 Psychological effects: depressed mood | 2 | 69 | Risk Ratio (M‐H, Random, 95% CI) | 1.19 [0.37, 3.79] |
| 4.8 Psychological effects: irritability | 2 | 69 | Risk Ratio (M‐H, Random, 95% CI) | 0.81 [0.29, 2.27] |
| 4.9 Repetitive behaviours: repetitive movements or tics | 2 | 69 | Risk Ratio (M‐H, Random, 95% CI) | 0.57 [0.21, 1.57] |
| Outcome or subgroup title | No. of studies | No. of participants | Statistical method | Effect size |
| 1 Primary outcome: ADHD symptoms ‐ inattention (same measurement instrument) Show forest plot | 2 | Mean Difference (Random, 95% CI) | ‐2.55 [‐5.15, 0.06] | |
| Analysis 2.1 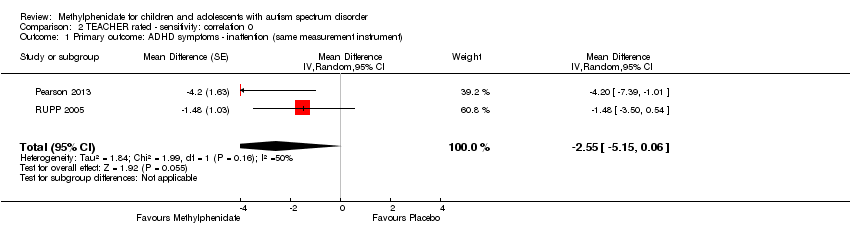 Comparison 2 TEACHER rated ‐ sensitivity: correlation 0, Outcome 1 Primary outcome: ADHD symptoms ‐ inattention (same measurement instrument). | ||||
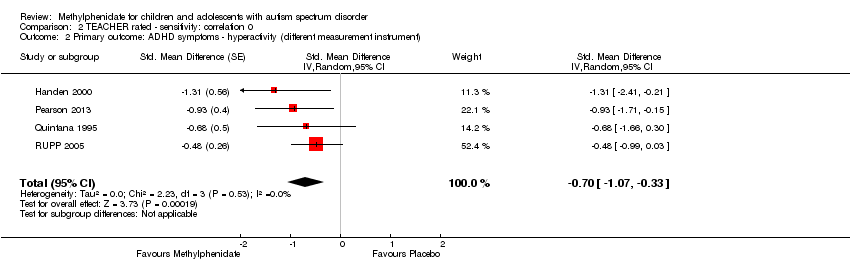
| 2 Primary outcome: ADHD symptoms ‐ hyperactivity (different measurement instrument) Show forest plot | 4 | Std. Mean Difference (Random, 95% CI) | ‐0.70 [‐1.07, ‐0.33] | |
| Analysis 2.2  Comparison 2 TEACHER rated ‐ sensitivity: correlation 0, Outcome 2 Primary outcome: ADHD symptoms ‐ hyperactivity (different measurement instrument). | ||||
| 3 Primary outcome: ASD symptoms Show forest plot | 4 | Std. Mean Difference (Random, 95% CI) | Subtotals only | |
| Analysis 2.3  Comparison 2 TEACHER rated ‐ sensitivity: correlation 0, Outcome 3 Primary outcome: ASD symptoms. | ||||
| 3.1 Impaired social interaction | 3 | Std. Mean Difference (Random, 95% CI) | ‐0.44 [‐0.99, 0.11] | |
| 3.2 Stereotypical behaviours | 3 | Std. Mean Difference (Random, 95% CI) | ‐0.24 [‐0.71, 0.23] | |
| 3.3 Overall ASD | 2 | Std. Mean Difference (Random, 95% CI) | ‐0.56 [‐1.28, 0.17] | |
| Outcome or subgroup title | No. of studies | No. of participants | Statistical method | Effect size |
| 1 Primary outcome: ADHD symptoms ‐ inattention (same measurement instrument) Show forest plot | 2 | Mean Difference (Random, 95% CI) | Subtotals only | |
| Analysis 3.1 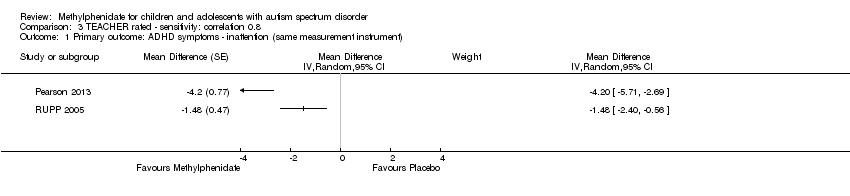 Comparison 3 TEACHER rated ‐ sensitivity: correlation 0.8, Outcome 1 Primary outcome: ADHD symptoms ‐ inattention (same measurement instrument). | ||||
| 2 Primary outcome: ADHD symptoms ‐ hyperactivity (different measurement instrument) Show forest plot | 4 | Std. Mean Difference (Random, 95% CI) | Subtotals only | |
| Analysis 3.2  Comparison 3 TEACHER rated ‐ sensitivity: correlation 0.8, Outcome 2 Primary outcome: ADHD symptoms ‐ hyperactivity (different measurement instrument). | ||||
| 3 Primary outcome: ASD symptoms Show forest plot | 4 | Std. Mean Difference (Random, 95% CI) | Subtotals only | |
| Analysis 3.3  Comparison 3 TEACHER rated ‐ sensitivity: correlation 0.8, Outcome 3 Primary outcome: ASD symptoms. | ||||
| 3.1 Impaired social interaction | 3 | Std. Mean Difference (Random, 95% CI) | ‐0.53 [‐1.09, 0.02] | |
| 3.2 Stereotypical behaviours | 3 | Std. Mean Difference (Random, 95% CI) | ‐0.37 [‐0.87, 0.14] | |
| 3.3 Overall ASD | 2 | Std. Mean Difference (Random, 95% CI) | ‐0.53 [‐1.25, 0.20] | |
| Outcome or subgroup title | No. of studies | No. of participants | Statistical method | Effect size |
| 1 Primary outcome: ADHD ‐ hyperactivity Show forest plot | 4 | Std. Mean Difference (Random, 95% CI) | Subtotals only | |
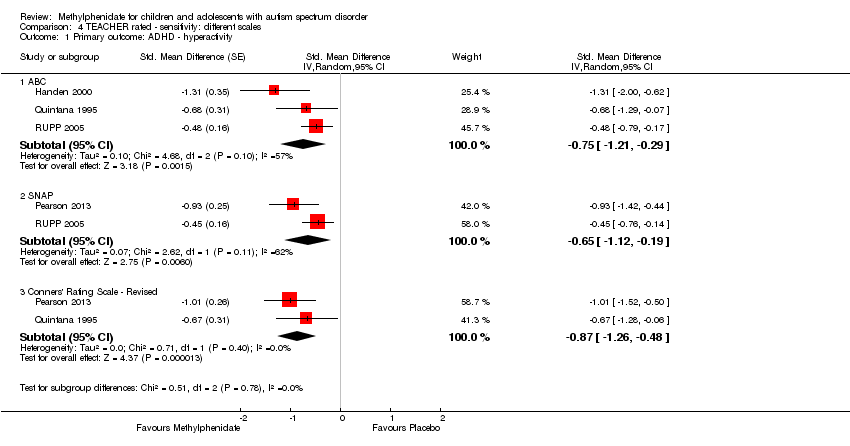
| Analysis 4.1  Comparison 4 TEACHER rated ‐ sensitivity: different scales, Outcome 1 Primary outcome: ADHD ‐ hyperactivity. | ||||
| 1.1 ABC | 3 | Std. Mean Difference (Random, 95% CI) | ‐0.75 [‐1.21, ‐0.29] | |
| 1.2 SNAP | 2 | Std. Mean Difference (Random, 95% CI) | ‐0.65 [‐1.12, ‐0.19] | |
| 1.3 Conners' Rating Scale ‐ Revised | 2 | Std. Mean Difference (Random, 95% CI) | ‐0.87 [‐1.26, ‐0.48] | |
| Outcome or subgroup title | No. of studies | No. of participants | Statistical method | Effect size |
| 1 Primary outcome: ADHD symptoms (same measurement instrument) Show forest plot | 2 | Mean Difference (Random, 95% CI) | Subtotals only | |
| Analysis 5.1  Comparison 5 PARENT rated: high dose versus placebo, Outcome 1 Primary outcome: ADHD symptoms (same measurement instrument). | ||||
| 1.1 Inattention | 2 | Mean Difference (Random, 95% CI) | ‐3.16 [‐6.89, 0.57] | |
| 1.2 Hyperactivity | 2 | Mean Difference (Random, 95% CI) | ‐6.61 [‐12.19, ‐1.03] | |
| 2 Primary outcome: ASD symptoms ‐ impaired social interaction Show forest plot | 2 | Std. Mean Difference (Random, 95% CI) | ‐0.21 [‐0.60, 0.18] | |
| Analysis 5.2 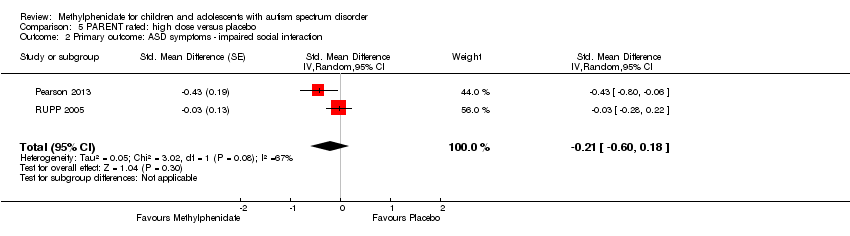 Comparison 5 PARENT rated: high dose versus placebo, Outcome 2 Primary outcome: ASD symptoms ‐ impaired social interaction. | ||||
| 3 Secondary outcome: adverse events Show forest plot | 2 | Risk Ratio (M‐H, Random, 95% CI) | Subtotals only | |
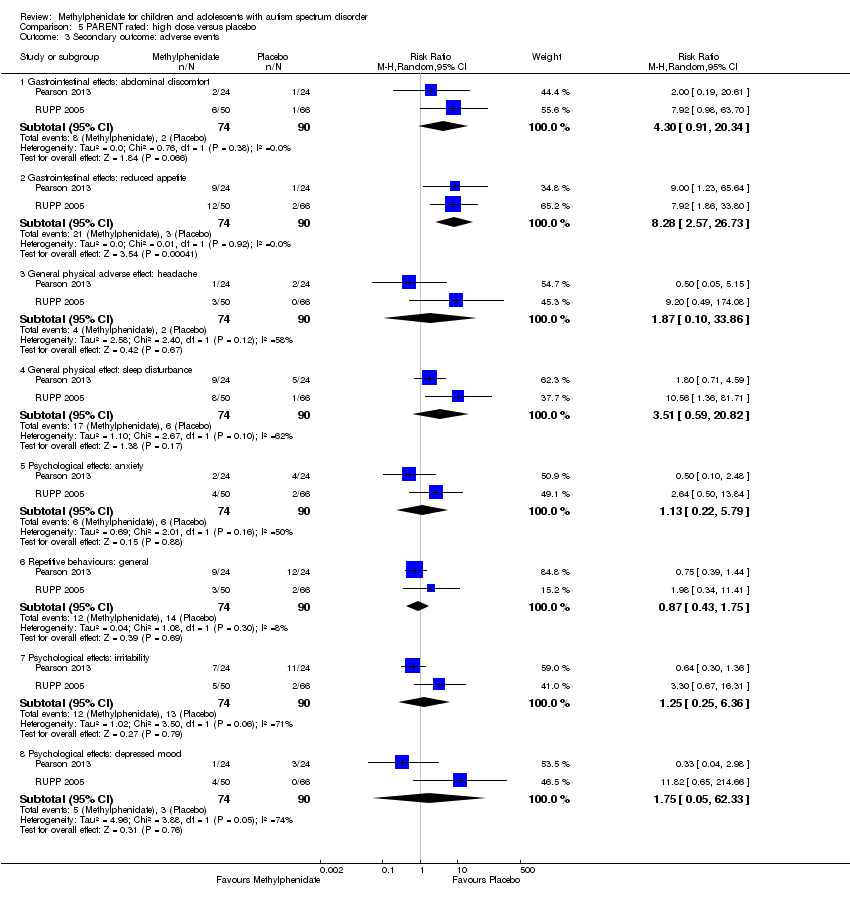
| Analysis 5.3  Comparison 5 PARENT rated: high dose versus placebo, Outcome 3 Secondary outcome: adverse events. | ||||
| 3.1 Gastrointestinal effects: abdominal discomfort | 2 | 164 | Risk Ratio (M‐H, Random, 95% CI) | 4.30 [0.91, 20.34] |
| 3.2 Gastrointestinal effects: reduced appetite | 2 | 164 | Risk Ratio (M‐H, Random, 95% CI) | 8.28 [2.57, 26.73] |
| 3.3 General physical adverse effect: headache | 2 | 164 | Risk Ratio (M‐H, Random, 95% CI) | 1.87 [0.10, 33.86] |
| 3.4 General physical effect: sleep disturbance | 2 | 164 | Risk Ratio (M‐H, Random, 95% CI) | 3.51 [0.59, 20.82] |
| 3.5 Psychological effects: anxiety | 2 | 164 | Risk Ratio (M‐H, Random, 95% CI) | 1.13 [0.22, 5.79] |
| 3.6 Repetitive behaviours: general | 2 | 164 | Risk Ratio (M‐H, Random, 95% CI) | 0.87 [0.43, 1.75] |
| 3.7 Psychological effects: irritability | 2 | 164 | Risk Ratio (M‐H, Random, 95% CI) | 1.25 [0.25, 6.36] |
| 3.8 Psychological effects: depressed mood | 2 | 164 | Risk Ratio (M‐H, Random, 95% CI) | 1.75 [0.05, 62.33] |
| Outcome or subgroup title | No. of studies | No. of participants | Statistical method | Effect size |
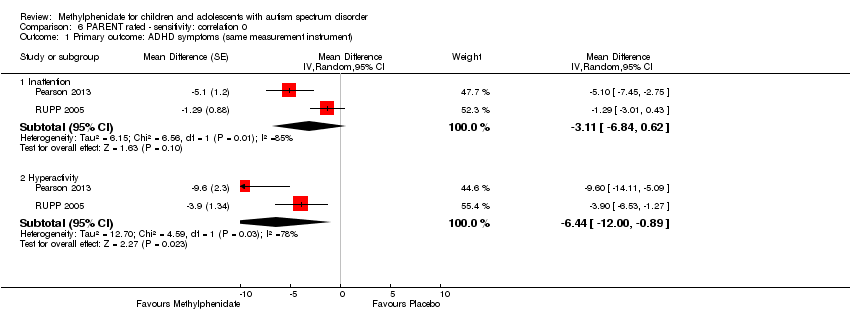
| 1 Primary outcome: ADHD symptoms (same measurement instrument) Show forest plot | 2 | Mean Difference (Random, 95% CI) | Subtotals only | |
| Analysis 6.1  Comparison 6 PARENT rated ‐ sensitivity: correlation 0, Outcome 1 Primary outcome: ADHD symptoms (same measurement instrument). | ||||
| 1.1 Inattention | 2 | Mean Difference (Random, 95% CI) | ‐3.11 [‐6.84, 0.62] | |
| 1.2 Hyperactivity | 2 | Mean Difference (Random, 95% CI) | ‐6.44 [‐10.00, ‐0.89] | |
| 2 Primary outcome: ASD symptoms ‐ Impaired social interaction Show forest plot | 2 | Std. Mean Difference (Random, 95% CI) | Subtotals only | |
| Analysis 6.2 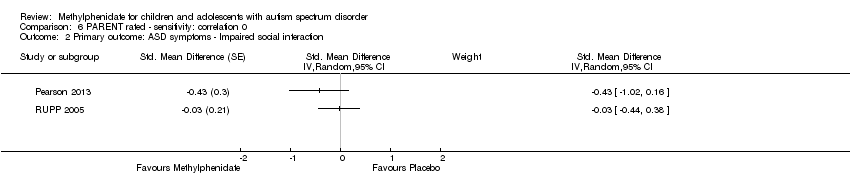 Comparison 6 PARENT rated ‐ sensitivity: correlation 0, Outcome 2 Primary outcome: ASD symptoms ‐ Impaired social interaction. | ||||
| Outcome or subgroup title | No. of studies | No. of participants | Statistical method | Effect size |
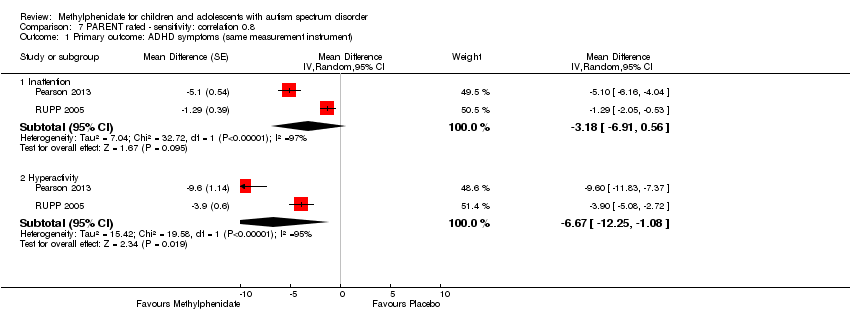
| 1 Primary outcome: ADHD symptoms (same measurement instrument) Show forest plot | 2 | Mean Difference (Random, 95% CI) | Subtotals only | |
| Analysis 7.1  Comparison 7 PARENT rated ‐ sensitivity: correlation 0.8, Outcome 1 Primary outcome: ADHD symptoms (same measurement instrument). | ||||
| 1.1 Inattention | 2 | Mean Difference (Random, 95% CI) | ‐3.18 [‐6.91, 0.56] | |
| 1.2 Hyperactivity | 2 | Mean Difference (Random, 95% CI) | ‐6.67 [‐12.25, ‐1.08] | |
| 2 Primary outcome: ASD symptoms ‐ Impaired social interaction Show forest plot | 2 | Std. Mean Difference (Random, 95% CI) | Subtotals only | |
| Analysis 7.2  Comparison 7 PARENT rated ‐ sensitivity: correlation 0.8, Outcome 2 Primary outcome: ASD symptoms ‐ Impaired social interaction. | ||||
| Outcome or subgroup title | No. of studies | No. of participants | Statistical method | Effect size |
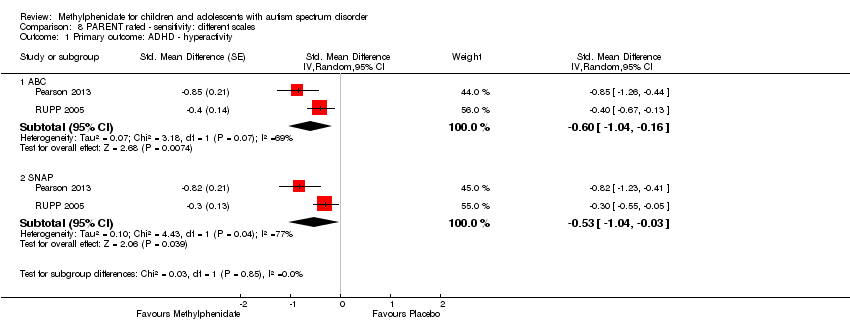
| 1 Primary outcome: ADHD ‐ hyperactivity Show forest plot | 2 | Std. Mean Difference (Random, 95% CI) | Subtotals only | |
| Analysis 8.1  Comparison 8 PARENT rated ‐ sensitivity: different scales, Outcome 1 Primary outcome: ADHD ‐ hyperactivity. | ||||
| 1.1 ABC | 2 | Std. Mean Difference (Random, 95% CI) | ‐0.60 [‐1.04, ‐0.16] | |
| 1.2 SNAP | 2 | Std. Mean Difference (Random, 95% CI) | ‐0.53 [‐1.04, ‐0.03] | |
| Outcome or subgroup title | No. of studies | No. of participants | Statistical method | Effect size |
| 1 Primary outcome: ADHD ‐ inattention Show forest plot | 2 | Std. Mean Difference (Random, 95% CI) | Subtotals only | |
| Analysis 9.1  Comparison 9 TEACHER rated ‐ subgroup: doses, Outcome 1 Primary outcome: ADHD ‐ inattention. | ||||
| 1.1 Low dose | 2 | Std. Mean Difference (Random, 95% CI) | ‐0.28 [‐0.61, 0.05] | |
| 1.2 Medium dose | 2 | Std. Mean Difference (Random, 95% CI) | ‐0.46 [‐0.89, ‐0.04] | |
| 1.3 High dose | 2 | Std. Mean Difference (Random, 95% CI) | ‐0.38 [‐0.75, ‐0.02] | |
| 2 Primary outcome: ADHD ‐ hyperactivity Show forest plot | 4 | Std. Mean Difference (Random, 95% CI) | Subtotals only | |
| Analysis 9.2 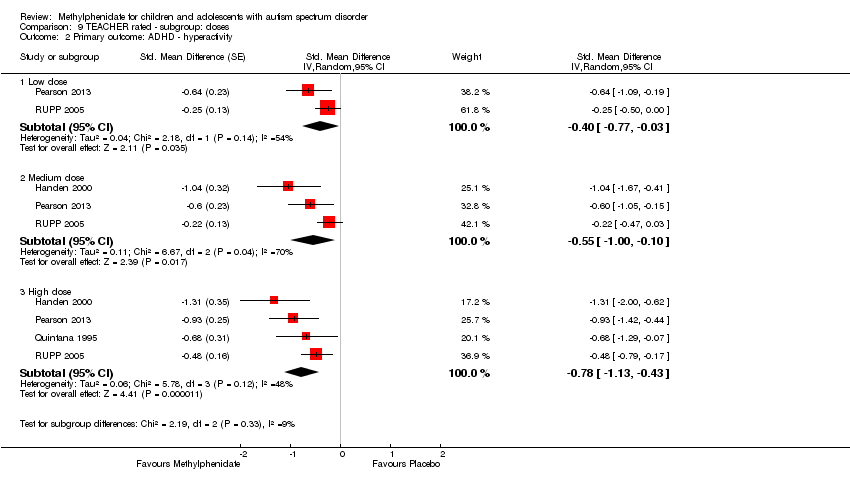 Comparison 9 TEACHER rated ‐ subgroup: doses, Outcome 2 Primary outcome: ADHD ‐ hyperactivity. | ||||
| 2.1 Low dose | 2 | Std. Mean Difference (Random, 95% CI) | ‐0.40 [‐0.77, ‐0.03] | |
| 2.2 Medium dose | 3 | Std. Mean Difference (Random, 95% CI) | ‐0.55 [‐1.00, ‐0.10] | |
| 2.3 High dose | 4 | Std. Mean Difference (Random, 95% CI) | ‐0.78 [‐1.13, ‐0.43] | |
| 3 Primary outcome: ASD ‐ impaired social interaction Show forest plot | 3 | Std. Mean Difference (Random, 95% CI) | Subtotals only | |
| Analysis 9.3 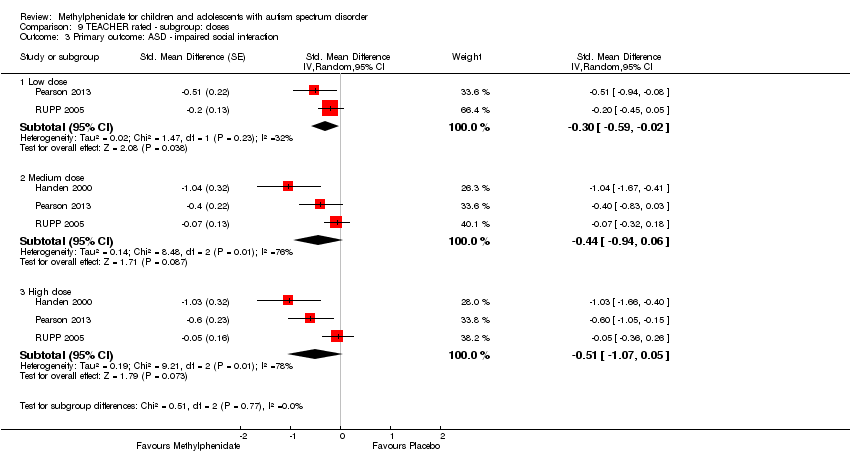 Comparison 9 TEACHER rated ‐ subgroup: doses, Outcome 3 Primary outcome: ASD ‐ impaired social interaction. | ||||
| 3.1 Low dose | 2 | Std. Mean Difference (Random, 95% CI) | ‐0.30 [‐0.59, ‐0.02] | |
| 3.2 Medium dose | 3 | Std. Mean Difference (Random, 95% CI) | ‐0.44 [‐0.94, 0.06] | |
| 3.3 High dose | 3 | Std. Mean Difference (Random, 95% CI) | ‐0.51 [‐1.07, 0.05] | |
| 4 Primary outcome: ASD ‐ stereotypical behaviours Show forest plot | 3 | Std. Mean Difference (Random, 95% CI) | Subtotals only | |
| Analysis 9.4 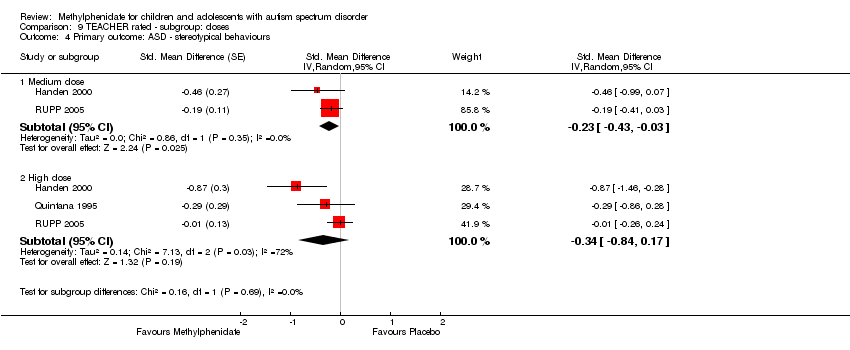 Comparison 9 TEACHER rated ‐ subgroup: doses, Outcome 4 Primary outcome: ASD ‐ stereotypical behaviours. | ||||
| 4.1 Medium dose | 2 | Std. Mean Difference (Random, 95% CI) | ‐0.23 [‐0.43, ‐0.03] | |
| 4.2 High dose | 3 | Std. Mean Difference (Random, 95% CI) | ‐0.34 [‐0.84, 0.17] | |
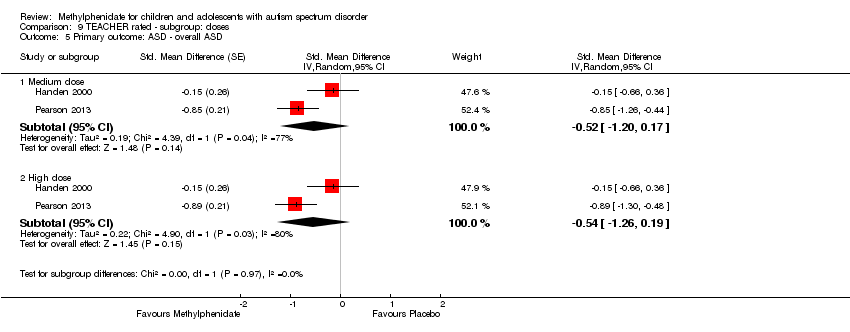
| 5 Primary outcome: ASD ‐ overall ASD Show forest plot | 2 | Std. Mean Difference (Random, 95% CI) | Subtotals only | |
| Analysis 9.5  Comparison 9 TEACHER rated ‐ subgroup: doses, Outcome 5 Primary outcome: ASD ‐ overall ASD. | ||||
| 5.1 Medium dose | 2 | Std. Mean Difference (Random, 95% CI) | ‐0.52 [‐1.20, 0.17] | |
| 5.2 High dose | 2 | Std. Mean Difference (Random, 95% CI) | ‐0.54 [‐1.26, 0.19] | |
| 6 Secondary outcome: adverse events ‐ abdominal discomfort Show forest plot | 2 | Risk Ratio (M‐H, Random, 95% CI) | Subtotals only | |
| Analysis 9.6  Comparison 9 TEACHER rated ‐ subgroup: doses, Outcome 6 Secondary outcome: adverse events ‐ abdominal discomfort. | ||||
| 6.1 Medium dose | 2 | 69 | Risk Ratio (M‐H, Random, 95% CI) | 0.0 [0.0, 0.0] |
| 6.2 High dose | 2 | 69 | Risk Ratio (M‐H, Random, 95% CI) | 3.00 [0.13, 70.16] |
| 7 Secondary outcome: adverse events ‐ reduced appetite Show forest plot | 2 | Risk Ratio (M‐H, Random, 95% CI) | Subtotals only | |
| Analysis 9.7  Comparison 9 TEACHER rated ‐ subgroup: doses, Outcome 7 Secondary outcome: adverse events ‐ reduced appetite. | ||||
| 7.1 Medium dose | 2 | 69 | Risk Ratio (M‐H, Random, 95% CI) | 1.29 [0.75, 2.20] |
| 7.2 High dose | 2 | 69 | Risk Ratio (M‐H, Random, 95% CI) | 1.33 [0.43, 4.12] |
| 8 Secondary outcome: adverse events ‐ dizziness Show forest plot | 2 | Risk Ratio (M‐H, Random, 95% CI) | Subtotals only | |
| Analysis 9.8  Comparison 9 TEACHER rated ‐ subgroup: doses, Outcome 8 Secondary outcome: adverse events ‐ dizziness. | ||||
| 8.1 Medium dose | 2 | 69 | Risk Ratio (M‐H, Random, 95% CI) | 0.22 [0.01, 4.06] |
| 8.2 High dose | 2 | 69 | Risk Ratio (M‐H, Random, 95% CI) | 0.55 [0.06, 5.18] |
| 9 Secondary outcome: adverse events ‐ drowsiness Show forest plot | 2 | Risk Ratio (M‐H, Random, 95% CI) | Subtotals only | |
| Analysis 9.9  Comparison 9 TEACHER rated ‐ subgroup: doses, Outcome 9 Secondary outcome: adverse events ‐ drowsiness. | ||||
| 9.1 Medium dose | 2 | 69 | Risk Ratio (M‐H, Random, 95% CI) | 1.27 [0.05, 32.89] |
| 9.2 High dose | 2 | 69 | Risk Ratio (M‐H, Random, 95% CI) | 2.00 [0.47, 8.55] |
| 10 Secondary outcome: adverse events ‐ headache Show forest plot | 2 | Risk Ratio (M‐H, Random, 95% CI) | Subtotals only | |
| Analysis 9.10 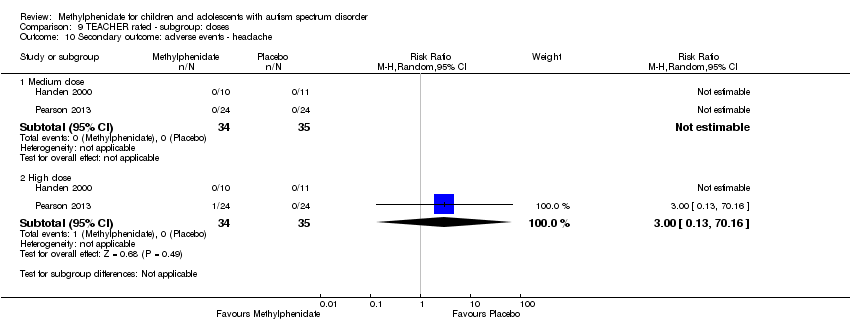 Comparison 9 TEACHER rated ‐ subgroup: doses, Outcome 10 Secondary outcome: adverse events ‐ headache. | ||||
| 10.1 Medium dose | 2 | 69 | Risk Ratio (M‐H, Random, 95% CI) | 0.0 [0.0, 0.0] |
| 10.2 High dose | 2 | 69 | Risk Ratio (M‐H, Random, 95% CI) | 3.00 [0.13, 70.16] |
| 11 Secondary outcome: adverse events ‐ anxiety Show forest plot | 2 | Risk Ratio (M‐H, Random, 95% CI) | Subtotals only | |
| Analysis 9.11  Comparison 9 TEACHER rated ‐ subgroup: doses, Outcome 11 Secondary outcome: adverse events ‐ anxiety. | ||||
| 11.1 Medium dose | 2 | 69 | Risk Ratio (M‐H, Random, 95% CI) | 0.68 [0.10, 4.46] |
| 11.2 High dose | 2 | 69 | Risk Ratio (M‐H, Random, 95% CI) | 1.02 [0.47, 2.18] |
| 12 Secondary outcome: adverse events ‐ depressed mood Show forest plot | 2 | Risk Ratio (M‐H, Random, 95% CI) | Subtotals only | |
| Analysis 9.12  Comparison 9 TEACHER rated ‐ subgroup: doses, Outcome 12 Secondary outcome: adverse events ‐ depressed mood. | ||||
| 12.1 Medium dose | 2 | 69 | Risk Ratio (M‐H, Random, 95% CI) | 1.01 [0.46, 2.26] |
| 12.2 High dose | 2 | 69 | Risk Ratio (M‐H, Random, 95% CI) | 1.19 [0.37, 3.79] |
| 13 Secondary outcome: adverse events ‐ irritability Show forest plot | 2 | Risk Ratio (M‐H, Random, 95% CI) | Subtotals only | |
| Analysis 9.13  Comparison 9 TEACHER rated ‐ subgroup: doses, Outcome 13 Secondary outcome: adverse events ‐ irritability. | ||||
| 13.1 Medium dose | 2 | 69 | Risk Ratio (M‐H, Random, 95% CI) | 0.96 [0.54, 1.70] |
| 13.2 High dose | 2 | 69 | Risk Ratio (M‐H, Random, 95% CI) | 0.81 [0.29, 2.27] |
| 14 Secondary outcome: adverse events ‐ repetitive movements Show forest plot | 2 | Risk Ratio (M‐H, Random, 95% CI) | Subtotals only | |
| Analysis 9.14  Comparison 9 TEACHER rated ‐ subgroup: doses, Outcome 14 Secondary outcome: adverse events ‐ repetitive movements. | ||||
| 14.1 Medium dose | 2 | 69 | Risk Ratio (M‐H, Random, 95% CI) | 0.74 [0.30, 1.85] |
| 14.2 High dose | 2 | 69 | Risk Ratio (M‐H, Random, 95% CI) | 0.57 [0.21, 1.57] |
| Outcome or subgroup title | No. of studies | No. of participants | Statistical method | Effect size |
| 1 Primary outcome: ADHD ‐ inattention Show forest plot | 2 | Std. Mean Difference (Random, 95% CI) | Subtotals only | |
| Analysis 10.1  Comparison 10 PARENT rated ‐ subgroup: doses, Outcome 1 Primary outcome: ADHD ‐ inattention. | ||||
| 1.1 Low dose | 2 | Std. Mean Difference (Random, 95% CI) | ‐0.27 [‐0.58, 0.03] | |
| 1.2 Medium dose | 2 | Std. Mean Difference (Random, 95% CI) | ‐0.49 [‐0.85, ‐0.13] | |
| 1.3 High dose | 2 | Std. Mean Difference (Random, 95% CI) | ‐0.51 [‐1.15, 0.14] | |
| 2 Primary outcome: ADHD ‐ hyperactivity Show forest plot | 2 | Std. Mean Difference (Random, 95% CI) | Subtotals only | |
| Analysis 10.2  Comparison 10 PARENT rated ‐ subgroup: doses, Outcome 2 Primary outcome: ADHD ‐ hyperactivity. | ||||
| 2.1 Low dose | 2 | Std. Mean Difference (Random, 95% CI) | ‐0.35 [‐0.55, ‐0.14] | |
| 2.2 Medium dose | 2 | Std. Mean Difference (Random, 95% CI) | ‐0.67 [‐1.01, ‐0.33] | |
| 2.3 High dose | 2 | Std. Mean Difference (Random, 95% CI) | ‐0.60 [‐1.04, ‐0.16] | |
| 3 Primary outcome: ASD ‐ impaired social interaction Show forest plot | 2 | Std. Mean Difference (Random, 95% CI) | Subtotals only | |
| Analysis 10.3 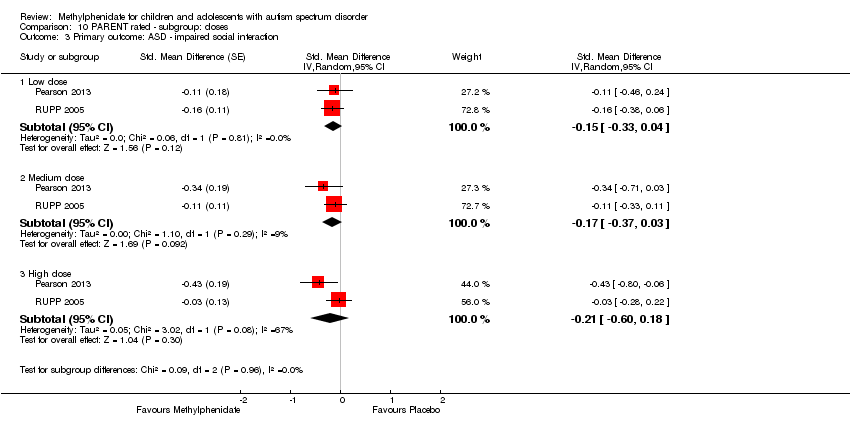 Comparison 10 PARENT rated ‐ subgroup: doses, Outcome 3 Primary outcome: ASD ‐ impaired social interaction. | ||||
| 3.1 Low dose | 2 | Std. Mean Difference (Random, 95% CI) | ‐0.15 [‐0.33, 0.04] | |
| 3.2 Medium dose | 2 | Std. Mean Difference (Random, 95% CI) | ‐0.17 [‐0.37, 0.03] | |
| 3.3 High dose | 2 | Std. Mean Difference (Random, 95% CI) | ‐0.21 [‐0.60, 0.18] | |
| 4 Secondary outcome: adverse events ‐ abdominal discomfort Show forest plot | 2 | Risk Ratio (M‐H, Random, 95% CI) | Subtotals only | |
| Analysis 10.4  Comparison 10 PARENT rated ‐ subgroup: doses, Outcome 4 Secondary outcome: adverse events ‐ abdominal discomfort. | ||||
| 4.1 Low dose | 2 | 164 | Risk Ratio (M‐H, Random, 95% CI) | 1.73 [0.29, 10.34] |
| 4.2 Medium dose | 2 | 164 | Risk Ratio (M‐H, Random, 95% CI) | 4.51 [0.98, 20.67] |
| 4.3 High dose | 2 | 164 | Risk Ratio (M‐H, Random, 95% CI) | 4.30 [0.91, 20.34] |
| 5 Secondary outcome: adverse events ‐ reduced appetite Show forest plot | 2 | Risk Ratio (M‐H, Random, 95% CI) | Subtotals only | |
| Analysis 10.5  Comparison 10 PARENT rated ‐ subgroup: doses, Outcome 5 Secondary outcome: adverse events ‐ reduced appetite. | ||||
| 5.1 Low dose | 2 | 164 | Risk Ratio (M‐H, Random, 95% CI) | 3.41 [0.91, 12.78] |
| 5.2 Medium dose | 2 | 164 | Risk Ratio (M‐H, Random, 95% CI) | 10.00 [3.14, 31.82] |
| 5.3 High dose | 2 | 164 | Risk Ratio (M‐H, Random, 95% CI) | 8.28 [2.57, 26.73] |
| 6 Secondary outcome: adverse events ‐ headache Show forest plot | 2 | Risk Ratio (M‐H, Random, 95% CI) | Subtotals only | |
| Analysis 10.6  Comparison 10 PARENT rated ‐ subgroup: doses, Outcome 6 Secondary outcome: adverse events ‐ headache. | ||||
| 6.1 Low dose | 2 | 164 | Risk Ratio (M‐H, Random, 95% CI) | 1.77 [0.31, 9.94] |
| 6.2 Medium dose | 2 | 164 | Risk Ratio (M‐H, Random, 95% CI) | 2.29 [0.55, 9.58] |
| 6.3 High dose | 2 | 164 | Risk Ratio (M‐H, Random, 95% CI) | 1.87 [0.10, 33.86] |
| 7 Secondary outcome: adverse events ‐ anxiety Show forest plot | 2 | Risk Ratio (M‐H, Random, 95% CI) | Subtotals only | |
| Analysis 10.7 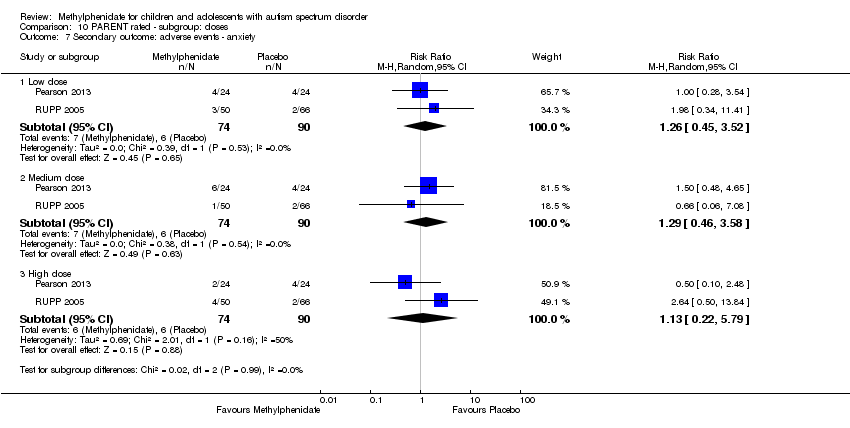 Comparison 10 PARENT rated ‐ subgroup: doses, Outcome 7 Secondary outcome: adverse events ‐ anxiety. | ||||
| 7.1 Low dose | 2 | 164 | Risk Ratio (M‐H, Random, 95% CI) | 1.26 [0.45, 3.52] |
| 7.2 Medium dose | 2 | 164 | Risk Ratio (M‐H, Random, 95% CI) | 1.29 [0.46, 3.58] |
| 7.3 High dose | 2 | 164 | Risk Ratio (M‐H, Random, 95% CI) | 1.13 [0.22, 5.79] |
| 8 Secondary outcome: adverse events ‐ depressed mood Show forest plot | 2 | Risk Ratio (M‐H, Random, 95% CI) | Subtotals only | |
| Analysis 10.8 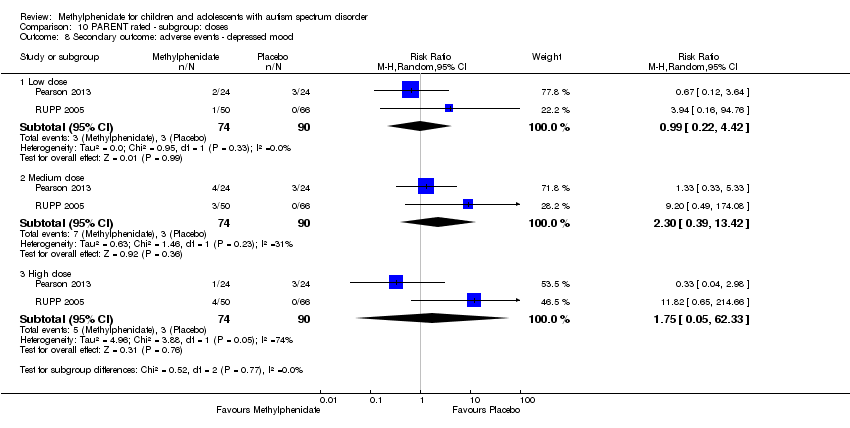 Comparison 10 PARENT rated ‐ subgroup: doses, Outcome 8 Secondary outcome: adverse events ‐ depressed mood. | ||||
| 8.1 Low dose | 2 | 164 | Risk Ratio (M‐H, Random, 95% CI) | 0.99 [0.22, 4.42] |
| 8.2 Medium dose | 2 | 164 | Risk Ratio (M‐H, Random, 95% CI) | 2.30 [0.39, 13.42] |
| 8.3 High dose | 2 | 164 | Risk Ratio (M‐H, Random, 95% CI) | 1.75 [0.05, 62.33] |
| 9 Secondary outcome: adverse events ‐ irritability Show forest plot | 2 | Risk Ratio (M‐H, Random, 95% CI) | Subtotals only | |
| Analysis 10.9  Comparison 10 PARENT rated ‐ subgroup: doses, Outcome 9 Secondary outcome: adverse events ‐ irritability. | ||||
| 9.1 Low dose | 2 | 164 | Risk Ratio (M‐H, Random, 95% CI) | 1.31 [0.30, 5.83] |
| 9.2 Medium dose | 2 | 164 | Risk Ratio (M‐H, Random, 95% CI) | 1.77 [0.23, 13.47] |
| 9.3 High dose | 2 | 164 | Risk Ratio (M‐H, Random, 95% CI) | 1.25 [0.25, 6.36] |
| 10 Secondary outcome: adverse events ‐ repetitive behaviours Show forest plot | 2 | Risk Ratio (M‐H, Random, 95% CI) | Subtotals only | |
| Analysis 10.10  Comparison 10 PARENT rated ‐ subgroup: doses, Outcome 10 Secondary outcome: adverse events ‐ repetitive behaviours. | ||||
| 10.1 Low dose | 2 | 164 | Risk Ratio (M‐H, Random, 95% CI) | 0.95 [0.54, 1.66] |
| 10.2 Medium dose | 2 | 164 | Risk Ratio (M‐H, Random, 95% CI) | 1.20 [0.55, 2.62] |
| 10.3 High dose | 2 | 164 | Risk Ratio (M‐H, Random, 95% CI) | 0.87 [0.43, 1.75] |
| 11 Secondary outcome: adverse events ‐ sleep disturbance Show forest plot | 2 | Risk Ratio (M‐H, Random, 95% CI) | Subtotals only | |
| Analysis 10.11  Comparison 10 PARENT rated ‐ subgroup: doses, Outcome 11 Secondary outcome: adverse events ‐ sleep disturbance. | ||||
| 11.1 Low dose | 2 | 164 | Risk Ratio (M‐H, Random, 95% CI) | 2.94 [0.44, 19.64] |
| 11.2 Medium dose | 2 | 164 | Risk Ratio (M‐H, Random, 95% CI) | 5.10 [0.71, 36.68] |
| 11.3 High dose | 2 | 164 | Risk Ratio (M‐H, Random, 95% CI) | 3.51 [0.59, 20.82] |

Study flow diagram.

Risk of bias graph: review authors' judgements about each risk of bias item presented as percentages across all included studies.
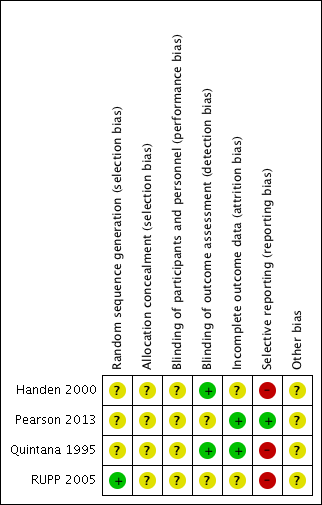
Risk of bias summary: review authors' judgements about each risk of bias item for each included study.

Comparison 1 TEACHER rated: high dose versus placebo, Outcome 1 Primary outcome: ADHD symptoms ‐ inattention (same measurement instrument).

Comparison 1 TEACHER rated: high dose versus placebo, Outcome 2 Primary outcome: ADHD symptoms ‐ hyperactivity (different measurement instrument).

Comparison 1 TEACHER rated: high dose versus placebo, Outcome 3 Primary outcome: ASD symptoms.

Comparison 1 TEACHER rated: high dose versus placebo, Outcome 4 Secondary outcome: adverse events.

Comparison 2 TEACHER rated ‐ sensitivity: correlation 0, Outcome 1 Primary outcome: ADHD symptoms ‐ inattention (same measurement instrument).
Comparison 2 TEACHER rated ‐ sensitivity: correlation 0, Outcome 2 Primary outcome: ADHD symptoms ‐ hyperactivity (different measurement instrument).

Comparison 2 TEACHER rated ‐ sensitivity: correlation 0, Outcome 3 Primary outcome: ASD symptoms.

Comparison 3 TEACHER rated ‐ sensitivity: correlation 0.8, Outcome 1 Primary outcome: ADHD symptoms ‐ inattention (same measurement instrument).

Comparison 3 TEACHER rated ‐ sensitivity: correlation 0.8, Outcome 2 Primary outcome: ADHD symptoms ‐ hyperactivity (different measurement instrument).

Comparison 3 TEACHER rated ‐ sensitivity: correlation 0.8, Outcome 3 Primary outcome: ASD symptoms.
Comparison 4 TEACHER rated ‐ sensitivity: different scales, Outcome 1 Primary outcome: ADHD ‐ hyperactivity.

Comparison 5 PARENT rated: high dose versus placebo, Outcome 1 Primary outcome: ADHD symptoms (same measurement instrument).

Comparison 5 PARENT rated: high dose versus placebo, Outcome 2 Primary outcome: ASD symptoms ‐ impaired social interaction.
Comparison 5 PARENT rated: high dose versus placebo, Outcome 3 Secondary outcome: adverse events.
Comparison 6 PARENT rated ‐ sensitivity: correlation 0, Outcome 1 Primary outcome: ADHD symptoms (same measurement instrument).

Comparison 6 PARENT rated ‐ sensitivity: correlation 0, Outcome 2 Primary outcome: ASD symptoms ‐ Impaired social interaction.
Comparison 7 PARENT rated ‐ sensitivity: correlation 0.8, Outcome 1 Primary outcome: ADHD symptoms (same measurement instrument).

Comparison 7 PARENT rated ‐ sensitivity: correlation 0.8, Outcome 2 Primary outcome: ASD symptoms ‐ Impaired social interaction.
Comparison 8 PARENT rated ‐ sensitivity: different scales, Outcome 1 Primary outcome: ADHD ‐ hyperactivity.

Comparison 9 TEACHER rated ‐ subgroup: doses, Outcome 1 Primary outcome: ADHD ‐ inattention.

Comparison 9 TEACHER rated ‐ subgroup: doses, Outcome 2 Primary outcome: ADHD ‐ hyperactivity.

Comparison 9 TEACHER rated ‐ subgroup: doses, Outcome 3 Primary outcome: ASD ‐ impaired social interaction.

Comparison 9 TEACHER rated ‐ subgroup: doses, Outcome 4 Primary outcome: ASD ‐ stereotypical behaviours.
Comparison 9 TEACHER rated ‐ subgroup: doses, Outcome 5 Primary outcome: ASD ‐ overall ASD.
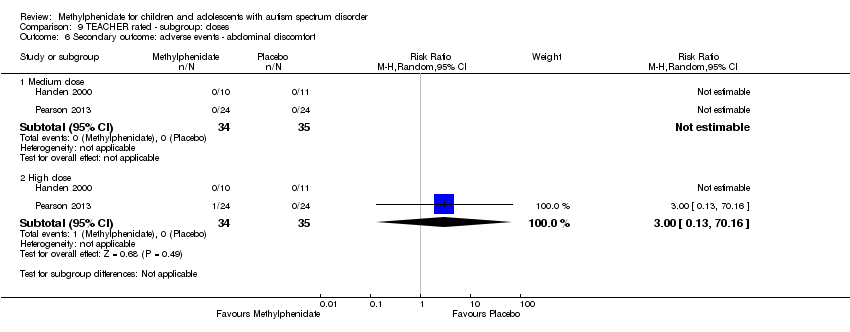
Comparison 9 TEACHER rated ‐ subgroup: doses, Outcome 6 Secondary outcome: adverse events ‐ abdominal discomfort.

Comparison 9 TEACHER rated ‐ subgroup: doses, Outcome 7 Secondary outcome: adverse events ‐ reduced appetite.
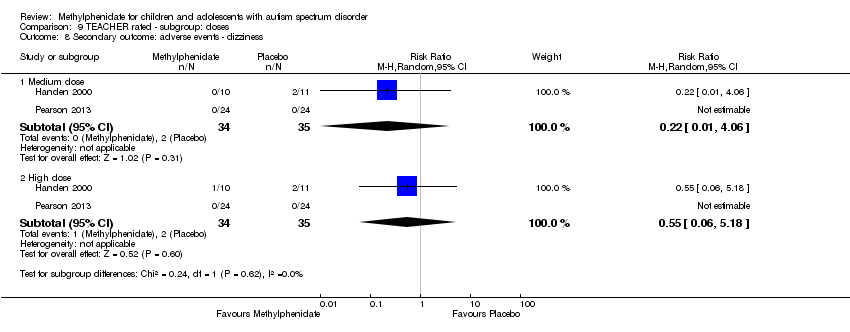
Comparison 9 TEACHER rated ‐ subgroup: doses, Outcome 8 Secondary outcome: adverse events ‐ dizziness.
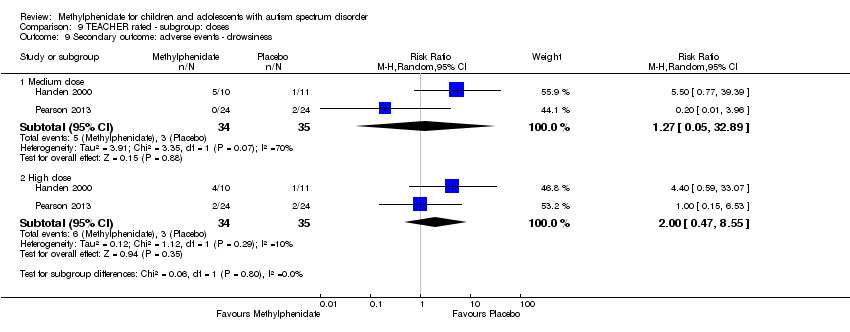
Comparison 9 TEACHER rated ‐ subgroup: doses, Outcome 9 Secondary outcome: adverse events ‐ drowsiness.

Comparison 9 TEACHER rated ‐ subgroup: doses, Outcome 10 Secondary outcome: adverse events ‐ headache.
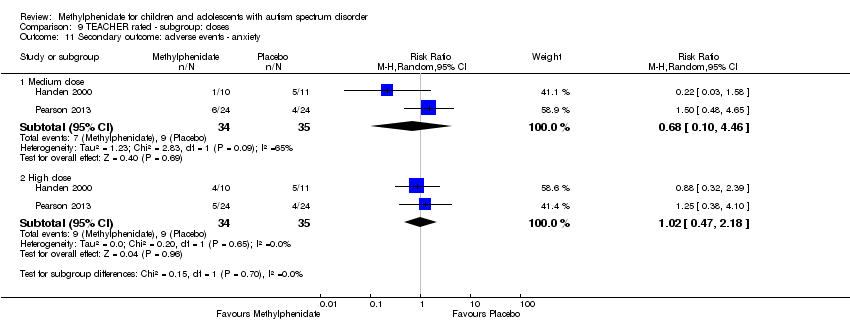
Comparison 9 TEACHER rated ‐ subgroup: doses, Outcome 11 Secondary outcome: adverse events ‐ anxiety.

Comparison 9 TEACHER rated ‐ subgroup: doses, Outcome 12 Secondary outcome: adverse events ‐ depressed mood.
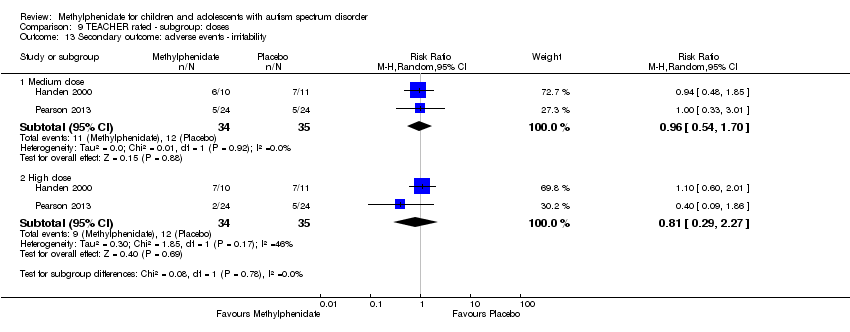
Comparison 9 TEACHER rated ‐ subgroup: doses, Outcome 13 Secondary outcome: adverse events ‐ irritability.
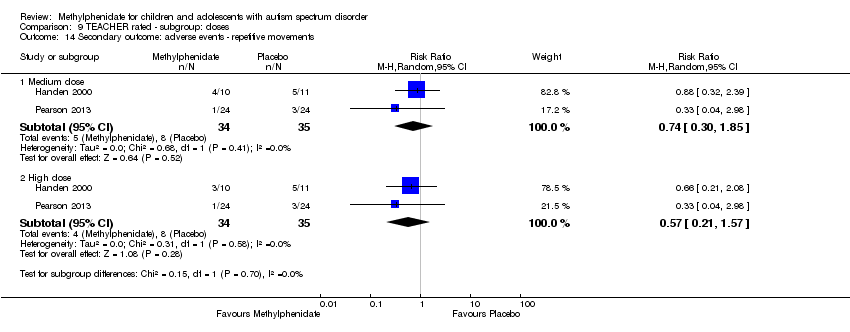
Comparison 9 TEACHER rated ‐ subgroup: doses, Outcome 14 Secondary outcome: adverse events ‐ repetitive movements.
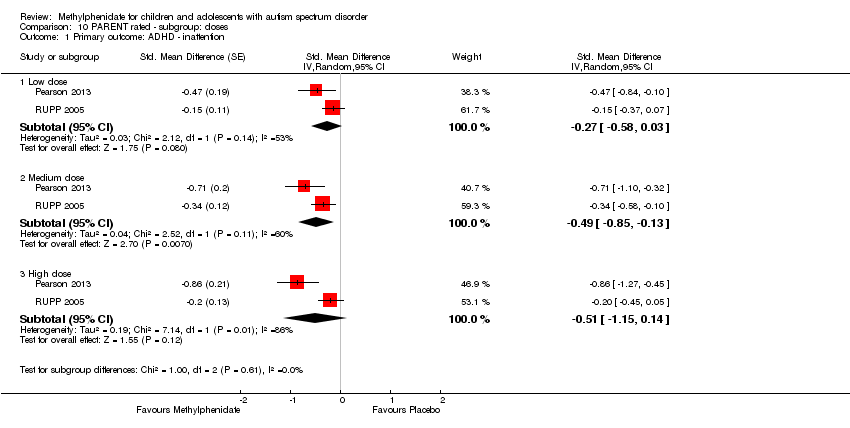
Comparison 10 PARENT rated ‐ subgroup: doses, Outcome 1 Primary outcome: ADHD ‐ inattention.
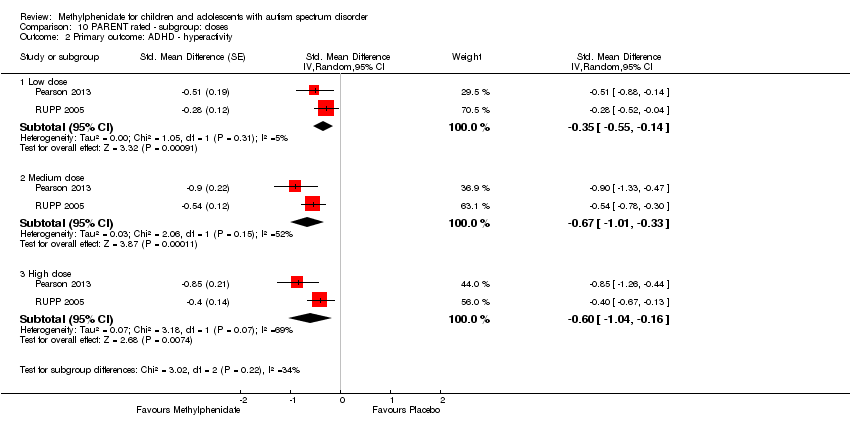
Comparison 10 PARENT rated ‐ subgroup: doses, Outcome 2 Primary outcome: ADHD ‐ hyperactivity.

Comparison 10 PARENT rated ‐ subgroup: doses, Outcome 3 Primary outcome: ASD ‐ impaired social interaction.
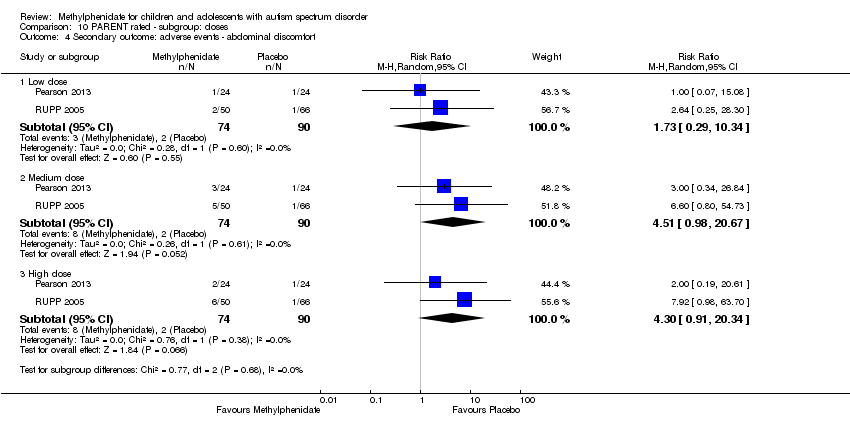
Comparison 10 PARENT rated ‐ subgroup: doses, Outcome 4 Secondary outcome: adverse events ‐ abdominal discomfort.

Comparison 10 PARENT rated ‐ subgroup: doses, Outcome 5 Secondary outcome: adverse events ‐ reduced appetite.
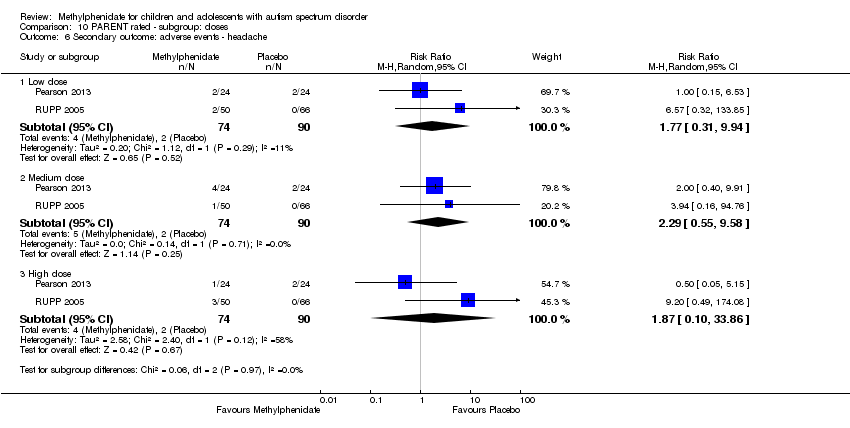
Comparison 10 PARENT rated ‐ subgroup: doses, Outcome 6 Secondary outcome: adverse events ‐ headache.

Comparison 10 PARENT rated ‐ subgroup: doses, Outcome 7 Secondary outcome: adverse events ‐ anxiety.

Comparison 10 PARENT rated ‐ subgroup: doses, Outcome 8 Secondary outcome: adverse events ‐ depressed mood.

Comparison 10 PARENT rated ‐ subgroup: doses, Outcome 9 Secondary outcome: adverse events ‐ irritability.
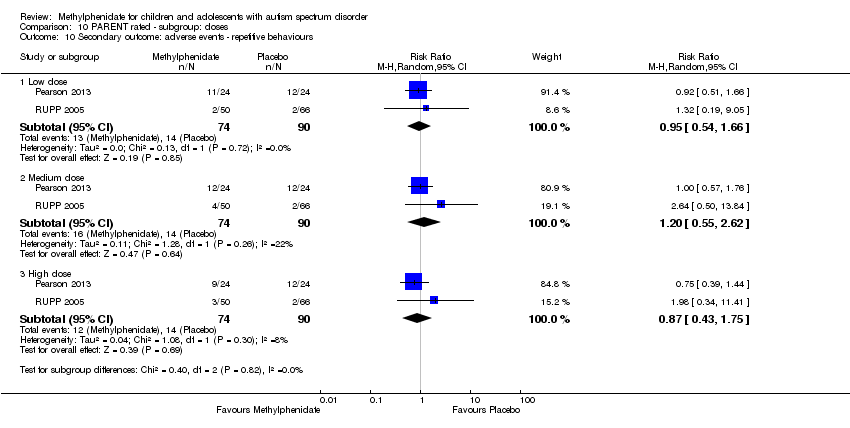
Comparison 10 PARENT rated ‐ subgroup: doses, Outcome 10 Secondary outcome: adverse events ‐ repetitive behaviours.

Comparison 10 PARENT rated ‐ subgroup: doses, Outcome 11 Secondary outcome: adverse events ‐ sleep disturbance.
| High‐dose methylphenidate versus placebo for symptoms of ADHD and ASD as rated by teachers | ||||||
| Patient or population: children aged 6 to 18 years with ASD | ||||||
| Outcomes | Anticipated absolute effects* (95% CI) | Relative effect | № of participants | Quality of the evidence | Comments | |
| Risk with placebo | Risk with high‐dose methylphenidate | |||||
| Primary outcome: ADHD‐like symptoms | ||||||
| Inattention Measured using SNAP‐IV inattention subscale (range 0 to 27) | — | The mean inattention score in the intervention group was 2.72 units lower (5.37 lower to 0.06 lower) | — | 51 teachers | ⊕⊕⊝⊝ | — |
| Hyperactivity | — | The mean hyperactivity score in the intervention group was 0.78 standard units lower (1.13 lower to 0.43 lower) | — | 73 teachers | ⊕⊕⊝⊝ | — |
| Impulsivity | See comment | — | 36 teachers (1 RCT) | — | Insufficient data to pool results | |
| Primary outcome: core symptoms of ASD | ||||||
| Impaired social interaction | — | The mean impaired social interaction score in the intervention group was 0.51 standard units lower (1.07 lower to 0.05 higher) | — | 63 teachers | ⊕⊝⊝⊝ | — |
| Impaired communication | See comment | — | 24 teachers (1 RCT) | — | Insufficient data to pool results | |
| Stereotypical behaviours | — | The mean stereotypical behaviours score in the intervention group was 0.34 standard units lower (0.84 lower to 0.17 higher) | — | 69 teachers | ⊕⊕⊝⊝ | — |
| Overall ASD | — | The mean overall ASD score in the intervention group was 0.53 standard units lower (1.26 lower to 0.19 higher) | — | 36 teachers (2 RCTs) | ⊕⊕⊝⊝ | — |
| Secondary outcome: rate of adverse effects | ||||||
| Total number of adverse events | See comment | — | 79 teachers (1 RCT) | — | Insufficient data to pool resultsd | |
| *The risk in the intervention group (and its 95% CI) is based on the assumed risk in the comparison group and the relative effect of the intervention (and its 95% CI). | ||||||
| GRADE Working Group grades of evidence | ||||||
| aDowngraded one point for limitations in design and implementation. | ||||||
| High‐dose methylphenidate versus placebo for symptoms of ADHD and ASD as rated by parents | ||||||
| Patient or population: Children aged 6 to 18 years with ASD | ||||||
| Outcomes | Anticipated absolute effects* (95% CI) | Relative effect | № of participants | Quality of the evidence | Comments | |
| Risk with placebo | Risk with high‐dose methylphenidate | |||||
| Primary outcome: ADHD‐like symptoms | ||||||
| Inattention Measured using SNAP‐IV inattention subscale (range 0 to 27) | — | The mean inattention score in the intervention group was 3.16 units lower (6.89 lower to 0.57 higher) | — | 71 parents | ⊕⊕⊝⊝ | — |
| Impulsivity | See comment | — | 48 parents (1 RCT) | — | Insufficient data to pool results | |
| Hyperactivity Measured using ABC hyperactivity subscale (range 0 to 48) | — | The hyperactivity score in the intervention group was 6.61 units lower (12.19 lower to 1.03 lower) | — | 71 parents | ⊕⊕⊝⊝ | — |
| Primary outcome: core symptoms of ASD | ||||||
| Impaired social interaction | — | The impaired social interaction score in the intervention group was 0.21 standard units lower (0.60 lower to 0.18 higher) | — | 71 parents | ⊕⊝⊝⊝ | — |
| Impaired communication | See comment | — | 48 parents (1 RCT) | — | Insufficient data to pool results | |
| Stereotypical behaviours | See comment | — | 48 parents (1 RCT) | — | Insufficient data to pool results | |
| Overall ASD | See comment | — | 48 parents (1 RCT) | — | Insufficient data to pool results | |
| Secondary outcome: rate of adverse events | ||||||
| Total number of adverse events | See comment | — | 108 parents (1 RCT) | — | Insufficient data to pool resultsd | |
| *The risk in the intervention group (and its 95% CI) is based on the assumed risk in the comparison group and the relative effect of the intervention (and its 95% CI). | ||||||
| GRADE Working Group grades of evidence | ||||||
| a Downgraded one point for limitations in design and implementation. | ||||||
| Instrument | Inattention | Impulsivity | Hyperactivity | |||
| Teachera | Parent | Teachera | Parent | Teachera | Parent | |
| ABC | — | — | — | — | H , Q, R | P , R |
| ACTeRS | P | P | — | — | P | P |
| Conners' Global Index | — | — | P | P | P | P |
| CPRS‐R and CTRS‐R | P | P | — | — | P, Q | P |
| Conners' Abbreviated Parent/Teacher Questionnaire | — | — | — | — | — | — |
| SNAP‐IV | P , R | P , R | — | — | P , R | P, R |
| a'Teacher' includes clinician and trained observer raters. Letters (H, P, Q, R) indicate those studies that used a particular instrument to rate the particular outcome. Letters in bold and underlined font indicate the instrument we used in our meta‐analysis: H: Handen 2000; P: Pearson 2013; Q: Quintana 1995; R: RUPP 2005. ABC: Aberrant Behavior Checklist; ACTeRS: ADD‐H (Attention deficit disorder ‐ hyperactivity) Comprehensive Teacher Rating Scale; ADHD: attention deficit hyperactivity disorder; CPRS‐R: Conners' Parent Rating Scale ‐ Revised; CTRS‐R: Conners' Teacher Rating Scale ‐ Revised;SNAP‐IV: Swanson, Nolan, and Pelham Questionnaire, Fourth Edition. | ||||||
| Instrument | Impaired social interaction | Impaired communication | Stereotypical behaviours | Overall ASD | ||||
| Teacher a | Parent | Teacher a | Parent | Teacher a | Parent | Teacher a | Parent | |
| ABC | H | P | H | P | H , Q | P | — | — |
| ACTeRS | P | P | — | — | — | — | — | — |
| CARS | — | — | — | — | — | — | H | — |
| CYBOCS | — | — | — | — | R | — | — | — |
| CPRS‐R and CTRS‐R | P | P | — | — | — | — | — | — |
| Iowa CTRS | H | — | — | — | — | — | — | — |
| Social communication questionnaire | — | — | — | — | — | — | — | P |
| SNAP‐IV | R | R | — | — | — | — | — | — |
| Clinician Global Impression ‐ Severity | — | — | — | — | — | — | P | — |
| a'Teacher' includes clinician and trained observer raters; Letters (H, P, Q, R) indicate the studies which used a particular instrument to rate the particular outcome. Letters in bolded and underlined font indicate the instrument we used in our meta‐analysis: H: Handen 2000; P: Pearson 2013; Q: Quintana 1995; R: RUPP 2005; ABC: Aberrant Behavior Checklist; ACTeRS: ADD‐H (Attention deficit disorder ‐ hyperactivity) Comprehensive Teacher Rating Scale; ASD: autism spectrum disorders; CARS: Child Autism Rating Scale; CPRS‐R: Conners' Parent Rating Scale ‐ Revised; CTRS‐R: Conners' Teacher Rating Scale ‐ Revised; CYBOCS: Children's Yale‐Brown Obsessive Compulsive Scales;Iowa CTRS: Iowa Conners' Teacher Rating Scale; SNAP‐IV: Swanson, Nolan, and Pelham Questionnaire, 4th Edition. | ||||||||
| Outcome or subgroup title | No. of studies | No. of participants | Statistical method | Effect size |
| 1 Primary outcome: ADHD symptoms ‐ inattention (same measurement instrument) Show forest plot | 2 | Mean Difference (Random, 95% CI) | ‐2.72 [‐5.37, ‐0.06] | |
| 2 Primary outcome: ADHD symptoms ‐ hyperactivity (different measurement instrument) Show forest plot | 4 | Std. Mean Difference (Random, 95% CI) | ‐0.78 [‐1.13, ‐0.43] | |
| 3 Primary outcome: ASD symptoms Show forest plot | 4 | Std. Mean Difference (Random, 95% CI) | Subtotals only | |
| 3.1 Impaired social interaction | 3 | Std. Mean Difference (Random, 95% CI) | ‐0.51 [‐1.07, 0.05] | |
| 3.2 Stereotypical behaviours | 3 | Std. Mean Difference (Random, 95% CI) | ‐0.34 [‐0.84, 0.17] | |
| 3.3 Overall ASD | 2 | Std. Mean Difference (Random, 95% CI) | ‐0.53 [‐1.26, 0.19] | |
| 4 Secondary outcome: adverse events Show forest plot | 2 | Risk Ratio (M‐H, Random, 95% CI) | Subtotals only | |
| 4.1 Gastrointestinal effects: abdominal discomfort | 2 | 69 | Risk Ratio (M‐H, Random, 95% CI) | 3.00 [0.13, 70.16] |
| 4.2 Gastrointestinal effects: reduced appetite | 2 | 69 | Risk Ratio (M‐H, Random, 95% CI) | 1.33 [0.43, 4.12] |
| 4.3 General physical adverse effect: dizziness | 2 | 69 | Risk Ratio (M‐H, Random, 95% CI) | 0.55 [0.06, 5.18] |
| 4.4 General physical adverse effect: drowsiness | 2 | 69 | Risk Ratio (M‐H, Random, 95% CI) | 2.00 [0.47, 8.55] |
| 4.5 General physical adverse effect: headache | 2 | 69 | Risk Ratio (M‐H, Random, 95% CI) | 3.00 [0.13, 70.16] |
| 4.6 Psychological effects: anxiety | 2 | 69 | Risk Ratio (M‐H, Random, 95% CI) | 1.02 [0.47, 2.18] |
| 4.7 Psychological effects: depressed mood | 2 | 69 | Risk Ratio (M‐H, Random, 95% CI) | 1.19 [0.37, 3.79] |
| 4.8 Psychological effects: irritability | 2 | 69 | Risk Ratio (M‐H, Random, 95% CI) | 0.81 [0.29, 2.27] |
| 4.9 Repetitive behaviours: repetitive movements or tics | 2 | 69 | Risk Ratio (M‐H, Random, 95% CI) | 0.57 [0.21, 1.57] |
| Outcome or subgroup title | No. of studies | No. of participants | Statistical method | Effect size |
| 1 Primary outcome: ADHD symptoms ‐ inattention (same measurement instrument) Show forest plot | 2 | Mean Difference (Random, 95% CI) | ‐2.55 [‐5.15, 0.06] | |
| 2 Primary outcome: ADHD symptoms ‐ hyperactivity (different measurement instrument) Show forest plot | 4 | Std. Mean Difference (Random, 95% CI) | ‐0.70 [‐1.07, ‐0.33] | |
| 3 Primary outcome: ASD symptoms Show forest plot | 4 | Std. Mean Difference (Random, 95% CI) | Subtotals only | |
| 3.1 Impaired social interaction | 3 | Std. Mean Difference (Random, 95% CI) | ‐0.44 [‐0.99, 0.11] | |
| 3.2 Stereotypical behaviours | 3 | Std. Mean Difference (Random, 95% CI) | ‐0.24 [‐0.71, 0.23] | |
| 3.3 Overall ASD | 2 | Std. Mean Difference (Random, 95% CI) | ‐0.56 [‐1.28, 0.17] | |
| Outcome or subgroup title | No. of studies | No. of participants | Statistical method | Effect size |
| 1 Primary outcome: ADHD symptoms ‐ inattention (same measurement instrument) Show forest plot | 2 | Mean Difference (Random, 95% CI) | Subtotals only | |
| 2 Primary outcome: ADHD symptoms ‐ hyperactivity (different measurement instrument) Show forest plot | 4 | Std. Mean Difference (Random, 95% CI) | Subtotals only | |
| 3 Primary outcome: ASD symptoms Show forest plot | 4 | Std. Mean Difference (Random, 95% CI) | Subtotals only | |
| 3.1 Impaired social interaction | 3 | Std. Mean Difference (Random, 95% CI) | ‐0.53 [‐1.09, 0.02] | |
| 3.2 Stereotypical behaviours | 3 | Std. Mean Difference (Random, 95% CI) | ‐0.37 [‐0.87, 0.14] | |
| 3.3 Overall ASD | 2 | Std. Mean Difference (Random, 95% CI) | ‐0.53 [‐1.25, 0.20] | |
| Outcome or subgroup title | No. of studies | No. of participants | Statistical method | Effect size |
| 1 Primary outcome: ADHD ‐ hyperactivity Show forest plot | 4 | Std. Mean Difference (Random, 95% CI) | Subtotals only | |
| 1.1 ABC | 3 | Std. Mean Difference (Random, 95% CI) | ‐0.75 [‐1.21, ‐0.29] | |
| 1.2 SNAP | 2 | Std. Mean Difference (Random, 95% CI) | ‐0.65 [‐1.12, ‐0.19] | |
| 1.3 Conners' Rating Scale ‐ Revised | 2 | Std. Mean Difference (Random, 95% CI) | ‐0.87 [‐1.26, ‐0.48] | |
| Outcome or subgroup title | No. of studies | No. of participants | Statistical method | Effect size |
| 1 Primary outcome: ADHD symptoms (same measurement instrument) Show forest plot | 2 | Mean Difference (Random, 95% CI) | Subtotals only | |
| 1.1 Inattention | 2 | Mean Difference (Random, 95% CI) | ‐3.16 [‐6.89, 0.57] | |
| 1.2 Hyperactivity | 2 | Mean Difference (Random, 95% CI) | ‐6.61 [‐12.19, ‐1.03] | |
| 2 Primary outcome: ASD symptoms ‐ impaired social interaction Show forest plot | 2 | Std. Mean Difference (Random, 95% CI) | ‐0.21 [‐0.60, 0.18] | |
| 3 Secondary outcome: adverse events Show forest plot | 2 | Risk Ratio (M‐H, Random, 95% CI) | Subtotals only | |
| 3.1 Gastrointestinal effects: abdominal discomfort | 2 | 164 | Risk Ratio (M‐H, Random, 95% CI) | 4.30 [0.91, 20.34] |
| 3.2 Gastrointestinal effects: reduced appetite | 2 | 164 | Risk Ratio (M‐H, Random, 95% CI) | 8.28 [2.57, 26.73] |
| 3.3 General physical adverse effect: headache | 2 | 164 | Risk Ratio (M‐H, Random, 95% CI) | 1.87 [0.10, 33.86] |
| 3.4 General physical effect: sleep disturbance | 2 | 164 | Risk Ratio (M‐H, Random, 95% CI) | 3.51 [0.59, 20.82] |
| 3.5 Psychological effects: anxiety | 2 | 164 | Risk Ratio (M‐H, Random, 95% CI) | 1.13 [0.22, 5.79] |
| 3.6 Repetitive behaviours: general | 2 | 164 | Risk Ratio (M‐H, Random, 95% CI) | 0.87 [0.43, 1.75] |
| 3.7 Psychological effects: irritability | 2 | 164 | Risk Ratio (M‐H, Random, 95% CI) | 1.25 [0.25, 6.36] |
| 3.8 Psychological effects: depressed mood | 2 | 164 | Risk Ratio (M‐H, Random, 95% CI) | 1.75 [0.05, 62.33] |
| Outcome or subgroup title | No. of studies | No. of participants | Statistical method | Effect size |
| 1 Primary outcome: ADHD symptoms (same measurement instrument) Show forest plot | 2 | Mean Difference (Random, 95% CI) | Subtotals only | |
| 1.1 Inattention | 2 | Mean Difference (Random, 95% CI) | ‐3.11 [‐6.84, 0.62] | |
| 1.2 Hyperactivity | 2 | Mean Difference (Random, 95% CI) | ‐6.44 [‐10.00, ‐0.89] | |
| 2 Primary outcome: ASD symptoms ‐ Impaired social interaction Show forest plot | 2 | Std. Mean Difference (Random, 95% CI) | Subtotals only | |
| Outcome or subgroup title | No. of studies | No. of participants | Statistical method | Effect size |
| 1 Primary outcome: ADHD symptoms (same measurement instrument) Show forest plot | 2 | Mean Difference (Random, 95% CI) | Subtotals only | |
| 1.1 Inattention | 2 | Mean Difference (Random, 95% CI) | ‐3.18 [‐6.91, 0.56] | |
| 1.2 Hyperactivity | 2 | Mean Difference (Random, 95% CI) | ‐6.67 [‐12.25, ‐1.08] | |
| 2 Primary outcome: ASD symptoms ‐ Impaired social interaction Show forest plot | 2 | Std. Mean Difference (Random, 95% CI) | Subtotals only | |
| Outcome or subgroup title | No. of studies | No. of participants | Statistical method | Effect size |
| 1 Primary outcome: ADHD ‐ hyperactivity Show forest plot | 2 | Std. Mean Difference (Random, 95% CI) | Subtotals only | |
| 1.1 ABC | 2 | Std. Mean Difference (Random, 95% CI) | ‐0.60 [‐1.04, ‐0.16] | |
| 1.2 SNAP | 2 | Std. Mean Difference (Random, 95% CI) | ‐0.53 [‐1.04, ‐0.03] | |
| Outcome or subgroup title | No. of studies | No. of participants | Statistical method | Effect size |
| 1 Primary outcome: ADHD ‐ inattention Show forest plot | 2 | Std. Mean Difference (Random, 95% CI) | Subtotals only | |
| 1.1 Low dose | 2 | Std. Mean Difference (Random, 95% CI) | ‐0.28 [‐0.61, 0.05] | |
| 1.2 Medium dose | 2 | Std. Mean Difference (Random, 95% CI) | ‐0.46 [‐0.89, ‐0.04] | |
| 1.3 High dose | 2 | Std. Mean Difference (Random, 95% CI) | ‐0.38 [‐0.75, ‐0.02] | |
| 2 Primary outcome: ADHD ‐ hyperactivity Show forest plot | 4 | Std. Mean Difference (Random, 95% CI) | Subtotals only | |
| 2.1 Low dose | 2 | Std. Mean Difference (Random, 95% CI) | ‐0.40 [‐0.77, ‐0.03] | |
| 2.2 Medium dose | 3 | Std. Mean Difference (Random, 95% CI) | ‐0.55 [‐1.00, ‐0.10] | |
| 2.3 High dose | 4 | Std. Mean Difference (Random, 95% CI) | ‐0.78 [‐1.13, ‐0.43] | |
| 3 Primary outcome: ASD ‐ impaired social interaction Show forest plot | 3 | Std. Mean Difference (Random, 95% CI) | Subtotals only | |
| 3.1 Low dose | 2 | Std. Mean Difference (Random, 95% CI) | ‐0.30 [‐0.59, ‐0.02] | |
| 3.2 Medium dose | 3 | Std. Mean Difference (Random, 95% CI) | ‐0.44 [‐0.94, 0.06] | |
| 3.3 High dose | 3 | Std. Mean Difference (Random, 95% CI) | ‐0.51 [‐1.07, 0.05] | |
| 4 Primary outcome: ASD ‐ stereotypical behaviours Show forest plot | 3 | Std. Mean Difference (Random, 95% CI) | Subtotals only | |
| 4.1 Medium dose | 2 | Std. Mean Difference (Random, 95% CI) | ‐0.23 [‐0.43, ‐0.03] | |
| 4.2 High dose | 3 | Std. Mean Difference (Random, 95% CI) | ‐0.34 [‐0.84, 0.17] | |
| 5 Primary outcome: ASD ‐ overall ASD Show forest plot | 2 | Std. Mean Difference (Random, 95% CI) | Subtotals only | |
| 5.1 Medium dose | 2 | Std. Mean Difference (Random, 95% CI) | ‐0.52 [‐1.20, 0.17] | |
| 5.2 High dose | 2 | Std. Mean Difference (Random, 95% CI) | ‐0.54 [‐1.26, 0.19] | |
| 6 Secondary outcome: adverse events ‐ abdominal discomfort Show forest plot | 2 | Risk Ratio (M‐H, Random, 95% CI) | Subtotals only | |
| 6.1 Medium dose | 2 | 69 | Risk Ratio (M‐H, Random, 95% CI) | 0.0 [0.0, 0.0] |
| 6.2 High dose | 2 | 69 | Risk Ratio (M‐H, Random, 95% CI) | 3.00 [0.13, 70.16] |
| 7 Secondary outcome: adverse events ‐ reduced appetite Show forest plot | 2 | Risk Ratio (M‐H, Random, 95% CI) | Subtotals only | |
| 7.1 Medium dose | 2 | 69 | Risk Ratio (M‐H, Random, 95% CI) | 1.29 [0.75, 2.20] |
| 7.2 High dose | 2 | 69 | Risk Ratio (M‐H, Random, 95% CI) | 1.33 [0.43, 4.12] |
| 8 Secondary outcome: adverse events ‐ dizziness Show forest plot | 2 | Risk Ratio (M‐H, Random, 95% CI) | Subtotals only | |
| 8.1 Medium dose | 2 | 69 | Risk Ratio (M‐H, Random, 95% CI) | 0.22 [0.01, 4.06] |
| 8.2 High dose | 2 | 69 | Risk Ratio (M‐H, Random, 95% CI) | 0.55 [0.06, 5.18] |
| 9 Secondary outcome: adverse events ‐ drowsiness Show forest plot | 2 | Risk Ratio (M‐H, Random, 95% CI) | Subtotals only | |
| 9.1 Medium dose | 2 | 69 | Risk Ratio (M‐H, Random, 95% CI) | 1.27 [0.05, 32.89] |
| 9.2 High dose | 2 | 69 | Risk Ratio (M‐H, Random, 95% CI) | 2.00 [0.47, 8.55] |
| 10 Secondary outcome: adverse events ‐ headache Show forest plot | 2 | Risk Ratio (M‐H, Random, 95% CI) | Subtotals only | |
| 10.1 Medium dose | 2 | 69 | Risk Ratio (M‐H, Random, 95% CI) | 0.0 [0.0, 0.0] |
| 10.2 High dose | 2 | 69 | Risk Ratio (M‐H, Random, 95% CI) | 3.00 [0.13, 70.16] |
| 11 Secondary outcome: adverse events ‐ anxiety Show forest plot | 2 | Risk Ratio (M‐H, Random, 95% CI) | Subtotals only | |
| 11.1 Medium dose | 2 | 69 | Risk Ratio (M‐H, Random, 95% CI) | 0.68 [0.10, 4.46] |
| 11.2 High dose | 2 | 69 | Risk Ratio (M‐H, Random, 95% CI) | 1.02 [0.47, 2.18] |
| 12 Secondary outcome: adverse events ‐ depressed mood Show forest plot | 2 | Risk Ratio (M‐H, Random, 95% CI) | Subtotals only | |
| 12.1 Medium dose | 2 | 69 | Risk Ratio (M‐H, Random, 95% CI) | 1.01 [0.46, 2.26] |
| 12.2 High dose | 2 | 69 | Risk Ratio (M‐H, Random, 95% CI) | 1.19 [0.37, 3.79] |
| 13 Secondary outcome: adverse events ‐ irritability Show forest plot | 2 | Risk Ratio (M‐H, Random, 95% CI) | Subtotals only | |
| 13.1 Medium dose | 2 | 69 | Risk Ratio (M‐H, Random, 95% CI) | 0.96 [0.54, 1.70] |
| 13.2 High dose | 2 | 69 | Risk Ratio (M‐H, Random, 95% CI) | 0.81 [0.29, 2.27] |
| 14 Secondary outcome: adverse events ‐ repetitive movements Show forest plot | 2 | Risk Ratio (M‐H, Random, 95% CI) | Subtotals only | |
| 14.1 Medium dose | 2 | 69 | Risk Ratio (M‐H, Random, 95% CI) | 0.74 [0.30, 1.85] |
| 14.2 High dose | 2 | 69 | Risk Ratio (M‐H, Random, 95% CI) | 0.57 [0.21, 1.57] |
| Outcome or subgroup title | No. of studies | No. of participants | Statistical method | Effect size |
| 1 Primary outcome: ADHD ‐ inattention Show forest plot | 2 | Std. Mean Difference (Random, 95% CI) | Subtotals only | |
| 1.1 Low dose | 2 | Std. Mean Difference (Random, 95% CI) | ‐0.27 [‐0.58, 0.03] | |
| 1.2 Medium dose | 2 | Std. Mean Difference (Random, 95% CI) | ‐0.49 [‐0.85, ‐0.13] | |
| 1.3 High dose | 2 | Std. Mean Difference (Random, 95% CI) | ‐0.51 [‐1.15, 0.14] | |
| 2 Primary outcome: ADHD ‐ hyperactivity Show forest plot | 2 | Std. Mean Difference (Random, 95% CI) | Subtotals only | |
| 2.1 Low dose | 2 | Std. Mean Difference (Random, 95% CI) | ‐0.35 [‐0.55, ‐0.14] | |
| 2.2 Medium dose | 2 | Std. Mean Difference (Random, 95% CI) | ‐0.67 [‐1.01, ‐0.33] | |
| 2.3 High dose | 2 | Std. Mean Difference (Random, 95% CI) | ‐0.60 [‐1.04, ‐0.16] | |
| 3 Primary outcome: ASD ‐ impaired social interaction Show forest plot | 2 | Std. Mean Difference (Random, 95% CI) | Subtotals only | |
| 3.1 Low dose | 2 | Std. Mean Difference (Random, 95% CI) | ‐0.15 [‐0.33, 0.04] | |
| 3.2 Medium dose | 2 | Std. Mean Difference (Random, 95% CI) | ‐0.17 [‐0.37, 0.03] | |
| 3.3 High dose | 2 | Std. Mean Difference (Random, 95% CI) | ‐0.21 [‐0.60, 0.18] | |
| 4 Secondary outcome: adverse events ‐ abdominal discomfort Show forest plot | 2 | Risk Ratio (M‐H, Random, 95% CI) | Subtotals only | |
| 4.1 Low dose | 2 | 164 | Risk Ratio (M‐H, Random, 95% CI) | 1.73 [0.29, 10.34] |
| 4.2 Medium dose | 2 | 164 | Risk Ratio (M‐H, Random, 95% CI) | 4.51 [0.98, 20.67] |
| 4.3 High dose | 2 | 164 | Risk Ratio (M‐H, Random, 95% CI) | 4.30 [0.91, 20.34] |
| 5 Secondary outcome: adverse events ‐ reduced appetite Show forest plot | 2 | Risk Ratio (M‐H, Random, 95% CI) | Subtotals only | |
| 5.1 Low dose | 2 | 164 | Risk Ratio (M‐H, Random, 95% CI) | 3.41 [0.91, 12.78] |
| 5.2 Medium dose | 2 | 164 | Risk Ratio (M‐H, Random, 95% CI) | 10.00 [3.14, 31.82] |
| 5.3 High dose | 2 | 164 | Risk Ratio (M‐H, Random, 95% CI) | 8.28 [2.57, 26.73] |
| 6 Secondary outcome: adverse events ‐ headache Show forest plot | 2 | Risk Ratio (M‐H, Random, 95% CI) | Subtotals only | |
| 6.1 Low dose | 2 | 164 | Risk Ratio (M‐H, Random, 95% CI) | 1.77 [0.31, 9.94] |
| 6.2 Medium dose | 2 | 164 | Risk Ratio (M‐H, Random, 95% CI) | 2.29 [0.55, 9.58] |
| 6.3 High dose | 2 | 164 | Risk Ratio (M‐H, Random, 95% CI) | 1.87 [0.10, 33.86] |
| 7 Secondary outcome: adverse events ‐ anxiety Show forest plot | 2 | Risk Ratio (M‐H, Random, 95% CI) | Subtotals only | |
| 7.1 Low dose | 2 | 164 | Risk Ratio (M‐H, Random, 95% CI) | 1.26 [0.45, 3.52] |
| 7.2 Medium dose | 2 | 164 | Risk Ratio (M‐H, Random, 95% CI) | 1.29 [0.46, 3.58] |
| 7.3 High dose | 2 | 164 | Risk Ratio (M‐H, Random, 95% CI) | 1.13 [0.22, 5.79] |
| 8 Secondary outcome: adverse events ‐ depressed mood Show forest plot | 2 | Risk Ratio (M‐H, Random, 95% CI) | Subtotals only | |
| 8.1 Low dose | 2 | 164 | Risk Ratio (M‐H, Random, 95% CI) | 0.99 [0.22, 4.42] |
| 8.2 Medium dose | 2 | 164 | Risk Ratio (M‐H, Random, 95% CI) | 2.30 [0.39, 13.42] |
| 8.3 High dose | 2 | 164 | Risk Ratio (M‐H, Random, 95% CI) | 1.75 [0.05, 62.33] |
| 9 Secondary outcome: adverse events ‐ irritability Show forest plot | 2 | Risk Ratio (M‐H, Random, 95% CI) | Subtotals only | |
| 9.1 Low dose | 2 | 164 | Risk Ratio (M‐H, Random, 95% CI) | 1.31 [0.30, 5.83] |
| 9.2 Medium dose | 2 | 164 | Risk Ratio (M‐H, Random, 95% CI) | 1.77 [0.23, 13.47] |
| 9.3 High dose | 2 | 164 | Risk Ratio (M‐H, Random, 95% CI) | 1.25 [0.25, 6.36] |
| 10 Secondary outcome: adverse events ‐ repetitive behaviours Show forest plot | 2 | Risk Ratio (M‐H, Random, 95% CI) | Subtotals only | |
| 10.1 Low dose | 2 | 164 | Risk Ratio (M‐H, Random, 95% CI) | 0.95 [0.54, 1.66] |
| 10.2 Medium dose | 2 | 164 | Risk Ratio (M‐H, Random, 95% CI) | 1.20 [0.55, 2.62] |
| 10.3 High dose | 2 | 164 | Risk Ratio (M‐H, Random, 95% CI) | 0.87 [0.43, 1.75] |
| 11 Secondary outcome: adverse events ‐ sleep disturbance Show forest plot | 2 | Risk Ratio (M‐H, Random, 95% CI) | Subtotals only | |
| 11.1 Low dose | 2 | 164 | Risk Ratio (M‐H, Random, 95% CI) | 2.94 [0.44, 19.64] |
| 11.2 Medium dose | 2 | 164 | Risk Ratio (M‐H, Random, 95% CI) | 5.10 [0.71, 36.68] |
| 11.3 High dose | 2 | 164 | Risk Ratio (M‐H, Random, 95% CI) | 3.51 [0.59, 20.82] |