Metilfenidato para niños y adolescentes con trastorno del espectro autista
Información
- DOI:
- https://doi.org/10.1002/14651858.CD011144.pub2Copiar DOI

- Base de datos:
-
- Cochrane Database of Systematic Reviews
- Versión publicada:
-
- 21 noviembre 2017see what's new
- Tipo:
-
- Intervention
- Etapa:
-
- Review
- Grupo Editorial Cochrane:
-
Grupo Cochrane de Problemas de desarrollo, psicosociales y de aprendizaje
- Copyright:
-
- Copyright © 2017 The Cochrane Collaboration. Published by John Wiley & Sons, Ltd.
Cifras del artículo
Altmetric:
Citado por:
Autores
Contributions of authors
Nancy Sturman is acting as guarantor for the review. She led the review, contributed to all stages of the process and drafted the review.
Laura Deckx led the data collection and analysis, and reviewed and commented on the draft review.
Mieke L van Driel supervised and coached the team throughout the development and writing of the protocol, advised on the methodology, contributed to the screening and selection of citations identified by the search, led the 'Risk of bias' assessment, and reviewed and commented on the draft review.
Sources of support
Internal sources
-
None, Other.
External sources
-
None, Other.
Declarations of interest
Nancy Sturman ‐ none known.
Laura Deckx ‐ none known.
Mieke L van Driel ‐ none known.
Acknowledgements
We produced this review within the Cochrane Developmental, Psychosocial and Learning Problems review group.
The review authors would like to acknowledge the following people who contributed to the early stages of the development and writing of the protocol for the review: Veena Gullapalli, Raesha Jaffer, Abirami Ratnagopal and Alvin Wong.
The authors would like to acknowledge the following people who contributed to the development and writing of the protocol for this review: Toni Redman, Elly Scheermeyer, Makoto Ogawa, Eddie Sparks, Jeremy Taylor and Vi Tran. Toni Redman generated the idea for this review, provided the content expertise for the protocol and reviewed the final draft of the review, based on her extensive experience in community paediatrics. Elly Scheermeyer contributed to the content and methodology of the protocol. Makoto Ogawa, Eddie Sparks, Jeremy Taylor and Vi Tran reviewed the protocol and contributed responses to editorial and peer reviewers' comments about the protocol. Jeremy Taylor, Makoto Ogawa and Vi Tran also contributed to the initial screening of citations identified by the 2014 search.
The authors would like to acknowledge Mark Jones for his statistical advice.
Version history
| Published | Title | Stage | Authors | Version |
| 2017 Nov 21 | Methylphenidate for children and adolescents with autism spectrum disorder | Review | Nancy Sturman, Laura Deckx, Mieke L van Driel | |
| 2014 Aug 13 | Methylphenidate for core and ADHD‐like symptoms in children aged 6 to 18 years with autism spectrum disorders (ASDs) | Protocol | Toni Redman, Elly Scheermeyer, Makoto Ogawa, Eddie C Sparks, Jeremy C Taylor, Vi T Tran, Nancy Sturman, Mieke L van Driel | |
Differences between protocol and review
-
Authorship: authorship has changed since publication of the Cochrane Protocol: Nancy Sturman assumed the role of lead author; Laura Deckx was added to the team; and Toni Redman, Elly Scheermeyer, Makoto Ogawa, Eddie Sparks, Jeremy Taylor and Vi Tran withdrew from the team (Redman 2014).
-
Title: the title was changed to 'Methylphenidate for children and adolescents with autistic spectrum disorder', to fit with the character length restriction for proper display on the Cochrane website.
-
Introduction: the introduction was updated with recent and additional references.
-
Objectives: we replaced 'concentration, attentiveness and attention' with 'inattention' for consistency with our outcomes. We replaced 'social interaction' with 'impaired social interaction' for consistency with our outcomes. We removed the secondary outcome of 'disturbance of home life' because we were unable to identify relevant measures.
-
Search methods: in order to ensure our searches were as up‐to date as possible, we searched one additional database (MEDLINE EPub ahead of print), which became available to us after publication of the protocol. We report two ERIC strategies because our ERIC access changed from Proquest to EBSCOhost.
-
Types of studies: the published protocol did not consider the inclusion of cross‐over trials (Redman 2014), but we included these in the review because they are double‐blind, randomised controlled trials and their single‐case experimental design can be considered analogous to a parallel‐group design, with the additional feature of increasing the power of these studies.
-
Measures of treatment effect
-
We added information about combining different outcome scales where appropriate. We included two additional tables indicating which scales were used in our meta‐analysis (see Table 1; Table 2).
-
We reported that we used a generic inverse variance method to analyse the data from cross‐over studies. We presented all continuous data in terms of standardised mean differences (SMD).
-
We combined teacher, trained staff and clinician ratings and reported these as 'teacher' ratings. We reported teacher and parent ratings separately.
-
We reported effect sizes separately for low, medium and high dose and performed a subgroup analysis of the effect of the different dose ranges. The protocol did not specify dose ranges for low, medium and high doses (Redman 2014). We determined that low‐dose methylphenidate included doses between 0.11 mg/kg/dose and 0.21 mg/kg/dose; medium‐dose methylphenidate included doses between 0.22 mg/kg/dose and 0.36 mg/kg/dose; and high‐dose methylphenidate included doses between 0.43 mg/kg/dose and 0.6 mg/kg/dose. This determination was based on the dose cut‐offs in our included studies.
-
We were unable to calculate the risk difference (RD) and the number needed to treat (NNT) as planned had we found a significant effect and the trials were sufficiently homogenous, because all studies assessed improvement on the primary outcomes on a continuous scale. See Redman 2014. We were able to report the number needed to harm in the case of significant adverse events.
-
-
Unit of analysis issues
-
We added information about cross‐over studies (as our included studies were cross‐over studies), which was not specified in the protocol (Redman 2014).
-
We deleted the information about cluster‐randomised trials, trials with repeated measurements and trials with multiple treatment arms as we included no such studies in this review. Appendix 5 provides details of these methods planned for use in future updates of this review.
-
-
Dealing with missing data: we were unable to perform an intention‐to‐treat analysis due to inadequate data. Appendix 5 provides details of our planned intention‐to‐treat analysis.
-
Data synthesis: we added the following paragraph: "Measures of effect size using SMDs are difficult to interpret in terms of whether they represent a clinically important between‐treatment difference, or a clinically meaningful effect. In this review we used an SMD of 0.52 as a between‐treatment minimum clinically important difference (MCID), based on the Zhang 2005 finding of a MCID of 6.6 on the Attention Deficit Hyperactivity Disorder Rating Scale ‐ Parent Interview (ADHDRS‐PI), which was equivalent to an SMD of 0.52. Storebø 2015 also used this SMD of 0.52 as a clinically meaningful effect size. This aligns with the rule of thumb that an effect size of 0.20 to 0.49 represents a small effect; 0.50 to 0.79, a moderate effect; and 0.80 or above, a large effect, as described in the Cochrane Handbook for Systematic Reviews of Interventions (Schünemann 2017)."
-
Summary of findings table: We included a section on 'Summary of findings table' to the Methods section, which describes how we implemented GRADE in the review, at the request of the editorial base.
-
Subgroup analysis
-
We were unable to perform subgroup analyses based on participants' ages (ages 6 to 12 years, and 13 to 18 years), as no included studies included participants over the age of 14 years. The one study that included 13‐year‐old participants did not report any individual participant data, so we were unable to extract these results.
-
We were unable to perform a subgroup analysis based on immediate‐release versus extended‐release formulation, as the only study that used an extended‐release form, Pearson 2013, used both extended‐release methylphenidate (for the morning dose) and immediate‐release methylphenidate (for the afternoon dose, if administered). As investigators asked parents to focus only on their child's morning behaviour for their ratings, and teachers only saw the children on the extended‐release dose, we considered this study to have a single treatment arm (extended‐release methylphenidate).
-
-
Sensitivity analysis
-
We performed two sensitivity analyses to assess the effect of the correlation coefficient: one assuming no correlation (correlation coefficient of zero) and one assuming a higher correlation (correlation coefficient of 0.80).
-
We were unable to perform a sensitivity analysis to assess the impact of risk of bias on the overall result by adding or removing studies with a high risk of bias to/from the meta‐analysis, as we assessed none of our included studies as being at high risk on the assessment items (random number generation, allocation concealment, blinding of participants and personnel, or outcome assessor). See Appendix 5 and Redman 2014.
-
We were unable to explore the impact of heterogeneity on the overall pooled effect estimate by adding or removing studies that contributed to the heterogeneity, because of the limited number of studies included in this review. See Appendix 5 and Redman 2014.
-
We were unable to perform a sensitivity analysis to explore the impact of missing data on the overall outcome by comparing the analyses with available outcome data with those following the ITT principle. See Appendix 5 and Redman 2014.
-
We included an additional sensitivity analysis, testing the influence of the different scales on the same outcome. For example, if a study used more than one scale to measure the same outcome, we repeated the meta‐analyses for the different scales in order to assess if this changed the interpretation of our results. We used the SMD in order to compare the results across the different scales.
-
-
Included studies: although our inclusion criteria prespecified children aged 6 to 18 years, we included two studies with children younger than 6 years of age: Handen 2000, which included 13 children aged between 5.6 and 11.2 years (including two children aged 5.6 years, and one child aged 5.9 years) and RUPP 2005, which included 66 children aged between 5.0 and 13.7 years (with a mean age of 7.5 years (SD 2.2 years) and an unspecified number of 5‐year‐old children). We were unable to exclude the results of the five‐year‐old participants because individual participant results were not reported in either study. We included these studies because all other participants were in our target age range. This issue was not foreseen at the protocol stage of our review (Redman 2014), where we intended to target school‐aged children. For future reviews, we suggest including five‐year‐old participant data where this individual data cannot be excluded, and the majority of participants are within the target age range.
-
Effects of interventions: as no data were available, it was not possible to conduct an analysis of the secondary outcomes of caregiver well‐being; need for institutionalisation, special schooling options or therapy to achieve learning outcomes; or overall quality of life.
Keywords
MeSH
Medical Subject Headings (MeSH) Keywords
Medical Subject Headings Check Words
Adolescent; Child; Child, Preschool; Female; Humans; Male;
PICO

Study flow diagram.

Risk of bias graph: review authors' judgements about each risk of bias item presented as percentages across all included studies.
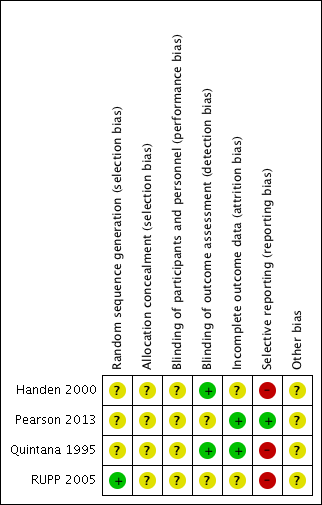
Risk of bias summary: review authors' judgements about each risk of bias item for each included study.

Comparison 1 TEACHER rated: high dose versus placebo, Outcome 1 Primary outcome: ADHD symptoms ‐ inattention (same measurement instrument).

Comparison 1 TEACHER rated: high dose versus placebo, Outcome 2 Primary outcome: ADHD symptoms ‐ hyperactivity (different measurement instrument).
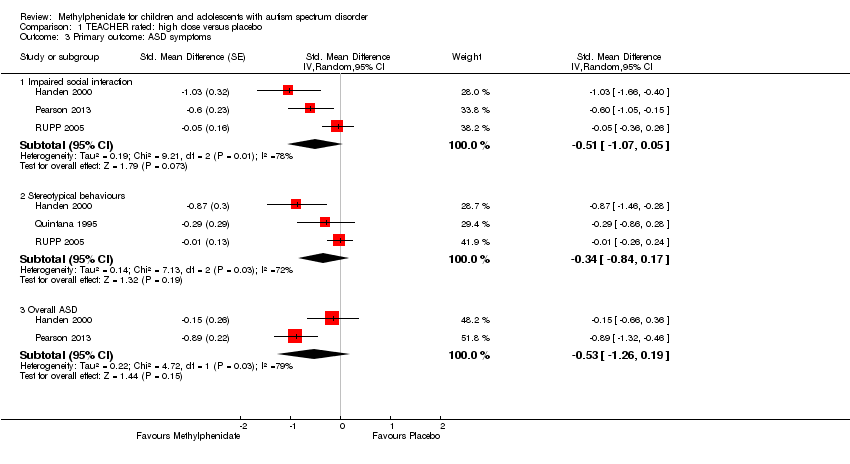
Comparison 1 TEACHER rated: high dose versus placebo, Outcome 3 Primary outcome: ASD symptoms.

Comparison 1 TEACHER rated: high dose versus placebo, Outcome 4 Secondary outcome: adverse events.

Comparison 2 TEACHER rated ‐ sensitivity: correlation 0, Outcome 1 Primary outcome: ADHD symptoms ‐ inattention (same measurement instrument).
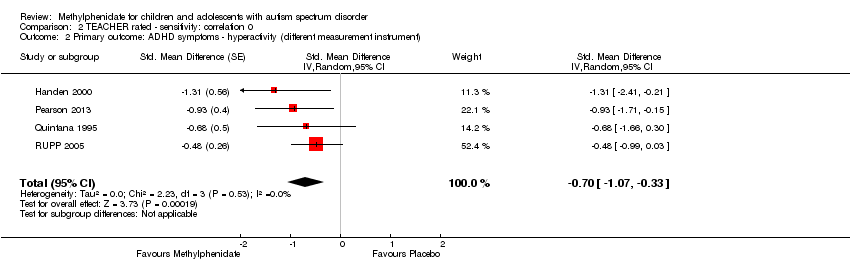
Comparison 2 TEACHER rated ‐ sensitivity: correlation 0, Outcome 2 Primary outcome: ADHD symptoms ‐ hyperactivity (different measurement instrument).

Comparison 2 TEACHER rated ‐ sensitivity: correlation 0, Outcome 3 Primary outcome: ASD symptoms.

Comparison 3 TEACHER rated ‐ sensitivity: correlation 0.8, Outcome 1 Primary outcome: ADHD symptoms ‐ inattention (same measurement instrument).

Comparison 3 TEACHER rated ‐ sensitivity: correlation 0.8, Outcome 2 Primary outcome: ADHD symptoms ‐ hyperactivity (different measurement instrument).

Comparison 3 TEACHER rated ‐ sensitivity: correlation 0.8, Outcome 3 Primary outcome: ASD symptoms.
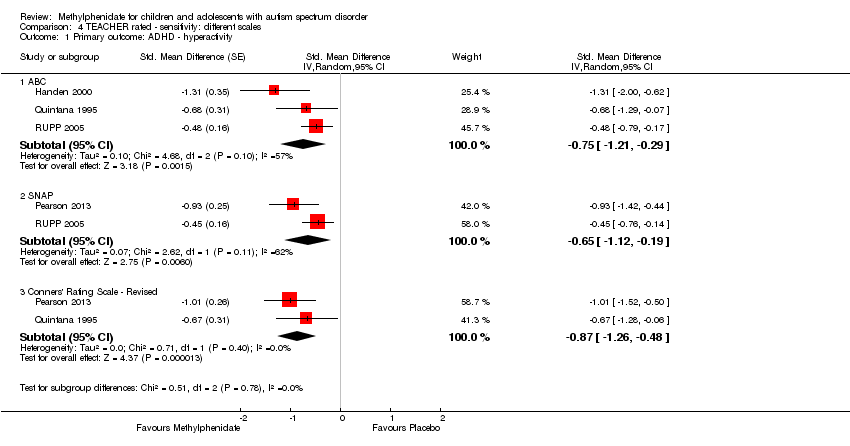
Comparison 4 TEACHER rated ‐ sensitivity: different scales, Outcome 1 Primary outcome: ADHD ‐ hyperactivity.

Comparison 5 PARENT rated: high dose versus placebo, Outcome 1 Primary outcome: ADHD symptoms (same measurement instrument).

Comparison 5 PARENT rated: high dose versus placebo, Outcome 2 Primary outcome: ASD symptoms ‐ impaired social interaction.
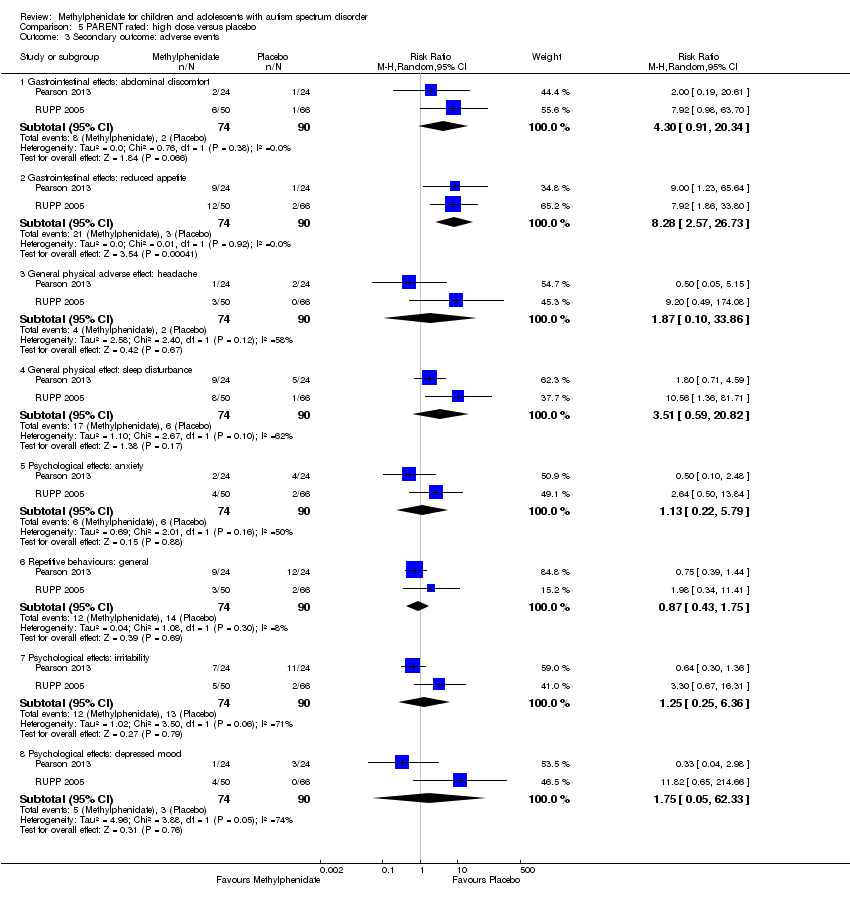
Comparison 5 PARENT rated: high dose versus placebo, Outcome 3 Secondary outcome: adverse events.
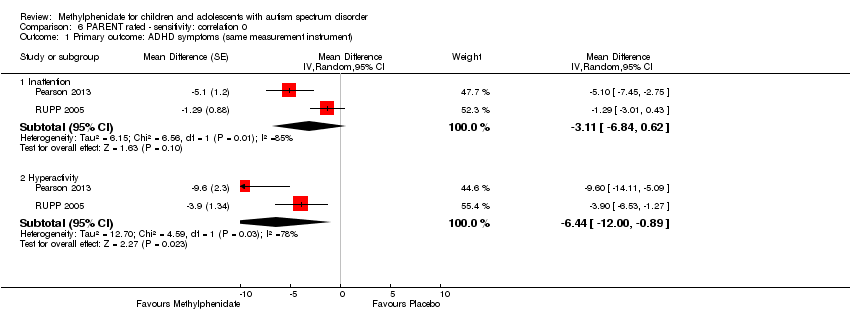
Comparison 6 PARENT rated ‐ sensitivity: correlation 0, Outcome 1 Primary outcome: ADHD symptoms (same measurement instrument).
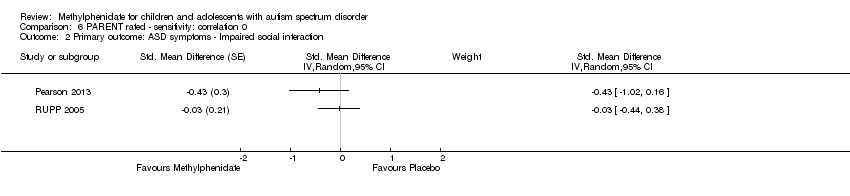
Comparison 6 PARENT rated ‐ sensitivity: correlation 0, Outcome 2 Primary outcome: ASD symptoms ‐ Impaired social interaction.
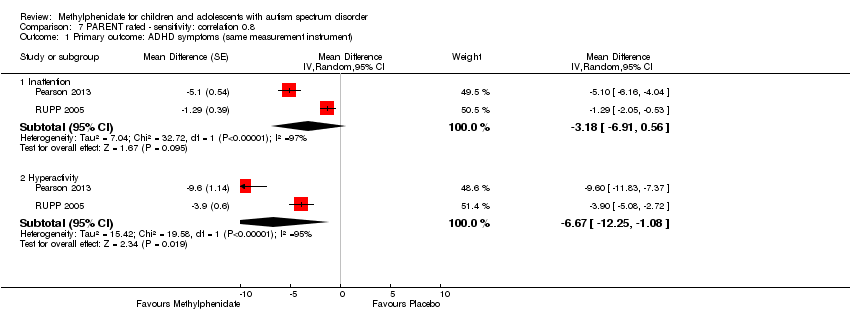
Comparison 7 PARENT rated ‐ sensitivity: correlation 0.8, Outcome 1 Primary outcome: ADHD symptoms (same measurement instrument).

Comparison 7 PARENT rated ‐ sensitivity: correlation 0.8, Outcome 2 Primary outcome: ASD symptoms ‐ Impaired social interaction.
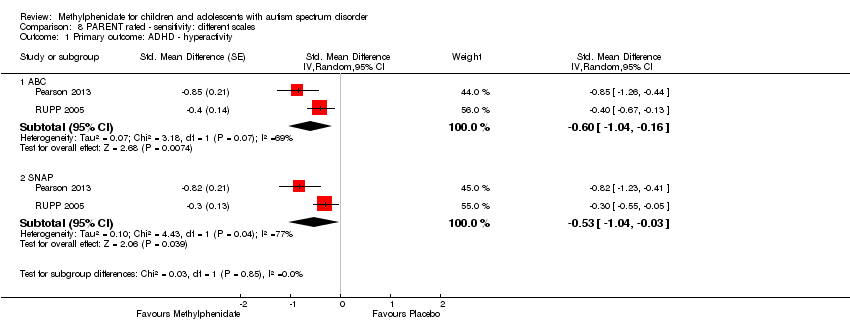
Comparison 8 PARENT rated ‐ sensitivity: different scales, Outcome 1 Primary outcome: ADHD ‐ hyperactivity.

Comparison 9 TEACHER rated ‐ subgroup: doses, Outcome 1 Primary outcome: ADHD ‐ inattention.

Comparison 9 TEACHER rated ‐ subgroup: doses, Outcome 2 Primary outcome: ADHD ‐ hyperactivity.

Comparison 9 TEACHER rated ‐ subgroup: doses, Outcome 3 Primary outcome: ASD ‐ impaired social interaction.

Comparison 9 TEACHER rated ‐ subgroup: doses, Outcome 4 Primary outcome: ASD ‐ stereotypical behaviours.
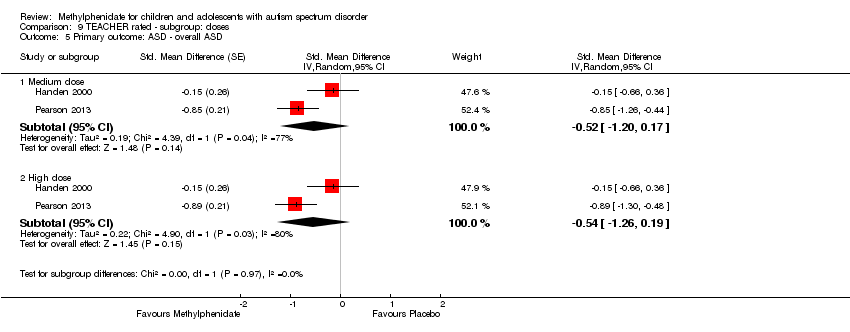
Comparison 9 TEACHER rated ‐ subgroup: doses, Outcome 5 Primary outcome: ASD ‐ overall ASD.
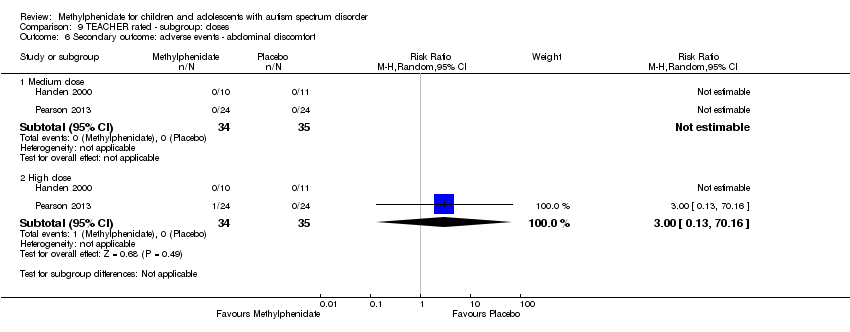
Comparison 9 TEACHER rated ‐ subgroup: doses, Outcome 6 Secondary outcome: adverse events ‐ abdominal discomfort.

Comparison 9 TEACHER rated ‐ subgroup: doses, Outcome 7 Secondary outcome: adverse events ‐ reduced appetite.
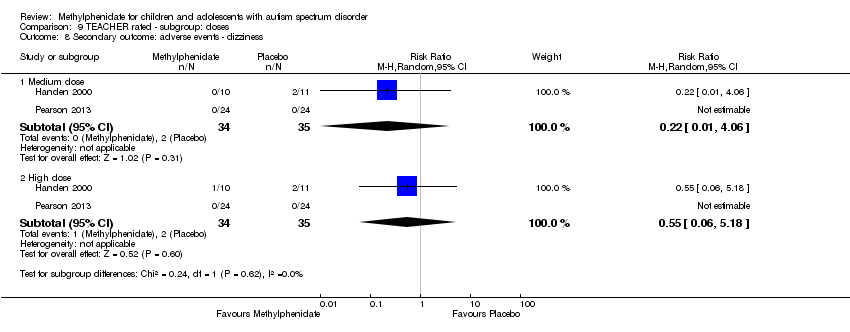
Comparison 9 TEACHER rated ‐ subgroup: doses, Outcome 8 Secondary outcome: adverse events ‐ dizziness.
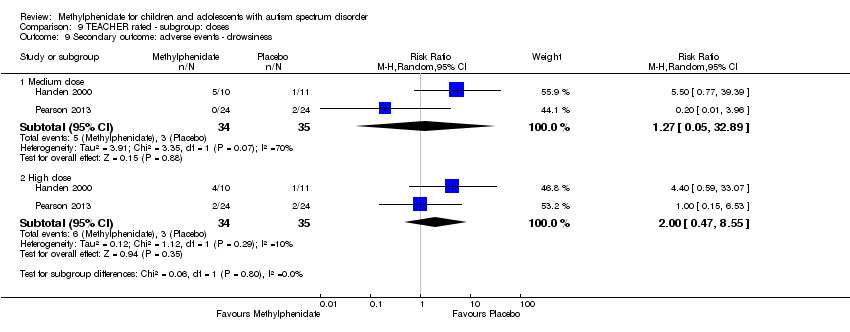
Comparison 9 TEACHER rated ‐ subgroup: doses, Outcome 9 Secondary outcome: adverse events ‐ drowsiness.

Comparison 9 TEACHER rated ‐ subgroup: doses, Outcome 10 Secondary outcome: adverse events ‐ headache.
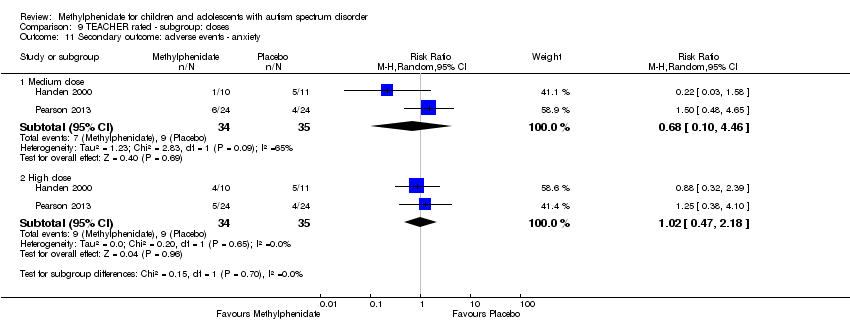
Comparison 9 TEACHER rated ‐ subgroup: doses, Outcome 11 Secondary outcome: adverse events ‐ anxiety.

Comparison 9 TEACHER rated ‐ subgroup: doses, Outcome 12 Secondary outcome: adverse events ‐ depressed mood.
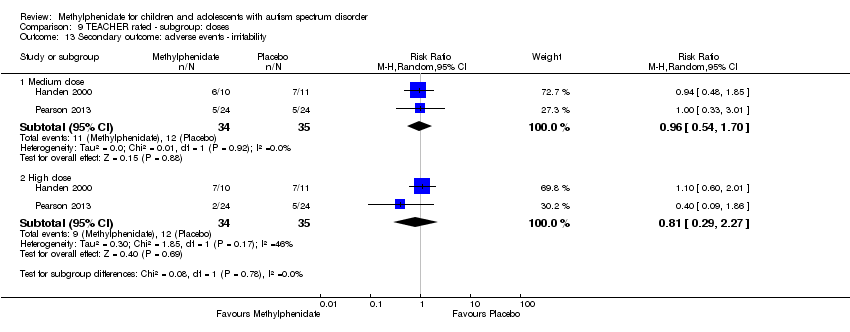
Comparison 9 TEACHER rated ‐ subgroup: doses, Outcome 13 Secondary outcome: adverse events ‐ irritability.
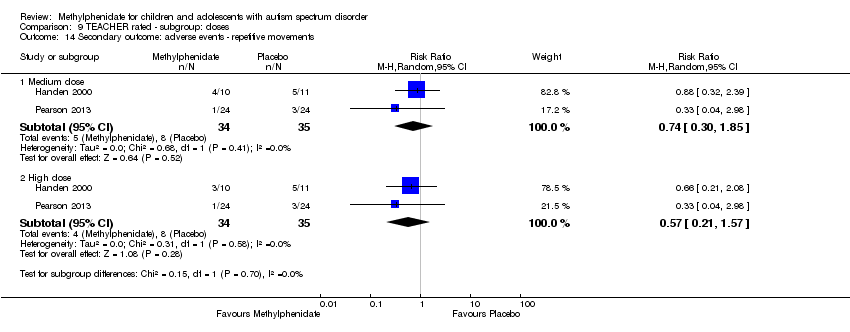
Comparison 9 TEACHER rated ‐ subgroup: doses, Outcome 14 Secondary outcome: adverse events ‐ repetitive movements.
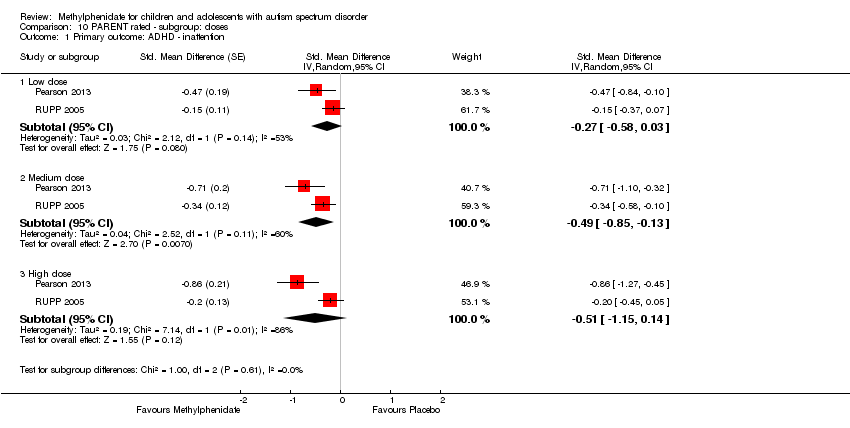
Comparison 10 PARENT rated ‐ subgroup: doses, Outcome 1 Primary outcome: ADHD ‐ inattention.
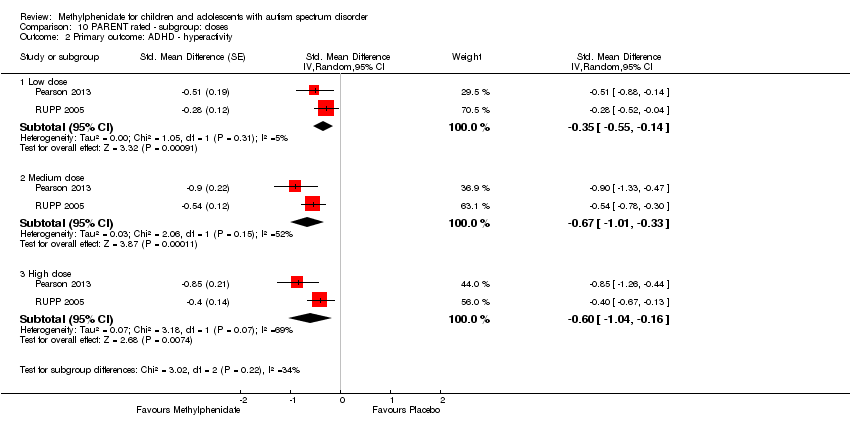
Comparison 10 PARENT rated ‐ subgroup: doses, Outcome 2 Primary outcome: ADHD ‐ hyperactivity.

Comparison 10 PARENT rated ‐ subgroup: doses, Outcome 3 Primary outcome: ASD ‐ impaired social interaction.
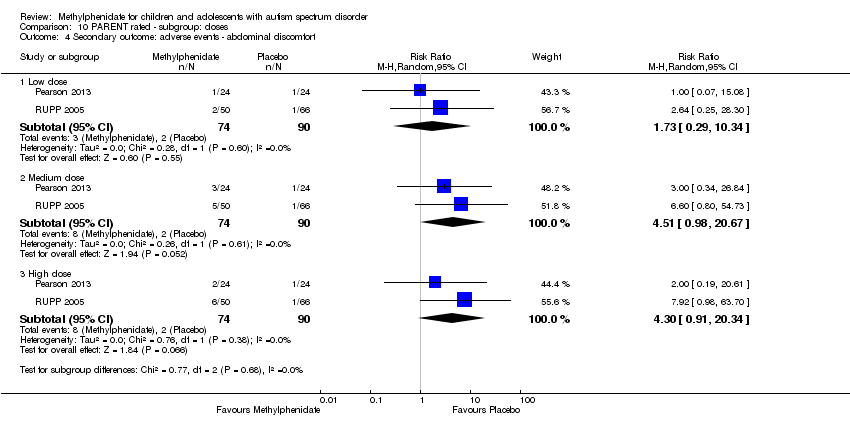
Comparison 10 PARENT rated ‐ subgroup: doses, Outcome 4 Secondary outcome: adverse events ‐ abdominal discomfort.

Comparison 10 PARENT rated ‐ subgroup: doses, Outcome 5 Secondary outcome: adverse events ‐ reduced appetite.
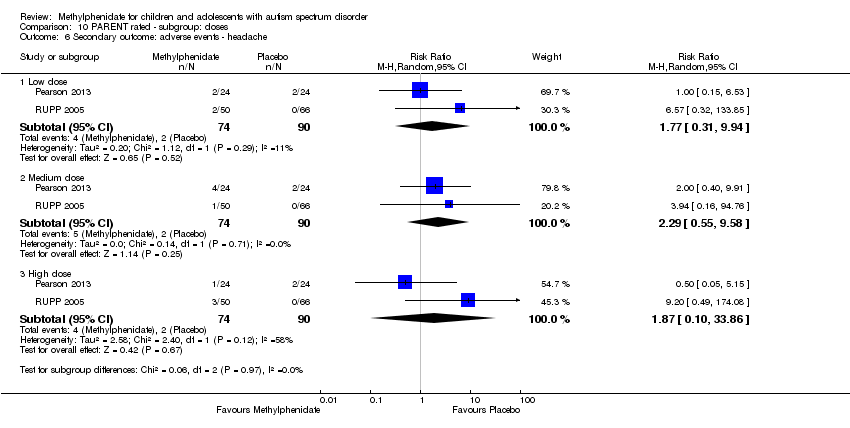
Comparison 10 PARENT rated ‐ subgroup: doses, Outcome 6 Secondary outcome: adverse events ‐ headache.

Comparison 10 PARENT rated ‐ subgroup: doses, Outcome 7 Secondary outcome: adverse events ‐ anxiety.

Comparison 10 PARENT rated ‐ subgroup: doses, Outcome 8 Secondary outcome: adverse events ‐ depressed mood.

Comparison 10 PARENT rated ‐ subgroup: doses, Outcome 9 Secondary outcome: adverse events ‐ irritability.
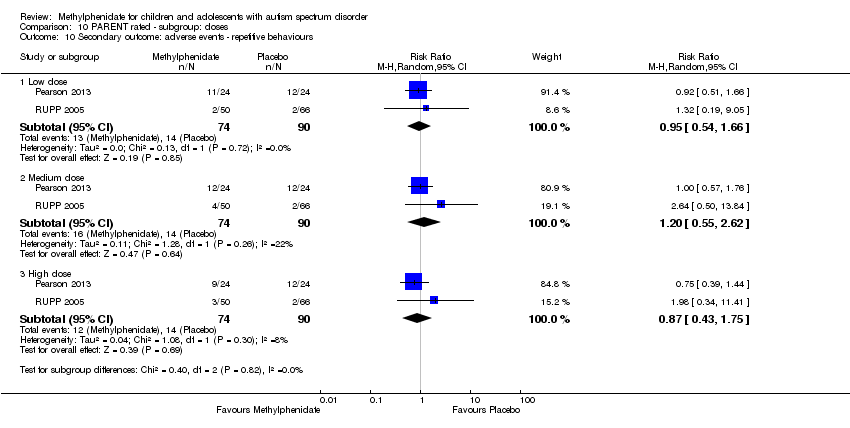
Comparison 10 PARENT rated ‐ subgroup: doses, Outcome 10 Secondary outcome: adverse events ‐ repetitive behaviours.

Comparison 10 PARENT rated ‐ subgroup: doses, Outcome 11 Secondary outcome: adverse events ‐ sleep disturbance.
| High‐dose methylphenidate versus placebo for symptoms of ADHD and ASD as rated by teachers | ||||||
| Patient or population: children aged 6 to 18 years with ASD | ||||||
| Outcomes | Anticipated absolute effects* (95% CI) | Relative effect | № of participants | Quality of the evidence | Comments | |
| Risk with placebo | Risk with high‐dose methylphenidate | |||||
| Primary outcome: ADHD‐like symptoms | ||||||
| Inattention Measured using SNAP‐IV inattention subscale (range 0 to 27) | — | The mean inattention score in the intervention group was 2.72 units lower (5.37 lower to 0.06 lower) | — | 51 teachers | ⊕⊕⊝⊝ | — |
| Hyperactivity | — | The mean hyperactivity score in the intervention group was 0.78 standard units lower (1.13 lower to 0.43 lower) | — | 73 teachers | ⊕⊕⊝⊝ | — |
| Impulsivity | See comment | — | 36 teachers (1 RCT) | — | Insufficient data to pool results | |
| Primary outcome: core symptoms of ASD | ||||||
| Impaired social interaction | — | The mean impaired social interaction score in the intervention group was 0.51 standard units lower (1.07 lower to 0.05 higher) | — | 63 teachers | ⊕⊝⊝⊝ | — |
| Impaired communication | See comment | — | 24 teachers (1 RCT) | — | Insufficient data to pool results | |
| Stereotypical behaviours | — | The mean stereotypical behaviours score in the intervention group was 0.34 standard units lower (0.84 lower to 0.17 higher) | — | 69 teachers | ⊕⊕⊝⊝ | — |
| Overall ASD | — | The mean overall ASD score in the intervention group was 0.53 standard units lower (1.26 lower to 0.19 higher) | — | 36 teachers (2 RCTs) | ⊕⊕⊝⊝ | — |
| Secondary outcome: rate of adverse effects | ||||||
| Total number of adverse events | See comment | — | 79 teachers (1 RCT) | — | Insufficient data to pool resultsd | |
| *The risk in the intervention group (and its 95% CI) is based on the assumed risk in the comparison group and the relative effect of the intervention (and its 95% CI). | ||||||
| GRADE Working Group grades of evidence | ||||||
| aDowngraded one point for limitations in design and implementation. | ||||||
| High‐dose methylphenidate versus placebo for symptoms of ADHD and ASD as rated by parents | ||||||
| Patient or population: Children aged 6 to 18 years with ASD | ||||||
| Outcomes | Anticipated absolute effects* (95% CI) | Relative effect | № of participants | Quality of the evidence | Comments | |
| Risk with placebo | Risk with high‐dose methylphenidate | |||||
| Primary outcome: ADHD‐like symptoms | ||||||
| Inattention Measured using SNAP‐IV inattention subscale (range 0 to 27) | — | The mean inattention score in the intervention group was 3.16 units lower (6.89 lower to 0.57 higher) | — | 71 parents | ⊕⊕⊝⊝ | — |
| Impulsivity | See comment | — | 48 parents (1 RCT) | — | Insufficient data to pool results | |
| Hyperactivity Measured using ABC hyperactivity subscale (range 0 to 48) | — | The hyperactivity score in the intervention group was 6.61 units lower (12.19 lower to 1.03 lower) | — | 71 parents | ⊕⊕⊝⊝ | — |
| Primary outcome: core symptoms of ASD | ||||||
| Impaired social interaction | — | The impaired social interaction score in the intervention group was 0.21 standard units lower (0.60 lower to 0.18 higher) | — | 71 parents | ⊕⊝⊝⊝ | — |
| Impaired communication | See comment | — | 48 parents (1 RCT) | — | Insufficient data to pool results | |
| Stereotypical behaviours | See comment | — | 48 parents (1 RCT) | — | Insufficient data to pool results | |
| Overall ASD | See comment | — | 48 parents (1 RCT) | — | Insufficient data to pool results | |
| Secondary outcome: rate of adverse events | ||||||
| Total number of adverse events | See comment | — | 108 parents (1 RCT) | — | Insufficient data to pool resultsd | |
| *The risk in the intervention group (and its 95% CI) is based on the assumed risk in the comparison group and the relative effect of the intervention (and its 95% CI). | ||||||
| GRADE Working Group grades of evidence | ||||||
| a Downgraded one point for limitations in design and implementation. | ||||||
| Instrument | Inattention | Impulsivity | Hyperactivity | |||
| Teachera | Parent | Teachera | Parent | Teachera | Parent | |
| ABC | — | — | — | — | H , Q, R | P , R |
| ACTeRS | P | P | — | — | P | P |
| Conners' Global Index | — | — | P | P | P | P |
| CPRS‐R and CTRS‐R | P | P | — | — | P, Q | P |
| Conners' Abbreviated Parent/Teacher Questionnaire | — | — | — | — | — | — |
| SNAP‐IV | P , R | P , R | — | — | P , R | P, R |
| a'Teacher' includes clinician and trained observer raters. Letters (H, P, Q, R) indicate those studies that used a particular instrument to rate the particular outcome. Letters in bold and underlined font indicate the instrument we used in our meta‐analysis: H: Handen 2000; P: Pearson 2013; Q: Quintana 1995; R: RUPP 2005. ABC: Aberrant Behavior Checklist; ACTeRS: ADD‐H (Attention deficit disorder ‐ hyperactivity) Comprehensive Teacher Rating Scale; ADHD: attention deficit hyperactivity disorder; CPRS‐R: Conners' Parent Rating Scale ‐ Revised; CTRS‐R: Conners' Teacher Rating Scale ‐ Revised;SNAP‐IV: Swanson, Nolan, and Pelham Questionnaire, Fourth Edition. | ||||||
| Instrument | Impaired social interaction | Impaired communication | Stereotypical behaviours | Overall ASD | ||||
| Teacher a | Parent | Teacher a | Parent | Teacher a | Parent | Teacher a | Parent | |
| ABC | H | P | H | P | H , Q | P | — | — |
| ACTeRS | P | P | — | — | — | — | — | — |
| CARS | — | — | — | — | — | — | H | — |
| CYBOCS | — | — | — | — | R | — | — | — |
| CPRS‐R and CTRS‐R | P | P | — | — | — | — | — | — |
| Iowa CTRS | H | — | — | — | — | — | — | — |
| Social communication questionnaire | — | — | — | — | — | — | — | P |
| SNAP‐IV | R | R | — | — | — | — | — | — |
| Clinician Global Impression ‐ Severity | — | — | — | — | — | — | P | — |
| a'Teacher' includes clinician and trained observer raters; Letters (H, P, Q, R) indicate the studies which used a particular instrument to rate the particular outcome. Letters in bolded and underlined font indicate the instrument we used in our meta‐analysis: H: Handen 2000; P: Pearson 2013; Q: Quintana 1995; R: RUPP 2005; ABC: Aberrant Behavior Checklist; ACTeRS: ADD‐H (Attention deficit disorder ‐ hyperactivity) Comprehensive Teacher Rating Scale; ASD: autism spectrum disorders; CARS: Child Autism Rating Scale; CPRS‐R: Conners' Parent Rating Scale ‐ Revised; CTRS‐R: Conners' Teacher Rating Scale ‐ Revised; CYBOCS: Children's Yale‐Brown Obsessive Compulsive Scales;Iowa CTRS: Iowa Conners' Teacher Rating Scale; SNAP‐IV: Swanson, Nolan, and Pelham Questionnaire, 4th Edition. | ||||||||
| Outcome or subgroup title | No. of studies | No. of participants | Statistical method | Effect size |
| 1 Primary outcome: ADHD symptoms ‐ inattention (same measurement instrument) Show forest plot | 2 | Mean Difference (Random, 95% CI) | ‐2.72 [‐5.37, ‐0.06] | |
| 2 Primary outcome: ADHD symptoms ‐ hyperactivity (different measurement instrument) Show forest plot | 4 | Std. Mean Difference (Random, 95% CI) | ‐0.78 [‐1.13, ‐0.43] | |
| 3 Primary outcome: ASD symptoms Show forest plot | 4 | Std. Mean Difference (Random, 95% CI) | Subtotals only | |
| 3.1 Impaired social interaction | 3 | Std. Mean Difference (Random, 95% CI) | ‐0.51 [‐1.07, 0.05] | |
| 3.2 Stereotypical behaviours | 3 | Std. Mean Difference (Random, 95% CI) | ‐0.34 [‐0.84, 0.17] | |
| 3.3 Overall ASD | 2 | Std. Mean Difference (Random, 95% CI) | ‐0.53 [‐1.26, 0.19] | |
| 4 Secondary outcome: adverse events Show forest plot | 2 | Risk Ratio (M‐H, Random, 95% CI) | Subtotals only | |
| 4.1 Gastrointestinal effects: abdominal discomfort | 2 | 69 | Risk Ratio (M‐H, Random, 95% CI) | 3.00 [0.13, 70.16] |
| 4.2 Gastrointestinal effects: reduced appetite | 2 | 69 | Risk Ratio (M‐H, Random, 95% CI) | 1.33 [0.43, 4.12] |
| 4.3 General physical adverse effect: dizziness | 2 | 69 | Risk Ratio (M‐H, Random, 95% CI) | 0.55 [0.06, 5.18] |
| 4.4 General physical adverse effect: drowsiness | 2 | 69 | Risk Ratio (M‐H, Random, 95% CI) | 2.00 [0.47, 8.55] |
| 4.5 General physical adverse effect: headache | 2 | 69 | Risk Ratio (M‐H, Random, 95% CI) | 3.00 [0.13, 70.16] |
| 4.6 Psychological effects: anxiety | 2 | 69 | Risk Ratio (M‐H, Random, 95% CI) | 1.02 [0.47, 2.18] |
| 4.7 Psychological effects: depressed mood | 2 | 69 | Risk Ratio (M‐H, Random, 95% CI) | 1.19 [0.37, 3.79] |
| 4.8 Psychological effects: irritability | 2 | 69 | Risk Ratio (M‐H, Random, 95% CI) | 0.81 [0.29, 2.27] |
| 4.9 Repetitive behaviours: repetitive movements or tics | 2 | 69 | Risk Ratio (M‐H, Random, 95% CI) | 0.57 [0.21, 1.57] |
| Outcome or subgroup title | No. of studies | No. of participants | Statistical method | Effect size |
| 1 Primary outcome: ADHD symptoms ‐ inattention (same measurement instrument) Show forest plot | 2 | Mean Difference (Random, 95% CI) | ‐2.55 [‐5.15, 0.06] | |
| 2 Primary outcome: ADHD symptoms ‐ hyperactivity (different measurement instrument) Show forest plot | 4 | Std. Mean Difference (Random, 95% CI) | ‐0.70 [‐1.07, ‐0.33] | |
| 3 Primary outcome: ASD symptoms Show forest plot | 4 | Std. Mean Difference (Random, 95% CI) | Subtotals only | |
| 3.1 Impaired social interaction | 3 | Std. Mean Difference (Random, 95% CI) | ‐0.44 [‐0.99, 0.11] | |
| 3.2 Stereotypical behaviours | 3 | Std. Mean Difference (Random, 95% CI) | ‐0.24 [‐0.71, 0.23] | |
| 3.3 Overall ASD | 2 | Std. Mean Difference (Random, 95% CI) | ‐0.56 [‐1.28, 0.17] | |
| Outcome or subgroup title | No. of studies | No. of participants | Statistical method | Effect size |
| 1 Primary outcome: ADHD symptoms ‐ inattention (same measurement instrument) Show forest plot | 2 | Mean Difference (Random, 95% CI) | Subtotals only | |
| 2 Primary outcome: ADHD symptoms ‐ hyperactivity (different measurement instrument) Show forest plot | 4 | Std. Mean Difference (Random, 95% CI) | Subtotals only | |
| 3 Primary outcome: ASD symptoms Show forest plot | 4 | Std. Mean Difference (Random, 95% CI) | Subtotals only | |
| 3.1 Impaired social interaction | 3 | Std. Mean Difference (Random, 95% CI) | ‐0.53 [‐1.09, 0.02] | |
| 3.2 Stereotypical behaviours | 3 | Std. Mean Difference (Random, 95% CI) | ‐0.37 [‐0.87, 0.14] | |
| 3.3 Overall ASD | 2 | Std. Mean Difference (Random, 95% CI) | ‐0.53 [‐1.25, 0.20] | |
| Outcome or subgroup title | No. of studies | No. of participants | Statistical method | Effect size |
| 1 Primary outcome: ADHD ‐ hyperactivity Show forest plot | 4 | Std. Mean Difference (Random, 95% CI) | Subtotals only | |
| 1.1 ABC | 3 | Std. Mean Difference (Random, 95% CI) | ‐0.75 [‐1.21, ‐0.29] | |
| 1.2 SNAP | 2 | Std. Mean Difference (Random, 95% CI) | ‐0.65 [‐1.12, ‐0.19] | |
| 1.3 Conners' Rating Scale ‐ Revised | 2 | Std. Mean Difference (Random, 95% CI) | ‐0.87 [‐1.26, ‐0.48] | |
| Outcome or subgroup title | No. of studies | No. of participants | Statistical method | Effect size |
| 1 Primary outcome: ADHD symptoms (same measurement instrument) Show forest plot | 2 | Mean Difference (Random, 95% CI) | Subtotals only | |
| 1.1 Inattention | 2 | Mean Difference (Random, 95% CI) | ‐3.16 [‐6.89, 0.57] | |
| 1.2 Hyperactivity | 2 | Mean Difference (Random, 95% CI) | ‐6.61 [‐12.19, ‐1.03] | |
| 2 Primary outcome: ASD symptoms ‐ impaired social interaction Show forest plot | 2 | Std. Mean Difference (Random, 95% CI) | ‐0.21 [‐0.60, 0.18] | |
| 3 Secondary outcome: adverse events Show forest plot | 2 | Risk Ratio (M‐H, Random, 95% CI) | Subtotals only | |
| 3.1 Gastrointestinal effects: abdominal discomfort | 2 | 164 | Risk Ratio (M‐H, Random, 95% CI) | 4.30 [0.91, 20.34] |
| 3.2 Gastrointestinal effects: reduced appetite | 2 | 164 | Risk Ratio (M‐H, Random, 95% CI) | 8.28 [2.57, 26.73] |
| 3.3 General physical adverse effect: headache | 2 | 164 | Risk Ratio (M‐H, Random, 95% CI) | 1.87 [0.10, 33.86] |
| 3.4 General physical effect: sleep disturbance | 2 | 164 | Risk Ratio (M‐H, Random, 95% CI) | 3.51 [0.59, 20.82] |
| 3.5 Psychological effects: anxiety | 2 | 164 | Risk Ratio (M‐H, Random, 95% CI) | 1.13 [0.22, 5.79] |
| 3.6 Repetitive behaviours: general | 2 | 164 | Risk Ratio (M‐H, Random, 95% CI) | 0.87 [0.43, 1.75] |
| 3.7 Psychological effects: irritability | 2 | 164 | Risk Ratio (M‐H, Random, 95% CI) | 1.25 [0.25, 6.36] |
| 3.8 Psychological effects: depressed mood | 2 | 164 | Risk Ratio (M‐H, Random, 95% CI) | 1.75 [0.05, 62.33] |
| Outcome or subgroup title | No. of studies | No. of participants | Statistical method | Effect size |
| 1 Primary outcome: ADHD symptoms (same measurement instrument) Show forest plot | 2 | Mean Difference (Random, 95% CI) | Subtotals only | |
| 1.1 Inattention | 2 | Mean Difference (Random, 95% CI) | ‐3.11 [‐6.84, 0.62] | |
| 1.2 Hyperactivity | 2 | Mean Difference (Random, 95% CI) | ‐6.44 [‐10.00, ‐0.89] | |
| 2 Primary outcome: ASD symptoms ‐ Impaired social interaction Show forest plot | 2 | Std. Mean Difference (Random, 95% CI) | Subtotals only | |
| Outcome or subgroup title | No. of studies | No. of participants | Statistical method | Effect size |
| 1 Primary outcome: ADHD symptoms (same measurement instrument) Show forest plot | 2 | Mean Difference (Random, 95% CI) | Subtotals only | |
| 1.1 Inattention | 2 | Mean Difference (Random, 95% CI) | ‐3.18 [‐6.91, 0.56] | |
| 1.2 Hyperactivity | 2 | Mean Difference (Random, 95% CI) | ‐6.67 [‐12.25, ‐1.08] | |
| 2 Primary outcome: ASD symptoms ‐ Impaired social interaction Show forest plot | 2 | Std. Mean Difference (Random, 95% CI) | Subtotals only | |
| Outcome or subgroup title | No. of studies | No. of participants | Statistical method | Effect size |
| 1 Primary outcome: ADHD ‐ hyperactivity Show forest plot | 2 | Std. Mean Difference (Random, 95% CI) | Subtotals only | |
| 1.1 ABC | 2 | Std. Mean Difference (Random, 95% CI) | ‐0.60 [‐1.04, ‐0.16] | |
| 1.2 SNAP | 2 | Std. Mean Difference (Random, 95% CI) | ‐0.53 [‐1.04, ‐0.03] | |
| Outcome or subgroup title | No. of studies | No. of participants | Statistical method | Effect size |
| 1 Primary outcome: ADHD ‐ inattention Show forest plot | 2 | Std. Mean Difference (Random, 95% CI) | Subtotals only | |
| 1.1 Low dose | 2 | Std. Mean Difference (Random, 95% CI) | ‐0.28 [‐0.61, 0.05] | |
| 1.2 Medium dose | 2 | Std. Mean Difference (Random, 95% CI) | ‐0.46 [‐0.89, ‐0.04] | |
| 1.3 High dose | 2 | Std. Mean Difference (Random, 95% CI) | ‐0.38 [‐0.75, ‐0.02] | |
| 2 Primary outcome: ADHD ‐ hyperactivity Show forest plot | 4 | Std. Mean Difference (Random, 95% CI) | Subtotals only | |
| 2.1 Low dose | 2 | Std. Mean Difference (Random, 95% CI) | ‐0.40 [‐0.77, ‐0.03] | |
| 2.2 Medium dose | 3 | Std. Mean Difference (Random, 95% CI) | ‐0.55 [‐1.00, ‐0.10] | |
| 2.3 High dose | 4 | Std. Mean Difference (Random, 95% CI) | ‐0.78 [‐1.13, ‐0.43] | |
| 3 Primary outcome: ASD ‐ impaired social interaction Show forest plot | 3 | Std. Mean Difference (Random, 95% CI) | Subtotals only | |
| 3.1 Low dose | 2 | Std. Mean Difference (Random, 95% CI) | ‐0.30 [‐0.59, ‐0.02] | |
| 3.2 Medium dose | 3 | Std. Mean Difference (Random, 95% CI) | ‐0.44 [‐0.94, 0.06] | |
| 3.3 High dose | 3 | Std. Mean Difference (Random, 95% CI) | ‐0.51 [‐1.07, 0.05] | |
| 4 Primary outcome: ASD ‐ stereotypical behaviours Show forest plot | 3 | Std. Mean Difference (Random, 95% CI) | Subtotals only | |
| 4.1 Medium dose | 2 | Std. Mean Difference (Random, 95% CI) | ‐0.23 [‐0.43, ‐0.03] | |
| 4.2 High dose | 3 | Std. Mean Difference (Random, 95% CI) | ‐0.34 [‐0.84, 0.17] | |
| 5 Primary outcome: ASD ‐ overall ASD Show forest plot | 2 | Std. Mean Difference (Random, 95% CI) | Subtotals only | |
| 5.1 Medium dose | 2 | Std. Mean Difference (Random, 95% CI) | ‐0.52 [‐1.20, 0.17] | |
| 5.2 High dose | 2 | Std. Mean Difference (Random, 95% CI) | ‐0.54 [‐1.26, 0.19] | |
| 6 Secondary outcome: adverse events ‐ abdominal discomfort Show forest plot | 2 | Risk Ratio (M‐H, Random, 95% CI) | Subtotals only | |
| 6.1 Medium dose | 2 | 69 | Risk Ratio (M‐H, Random, 95% CI) | 0.0 [0.0, 0.0] |
| 6.2 High dose | 2 | 69 | Risk Ratio (M‐H, Random, 95% CI) | 3.00 [0.13, 70.16] |
| 7 Secondary outcome: adverse events ‐ reduced appetite Show forest plot | 2 | Risk Ratio (M‐H, Random, 95% CI) | Subtotals only | |
| 7.1 Medium dose | 2 | 69 | Risk Ratio (M‐H, Random, 95% CI) | 1.29 [0.75, 2.20] |
| 7.2 High dose | 2 | 69 | Risk Ratio (M‐H, Random, 95% CI) | 1.33 [0.43, 4.12] |
| 8 Secondary outcome: adverse events ‐ dizziness Show forest plot | 2 | Risk Ratio (M‐H, Random, 95% CI) | Subtotals only | |
| 8.1 Medium dose | 2 | 69 | Risk Ratio (M‐H, Random, 95% CI) | 0.22 [0.01, 4.06] |
| 8.2 High dose | 2 | 69 | Risk Ratio (M‐H, Random, 95% CI) | 0.55 [0.06, 5.18] |
| 9 Secondary outcome: adverse events ‐ drowsiness Show forest plot | 2 | Risk Ratio (M‐H, Random, 95% CI) | Subtotals only | |
| 9.1 Medium dose | 2 | 69 | Risk Ratio (M‐H, Random, 95% CI) | 1.27 [0.05, 32.89] |
| 9.2 High dose | 2 | 69 | Risk Ratio (M‐H, Random, 95% CI) | 2.00 [0.47, 8.55] |
| 10 Secondary outcome: adverse events ‐ headache Show forest plot | 2 | Risk Ratio (M‐H, Random, 95% CI) | Subtotals only | |
| 10.1 Medium dose | 2 | 69 | Risk Ratio (M‐H, Random, 95% CI) | 0.0 [0.0, 0.0] |
| 10.2 High dose | 2 | 69 | Risk Ratio (M‐H, Random, 95% CI) | 3.00 [0.13, 70.16] |
| 11 Secondary outcome: adverse events ‐ anxiety Show forest plot | 2 | Risk Ratio (M‐H, Random, 95% CI) | Subtotals only | |
| 11.1 Medium dose | 2 | 69 | Risk Ratio (M‐H, Random, 95% CI) | 0.68 [0.10, 4.46] |
| 11.2 High dose | 2 | 69 | Risk Ratio (M‐H, Random, 95% CI) | 1.02 [0.47, 2.18] |
| 12 Secondary outcome: adverse events ‐ depressed mood Show forest plot | 2 | Risk Ratio (M‐H, Random, 95% CI) | Subtotals only | |
| 12.1 Medium dose | 2 | 69 | Risk Ratio (M‐H, Random, 95% CI) | 1.01 [0.46, 2.26] |
| 12.2 High dose | 2 | 69 | Risk Ratio (M‐H, Random, 95% CI) | 1.19 [0.37, 3.79] |
| 13 Secondary outcome: adverse events ‐ irritability Show forest plot | 2 | Risk Ratio (M‐H, Random, 95% CI) | Subtotals only | |
| 13.1 Medium dose | 2 | 69 | Risk Ratio (M‐H, Random, 95% CI) | 0.96 [0.54, 1.70] |
| 13.2 High dose | 2 | 69 | Risk Ratio (M‐H, Random, 95% CI) | 0.81 [0.29, 2.27] |
| 14 Secondary outcome: adverse events ‐ repetitive movements Show forest plot | 2 | Risk Ratio (M‐H, Random, 95% CI) | Subtotals only | |
| 14.1 Medium dose | 2 | 69 | Risk Ratio (M‐H, Random, 95% CI) | 0.74 [0.30, 1.85] |
| 14.2 High dose | 2 | 69 | Risk Ratio (M‐H, Random, 95% CI) | 0.57 [0.21, 1.57] |
| Outcome or subgroup title | No. of studies | No. of participants | Statistical method | Effect size |
| 1 Primary outcome: ADHD ‐ inattention Show forest plot | 2 | Std. Mean Difference (Random, 95% CI) | Subtotals only | |
| 1.1 Low dose | 2 | Std. Mean Difference (Random, 95% CI) | ‐0.27 [‐0.58, 0.03] | |
| 1.2 Medium dose | 2 | Std. Mean Difference (Random, 95% CI) | ‐0.49 [‐0.85, ‐0.13] | |
| 1.3 High dose | 2 | Std. Mean Difference (Random, 95% CI) | ‐0.51 [‐1.15, 0.14] | |
| 2 Primary outcome: ADHD ‐ hyperactivity Show forest plot | 2 | Std. Mean Difference (Random, 95% CI) | Subtotals only | |
| 2.1 Low dose | 2 | Std. Mean Difference (Random, 95% CI) | ‐0.35 [‐0.55, ‐0.14] | |
| 2.2 Medium dose | 2 | Std. Mean Difference (Random, 95% CI) | ‐0.67 [‐1.01, ‐0.33] | |
| 2.3 High dose | 2 | Std. Mean Difference (Random, 95% CI) | ‐0.60 [‐1.04, ‐0.16] | |
| 3 Primary outcome: ASD ‐ impaired social interaction Show forest plot | 2 | Std. Mean Difference (Random, 95% CI) | Subtotals only | |
| 3.1 Low dose | 2 | Std. Mean Difference (Random, 95% CI) | ‐0.15 [‐0.33, 0.04] | |
| 3.2 Medium dose | 2 | Std. Mean Difference (Random, 95% CI) | ‐0.17 [‐0.37, 0.03] | |
| 3.3 High dose | 2 | Std. Mean Difference (Random, 95% CI) | ‐0.21 [‐0.60, 0.18] | |
| 4 Secondary outcome: adverse events ‐ abdominal discomfort Show forest plot | 2 | Risk Ratio (M‐H, Random, 95% CI) | Subtotals only | |
| 4.1 Low dose | 2 | 164 | Risk Ratio (M‐H, Random, 95% CI) | 1.73 [0.29, 10.34] |
| 4.2 Medium dose | 2 | 164 | Risk Ratio (M‐H, Random, 95% CI) | 4.51 [0.98, 20.67] |
| 4.3 High dose | 2 | 164 | Risk Ratio (M‐H, Random, 95% CI) | 4.30 [0.91, 20.34] |
| 5 Secondary outcome: adverse events ‐ reduced appetite Show forest plot | 2 | Risk Ratio (M‐H, Random, 95% CI) | Subtotals only | |
| 5.1 Low dose | 2 | 164 | Risk Ratio (M‐H, Random, 95% CI) | 3.41 [0.91, 12.78] |
| 5.2 Medium dose | 2 | 164 | Risk Ratio (M‐H, Random, 95% CI) | 10.00 [3.14, 31.82] |
| 5.3 High dose | 2 | 164 | Risk Ratio (M‐H, Random, 95% CI) | 8.28 [2.57, 26.73] |
| 6 Secondary outcome: adverse events ‐ headache Show forest plot | 2 | Risk Ratio (M‐H, Random, 95% CI) | Subtotals only | |
| 6.1 Low dose | 2 | 164 | Risk Ratio (M‐H, Random, 95% CI) | 1.77 [0.31, 9.94] |
| 6.2 Medium dose | 2 | 164 | Risk Ratio (M‐H, Random, 95% CI) | 2.29 [0.55, 9.58] |
| 6.3 High dose | 2 | 164 | Risk Ratio (M‐H, Random, 95% CI) | 1.87 [0.10, 33.86] |
| 7 Secondary outcome: adverse events ‐ anxiety Show forest plot | 2 | Risk Ratio (M‐H, Random, 95% CI) | Subtotals only | |
| 7.1 Low dose | 2 | 164 | Risk Ratio (M‐H, Random, 95% CI) | 1.26 [0.45, 3.52] |
| 7.2 Medium dose | 2 | 164 | Risk Ratio (M‐H, Random, 95% CI) | 1.29 [0.46, 3.58] |
| 7.3 High dose | 2 | 164 | Risk Ratio (M‐H, Random, 95% CI) | 1.13 [0.22, 5.79] |
| 8 Secondary outcome: adverse events ‐ depressed mood Show forest plot | 2 | Risk Ratio (M‐H, Random, 95% CI) | Subtotals only | |
| 8.1 Low dose | 2 | 164 | Risk Ratio (M‐H, Random, 95% CI) | 0.99 [0.22, 4.42] |
| 8.2 Medium dose | 2 | 164 | Risk Ratio (M‐H, Random, 95% CI) | 2.30 [0.39, 13.42] |
| 8.3 High dose | 2 | 164 | Risk Ratio (M‐H, Random, 95% CI) | 1.75 [0.05, 62.33] |
| 9 Secondary outcome: adverse events ‐ irritability Show forest plot | 2 | Risk Ratio (M‐H, Random, 95% CI) | Subtotals only | |
| 9.1 Low dose | 2 | 164 | Risk Ratio (M‐H, Random, 95% CI) | 1.31 [0.30, 5.83] |
| 9.2 Medium dose | 2 | 164 | Risk Ratio (M‐H, Random, 95% CI) | 1.77 [0.23, 13.47] |
| 9.3 High dose | 2 | 164 | Risk Ratio (M‐H, Random, 95% CI) | 1.25 [0.25, 6.36] |
| 10 Secondary outcome: adverse events ‐ repetitive behaviours Show forest plot | 2 | Risk Ratio (M‐H, Random, 95% CI) | Subtotals only | |
| 10.1 Low dose | 2 | 164 | Risk Ratio (M‐H, Random, 95% CI) | 0.95 [0.54, 1.66] |
| 10.2 Medium dose | 2 | 164 | Risk Ratio (M‐H, Random, 95% CI) | 1.20 [0.55, 2.62] |
| 10.3 High dose | 2 | 164 | Risk Ratio (M‐H, Random, 95% CI) | 0.87 [0.43, 1.75] |
| 11 Secondary outcome: adverse events ‐ sleep disturbance Show forest plot | 2 | Risk Ratio (M‐H, Random, 95% CI) | Subtotals only | |
| 11.1 Low dose | 2 | 164 | Risk Ratio (M‐H, Random, 95% CI) | 2.94 [0.44, 19.64] |
| 11.2 Medium dose | 2 | 164 | Risk Ratio (M‐H, Random, 95% CI) | 5.10 [0.71, 36.68] |
| 11.3 High dose | 2 | 164 | Risk Ratio (M‐H, Random, 95% CI) | 3.51 [0.59, 20.82] |