D‐dimer test for excluding the diagnosis of pulmonary embolism
Abstract
Background
Pulmonary embolism (PE) can occur when a thrombus (blood clot) travels through the veins and lodges in the arteries of the lungs, producing an obstruction. People who are thought to be at risk include those with cancer, people who have had a recent surgical procedure or have experienced long periods of immobilisation and women who are pregnant. The clinical presentation can vary, but unexplained respiratory symptoms such as difficulty breathing, chest pain and an increased respiratory rate are common.
D‐dimers are fragments of protein released into the circulation when a blood clot breaks down as a result of normal body processes or with use of prescribed fibrinolytic medication. The D‐dimer test is a laboratory assay currently used to rule out the presence of high D‐dimer plasma levels and, by association, venous thromboembolism (VTE). D‐dimer tests are rapid, simple and inexpensive and can prevent the high costs associated with expensive diagnostic tests.
Objectives
To investigate the ability of the D‐dimer test to rule out a diagnosis of acute PE in patients treated in hospital outpatient and accident and emergency (A&E) settings who have had a pre‐test probability (PTP) of PE determined according to a clinical prediction rule (CPR), by estimating the accuracy of the test according to estimates of sensitivity and specificity. The review focuses on those patients who are not already established on anticoagulation at the time of study recruitment.
Search methods
We searched 13 databases from conception until December 2013. We cross‐checked the reference lists of relevant studies.
Selection criteria
Two review authors independently applied exclusion criteria to full papers and resolved disagreements by discussion.
We included cross‐sectional studies of D‐dimer in which ventilation/perfusion (V/Q) scintigraphy, computerised tomography pulmonary angiography (CTPA), selective pulmonary angiography and magnetic resonance pulmonary angiography (MRPA) were used as the reference standard.
• Participants: Adults who were managed in hospital outpatient and A&E settings and were suspected of acute PE were eligible for inclusion in the review if they had received a pre‐test probability score based on a CPR.
• Index tests: quantitative, semi quantitative and qualitative D‐dimer tests.
• Target condition: acute symptomatic PE.
• Reference standards: We included studies that used pulmonary angiography, V/Q scintigraphy, CTPA and MRPA as reference standard tests.
Data collection and analysis
Two review authors independently extracted data and assessed quality using Quality Assessment of Diagnostic Accuracy Studies‐2 (QUADAS‐2). We resolved disagreements by discussion. Review authors extracted patient‐level data when available to populate 2 × 2 contingency tables (true‐positives (TPs), true‐negatives (TNs), false‐positives (FPs) and false‐negatives (FNs)).
Main results
We included four studies in the review (n = 1585 patients). None of the studies were at high risk of bias in any of the QUADAS‐2 domains, but some uncertainty surrounded the validity of studies in some domains for which the risk of bias was uncertain. D‐dimer assays demonstrated high sensitivity in all four studies, but with high levels of false‐positive results, especially among those over the age of 65 years. Estimates of sensitivity ranged from 80% to 100%, and estimates of specificity from 23% to 63%.
Authors' conclusions
A negative D‐dimer test is valuable in ruling out PE in patients who present to the A&E setting with a low PTP. Evidence from one study suggests that this test may have less utility in older populations, but no empirical evidence was available to support an increase in the diagnostic threshold of interpretation of D‐dimer results for those over the age of 65 years.
Plain language summary
D‐dimer for excluding pulmonary embolism in hospital outpatient and accident and emergency populations
Review question
To investigate the ability of the D‐dimer test to rule out a diagnosis of acute pulmonary embolism (PE) in patients treated in hospital outpatient and accident and emergency (A&E) departments.
Background
Pulmonary embolism (PE) is a serious, potentially fatal condition that occurs when a blood clot becomes lodged in the blood vessels of the lungs. When people arrive to hospital A&E departments reporting difficulty breathing, breathlessness and chest pain, several explanations are possible but a quick diagnosis is needed. Tests that are available to detect blood clots in the lungs can be invasive and time‐consuming, can carry a radiation burden and may be costly. Quick, easy‐to‐use and inexpensive tests that can be used to rule out the diagnosis would be very valuable.
One such test is the D‐dimer test, which is so named because it detects small pieces of protein in the blood, which are called D‐dimer. When someone with symptoms of breathlessness and chest pain arrives to the hospital A&E department, the staff conducts an examination and asks questions about the patient's medical history and lifestyle. This helps them to calculate a score for the patient's risk that symptoms are due to a PE.
If the score shows that they are at high risk of a blood clot in the lungs, patients undergo diagnostic scanning immediately (or are treated while test results are awaited). A D‐dimer test can be ordered for people in low or moderate (or unlikely) risk groups; a negative D‐dimer result might rule out the diagnosis of PE without the need for imaging.
Study characteristics
This review considered all evidence provided by studies that assess the ability of D‐dimer to rule out PE in people attending hospital outpatient and A&E departments.
We assessed all available reports from a wide search of databases of medical literature. Two review authors independently assessed studies that met the review criteria, including use of a study design called a cross‐sectional study; inclusion of people with symptoms of PE who attended hospital outpatient and A&E departments; use of a risk score and then a D‐dimer test; and comparison of results of the D‐dimer test against the results of the very best available tests ‐ ventilation/perfusion scanning (V/Q scanning), pulmonary angiography, computerised tomography pulmonary angiography, and magnetic resonance pulmonary angiography.
Key results
Four studies met our criteria, and data from 1585 patients were available. We found evidence that negative (disease absent) D‐dimer tests are very good at ruling out PE and identifying people without PE, but high numbers of false‐positive test results suggest that people with a raised D‐dimer may not in fact have a PE; therefore, a positive result needs to be followed by imaging. In one study, false‐positives were more common among people older than 65 years of age.
Quality of the evidence
The flow of patients and the timing of D‐dimer and reference standard tests were of greatest methodological concern; no study authors provided a flow diagram to show the flow of patients throughout their study, and only one study clearly reported the time between administration of index and reference standard tests. In the remaining three studies, timing between conduct of the index test and completion of the reference standard was not clearly reported, leading to an unclear classification of bias.
Conclusions
Limited evidence from the studies included in this review suggests that quantitative D‐dimer tests used in emergency departments have few false‐negatives but very high levels of false‐positive results, with a high level of sensitivity consistently evident across all age groups. This makes the test useful as a rule‐out test but means that a positive result requires diagnostic imaging.
Authors' conclusions
Summary of findings
| D‐dimer test for excluding the diagnosis of pulmonary embolism Population: people suspected of having a pulmonary embolism Index test: D‐dimer test Target condition: pulmonary embolism Reference standard: MRPA, pulmonary angiography, V/Q scintigraphy and CTPA Study design: cross‐sectional studies | |||||||
| Study ID | D‐dimer assay | Threshold | Mean age (SD or range) | CPR (cutoff) | Accuracy estimates | Numbers of patients | QUADAS‐2 risk of bias |
| Advanced D‐dimer™ Assay (Dade Behring, Inc, Deerfield, Illinois, USA) | ≥ 1.2 mg/L | 46.9 years (range 15 to 94) | Geneva low PTP: 0 to 3 | Low: sensitivity 100% (95% CI 61% to 100%) specificity 25% (95% CI 20% to 31%) TP = 6 FN = 0 TN = 69 FP = 206 | 281 (prevalence = 2%) 330 (prevalence = 5%) 16 (prevalence = 31%) | Low/Unclear risk of bias | |
| Geneva intermediate PTP: 4 to 10 | Intermediate: sensitivity 100% (95% CI 82% to 100%) specificity 33% (95% CI 28% to 38%) TP = 17 FN = 0 TN = 103 FP = 210 | ||||||
| Geneva high PTP: 11 or more points | High: sensitivity 80% (95% CI 38% to 96%) specificity 33% (95% CI 15% to 65%) TP = 4 FN = 1 TN = 4 FP = 7 | ||||||
| LIA test D‐di (Stago‐Diagnostica, Asnieres‐sur‐Seine, France) | Between 1000 mg/L and 800 mg/L | Females 54.38 ± 19.6 Males 53.7 ± 17.60 | Modified Wells low risk: ≤ 1 unlikely moderate risk: > 1 likely | At 900 mg/L sensitivity 94.4% specificity 49.1% In those younger than 40 years of age sensitivity 100% specificity 54.9% TP = unavailable FN = unavailable TN = unavailable FP = unavailable | 300 (prevalence not available) | Low/Unclear risk of bias | |
| Rapid latex agglutination assay (Tinaquant®, Roche, Basel, Switzerland) | < 0.5 mg/L | 57 years (range 27 to 80) | Wells score > 4.0 high‐risk | sensitivity 91% (95% CI 81% to 97%) specificity 63.0% (95% CI 52% to 73%) TP = 43 FN = 4 TN = 46 FP = 27 | 120 (prevalence = 39%) | Low/Unclear risk of bias | |
| Quantitative rapid immunoturbidimetric D‐dimer assay (Tinaquant D‐dimer® Roche Diagnostica, Mannheim, Germany) | < 0.5 mg/L | People with PE 62 years (range 14 to 95) People without PE 52 years (range 17 to 92) | Wells score ≤ 4 non‐high probability | < 65 years sensitivity 100% (95% CI 97% to 100%) specificity 50% (95% CI 45% to 55%) TP = 34 FN = 302 TN = 34 FP = 34 65 to 75 years sensitivity 100% (95% CI 85% to 100%) specificity 31 % (95% CI 20% to 44%) TP = 6 FN = 50 TN = 6 FP =12 > 75 years sensitivity 100% (95% CI 86% to 100%) specificity 23% (95% CI 12% to 38%) TP = 4 FN = 39 TN = 4 FP =15 | 404 (prevalence = 85%) 74 (prevalence = 76%) 62 (prevalence = 69%) | Low/Unclear risk of bias | |
| CI: confidence interval | |||||||
Background
Venous thromboembolism (VTE) is the collective term for deep vein thrombosis (DVT) and pulmonary embolism (PE). PE can occur when a thrombus (blood clot) travels through the veins and lodges in the arteries of the lungs, producing an obstruction. A variety of estimates have been presented for the incidence of PE in different populations; in the USA, the number of first‐time PEs ranges from 71 to 117 cases per 100,000 (White 2003).
People thought to be at risk include those with cancer and those who have had a recent surgical procedure, women who are pregnant and individuals who have experienced long periods of immobilisation. The clinical presentation can vary, but unexplained respiratory symptoms such as difficulty breathing, chest pain and an increased respiratory rate are commonly observed (Ainish 1999). As these features can be present in a number of other conditions, including myocardial infarction, pneumonia and heart failure (Goldhaber 1998), the diagnosis of PE can be difficult to rule out on the basis of clinical presentation alone, and it is estimated that only 25% of patients who present with symptoms and signs of PE actually have the condition (van Belle 2006). Failure to diagnose accurately and treat a PE can be fatal, and immediate treatment with an anticoagulant to prevent development of further clots is critically important (Andras 2012). Several radiological and laboratory tests are used to diagnose PE; these tests exhibit different accuracies, have different costs and, because some are invasive and others non‐invasive, are associated with different levels of risk (Goodacre 2006; Yoo 2012).
D‐dimers are fragments of protein released into the circulation when a blood clot breaks down as a result of normal body processes or with use of prescribed fibrinolytic medication. The normal level of plasma D‐dimer is usually less than 500 micrograms per litre (µg/L) (upper limit of normal can vary depending on method of measurement), and a higher level of D‐dimer may be due to the presence of a DVT or PE. D‐dimers can be measured by an enzyme‐linked immunosorbent assay (ELISA) or by use of coated latex particles that agglutinate in the presence of plasma containing D‐dimer, with the degree of agglutination directly proportionate to the concentration of D‐dimer in the plasma (Than 2009). However, plasma D‐dimer levels can be influenced by a person's age, by whether he or she has cancer or has had recent surgery or by pregnancy, leading to false‐positive test results. As D‐dimer antigen levels are raised in the acute phase of PE for around seven days, patients with a PE who present late may have low levels of D‐dimer (Schreiber 2002).
Use of D‐dimer in the diagnostic pathway is usually preceded by calculation of a pre‐test probability with a clinical prediction rule (CPR) such as the Charlotte or Wells score (see Figure 1 and Clinical pathway section below). Patients who are judged likely to have PE (have a high pre‐test probability) do not usually receive a D‐dimer test; instead, they undergo computerised tomography pulmonary angiography (CTPA) or ventilation/perfusion scintigraphy (V/Q scan). Patients judged to have a low pre‐test probability are given a D‐dimer test. If the result of the D‐dimer is positive, patients will then have a CTPA or V/Q scan. Those with a negative D‐dimer test result following a low probability CPR score are considered to not have a PE (NCGC 2012).

Clinical pathway.
A previous systematic review included patients recruited with VTE (that is, both DVT and PE) from both inpatient and outpatient settings (Di Nisio 2007). Our Cochrane review will focus on patients with PE in the outpatient setting alone. Most inpatients who experience symptoms or signs suggestive of PE are likely to have a raised D‐dimer for other reasons, making the test of little use (Schrecengost 2003).
Tests used to reach a definitive diagnosis of PE include selective pulmonary angiography, CTPA, V/Q scanning and magnetic resonance pulmonary angiography (MRPA). Selective pulmonary angiography is an invasive procedure involving insertion into the vascular system, via the arm, groin or neck, of a catheter, which is then guided until it reaches the pulmonary artery. Once the catheter is in place, a contrast agent is injected into the catheter and a series of x‐rays are taken, allowing the contrast agent to indicate blockages in the arteries. Aside from possible injury from the catheter or contrast reaction, patients receive a dose of radiation. During V/Q scanning, patients have to inhale a gaseous radionuclide and receive an injection of a radioactive agent. By detecting radiation, a scintillation camera then captures images that show circulation of both air and blood in the lungs. CTPA is less invasive than pulmonary angiography but requires the use of a potentially nephrotoxic contrast agent and x‐rays. MRPA does not use x‐rays but instead models the response of hydrogen atoms within the body to very strong magnetic fields to produce images. MRPA is therefore unsuitable for patients fitted with pacemakers or other metallic devices, and for those who suffer from claustrophobia, owing to the fact that patients have to lie in a narrow space for the MRPA scan to take place. Although it has been found to be accurate for the diagnosis of proximal PE, MRPA exhibits limited sensitivity for distal (small vessel) disease (Revel 2012) and requires injection of a potentially nephrotoxic contrast agent. Both CTPA and MRPA are considered less invasive and therefore are generally used in preference to selective pulmonary angiography. V/Q scanning is of limited value for those with other cardiorespiratory conditions and is helpful in those with renal failure. However, all of these tests have drawbacks, including their invasive nature, use of chemicals, radiation burden and comparative lack of accessibility, for example, computed tomography (CT) or magnetic resonance (MR) scanner time is not always readily available for comparison with the D‐dimer test. Advantages of these tests over D‐dimer include that they are more accurate and so can be used to diagnose PE, while D‐dimer can be used only to exclude PE. We will use these tests as reference standards.
Target condition being diagnosed
Acute pulmonary embolism.
Index test(s)
The D‐dimer test is a laboratory assay currently used to rule out the presence of high D‐dimer plasma levels and, by association, PE. It is used as an add‐on test in practice, and a normal D‐dimer on its own is sufficient to rule out PE in patients with a low or moderate/unlikely score or unlikely pre‐test probability from a CPR. These tests use routine blood samples and are rapid, simple and inexpensive. D‐dimer tests are classified in three different ways according to the manner in which test results are obtained (with final detection using fluorescence, immunosorbent assay or agglutination techniques): quantitative, semi quantitative or qualitative (Goodacre 2006).
Quantitative D‐dimer tests measure the plasma concentration of D‐dimer. Examples of these D‐dimer tests include enzyme‐linked immunofluorescent immunoassays (ELFAs), microplate enzyme‐linked immunosorbent assays (ELISAs) and latex quantitative and latex semi quantitative tests. Qualitative D‐dimer tests are also available. Some D‐dimer tests are available for point of care (POC) use. They have a rapid turn‐around time and are inexpensive. Lack of standardisation of D‐dimer assays means that results from one assay cannot be generalised to other assays.
A systematic review by Becker 1996 found that a variety of thresholds have been used in primary studies even for the same tests. Therefore, we intend to include all evaluations of the diagnostic test accuracy of D‐dimer regardless of the threshold used to define a positive test result.
Pre‐test probability score using clinical prediction rules (CPRs)
Assessment of the pre‐test probability (PTP) of a PE is considered a standard component of current clinical practice; therefore, we included only studies that assess the PTP of PE using a CPR. Many CPRs are available for assessing the PTP of PE; a systematic review identified those that have been most extensively subjected to validation (Ceriani 2010; Wells 1997). We included studies that assess the PTP of PE using any of the following CPRs as part of the diagnostic strategy involving any D‐dimer test: Geneva (including Revised and Revised Simplified), Wells (two‐level, three‐level and simplified) and the Charlotte rule. Table 1 shows commonly used CPRs and their scoring systems for assessment of the PTP of PE. We did not use the Miniati rule, which was assessed in a systematic review (Ceriani 2010), because it does not provide an easy method of scoring patients: Users of the Miniati rule have to calculate a probability from the co‐efficients of a logistic regression model, making it less likely to be used than CPRs with easy scoring systems (Laupacis 1997).
| CPR | Predictive elements and scoring system |
| Three‐level Wells score | Predictive elements of this CPR include clinical signs and symptoms of DVT (3 points), alternative diagnosis less likely than PE (3 points), heart rate > 100 beats per minute (1.5 points), immobilisation for longer than 3 days or recent (< 4 weeks) surgery (1.5 points), previous VTE (1.5 points), haemoptysis (1 point), cancer treatment in the previous 6 months or palliative care (1 point) Low probability ‐ less than 2; intermediate probability ‐ 2 to 6; high probability ‐ more than 6 |
| Two‐level Wells score | Predictive elements for the 2‐level Wells score are the same as for the 3‐level Wells score, but patients are categorised into 2 as opposed to 3 categories, PE likely or PE unlikely based on a score of more than 4 or 4 or fewer points, respectively |
| Simplified Wells score | Same predictive elements are used as for the 3‐level Wells score, but the point scoring has been simplified ‐ each item now scores 1 point. Patients are regarded as low risk if they have 1 point or less, and as high risk if they score more than 1 |
| Geneva score | Predictive elements of the Geneva score include recent surgery (3 points), previous history of PE or DVT (2 points), heart rate > 100 beats per minute (1 point), 60 to 79 years old (1 point), 80 years old or older (2 points), chest radiograph showing atelectasis (1 point), chest radiograph showing elevated hemidiaphragm (1 point), partial pressure of oxygen (PaO2) < 49 mm Hg (4 points), PaO2 49 to 59 mm Hg (3 points), PaO2 60 to 71 mm Hg (2 points), PaO2 72 to 82 mm Hg (1 point) and partial pressure of carbon dioxide (PaCO2) < 36 mm Hg (2 points), PaCO2 36 to 38.9 mm Hg (1 point) Risk of PE is scored low (0 to 4 points), intermediate (5 to 8 points) or high (9 or more points) |
| Revised Geneva score | Predictive elements of the revised Geneva score include age > 65 years (1 point), previous history of PE or DVT (3 points), surgery with general anaesthesia or fracture within 1 month of symptoms arising (2 points), active malignancy (2 points), heart rate 75 to 94 beats per minute (3 points), heart rate > 94 beats per minute (5 points), pain on leg venous palpation and unilateral oedema (4 points), haemoptysis (2 points) and unilateral leg pain (3 points) This CPR is scored low risk (0 to 3 points), intermediate risk (4 to 10 points) or high risk (11 or more points) |
| Simplified revised Geneva score | Same predictive elements are used as for the revised Geneva score, but point scoring has been simplified. Each item now scores 1 point Risk of PE is scored low (0 to 1 point), intermediate (2 to 4 points) or high (5 or more points) |
| Charlotte rule | Elements of the Charlotte rule include > 50 years old, heart rate higher than systolic blood pressure, unexplained hypoxaemia (O2 < 95%), recent surgery (previous 4 weeks), haemoptysis and unilateral leg swelling Risk score from the Charlotte rule is classified as safe (all predictive elements absent) or unsafe (any of the predictive elements present) |
CPR: clinical prediction rule
DVT: deep vein thrombosis
PE: pulmonary embolism
VTE: Venous thromboembolism
See Table 1.
Clinical pathway
As explained above, symptomatic patients generally undergo PTP testing by the PE Wells test before they are given any D‐dimer test (Ceriani 2010; NCGC 2012; Wells 2006). The two‐level Wells test is a CPR that provides patient points for each criterion met (e.g. previous history of PE or DVT, clinical signs of PE, recent surgery or immobilisation, heart rate > 100 beats per minute (bpm)). The maximum score is 12.5 points; the clinical probability of PE is considered unlikely if the score is 4 or less, and high if the score is higher than 4. The three‐level Wells test uses the same scoring system, with scores from 0 to 1 indicating low risk, 2 to 6 intermediate risk and higher than 6 high risk (Wells 2007).
Symptomatic patients considered to be at low risk by the CPR will generally undergo D‐dimer testing. A normal D‐dimer in patients with a low or unlikely PTP can be used to rule out PE. In these circumstances, doctors will look for non‐PE causes of the symptoms. Patients with a low risk score but a positive D‐dimer test are referred for CTPA or V/Q scanning. Patients with a high risk score usually do not receive a D‐dimer test but are directly referred for CTPA or V/Q scanning. Furthermore, patients may be offered anticoagulation treatment before the CTPA scan if rapid access is not available and they are classed as high risk by the CPR or have a positive D‐dimer test result.
Rationale
Pulmonary embolism is difficult to rule out on the basis of clinical features. Although unnecessary treatment of patients with anticoagulants carries risk, the mortality rate for people with PE in whom the condition is not recognised and consequently remains untreated is 22% (Wells 2007). A quick, accurate diagnostic test that can rule out the condition and reduce the need for diagnostic imaging represents a clear improvement for treatment of people with this acute condition.
Objectives
To investigate the ability of the D‐dimer test to rule out a diagnosis of acute PE in patients treated in hospital outpatient and accident and emergency (A&E) settings who have had a pre‐test probability (PTP) of PE determined according to a clinical prediction rule (CPR), by estimating the accuracy of the test according to estimates of sensitivity and specificity. The review focuses on those patients who are not already established on anticoagulation at the time of study recruitment.
Secondary objectives
To investigate the following as potential sources of heterogeneity: age, sex, previous PE, prolonged immobilisation and type of reference standard. We recognise that all of these listed items except type of reference standard are patient‐specific rather than study‐specific, and we anticipate that study reports may lack the necessary level of detail to enable an informative analysis.
Methods
Criteria for considering studies for this review
Types of studies
We included cross‐sectional studies evaluating the diagnostic test accuracy of D‐dimer and diagnostic cohort studies, including both prospective and retrospective designs. We excluded diagnostic case‐control studies (two‐gate design). Case‐control designs are known to overestimate the sensitivity and specificity of a diagnostic test in clinical practice (Rutjes 2005). In this review, we considered studies that use a CPR with D‐dimer testing to rule out PE in patients treated in outpatient and A&E departments. Specifically, we included studies that recruited symptomatic outpatients with low‐, intermediate‐ or high‐risk CPR scores.
Participants
Adults treated in hospital outpatient and A&E settings and suspected of acute PE as a result of clinical features such as breathlessness, chest pain, coughing up blood, increased respiratory rate, tachycardia, low blood pressure and fainting, in whom a PTP of PE has been assessed by a CPR for PE (examples of which can be found above under the heading Index test(s)) were eligible for inclusion in the review. When the data were available, we intended to group patients according to whether or not they received anticoagulant treatment, the specific CPR and the D‐dimer assay, as these are not standardised (Schreiber 2002).
Patients with indeterminate or conflicting test results may undergo repeat imaging; the most commonly used imaging test for this is CTPA or V/Q scanning, but eligibility criteria of the review specify inclusion only of studies investigating the diagnostic accuracy of the initial D‐dimer test. We excluded studies that included pregnant women, people with cancer and mixed groups of patients, when results were not reported separately for those who are pregnant or with and without cancer.
Index tests
Quantitative, semi quantitative and qualitative D‐dimer tests.
Target conditions
Acute pulmonary embolism (PE).
Reference standards
We included studies that used various reference standards (RS) encompassing pulmonary angiography, V/Q scintigraphy, CTPA and MRPA. We judged all patients' D‐dimer tests (index tests) against these reference tests.
Search methods for identification of studies
We applied no restrictions in terms of date, language of publication or publication status, and we used no diagnostic methodology search filters.
Electronic searches
We searched the following databases (date of last search 12 December 2013).
-
MEDLINE (Ovid SP).
-
EMBASE (Ovid SP).
-
Cumulative Index to Nursing and Allied Health Literature (CINAHL) (via EBSCO).
-
Latin American and Caribbean Health Science Information Database (LILACS) (Bireme).
-
Database of Abstracts of Reviews of Effects (DARE) and the Health Technology Assessment Database (HTA) in The Cochrane Library.
-
Institute for Scientific Information (ISI) Conference Proceedings Citation Index ‐ Science.
-
British Library Zetoc conference search (http://zetoc.mimas.ac.uk/wzgw?f=f&form=conference&id=31759069).
-
MEDION (www.mediondatabase.nl/), via the 'Systematic Reviews of Diagnostic Studies' search filter.
We used the search strategies shown in Appendix 1; Appendix 2; Appendix 3; Appendix 4; Appendix 5; Appendix 6; Appendix 7 and Appendix 8.
We searched the following trial databases for details of ongoing and unpublished studies.
-
World Health Organization International Clinical Trials Registry Platform (http://apps.who.int/trialsearch/).
-
ClinicalTrials.gov (http://clinicaltrials.gov/).
-
Current Controlled Trials (http://www.controlled‐trials.com/).
We used the search strategies shown in Appendix 9; Appendix 10 and Appendix 11.
Searching other resources
We checked the reference lists of primary studies and reviews identified through electronic searches.
Data collection and analysis
Selection of studies
One review author (FC) screened titles and abstracts retrieved by electronic searches, and a second review author (AA) checked a random sample of 10% (n = 500) of identified titles and abstracts. Disagreement was less than 80%, and we resolved disagreements by discussion. One review author (FC) obtained and screened 782 full‐text reports, identifying 54 full‐text papers for potential eligibility. Two review authors (FC and AA) independently applied the inclusion criteria to all 54 full‐text reports and disagreed about the inclusion of five (9%) studies; after discussion, we excluded all five studies. We present a PRISMA (Preferred Reporting Items for Systematic Reviews and Meta‐Analyses) flow diagram in Figure 2 to show the decision‐making process for including studies in the review (PRISMA 2009).

Given that reporting in abstracts is necessarily sparse, we (FC and AA) checked the full‐text articles to ascertain the following: A 2 × 2 contingency table was supplied or could be back‐calculated, all patients were outpatients or A&E patients and had a PTP calculated according to one of the specified CPRs and the reference standard used was pulmonary angiography, CTPA, V/Q scanning or MRPA. We reported in the PRISMA flow diagram the number of studies failing these criteria.
Data extraction and management
Two review authors (FC and AA) independently replicated data extraction using a standard form. Data collected included details about study design, characteristics of the patient population (age, sex, elements of patient history such as prolonged immobilisation, cancer, recent surgical procedures or previous PE), D‐dimer tests given (nature of the D‐dimer test such as ELISA, latex agglutination assay, whole blood agglutination), CPRs and all reference standard tests used and data regarding the threshold applied for each test. We also extracted the methods used to conduct each test along with 2 × 2 accuracy data.
The 2 × 2 accuracy data comprise cross‐tabulated results of D‐dimer tests and reference standards reported in 2 × 2 contingency tables. We extracted patient‐level data to populate 2 × 2 contingency tables (true‐positives (TPs), true‐negatives (TNs), false‐positives (FPs) and false‐negatives (FNs)) as reported, or we back‐calculated data from estimates of sensitivity, specificity, positive predictive value, negative predictive value and number of patients. We extracted accuracy data and compared them for patient subgroups classified by PTP as low, intermediate and high.
The data extraction form incorporated a quality assessment section comprising items from Quality Assessment of Diagnostic Accuracy Studies‐2 (QUADAS‐2) (Whiting 2011). We collected data on mortality, adverse events and numbers of technical failures for both D‐dimer and reference standard tests, when available, together with information on the anticoagulant status of patients. Review authors corroborated their extracted data and resolved differences in quality assessment by discussion.
Assessment of methodological quality
We used the QUADAS‐2 (Whiting 2011) to incorporate the review question, a flow diagram when necessary and an assessment of risk of bias and applicability judgements. Review‐specific signalling questions and appropriate items concerning the applicability of primary studies relative to the review, together with guidance about ratings, can be found in Appendix 12. Two review authors working independently piloted the data extraction and quality assessment tools before use.
Statistical analysis and data synthesis
We extracted 2 × 2 contingency tables to estimate sensitivity and specificity for each study. We intended that these estimates would be used to create receiver operating characteristic (ROC) plots and forest plots for all studies.
Quantitative D‐dimer tests are used with explicit thresholds, and 500 µg/L is a common choice (Schouten 2013). If we had found sufficient studies using this threshold, we would have performed a bivariate random‐effects model meta‐analysis of sensitivity and specificity to produce clinically applicable summary estimates of sensitivity and specificity. However, we found only four studies in total, and this method of meta‐analysis was not possible with only four studies. The bivariate (and equivalent hierarchical summary receiver operating characteristic (HSROC)) model for meta‐analysis of diagnostic studies requires estimation of five parameters. It is a relatively complex meta‐analysis model in comparison with those used for randomised controlled trials (RCTs) owing to the two‐dimensional nature of the data (sensitivity and specificity). Complex models need additional data to ensure adequate estimation of all parameters.
We expected to include studies using qualitative D‐dimer tests with no explicit threshold, and so we would have considered fitting the HSROC model to the data and presenting results as summary ROC (SROC) curves to give an indication of the global performance of qualitative D‐dimer tests (Harbord 2007), but again the number of studies was insufficient for this analysis. In our protocol, we specified that we would need a minimum of six studies to assess the suitability of studies for meta‐analysis.
If the model fit of the bivariate or HSROC model were not acceptable, we considered performing univariate meta‐analyses for sensitivity and specificity. However, methodological differences between studies (e.g. type of D‐dimer used) would have made the results of any such meta‐analysis dubious.
Investigations of heterogeneity
In our investigations of heterogeneity, we intended to specifically investigate types of reference standards and age, sex and aspects of patient history (prolonged immobilisation or previous PE) by including these as co‐variates in the meta‐analysis (Di Nisio 2007).
We planned that each meta‐regression would be carried out separately for each index test and each patient group by adding the items as co‐variates to the bivariate model. When data for our prespecified variables were insufficient, we intended to consider analysing one or two other items when data were available and were considered to be clinically relevant, and we intended to clearly label these as post hoc in the review.
We intended that we would examine other potential sources graphically for signs that they are a cause of heterogeneity (Smidt 2008). We would group estimates according to all items listed as potential sources of heterogeneity and presented in forest and ROC plots for visual assessment of heterogeneity.
However, we were unable to carry out any of our planned analyses owing to an insufficient number of studies.
Sensitivity analyses
We planned to perform separate meta‐analyses on groups of studies by which groups would be assigned according to CPR, anticoagulant treatment and specific D‐dimer assay. The disease spectrum of patients could vary with CPR and thus affect the estimates of sensitivity and specificity. We were aware that anticoagulant treatment could cause disease progression bias if administered between D‐dimer testing and use of the reference standard. D‐dimer assays are not standardised and so may have different accuracies. Again, given the small number of studies, we did not attempt to perform any sensitivity analyses.
Assessment of reporting bias
Methods for dealing with publication bias in reviews of diagnostic accuracy studies are relatively underdeveloped. Consequently, we interpreted our results cautiously and with awareness of the likelihood of publication bias. Had we undertaken a meta‐analysis of data, we would have considered using a funnel plot of the log of the diagnostic odds ratio (lnDOR) (Deeks 2005) when heterogeneity was low in the lnDOR.
Results
Results of the search
See the study flow diagram (Figure 2).
We obtained and scrutinised a total of 54 full‐text reports to assess their eligibility for inclusion in the review. Forty‐seven studies (50 reports) did not meet the eligibility criteria, and we excluded them (Barsotti 1987; Bounameaux 1988; Bounameaux 1991; Bounameaux 1992; Christopher Study; Courtney 2008; deBastos 2008; Demers 1992; de Moerloose 1996; Djurabi 2009; Douma 2011; Eilas 2005; Faivre 1990; Friera‐Reyes 2005; Gavaud 1996; Geersing 2012; Ghanima 2005; Ghanima 2007; Goekoop 2007; Harper 2007; Hirai 2007; Hochuli 2007; Hogg 2005; Kabrhel 2007; Kline 1997; Kline 2002; Kline 2006; Kovacs 2001; Laaban 1997; LeGal 2006; Legani 2009; Lucassen 2010; Lucassen 2013; Parent 2007; Park 2008; Perrier 1996; Perrier 1997; Ray 2006; Reber 2007; Righini 2004; Scarvelis 2008; Sebestyen 1990; Soo Hoo 2011; Soons 2000; Than 2009; Waser 2005; Yamaki 2007).
We have provided details of the reasons for exclusion of each of these studies in the Characteristics of excluded studies table. In brief, a common reason for exclusion was the fact that studies did not include all patients who had a D‐dimer test in the analysis (e.g. all patients with a positive test result) (Courtney 2008; deBastos 2008; Djurabi 2009; Friera‐Reyes 2005; Ghanima 2005; Ghanima 2007; Goekoop 2007; Kovacs 2001; Righini 2004). Another common reason for exclusion was the omission of a CPR in the diagnostic pathway to assess the pre‐test probability of study patients (Bounameaux 1988; Bounameaux 1991; de Moerloose 1996; Demers 1992; Faivre 1990; Gavaud 1996; Harper 2007; Kline 1997; Laaban 1997; LeGal 2006; Perrier 1996; Perrier 1997; Ray 2006; Sebestyen 1990; Soons 2000). We were unable to obtain copies of two reports (Ahamad 2000; Undurrage 2001) for which citations are listed in the Studies awaiting classification section. We have included four studies in the review (Gupta 2009; Raviv 2012; Soderberg 2009; Sohne 2004).
Methodological quality of included studies
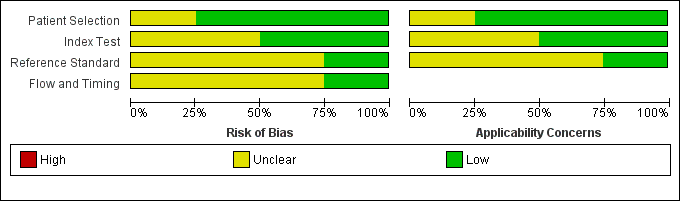
Risk of bias and applicability concerns graph: review authors' judgements about each domain presented as percentages across included studies.

Risk of bias and applicability concerns summary: review authors' judgements about each domain for each included study.
We have included four studies in the review (Gupta 2009; Raviv 2012; Soderberg 2009; Sohne 2004). The Characteristics of included studies table incorporates the methodological quality assessment. We assessed no study as having low risk of bias in all domains, but we found no instances of high risk of bias in any of the quality items. We explain below instances when we considered study quality to be at unclear risk of bias. We grouped QUADAS‐2 quality assessment items into four domains: patient selection, index test, reference standard and flow and timing.
In three studies (Gupta 2009; Raviv 2012; Sohne 2004), risk of bias arising from patient selection was low, and in one study (Soderberg 2009), the risk was considered to be unclear, because although the variables used to calculate a Wells score were prospectively collected by investigators, the Wells pre‐test probabilities were scored retrospectively. All four studies recruited a consecutive sample of patients with potential symptoms and signs of PE, and all included patient populations appropriate for this review question.
All four studies described the conduct of D‐dimer index tests well, but two studies reported no information about the thresholds used to interpret D‐dimer test results (Gupta 2009; Raviv 2012), leading to unclear risk of bias. All except one study provided a description of the reference standard (Raviv 2012), but three reports did not provide information about the way reference standard test results were interpreted (Gupta 2009; Raviv 2012; Sohne 2004).
Flow of patients and timing of the conduct of D‐dimer and reference standard tests were of greatest methodological concern; no study authors provided a flow diagram to show the flow of patients throughout their study, and only one study clearly reported the time between conduct of index and reference standard tests (Soderberg 2009). The remaining three studies (Gupta 2009; Raviv 2012; Sohne 2004) did not clearly report the timing between conduct of the index test and use of the reference standard, leading to an unclear classification of bias.
We have presented details of the conduct of D‐dimer and reference standard tests in the Characteristics of included studies table.
Findings
Four studies met the eligibility criteria, and we have included them in the review (Gupta 2009; Raviv 2012; Soderberg 2009; Sohne 2004). Details of these studies can be found in the Characteristics of included studies table. Below we summarise review findings, including details of the patient population, CPRs used to calculate pre‐test probability, the index test, the diagnostic threshold set by primary study authors and reference standards used to confirm the diagnosis. We have presented estimates of sensitivity and specificity that we recalculated on the basis of accuracy data from three studies (Gupta 2009; Soderberg 2009; Sohne 2004), and we have reproduced reported estimates from the fourth study (Raviv 2012).
All D‐dimer index tests evaluated were quantitative assays performed on 1585 patients.
In the study by Gupta 2009, 627 patients with clinically suspected PE presenting to the emergency department of a community teaching hospital had their pre‐test probability of PE scored on the basis of the Geneva CPR (low clinical probability: 0 to 3 points; intermediate clinical probability: 4 to 10 points; high clinical probability: 11 points or more). Investigators used Advanced D‐dimer™ Assay (Dade Behring, Inc, Deerfield, Illinois, USA) with the diagnostic threshold set at, or above, 1.2 mg/L. They confirmed the diagnosis by using computerised tomography pulmonary angiography (CTPA) as the reference standard. For patients in the low clinical probability group, sensitivity was 100% (95% confidence interval (CI) 61% to 100%) and specificity was 25% (95% CI 20% to 31%). For the intermediate clinical probability group, sensitivity was 100% (95% CI 82% to 100%) and specificity 33% (95% CI 28% to 38%). Sensitivity and specificity were 80% (95% CI 38% to 96%) and 37% (95% CI 15% to 65%) for the high clinical probability group, respectively.
Raviv 2012 recruited 300 people with a suspected presentation of PE in the emergency room of a medical centre in Israel. The index test used LIA test D‐di (Stago‐Diagnostica, Asnieres‐sur‐Seine, France) thresholds between 800 ng/mL and 1000 ng/mL (or equivalently, 800 mg/L and 1000 mg/L were used to evaluate the accuracy of a higher D‐dimer threshold) to rule out the presence of PE. A modified Wells CPR classified patient pre‐test probability score as showing low or moderate risk. Most reference standard tests were angiograms, but they could take the form of other imaging tests, in particular, researchers used lung scans when patients were unable to undergo CTPA. A D‐dimer threshold of 900 mg/L was reported to achieve the highest sensitivity at 94.4% and the highest specificity at 49.1%. Estimates of D‐dimer accuracy in patients younger than 40 years of age were reported to be higher (sensitivity 100% and specificity 54.9%). Unfortunately, investigators provided no confidence intervals for these estimates, and the differences may have arisen by chance. We were unable to extract from the report the numbers of TPs, TNs, FPs, and FNs, and failed to obtain this information from study authors.
Soderberg 2009 recruited 120 people attending the emergency departments of two hospitals in Sweden who had a high clinical probability of PE.. Investigators calculated pre‐test probability using the Wells CPR, before using a rapid latex agglutination assay (Tinaquant®, Roche, Basel, Switzerland) to measure D‐dimer levels tested on a whole plasma sample. The reference standard test consisted of pulmonary angiography or CTPA, or both, performed within 48 hours of the D‐dimer test, and patients received low‐molecular‐weight heparin at a dose of 175 to 200 U/kg subcutaneously, or unfractionated heparin 5000 IU intravenously, before reference standard investigations were performed when results of the D‐dimer test were greater than the threshold of < 0.5 mg L‐1. Sensitivity was 91% (95% CI 81% to 97%) and specificity 63.0% (95% CI 52% to 73%). The positive predictive value was 61%, and the negative predictive value 92%.
Sohne 2004 recruited hospital inpatients and outpatients to a study conducted at the Amsterdam Medical Centre in the Netherlands. General practitioners referred 538 outpatients for clinical suspicion of acute PE. Investigators used the Wells CPR to calculate pre‐test probability scores and included in the study those at low risk of PE. They used a rapid immunoturbidimetric D‐dimer assay (Tinaquant D‐dimer®, Roche Diagnostica, Mannheim, Germany) to measure D‐dimer levels. The threshold for a positive D‐dimer test result was 0.5 mg/L, and the reference standard was a V/Q scan in combination with compression ultrasonography or pulmonary angiography. Patients with abnormal reference standard test results were considered to have PE and received treatment with anticoagulant therapy. Researchers followed up with all patients at three months, and stratified estimates of sensitivity and specificity for the outpatient population according to age. Among people aged < 65 years, sensitivity was 100% (95% CI 97% to 100%) and specificity was 50% (95% CI 45% to 55%). For individuals between 65 and 75 years of age, sensitivity was 100% (95% CI 85% to 100%) and specificity 31% (95% CI 20% to 44%). For people > 75 years of age, sensitivity was 100% (95% CI 86% to 100%) and specificity 23% (95% CI 12% to 38%). Estimates of D‐dimer accuracy based on 2 × 2 data from the entire study population were 100% (95% CI 97% to 100%) for sensitivity and 45% (95% CI 40% to 50%) for specificity.
Discussion
Limited evidence provided by the studies included in this review suggests that quantitative D‐dimer tests used in emergency departments result in few false‐negatives but very high levels of false‐positive results, with a high level of sensitivity consistently evident across all age groups. This makes the test useful as a rule‐out test but means that a positive result will require further investigation with diagnostic imaging test(s).
All four studies reviewed reported high numbers of false‐positives. We found specificity to be lower among those over the age of 65 years in one study, and it appeared to decrease as patient age increased, but this finding did not reach statistical significance (Sohne 2004): D‐dimer assays have been shown to possess lowest specificity in those over 75 years of age, for whom the natural D‐dimer concentration is expected to be higher (Schreiber 2002). The poor specificity of D‐dimer has long been a concern of those diagnosing pulmonary embolism (PE) who are keen to find a cheap, quick and simple‐to‐use alternative to resource‐intensive diagnostic imaging tests and their potential adverse effects (Kabrhel 2006).
Authors of another systematic review evaluating the performance of D‐dimer assays in older patients with suspected venous thromboembolism (VTE), which included some patients with PE (Schouten 2013), reported age‐related false‐positive results. Data from 13 cohorts of patients with VTE (n = 12,630), none of which met the eligibility criteria for this review, showed an increase in the number of false‐positives with increasing age.
It has been suggested that one solution might be to use a higher threshold for interpretation of D‐dimer test results to improve its specificity in older age groups. Unfortunately, we found no evidence to support this suggestion; of the two studies with the highest concentration thresholds of D‐dimer, one did not present accuracy data according to patient age (Gupta 2009), and we were unable to extract accuracy data (true‐positive (TP), true‐negative (TN), false‐positive (FP) and false‐negative (FN)) data from the other study (Raviv 2012).
Only one study included patients with high pre‐test probability (PTP) scores (Gupta 2009); in this group, sensitivity was 80%, compared with 100% in those with low or intermediate PTP. The proportion of disease‐positive patients (prevalence) varied among different patient groups within studies and across studies. It has been suggested that differences in the prevalence of disease among populations can affect the accuracy of a test, but this does not appear to have influenced test accuracy in this circumstance (Leeflang 2009).
We were unable to perform a meta‐analysis of 2 × 2 data because of the small number of identified studies (n = 4), and we would advise against over‐interpretation of review findings.
Data from the studies included in our review show that dimer assays can rule out PE, but the low specificity of positive tests means that further research to try to refine the testing pathway is merited, especially in older age groups. Healthcare professionals working in emergency departments should be aware that using the D‐dimer test to rule out PE in older people may not lead to a reduction in the ordering of other, more expensive tests. Therefore, the cost‐effectiveness of the diagnostic pathway deserves consideration by those designing future research studies.
Summary of main results
We have tabulated a summary of the main results from this review in summary of findings Table.
Strengths and weaknesses of the review
The strength of this review is the adoption of high methodological standards, in particular, screening of 4870 records and detailed scrutiny of 54 studies allowed us to make important recommendations for future research about the diagnostic accuracy of D‐dimer for excluding PE in outpatient and emergency patient populations. These recommendations relate to both the methodological conduct of future studies and the clinical question that remains unanswered.
Weaknesses of the review include the small number of included eligible studies, data from which were unsuitable for pooling in a meta‐analysis. Key differences between studies include differences between clinical prediction rules (CPRs), D‐dimer assays and thresholds used.
Applicability of findings to the review question
The findings of this review are applicable to the review question, but in some included studies, information about interpretation of index and reference standard test results is lacking, as are details of the time period between administration of index and reference standard tests. A high proportion of studies identified by our search did not meet the eligibility criteria of the review, and we therefore excluded them (Characteristics of excluded studies). In most cases, we excluded studies because they did not include in the analysis all patients who had a D‐dimer test (e.g. all patients with a positive test result), or they did not report reference standard test results for all patients. These methodological weaknesses could result in bias and over‐estimation of the accuracy of the test. Another common reason for exclusion was the omission of a CPR in the diagnostic pathway used to assess study patients' pre‐test probability. As this is standard clinical practice, we considered use of a CPR an essential component of included studies, to ensure that findings of the review were applicable to the review question and informative of the usual diagnostic pathways found in routine clinical practice.

Clinical pathway.
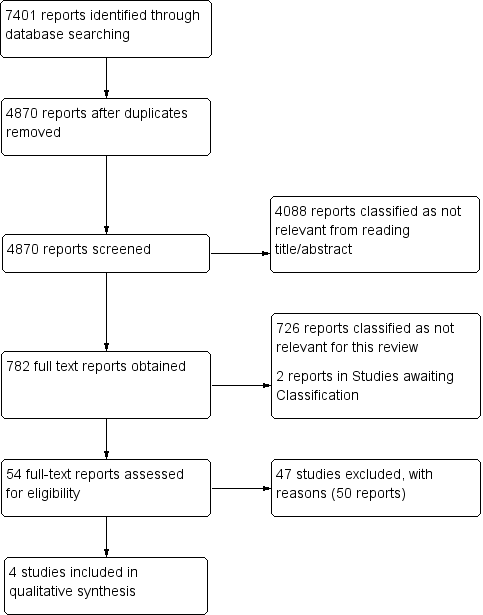
Study flow diagram (see table of Excluded studies for reasons for full‐text exclusions).

Risk of bias and applicability concerns graph: review authors' judgements about each domain presented as percentages across included studies.
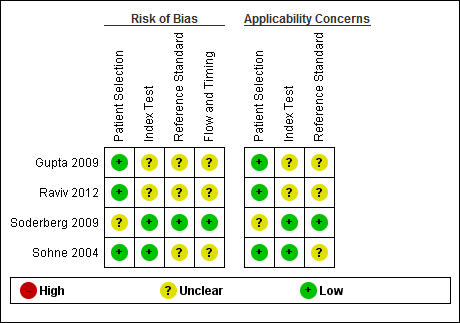
Risk of bias and applicability concerns summary: review authors' judgements about each domain for each included study.
| D‐dimer test for excluding the diagnosis of pulmonary embolism Population: people suspected of having a pulmonary embolism Index test: D‐dimer test Target condition: pulmonary embolism Reference standard: MRPA, pulmonary angiography, V/Q scintigraphy and CTPA Study design: cross‐sectional studies | |||||||
| Study ID | D‐dimer assay | Threshold | Mean age (SD or range) | CPR (cutoff) | Accuracy estimates | Numbers of patients | QUADAS‐2 risk of bias |
| Advanced D‐dimer™ Assay (Dade Behring, Inc, Deerfield, Illinois, USA) | ≥ 1.2 mg/L | 46.9 years (range 15 to 94) | Geneva low PTP: 0 to 3 | Low: sensitivity 100% (95% CI 61% to 100%) specificity 25% (95% CI 20% to 31%) TP = 6 FN = 0 TN = 69 FP = 206 | 281 (prevalence = 2%) 330 (prevalence = 5%) 16 (prevalence = 31%) | Low/Unclear risk of bias | |
| Geneva intermediate PTP: 4 to 10 | Intermediate: sensitivity 100% (95% CI 82% to 100%) specificity 33% (95% CI 28% to 38%) TP = 17 FN = 0 TN = 103 FP = 210 | ||||||
| Geneva high PTP: 11 or more points | High: sensitivity 80% (95% CI 38% to 96%) specificity 33% (95% CI 15% to 65%) TP = 4 FN = 1 TN = 4 FP = 7 | ||||||
| LIA test D‐di (Stago‐Diagnostica, Asnieres‐sur‐Seine, France) | Between 1000 mg/L and 800 mg/L | Females 54.38 ± 19.6 Males 53.7 ± 17.60 | Modified Wells low risk: ≤ 1 unlikely moderate risk: > 1 likely | At 900 mg/L sensitivity 94.4% specificity 49.1% In those younger than 40 years of age sensitivity 100% specificity 54.9% TP = unavailable FN = unavailable TN = unavailable FP = unavailable | 300 (prevalence not available) | Low/Unclear risk of bias | |
| Rapid latex agglutination assay (Tinaquant®, Roche, Basel, Switzerland) | < 0.5 mg/L | 57 years (range 27 to 80) | Wells score > 4.0 high‐risk | sensitivity 91% (95% CI 81% to 97%) specificity 63.0% (95% CI 52% to 73%) TP = 43 FN = 4 TN = 46 FP = 27 | 120 (prevalence = 39%) | Low/Unclear risk of bias | |
| Quantitative rapid immunoturbidimetric D‐dimer assay (Tinaquant D‐dimer® Roche Diagnostica, Mannheim, Germany) | < 0.5 mg/L | People with PE 62 years (range 14 to 95) People without PE 52 years (range 17 to 92) | Wells score ≤ 4 non‐high probability | < 65 years sensitivity 100% (95% CI 97% to 100%) specificity 50% (95% CI 45% to 55%) TP = 34 FN = 302 TN = 34 FP = 34 65 to 75 years sensitivity 100% (95% CI 85% to 100%) specificity 31 % (95% CI 20% to 44%) TP = 6 FN = 50 TN = 6 FP =12 > 75 years sensitivity 100% (95% CI 86% to 100%) specificity 23% (95% CI 12% to 38%) TP = 4 FN = 39 TN = 4 FP =15 | 404 (prevalence = 85%) 74 (prevalence = 76%) 62 (prevalence = 69%) | Low/Unclear risk of bias | |
| CI: confidence interval | |||||||
| CPR | Predictive elements and scoring system |
| Three‐level Wells score | Predictive elements of this CPR include clinical signs and symptoms of DVT (3 points), alternative diagnosis less likely than PE (3 points), heart rate > 100 beats per minute (1.5 points), immobilisation for longer than 3 days or recent (< 4 weeks) surgery (1.5 points), previous VTE (1.5 points), haemoptysis (1 point), cancer treatment in the previous 6 months or palliative care (1 point) Low probability ‐ less than 2; intermediate probability ‐ 2 to 6; high probability ‐ more than 6 |
| Two‐level Wells score | Predictive elements for the 2‐level Wells score are the same as for the 3‐level Wells score, but patients are categorised into 2 as opposed to 3 categories, PE likely or PE unlikely based on a score of more than 4 or 4 or fewer points, respectively |
| Simplified Wells score | Same predictive elements are used as for the 3‐level Wells score, but the point scoring has been simplified ‐ each item now scores 1 point. Patients are regarded as low risk if they have 1 point or less, and as high risk if they score more than 1 |
| Geneva score | Predictive elements of the Geneva score include recent surgery (3 points), previous history of PE or DVT (2 points), heart rate > 100 beats per minute (1 point), 60 to 79 years old (1 point), 80 years old or older (2 points), chest radiograph showing atelectasis (1 point), chest radiograph showing elevated hemidiaphragm (1 point), partial pressure of oxygen (PaO2) < 49 mm Hg (4 points), PaO2 49 to 59 mm Hg (3 points), PaO2 60 to 71 mm Hg (2 points), PaO2 72 to 82 mm Hg (1 point) and partial pressure of carbon dioxide (PaCO2) < 36 mm Hg (2 points), PaCO2 36 to 38.9 mm Hg (1 point) Risk of PE is scored low (0 to 4 points), intermediate (5 to 8 points) or high (9 or more points) |
| Revised Geneva score | Predictive elements of the revised Geneva score include age > 65 years (1 point), previous history of PE or DVT (3 points), surgery with general anaesthesia or fracture within 1 month of symptoms arising (2 points), active malignancy (2 points), heart rate 75 to 94 beats per minute (3 points), heart rate > 94 beats per minute (5 points), pain on leg venous palpation and unilateral oedema (4 points), haemoptysis (2 points) and unilateral leg pain (3 points) This CPR is scored low risk (0 to 3 points), intermediate risk (4 to 10 points) or high risk (11 or more points) |
| Simplified revised Geneva score | Same predictive elements are used as for the revised Geneva score, but point scoring has been simplified. Each item now scores 1 point Risk of PE is scored low (0 to 1 point), intermediate (2 to 4 points) or high (5 or more points) |
| Charlotte rule | Elements of the Charlotte rule include > 50 years old, heart rate higher than systolic blood pressure, unexplained hypoxaemia (O2 < 95%), recent surgery (previous 4 weeks), haemoptysis and unilateral leg swelling Risk score from the Charlotte rule is classified as safe (all predictive elements absent) or unsafe (any of the predictive elements present) |
| CPR: clinical prediction rule | |