Pharmacological interventions for drug‐using offenders
Información
- DOI:
- https://doi.org/10.1002/14651858.CD010862Copiar DOI

- Base de datos:
-
- Cochrane Database of Systematic Reviews
- Versión publicada:
-
- 19 diciembre 2013see what's new
- Tipo:
-
- Intervention
- Etapa:
-
- Review
- Grupo Editorial Cochrane:
-
Grupo Cochrane de Alcohol y drogas
- Copyright:
-
- Copyright © 2014 The Cochrane Collaboration. Published by John Wiley & Sons, Ltd.
Cifras del artículo
Altmetric:
Citado por:
Autores
Contributions of authors
Searches were constructed and conducted by JMG and SD. Three independent review authors inspected the search hits by reading the titles and abstracts (AEP, MN). Each potentially relevant study located in the search was obtained as a full article and was independently assessed for inclusion by two review authors. In the case of discordance, a third independent review author arbitrated. Where it was not possible to evaluate the study because of language problems or missing information, the studies were classified as 'translation/information required to determine decision' until a translation or further details were provided. Five review authors conducted data extraction for the papers (MM‐SJ, JMG,RMcC, SD and MN), and review author CG conducted data extraction and a narrative summary of the cost‐effectiveness studies. The results were compiled and organised by MM‐ST, MN, CH and AEP, and all eight authors contributed towards the final draft text.
Sources of support
Internal sources
-
Reviewer from Cochrane Drugs and Alcohol Group, Not specified.
A reviewer from the Drugs and Alcohol Group provided the researchers with the results of a search strategy for three databases
External sources
-
The Department of Health funded the original review, UK.
Declarations of interest
None
Acknowledgements
We would like to acknowledge the help of the York Health Economics Consortium and The Health Sciences Department at the University of York and the Cochrane Drugs and Alcohol Group.
Version history
| Published | Title | Stage | Authors | Version |
| 2015 Jun 02 | Pharmacological interventions for drug‐using offenders | Review | Amanda E Perry, Matthew Neilson, Marrissa Martyn‐St James, Julie M Glanville, Rebecca Woodhouse, Christine Godfrey, Catherine Hewitt | |
| 2013 Dec 19 | Pharmacological interventions for drug‐using offenders | Review | Amanda E Perry, Matthew Neilson, Marrissa Martyn‐St James, Julie M Glanville, Rachael McCool, Steven Duffy, Christine Godfrey, Catherine Hewitt | |
Keywords
MeSH
Medical Subject Headings (MeSH) Keywords
- *Criminals;
- Buprenorphine [therapeutic use];
- Crime [prevention & control];
- Heroin [therapeutic use];
- Methadone [therapeutic use];
- Naltrexone [analogs & derivatives, therapeutic use];
- Narcotics [therapeutic use];
- Opiate Substitution Treatment [methods];
- Randomized Controlled Trials as Topic;
- Substance‐Related Disorders [*drug therapy];
Medical Subject Headings Check Words
Adult; Female; Humans; Male;
PICO

Study flow diagram of papers within the review.
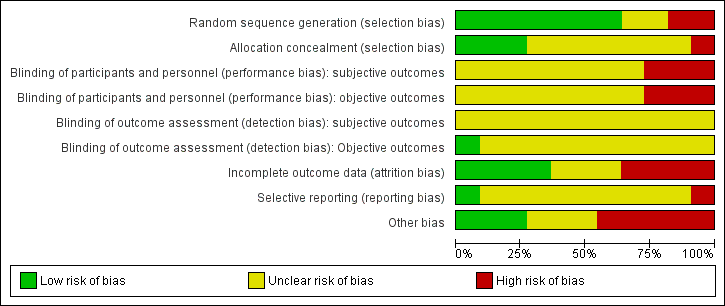
Risk of bias graph: review authors' judgements about each risk of bias item presented as percentages across all included studies.

Risk of bias summary: review authors' judgements about each risk of bias item for each included study.
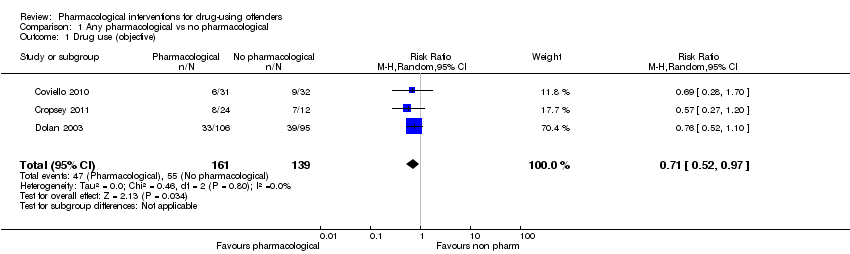
Comparison 1 Any pharmacological vs no pharmacological, Outcome 1 Drug use (objective).

Comparison 1 Any pharmacological vs no pharmacological, Outcome 2 Drug use community setting.
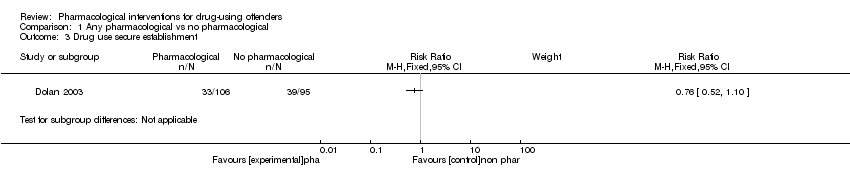
Comparison 1 Any pharmacological vs no pharmacological, Outcome 3 Drug use secure establishment.
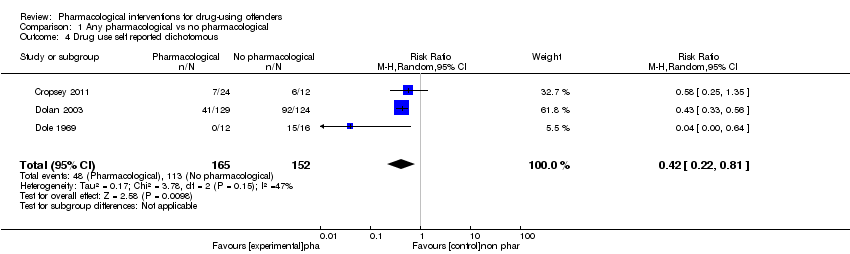
Comparison 1 Any pharmacological vs no pharmacological, Outcome 4 Drug use self reported dichotomous.
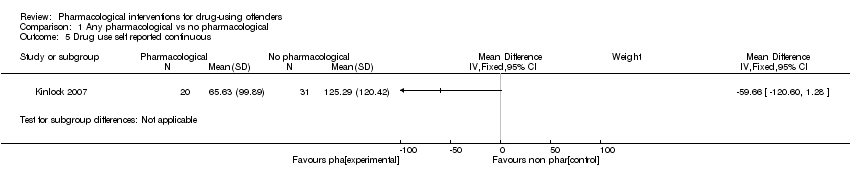
Comparison 1 Any pharmacological vs no pharmacological, Outcome 5 Drug use self reported continuous.
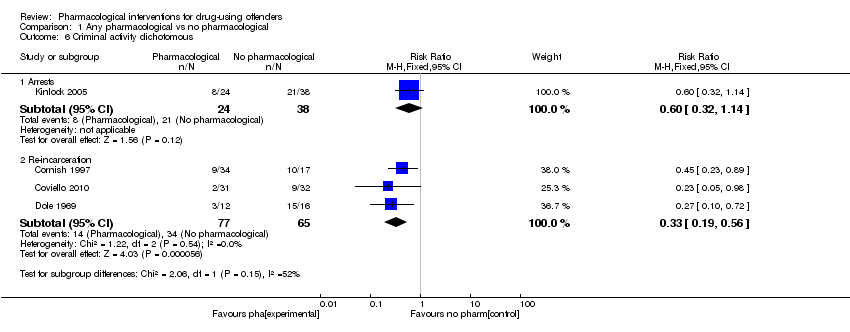
Comparison 1 Any pharmacological vs no pharmacological, Outcome 6 Criminal activity dichotomous.

Comparison 1 Any pharmacological vs no pharmacological, Outcome 7 Criminal activity continuous.

Comparison 2 Buprenorphine vs no pharmacological, Outcome 1 Self report drug use dichotomous.

Comparison 3 Methadone vs no pharmacological, Outcome 1 Self‐report drug use dichotomous.
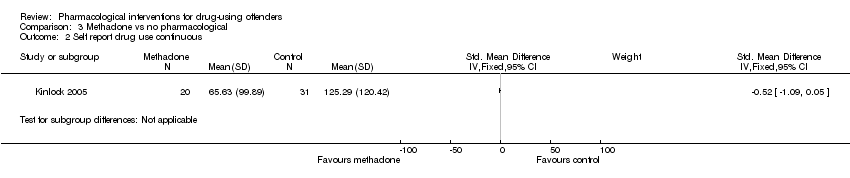
Comparison 3 Methadone vs no pharmacological, Outcome 2 Self report drug use continuous.
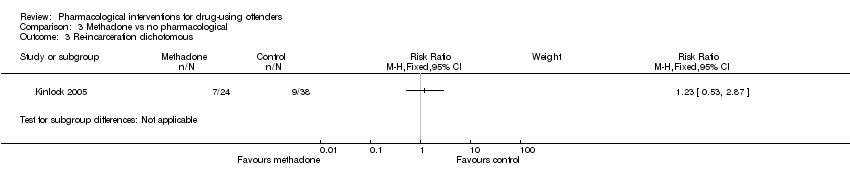
Comparison 3 Methadone vs no pharmacological, Outcome 3 Re‐incarceration dichotomous.
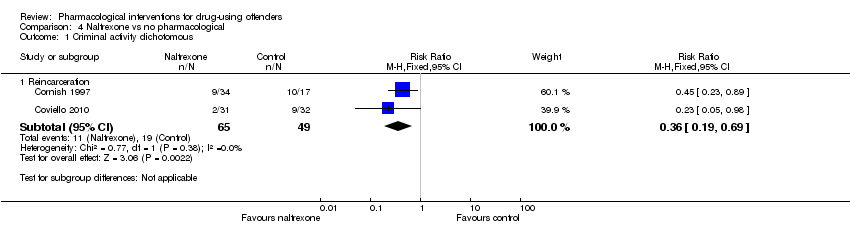
Comparison 4 Naltrexone vs no pharmacological, Outcome 1 Criminal activity dichotomous.

Comparison 5 Methadone vs buprenorphine, Outcome 1 Self reported drug use dichotomous.
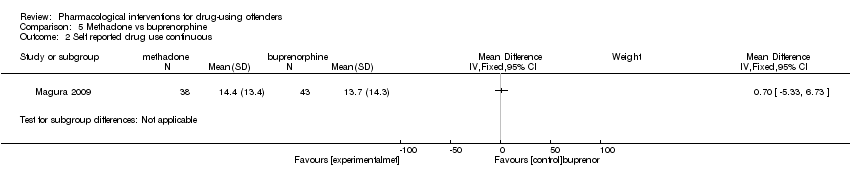
Comparison 5 Methadone vs buprenorphine, Outcome 2 Self reported drug use continuous.

Comparison 5 Methadone vs buprenorphine, Outcome 3 Criminal activity dichotomous.

Comparison 6 Methadone vs diamorphine, Outcome 1 criminal activity dichotomous.

Comparison 7 Methadone vs naltrexone, Outcome 1 self reported drug use continuous.

Comparison 7 Methadone vs naltrexone, Outcome 2 criminal activity dichotomous.

Comparison 7 Methadone vs naltrexone, Outcome 3 criminal activity continuous.
| Study | Setting | Intervention | Comparison group | Follow‐up period | Outcome type | Outcome description |
| Prison | Methadone treatment in combination with CBT and widely focused on coping and problem‐solving skills. | Non‐methadone drugs plus standard psychiatric services and therapeutic medications | 6 months | Biological drug use Self‐report drug use | Drug use yes/no Frequency of drug injections (percentage) Syringe sharing Morphine urine analysis | |
| Community | Naltrexone | Routine parole/probation | 6 months and during 6 months of treatment | Criminal activity dichotomous | % re‐incarcerated during 6 months of follow‐up | |
| Community | Naltrexone | Psychosocial treatment only | 6 months | Biological drug use dichotomous Criminal activity dichotomous | % positive urine drug screen opioids % positive urine drug screen cocaine % violating parole/probation | |
| Community | Buprenorphine | Placebo | End of treatment 3 months | Biological drug use dichotomous Self‐report drug use dichotomous | % positive urine opiates % self‐report injection drug use | |
| Prison | Pharmacological (methadone) | Waiting list control | 4 months 2 months 3 months | Biological drug use continuous Biological drug use dichotomous Self‐report drug use dichotomous | % hair positive for morphine % self‐reported any injection % self‐reported heroin injection | |
| Prison | Methadone | Waiting list control. | At between 7 and 10 months At 50 weeks | Biological drug use continuous Biological drug use dichotomous Self‐report drug use dichotomous | Heroin use Re‐incarceration Treatment retention Employment | |
|
| Prison | Counselling + methadone initiation pre‐release(a) and post‐release (b) | Counselling only | 1 month 3 months 6 months 12 months | Biological drug use dichotomous Self‐report drug use dichotomous Criminal activity dichotomous | % positive for urine opioids % positive for urine cocaine % self‐reported 1 or more days heroin n used heroin for entire 180‐day follow‐up period Re‐incarcerated Self‐reported criminal activity |
| Prison | Prison based levo alpha acetyl methanol and transfer to methadone after release | untreated controls | During 9 months | Biological drug use dichotomous Self‐report drug use dichotomous Criminal activity dichotomous | Heroin use Arrest Re incarceration Frequency of illegal activity Admission drug use Average weekly income | |
| Prison | Naltrexone | Methadone | 6 months | Criminal activity continuous Criminal activity dichotomous Self‐report drug use continuous | Mean days of criminal activity % re‐incarcerated Mean days of heroin use Mean days of benzodiazepine use Mean days of amphetamine use | |
| Community | Pharmacological (diamorphine) | Methadone | 12 months | Criminal activity dichotomous | % self‐reported criminal activity % police‐recorded offences | |
| Prison | Buprenorphine | Methadone | 3 months | Criminal activity dichotomous Self‐report drug use continuous Self‐report drug use dichotomous | % re‐incarcerated % arrested for property crime % arrested for drug possession Mean days of heroin use % any heroin/opioid use |
| Outcome or subgroup title | No. of studies | No. of participants | Statistical method | Effect size |
| 1 Drug use (objective) Show forest plot | 3 | 300 | Risk Ratio (M‐H, Random, 95% CI) | 0.71 [0.52, 0.97] |
| 2 Drug use community setting Show forest plot | 2 | 99 | Risk Ratio (M‐H, Random, 95% CI) | 0.62 [0.35, 1.09] |
| 3 Drug use secure establishment Show forest plot | 1 | Risk Ratio (M‐H, Fixed, 95% CI) | Subtotals only | |
| 4 Drug use self reported dichotomous Show forest plot | 3 | 317 | Risk Ratio (M‐H, Random, 95% CI) | 0.42 [0.22, 0.81] |
| 5 Drug use self reported continuous Show forest plot | 1 | Mean Difference (IV, Fixed, 95% CI) | Subtotals only | |
| 6 Criminal activity dichotomous Show forest plot | 4 | Risk Ratio (M‐H, Fixed, 95% CI) | Subtotals only | |
| 6.1 Arrests | 1 | 62 | Risk Ratio (M‐H, Fixed, 95% CI) | 0.60 [0.32, 1.14] |
| 6.2 Re‐incarceration | 3 | 142 | Risk Ratio (M‐H, Fixed, 95% CI) | 0.33 [0.19, 0.56] |
| 7 Criminal activity continuous Show forest plot | 1 | Mean Difference (IV, Fixed, 95% CI) | Subtotals only | |
| Outcome or subgroup title | No. of studies | No. of participants | Statistical method | Effect size |
| 1 Self report drug use dichotomous Show forest plot | 1 | Risk Ratio (M‐H, Fixed, 95% CI) | Subtotals only | |
| Outcome or subgroup title | No. of studies | No. of participants | Statistical method | Effect size |
| 1 Self‐report drug use dichotomous Show forest plot | 1 | Risk Ratio (M‐H, Fixed, 95% CI) | Subtotals only | |
| 2 Self report drug use continuous Show forest plot | 1 | Std. Mean Difference (IV, Fixed, 95% CI) | Subtotals only | |
| 3 Re‐incarceration dichotomous Show forest plot | 1 | Risk Ratio (M‐H, Fixed, 95% CI) | Subtotals only | |
| Outcome or subgroup title | No. of studies | No. of participants | Statistical method | Effect size |
| 1 Criminal activity dichotomous Show forest plot | 2 | Risk Ratio (M‐H, Fixed, 95% CI) | Subtotals only | |
| 1.1 Reincarceration | 2 | 114 | Risk Ratio (M‐H, Fixed, 95% CI) | 0.36 [0.19, 0.69] |
| Outcome or subgroup title | No. of studies | No. of participants | Statistical method | Effect size |
| 1 Self reported drug use dichotomous Show forest plot | 1 | Risk Ratio (M‐H, Fixed, 95% CI) | Subtotals only | |
| 2 Self reported drug use continuous Show forest plot | 1 | Mean Difference (IV, Fixed, 95% CI) | Subtotals only | |
| 3 Criminal activity dichotomous Show forest plot | 1 | Risk Ratio (M‐H, Fixed, 95% CI) | Subtotals only | |
| 3.1 re incarceration | 1 | 116 | Risk Ratio (M‐H, Fixed, 95% CI) | 1.25 [0.83, 1.88] |
| Outcome or subgroup title | No. of studies | No. of participants | Statistical method | Effect size |
| 1 criminal activity dichotomous Show forest plot | 1 | Risk Ratio (M‐H, Fixed, 95% CI) | Subtotals only | |
| 1.1 arrest | 1 | 825 | Risk Ratio (M‐H, Fixed, 95% CI) | 1.25 [1.03, 1.51] |
| Outcome or subgroup title | No. of studies | No. of participants | Statistical method | Effect size |
| 1 self reported drug use continuous Show forest plot | 1 | Mean Difference (IV, Fixed, 95% CI) | Subtotals only | |
| 2 criminal activity dichotomous Show forest plot | 1 | Risk Ratio (M‐H, Fixed, 95% CI) | Subtotals only | |
| 2.1 re incarceration | 1 | 44 | Risk Ratio (M‐H, Fixed, 95% CI) | 1.10 [0.37, 3.26] |
| 3 criminal activity continuous Show forest plot | 1 | Mean Difference (IV, Fixed, 95% CI) | Subtotals only | |